DESIGN OF MICRO HYDRO POWER SYSTEM ON TEMIE RIVER
111
DESIGN OF MICRO HYDRO POWER SYSTEM ON TEMIE RIVER BY: DAWIT TESSEMA BAHIR DAR UNIVERSITY SCHOOL OF GRAGUATE STUDIES SUSTAINABLE ENERGY ENGINEERING GSJ: Volume 7, Issue 3, March 2019 ISSN 2320-9186 1095 GSJ© 2019 www.globalscientificjournal.com
Transcript of DESIGN OF MICRO HYDRO POWER SYSTEM ON TEMIE RIVER

DESIGN OF MICRO HYDRO POWER SYSTEM
ON
TEMIE RIVER
BY:
DAWIT TESSEMA
BAHIR DAR UNIVERSITY
SCHOOL OF GRAGUATE STUDIES
SUSTAINABLE ENERGY ENGINEERING
GSJ: Volume 7, Issue 3, March 2019 ISSN 2320-9186
1095
GSJ© 2019 www.globalscientificjournal.com

GSJ: Volume 7, Issue 3, March 2019 ISSN 2320-9186
1096
GSJ© 2019 www.globalscientificjournal.com

GSJ: Volume 7, Issue 3, March 2019 ISSN 2320-9186
1097
GSJ© 2019 www.globalscientificjournal.com
Bahir Dar University
School Of Graduate Studies
Sustainable Energy Engineering
Design of Micro Hydro Power System on TemieRiver
By:
Dawit Tessema
Approval by the Board of Examiners
-------------------------------- -------------------------------- -----------------------
Chair, dep’t Graduate committee Date Signature
--------------------------------- --------------------------------- ------------------------
Advisor Date Signature
--------------------------------- --------------------------------- ------------------------
Examiner, internal Date Signature
------------------------------- --------------------------------- ------------------------
Examiner, external Date Signature
GSJ: Volume 7, Issue 3, March 2019 ISSN 2320-9186
1098
GSJ© 2019 www.globalscientificjournal.com

Dawit Tessema Ebissa
Ethiopian institute of textile and fashion technology, Bahir Dar University, Bahir Dar city,
Ethiopia, email: [email protected]
ABSTRACT
Hydropower on a small scale is one of the most cost-effective energy technologies to be consideredfor rural electrification in Ethiopia. It is also the main prospect for future hydro developments.Where the large-scale opportunities either have been exploited already or would now beconsidered environmentally unacceptable. Whereas large hydro schemes often involve theconstruction of major dams and the flooding of whole valleys, micro hydro is one of the mostenvironmentally benign energy technologies available.The technology is extremely robust and systems to enhance the economic welfare of people in therural areas, it is necessary to increase agricultural productivity and promote the development ofrural enterprises. Both these approaches depend highly on the accessibility of commercial sourcesof energy. The promotion of micro hydropower system is expected to positively impact socialwelfare through improvements in health and education.In terms of economic welfare, energy from micro hydropower system is expected to be beneficialfor both producers and consumers in rural economies via the opportunities to create links betweenthem and the national economy. However, the establishment of these plants requires initial as wellas running costs and proper system as well as part design.In Ethiopia, amhara region there are around thirty three suitable and deliberated areas for microhydropower. From these, Temie River is one of the sites that have 1029 population who dwellaround it without electric power access.Currently the population that dwell around the site (Temie river) have used kerosene for lighting,diesel for pumps and grain mills, dry cell for radio for all with an idolized expense of1218233ETB per year and also these current energy resources have their own negative impact onthe environment.So here on the thesis, system of micro hydropower plant on Temie River is design to replace thesecurrent energy resources of the community and to afford additional infrastructure for the better lifestyle of the society like: - Television, Mobile charger, and libratory equipment for the health centre.At the end of the work the total expense of the society for energy is reduced by 18.91%,environmental pollution is decrease and improved the life style of the society as they get additionalservices.
Key words: - Micro hydro power design, Kerosene for lighting, economic welfare, Rural
electrification in Ethiopia, Temie river, impact on the environment, lifestyle of the society.
i
GSJ: Volume 7, Issue 3, March 2019 ISSN 2320-9186
1099
GSJ© 2019 www.globalscientificjournal.com

ACKNOWLEDGMENT
Above all, I would like thanks to the almighty God who keep me throughout my life, not only on
this thesis work. Next, I would like to express my sincere gratitude to my advisors, Dr. Nigussie
Mulugeta for his valuable guidance. Finally, I would like to articulate my great thanks to my Co
Advisor Mr. Adamu Mengesha for his advice and comments throughout my thesis work.
ii
GSJ: Volume 7, Issue 3, March 2019 ISSN 2320-9186
1100
GSJ© 2019 www.globalscientificjournal.com

TABLE OF CONTENTS
ABSTRACT........................................................................................................................................i
ACKNOWLEDGMENT....................................................................................................................ii
LIST OF TABLE...............................................................................................................................vi
LIST OF FIGURES..........................................................................................................................vii
NOMENCLATURE..........................................................................................................................ix
CHAPTER ONE.................................................................................................................................1
INTRODUCTION..............................................................................................................................1
1.1. Background..............................................................................................................................1
1.2. Statement of the Problem..............................................................................................................................3
1.3. Objectives.................................................................................................................................4
1.4. Scope and Limitation of the Study...........................................................................................4
1.5. Organization of the Thesis.......................................................................................................5
CHAPTER TWO................................................................................................................................6
LITERATURE REVIEW...................................................................................................................6
2.1. World Electric Power Sources and Their Potential..................................................................6
Advantages of Hydropower............................................................................................................7
World largest hydropower plants....................................................................................................8
2.2. Electrification in Ethiopia........................................................................................................9
2.3. Micro Hydropower.................................................................................................................13
2.3.1. Micro hydro power potential of Ethiopia.........................................................................13
2.4. Previous Works.......................................................................................................................15
2.4.1. SNNPR micro hydro power.............................................................................................15
2.4.2. Tungu Kabri micro hydropower.......................................................................................17
2.4.3. Master plan of mini/micro hydropower to replace diesel power plants...........................18
iii
GSJ: Volume 7, Issue 3, March 2019 ISSN 2320-9186
1101
GSJ© 2019 www.globalscientificjournal.com

CHAPTER THREE..........................................................................................................................20
BASIC COMPONENTS OF MICRO HYDROPOWER.................................................................20
3.1 Civil Components....................................................................................................................21
3.2. Mechanical components.........................................................................................................24
3.3. Electrical components............................................................................................................28
CHAPTER FOUR............................................................................................................................30
SITE DESCRIPTION, DATA COLLECTION AND LOAD CALCULATION..............................30
4.1. Site Description......................................................................................................................30
4.2. Data collection........................................................................................................................32
4.2.1. Determination of discharge rate.......................................................................................32
4.2.2. Determination of head......................................................................................................38
4.3. Load Calculation....................................................................................................................41
4.3.1. Primary Load...................................................................................................................41
4.3.2. Deferrable Load...............................................................................................................41
Peak Load......................................................................................................................................45
Load Factor................................................................................................................................45
CHAPTER FIVE..............................................................................................................................47
MICRO HYDRO POWER SYSTEM DESIGN ANALYSIS..........................................................47
5.1. Introduction............................................................................................................................47
CHAPTER SIX.................................................................................................................................68
ECONOMIC ANALYSIS OF MICRO HYDRO POWER..............................................................68
CHAPTER SEVEN..........................................................................................................................74
RESULT AND DISCUSSION.........................................................................................................74
CHAPTER EIGHT...........................................................................................................................76
CONCLUSION AND RECOMMENDATION................................................................................76
iv
GSJ: Volume 7, Issue 3, March 2019 ISSN 2320-9186
1102
GSJ© 2019 www.globalscientificjournal.com

Reference.......................................................................................................................................78
APPENDIXES..................................................................................................................................80
v
GSJ: Volume 7, Issue 3, March 2019 ISSN 2320-9186
1103
GSJ© 2019 www.globalscientificjournal.com
LIST OF TABLE
Table 1.1: Current Cost Breaks Down and Total Consumption per Year. 4
Table 2.1 Source of Electricity 7
Table 2.2 the Exploited Largest Hydropower Plants On Earth 9
Table 2.3 Different Energy Resources in Ethiopia 10
Table 2.4 Hydropower Potential of Ethiopia 12
Table 2.5 Installed Hydropower Potential of Ethiopia 12
Table 2.6 Micro Hydro Power Potential of Ethiopia by Region 15
Table 3.1: Classification of Hydraulic Turbine 25
Table 4.1 Comparison between Compact Fluorescent and Incandescent Lamps 44
Table 4.2 Typical Wattage Requirements for Electric Appliance 44
Table 4.3 Household Energy Demand Sizeo of Dombit Village 45
Table 4.4 Monastery and Dombit Institution Daily Energy Demand 45
Table 4.5 Load Factor of Different Energy Technology, Source 47
Table 5.1 Friction Loss Correction Factor 58
Table 6.1 Turbine Cost Analysis Using Package Soft Ware 71
Table 6.2. Electro Mechanical and investment Cost Analysis Using Package Soft Ware 71
Table 6.3 Breakdown Capital Costs of Temie River Micro Hydro Power 72
Table 7.1 Specific Speed of Various Turbines 73
vi
GSJ: Volume 7, Issue 3, March 2019 ISSN 2320-9186
1104
GSJ© 2019 www.globalscientificjournal.com

LIST OF FIGURES
Figure 3.1: micro hydro power system components 21
Figure 3. 2: Turgo Style Wheel 26
Figure 3. 3: Pelton Turbine Style Wheel 26
Figure 3. 4: Cross-Flow Turbines Style Wheel 27
Figure 3.6: Francis Turbine Style Wheel 27
Figure 3.7: Propeller Turbine Style Wheel 28
Figure 4.1: Picture of the Site (Temie River, Dombit, and Saint Marry Monastery) 31
Figure 4.2: Lay Out of the Site (Temie River, Dombit, and Saint Marry Monastery) 32
Figure 4.3: Picture of Temie River 33
Figure 4.4: Discharge Measurement by Bucket Method 34
Figure 4.5: Discharge Measurement by Float Method 35
Figure 4.6: Discharge Measurement by Current Meters 36
Figure 4.7: Discharge Measurement by Measuring Weirs 37
Figure 4.8: Salt Gulp' Flow Measurement 38
Figure 4.9: Head Lay Out 39
Figure 4.10: Surveyor’s Transit or Levels and a Pole Head Measurement 40
Figure 4.11: Measure Hydro Head with a Pressure Gauge & Hose 40
Figure 4.12: Head Measurement by Using a Zip Level Pro 2000™ 41
Figure 5.1: Rectangular Channel 51
vii
GSJ: Volume 7, Issue 3, March 2019 ISSN 2320-9186
1105
GSJ© 2019 www.globalscientificjournal.com
Figure 5.5: Alignment of Penstock 52
Figure 5.7: Penstock Diameter Selection Graphs 54
Figure 5.1: Efficiency of Various Turbines Based On Discharge Rate 60
Figure5.2: Turbine Selection Based On Head and Discharge 61
Figure 5.3: Schematic of an Impulse Turbine 62
Figure 5.4: Velocity Diagram of an Impulse Turbine 62
Figure 6.1: Cost Break Down Micro Scale Hydro Power. 72
Figure 7.1: Bucket Velocity versus Power Graph 74
viii
GSJ: Volume 7, Issue 3, March 2019 ISSN 2320-9186
1106
GSJ© 2019 www.globalscientificjournal.com

NOMENCLATURE
EEPCO the Ethiopian Electric Power Corporation
ICS Inter-connected system
SCS Self Contained System
TPES total primary energy source
Ktoe kilo ton of oil equivalent
SNNPR Southern Nations, Nationalities and Peoples’ Regional State
EMF electromotive force
AC alternating current
PVC Polyvinyl chloride
LED light emitting diode
FRE fiber reinforced epoxy
Pd penstock design pressure
La adjusted length
Fc Friction Loss Correction Factor
PPA power purchase agreements
NPV Net Present Value
MHP micro hydro power
KM kilo meter
USD United States dollar
ix
GSJ: Volume 7, Issue 3, March 2019 ISSN 2320-9186
1107
GSJ© 2019 www.globalscientificjournal.com

MW
PV
TWH
KW
GWH
Psi
ETB
NGO
rpm
PHP
TPES
GTZ
TJ
ANRS
O & M
mega watt
photo voltaic
terra watt hour
kilo watt
giga watt hour
pound per square inch
Ethiopian Birr
Non Governmental Organization
revolution per minute
Pico hydro power
total primary energy source
Gesellschaft für Technische Zusammenarbeit
Terra Joule (1012)
Amhara National and Regional State
Operational and maintenance cost.
x
GSJ: Volume 7, Issue 3, March 2019 ISSN 2320-9186
1108
GSJ© 2019 www.globalscientificjournal.com

CHAPTER ONE
INTRODUCTION
1.1. Background
Rapidly expanding global population and fast-paced economic growth, particularly in developing
countries, are expected to propel demand for all forms of energy including electricity. To address
the growing energy demand, countries are exploring a wide array of energy resources, including
hydropower.
Hydropower is the most developed and widely utilized source of renewable energy. It is not only
renewable but is also considered an economically viable alternative to electricity generated from
fossil fuels. Due to clean and renewable nature of hydro energy, few countries across the world use
it as the primary source of power supply. Several countries are offering financial support and
adopting policies for promoting the hydropower sector. In particular, the focus is on development
of environment friendly small-scale hydropower projects, which are considered ideal for rural
electrification programs. However, the development of hydropower projects faces obstacles due to
environmental concerns, and issues such as large-scale population displacement, and ecological
damage.
Many rural communities in developing countries suffer the same symptoms; a never-ending cycle
of poverty and lack of basic necessities. For many decades large aid organizations have focused on
emergency relief without assessing the causes. It is the researcher belief that rural infrastructure
development is a solution to these underpinning problems, and that, with the development of roads,
safe water supplies and electricity. Communities can overcome the barriers to living long, safe and
healthy lives.
The Ethiopian Electric Power Corporation (EEPCO), the sole electric power producer in the
country, currently generates 2000MW where it comes from two different power supply systems,
namely, the Inter-connected system (ICS) and Self Contained System (SCS). ICS is mainly
supplied from hydro-power plants as well as geothermal power plant. Whereas, SCS consist of
1
GSJ: Volume 7, Issue 3, March 2019 ISSN 2320-9186
1109
GSJ© 2019 www.globalscientificjournal.com

mini hydro-power plants and a number of isolated diesel generating units widely spread all over
the country. The country is toiling to maximize its power generation capacity with the expectation
of reaching 8000 to 10000MW in the coming five year up on the completion of the started
hydropower plants [10].
Considering the stated figure for the country which has population of over 73.9 million people one
can evidently see that the power provision in the country is at its scanty stage. In addition, since
most areas of the country are not connected to the national electric grid, and as the power to the
grid is insufficient, thus, rural areas are rely on kerosene and traditional fuel wood biomass to meet
their energy demand, both for cooking and lighting. This unsustainable use of energy has for long
been damaging to the environment and the human life. Therefore these negative effects of fossil
fuels on the local and global environment oblige to search for other alternatives.
In Ethiopia there is a vast energy resource potential, which, if employed, could reduce the present
energy crisis prevailing in the country and increase the process of rural electrification. From these
renewable energies, Hydropower is the most abundant.
Hydropower plants are plants used to generate electric power by capturing the energy released by
water falling through a vertical distance, and transform this energy into useful electricity. In
general, falling water is channelled through a turbine which converts the water's energy into
mechanical power. The rotation of the water turbines is transferred to a generator which produces
electricity. However, the technically exploitable potential of hydropower is reduced by
environmental, economical and geological factors. Facilities range in size from large power plants
that supply many consumers with electricity to small and micro plants that individuals operate for
their own energy needs or to sell power to utilities.
2
GSJ: Volume 7, Issue 3, March 2019 ISSN 2320-9186
1110
GSJ© 2019 www.globalscientificjournal.com

1.2. Statement of the Problem
In Ethiopia, particularly in amhara region there are around thirty three suitable and deliberated
areas for micro hydropower [9], but still now no one is go ahead for implementation. From these,
Temie river is one of the site that have 1029 population who dwell around it far from the central
grid connection without any electric power access. And the population have costed idolized
expense for power that is over the economy of the society, See the table 1.1. The cost of these
current means of power source is registered from the site.
Table 1.1: Current Cost Breaks Down and Total Consumption per Year.
Type of FuelConsumption
Unit Price(ETB)Total cost
Remarksper year (ETB) per year
For lighting. the
Kerosene 5654.8 litter 20.94 118,411.9 cost registered on
August 16, 2011
For milling and
Diesel 16897.1 litter 13.47 227,603.66pumps. the cost
registered on
August 16, 2011
For radio. the
Dry Cell 218055 4 872,217.00 cost registered on
August 16, 2011
Total 1,218,233.00
As see from the above table 1.1 these people currently outlay 1218233ETB per year for power case
and these power sources have great impact on the environment as well as on the health of the
society and also by these power source they can’t undergo their health centre treatment efficiently
and they are limited to utilize TV, fridge, and like for better life style in general they can’t satisfy
their needs with these current energy resources..
3
GSJ: Volume 7, Issue 3, March 2019 ISSN 2320-9186
1111
GSJ© 2019 www.globalscientificjournal.com

1.3. Objectives
The general objective of this thesis is design of micro hydropower system for rural electrification
on Temie River.
The specific objectives are:
Design and sizing of parts of micro hydropower
Calculate the total load demand of the selected site area population.
Address economic analysis of the whole system.
Put side by side micro hydro power total expense throughout the life span to the current
energy source of the site.
1.4. Scope and Limitation of the Study
The site selected for this work is located far from the national electric grid so that the electric
source that is going to be designed should be a standalone system. In order to achieve this need
there are different alternatives configurations, such as;
Hydro hybrid system with other renewable or non renewable source especially with PV
system or wind power.
Hydro with battery storage system,
Hydro without any storage or backup source by increasing the load factor and by designing
the system for the peak load of the site demand.
Hydro hybrid with others sources such as PV, Wind, diesel and the like needs a series of analysis to
determine the possible combination of each sources for a given demand, in addition to reduce the
scope of the work, the thesis exclude this alternatives from comparison, only design stand alone
micro hydropower system, this can be taken as the limitation of this work. And the other limitation
is the design mainly focused on the turbine and penstock parts; this is due to lack of time and
allocated fund. And finally the thesis is limited in its scope on the design of micro hydro power for
rural electrification.
4
GSJ: Volume 7, Issue 3, March 2019 ISSN 2320-9186
1112
GSJ© 2019 www.globalscientificjournal.com

1.5. Organization of the Thesis
Chapter one describes general introduction and motivation as well as statement of the problem of
the thesis. Chapter two reviews literatures about SNNPR and Tungu Kabri micro hydro power
plant and Master plan of mini/micro hydropower to replace diesel power plants. Chapter three
presents the basic components of micro hydropower. In Chapter four, the criteria used in selecting
a suitable site is describe and some elaboration about the site and the total load is calculated.
Chapter five presents system design analysis of micro hydro power plant. Chapter six presents the
installation and further economic analysis of the micro hydropower model. Chapter seven describe
about result and discussion on the work done on the above chapter. Finally chapter eight is
elaborate conclusion and recommendation of the thesis.
5
GSJ: Volume 7, Issue 3, March 2019 ISSN 2320-9186
1113
GSJ© 2019 www.globalscientificjournal.com

CHAPTER TWO
LITERATURE REVIEW
2.1. World Electric Power Sources and Their Potential
The Production of electricity in the world in year 2008 was 20,261TWh which was 11% of solar
energy the earth receive in one hour (174,000TWh). Sources of Electricity were Fossil Fuel 67%,
Renewable Energy 18% and Nuclear Power 13%. Majority of Fossil Fuel usage for the generation
of electricity were of Coal and Gas, Oil was only 5.5%. 92% of renewable energy was from
Hydroelectric followed by Wind 6% and Geothermal 1.8%. Solar Photovoltaic was 0.06%, Solar
Thermal was 0.004% [22].
Table 2.1: Source of Electricity [22]
Coal OilNatural
Nuclear Hydro other TotalGas
Electricity8,263 1,111 4,301 2,731 3,288 568 20,261
(TWh/year)
proportion 41% 5% 21% 13% 16% 3% 100%
Total Energy consumed at all power plants for the generation of electricity was 4,398,768 ktoe
(kilo ton of oil equivalent) which was 36% of total primary energy source(TPES) of year 2008.
Electricity Output (gross) was 1,735,579 ktoe (20,185TW h ), efficiency was 39%, balance of
61% was heat generated. Small part(145,141 ktoe, which was 3% of input total) of heat was
utilized at co-generation heat and power plants. There were in-house consumption of electricity
and power transmission loss of 289,681 ktoe. Supply to the final consumer was 1,445,285 ktoe
(16,430 TWh) which was 33% of total energy consumed at power plants and heat and power co-
generation (CHP) plants [22]. As see from table 1.1, next to coal and natural gas world populations
are getting their electric power from hydropower.
6
GSJ: Volume 7, Issue 3, March 2019 ISSN 2320-9186
1114
GSJ© 2019 www.globalscientificjournal.com
Hydro power
Close to a quarter of the energy of the sun that reaches the earth’s surface causes water to
evaporate and hence a proportion of this energy causes vapor to rise against the earth’s
gravitational pull. This vapor then condenses into rain and snow, which again falls back to the
earth’s surface. This is called the water cycle and is the fundamental reason why hydropower is
possible. When rain and snow fall onto any ground above sea level some of the sun’s energy is
conserved in the form of potential energy. This energy is then dissipated in currents as water runs
down in streams. By catching this water in the controlled form of pipes, we can exploit the kinetic
energy that becomes available with the movement of water. These pipes are then used to direct the
stream of water, under pressure, onto a turbine blade. The water then strikes the turbine blade to
create mechanical energy. This mechanical energy is then transmitted to an electrical generator
through a rotating shaft. This simple process is essentially how all hydropower is generated – a
process tried and tested over hundreds of years which currently supplies over 715,000 MW or 19%
of the world’s total electricity. [20]
Hydropower is actually generated quite simply, if there is a kinetic energy of the water. Because
water is 500 times as dense as air. Even a slow stream will generate power as a result. When the
water moves through a dame, or a confined space, it begins to rush faster as a result of more water
going through a smaller space. When it does this, it turns turbines that then help to power a
generator. The generator then sends power into batteries and converters in order to send power out
or store it.
Advantages of Hydropower
Unlike fossil fuels, where oil, coal and natural gas have to be taken out of the ground, water
is all around us and whether we use it or not, it is moving by and creating energy. Hence,
there is no cost of fuel with hydropower.
As well, fossil-fuel fired plants require a lot of service and only last about 50 years.
However, hydropower plants that were built 100 years ago are still in generation, making
them much more cost effective. Dams and other hydropower plants also use less people on
site, thereby lowering costs even more.
7
GSJ: Volume 7, Issue 3, March 2019 ISSN 2320-9186
1115
GSJ© 2019 www.globalscientificjournal.com

As has been mentioned, hydroelectric plants and dams do not burn fossil fuels and
therefore do not contribute to greenhouse gases and climate change. The only greenhouse
gases that are produced by the plant and dam are those that are emitted during its
construction, which are easily offset within a few months of the dam or plant’s use.
World largest hydropower plants
In terms of the generation of hydroelectric power, those countries with many rivers generally lead
the way in power generation. China is the number one producer of hydropower in the world with
563 terawatt hours. While the Brazil, Canada and the United States come in second, third and
fourth respectively. Of those countries, Brazil and Canada use hydropower to handle 85 and 61
percent of their power needs. Hydropower takes care of 17 and five percent of the power needs of
China and the United States respectively. Norway on the other hand produces 135 terawatt hours
of hydropower that is 99 percent of its energy needs [21].
Table2.2: The Exploited Largest Hydropower Plants on Earth [21]
No. Name of Dam CountryYear of Total
completion Capacity(MW)
1 Three Gorges Dam China 2009 22,500
2 Itaipu Brazil/Paraguay 1984,1991,2003 14,000
3 Gun(Simon Bolvar) Venezuela 1986 10,200
4 Tucumu Brazil 1984 8,370
5 Sayano shushenskaya Russia 1985,1989 6,400
6 Krasno yarskaya Russia 1972 6,000
7 Grand coulee United states 1942,1980 6,809
8 Robert-Bourassa Quebec, Canada 1981 5,616
9 Churchill falls Canada 1971 5,429
10 Longtan Dam China 2009 6,300
As the world’s energy consumption explodes, no one can argue that there is a growing need to find
an alternative to fossil fuels. The need for renewable, environmentally friendly power sources
8
GSJ: Volume 7, Issue 3, March 2019 ISSN 2320-9186
1116
GSJ© 2019 www.globalscientificjournal.com

grows more apparent every day. Among the renewable resources being investigated and
implemented, hydroelectric power plant is the one. Hydro electric power has proven to be a clean,
viable renewable resource with many benefits. All the renewable resources in the world,
hydroelectric power is by far the most widely used. In fact, in 2005, an estimated 20% of the
world’s electricity was supplied by hydroelectric power. That’s an impressive amount of power and
should not be underestimated [21].
2.2. Electrification in Ethiopia
Ethiopia is located in the eastern part of Africa between 3o to 15o north and 33o to 48o east. With a
surface area of 1.1 million square kilometers, it is the third largest country in Africa. It is the
second most populous country in Sub Saharan Africa with an estimated population of about 73.9
million, which is mostly distributed in northern, central and southwestern highlands. There is a
vast energy resource potential in Ethiopia, which, if employed, could reduce the present energy
crisis prevailing in the country and increase the process of rural electrification. The total
exploitable renewable energy that can be derived annually is from primary solar radiation, wind,
forest biomass, hydropower, animal waste, crop residue and human waste [3].
Table 2.3: Different Energy Resources in Ethiopia [17]
TypeExploitable
UnitsExploited
Reserves percent
Hydropower 30,000 MW 0.9%
Solar/day 5 KWh/m20%
Wind speed 3.5-5.5 m/s 0%
Geothermal 700 MW 0%
wood 1120 Million tones 50%
Agricultural west 15-20 Million tones 30%
Natural gas 75 Billion m30%
Coal 13.7 Million tones 0%
As see from the table 1.3, Energy supply and consumption in Ethiopia is characterized by the
predominance of traditional fuels in the form of fuel wood and agricultural residue including dung
9
GSJ: Volume 7, Issue 3, March 2019 ISSN 2320-9186
1117
GSJ© 2019 www.globalscientificjournal.com

as the majority of people in Ethiopia live in the rural areas (85%) and depends on these sources of
energy for cooking, lighting and heating. More than 97% of the energy used in the households is in
the form of biomass energy (fuel wood and agricultural residue). Further, energy use in households
is characterized by a very low efficiency of 5 to 10%, which could readily be improved with
appropriate intervention measures. It is only a minority of households that has access to modern
fuels like kerosene and electricity (1% of the rural population has access to electricity, leaving the
rest is without access.). Approximately 13% of the population are connected to the electric grid and
are virtually all clients of EEPCO concentrated in the main urban areas [3].
Potential of Hydropower in Ethiopia
From the total covered area i.e. 1.1044X10km2, 104,300 km2 is covered with water. From which for
the coming five year planned to generate 9000MW electricity. Large hydro power makes up 98% of
Ethiopia’s power production. The government has large expansion plans for large hydro power to
stop energy shortages and to eventually become an energy exporter in 2010[13]. Concerning rural
electrification, the Ethiopian government has set the target to connect 50% of the households to the
electricity grid.
The theoretical potential of hydropower in Ethiopia is estimated to be in 30,000-45,000 MW which
would enable an annual 160,000 GWh. The estimated economically exploitable hydropower
potential ranges between 15,000 and 30,000 MW [13].
10
GSJ: Volume 7, Issue 3, March 2019 ISSN 2320-9186
1118
GSJ© 2019 www.globalscientificjournal.com
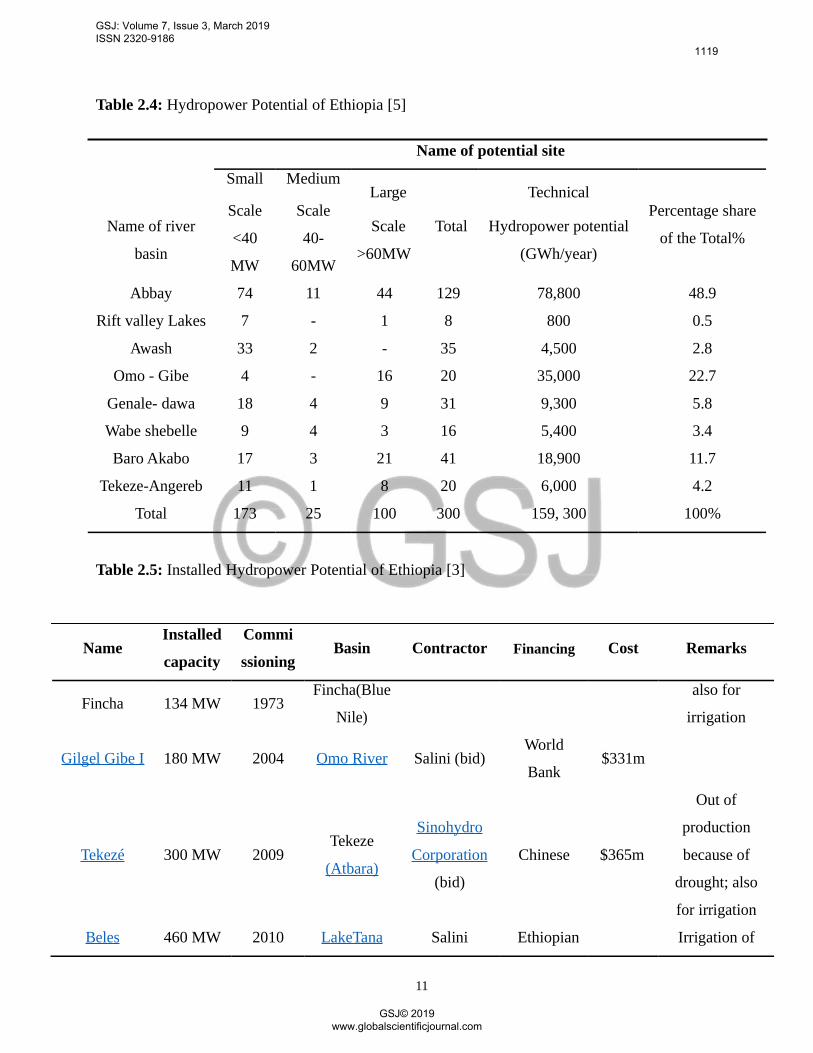
Table 2.4: Hydropower Potential of Ethiopia [5]
Name of potential site
Small MediumLarge Technical
Scale Scale Percentage shareName of river Scale Total Hydropower potential
<40 40- of the Total%basin >60MW (GWh/year)
MW 60MW
Abbay 74 11 44 129 78,800 48.9
Rift valley Lakes 7 - 1 8 800 0.5
Awash 33 2 - 35 4,500 2.8
Omo - Gibe 4 - 16 20 35,000 22.7
Genale- dawa 18 4 9 31 9,300 5.8
Wabe shebelle 9 4 3 16 5,400 3.4
Baro Akabo 17 3 21 41 18,900 11.7
Tekeze-Angereb 11 1 8 20 6,000 4.2
Total 173 25 100 300 159, 300 100%
Table 2.5: Installed Hydropower Potential of Ethiopia [3]
NameInstalled Commi
Basin Contractor Financing Cost Remarkscapacity ssioning
Fincha 134 MW 1973Fincha(Blue also for
Nile) irrigation
Gilgel Gibe I 180 MW 2004 Omo River Salini (bid)World
$331mBank
Out of
TekezeSinohydro production
Tekezé 300 MW 2009 Corporation Chinese $365m because of(Atbara)
(bid) drought; also
for irrigation
Beles 460 MW 2010 LakeTana Salini Ethiopian Irrigation of
11
GSJ: Volume 7, Issue 3, March 2019 ISSN 2320-9186
1119
GSJ© 2019 www.globalscientificjournal.com

(Blue Nile) (nobid) governmen 140,000 ha
OmoRiverout of
Salini Italy and Euro productionGilgelGibe II 420 MW 2010 (nodam,fed
(nobid) EIB 370m because ofby GG I)
collapsed tunnel
GilgelGibe Salini Eurofaces stiff
1870 MW 2012-13 Omo River Italy environmentalIII (nobid) 1.55bn
criticism
FinchaChina
ExamFincha Gezhouba
Amerti 100 MW planned Bankof $276m(BlueNile) Group
Nesse (FAN) ChinaCo.(CGGC)
Halele440 MW 2014 Omo River
Sinohydro Fair Euro
Worabese Corporation Fund? 470m
GilgelGibetributaryof
Sinohydro2000 MW 2014 theOmo Chinese $1.9bn
IV CorporationRiver
tributaryofWillconsist of 5
Chemoga theBlue Nile, Sinohydro278 MW 2013 Chinese $555m interconnected
Yeda nearDebre Corporationdams
Markos
Feasibility
Genale awardedbetween
Chinesestudy by
256 MW Oromoand Chinese $408m Lahmeyer withDawa III in 2009 CGGC
Somali state funding from
the AfDB
As can be seen from tables 1.5, Ethiopia has abundant installed hydropower resources that have a
potential to overcome poverty. And as see from table 1.4, hydropower potential of Ethiopia is
classified in three groups these are large scale, medium scale and small scale hydropower. From
these, small scale hydropower is vital for the country side area because small scale hydropower is
needs less capital cost, less installation as well as maintenance knowledge, and also generate from
12
GSJ: Volume 7, Issue 3, March 2019 ISSN 2320-9186
1120
GSJ© 2019 www.globalscientificjournal.com

small discharge rate (flow rate) and can plant for a village or a kebelle based on the output power
and demand rate. Small scale hydro powers are like small hydropower, micro hydropower and Pico
hydropower (see appendix - F).
2.3. Micro Hydropower
Supply of energy in a suitable form is considered to be one of the main inputs required to raise the
standards of living of the people and to minimize the damage to the ecosystem. Supplying
improved energy services to people for the first time is difficult; but supplying such services
profitably to very poor people who live far away from roads and the electricity grid pose a
particularly difficult challenge. However micro hydro compares well with other energy supply
technologies in these difficult markets. But despite this, micro hydro appears to have been
relatively neglected by donors, the private sector and governments in the allocation of resources
and attention. In the past rural electrification by means of grid extension was the option favored by
donors.
Micro-hydro is the small scale harnessing of energy from falling water, generating typically less
than 100 KW and powering small communities or factories. Micro-Hydro power systems are
relatively small power sources that are appropriate in most causes for individual users or groups of
users who are independent of the electricity supply grid.
Micro-hydro power system can using waste water from community means that neither a large dam
is built nor is land flooded. Only waste water from different parts of the city is required to generate
power and this has minimum environmental impact. After water treatment techniques, we can
provide chemical less water to formers to serve the land of the country. The amount of energy that
can be captured depends on the amount of waste water flowing per second (the flow rate) and the
height from which the waste water flows through sewage pipes.
2.3.1. Micro hydro power potential of Ethiopia
Ethiopia is one of the lowest electrification levels in the sub-Saharan Africa. The rural
electrification level is less than 1.5 percent which is the lowest in the world. After more than a
century of history, the benefits of electricity are still limited to a small section of the population in
urban areas [12].
13
GSJ: Volume 7, Issue 3, March 2019 ISSN 2320-9186
1121
GSJ© 2019 www.globalscientificjournal.com

The Chinese study for the ministry of agriculture, 1989 was exploration level of small hydropower
site in the western, central and south-western parts of the country, a total of 3,138kw where
identified with the micro hydro range. Ethiopia electric Agency, 2003 the theoretical potential in
the micro hydro range is estimated to be about 100MW. This potential is states as indicated below.
Table 2.6: Micro Hydro Power Potential of Ethiopia by Region [12]
Micro hydro power potential by region
Region Capacity(MW)
Oromia 35
Amhara 33
SNNP 18
Benshangul-gumeze 12
Gambella 2
Total: 100
As shown in the above table the total hydropower potential in Ethiopia is estimated to be about
100MW.Assuming 150 to 200 watt demand per household, this could mean about 0.5 million
households could be electrified with micro hydropower.
Micro-Hydro Advantages
There are many advantages to micro-hydro power besides being an efficient and renewable energy
resource:-
Micro-hydro requires relatively little flow and head to produce electricity
In addition, it generates a more reliable supply of electricity when compared to other home-
sized renewable energy systems
Its peak energy period is in winter when greater levels of electricity are generally needed
and solar power is diminished
Unlike large-scale hydroelectric plants, is considered a very environmentally friendly choice
because of its minute effect on the ecosystem—water passes through the system and back
into the river or stream with little or no impact on the waterway.
14
GSJ: Volume 7, Issue 3, March 2019 ISSN 2320-9186
1122
GSJ© 2019 www.globalscientificjournal.com

Micro-Hydro Disadvantages
Micro-hydro has many advantages over conventional grid power, as well as over solar and wind
power, but it does have a few disadvantages to consider:-
Not everyone has a suitable site a reliable, year-round water source is needed. Remoteness
of the power source from the home, as well as the quality of your water source unlike solar
and wind systems where you can add modules or a larger turbine.
2.4. Previous Works
2.4.1. SNNPR micro hydro power [3]
In the Southern Nations, Nationalities and Peoples’ Regional State (SNNPR) OF ETHIOPIA, there
exist three smaller hydropower schemes in Yadot (350 kW), Dembi (750 kW) and Sor (5 MW).
Currently GTZ is supporting 4 off-grid sites (7, 30, 35, and 50 kW) and 1 grid-connected site (200
kW). For example, the Gobecho I micro hydropower plant is built on a small river in Bona Zuria
woreda of the Sidama zone in SNNP state with over 50,000 Euro; this project can generate about 7
kilowatts of energy and provides electric power to more than 5,000 residents of the woreda. The
construction of Gobecho II and Erete micro hydropower plant is underway.
And also Residents of Yaye town in the Abegona woreda, in collaboration with the Irish
Development Cooperation, built a micro hydro-power plant (MHP) at a cost of seven million birr.
The MHP, Which was built in 2005, has the capacity to generate 150 KW electric powers. Owned
by the Sidama Development Cooperation of the MHP was set to provide electric power for Yaye
town for 20 years, As Yaye was not connected to the nation’s electric power grid. The MHP has
been supplying power to the town. However, after serving the community for two years the plant
was shut down when the Ethiopian Electric Power Corporation (EEPCO) extended the national
power grid to Yaye. Since there is no power purchase agreement that allows the private sector to
feed the national power grid, the Yaye MHP ceased operation.Hydropower, large and small,
remains by far the most important of the renewable energy resources for electrical power
production in worldwide, providing 19 percent of the planet’s electricity.
15
GSJ: Volume 7, Issue 3, March 2019 ISSN 2320-9186
1123
GSJ© 2019 www.globalscientificjournal.com

MHP is an installation where hydraulic power is used to generate small quantities of electricity by
means of one or more turbine generators where a national grid does not extend. MHP can supply
power to a rural community, or to one industry, hospital, and tourist site. A long time ago Ethiopia
named itself the water tower of Africa because of its potential to generate 45,000 MW of power. At
the moment the country is producing 2000MW. Electricity coverage is 15 percent. Electricity
supply in rural areas where the majority of the populations (85 percent) live is estimated at one
percent. As a result the majority population depends on biomass fuels for cooking, lighting and
space heating. The heavy reliance on biomass fuels in rural areas has led to detrimental
consequences to local environment in terms deforestation, bio diversity, water quality, soil
degradation and erosion.
Micro hydropower was a practical and potentially low-cost option for generating electricity at
remote cities, particularly for small villages in hilly areas. Running costs of such schemes were
very low. However, the initial cost could be relatively high. A recent study indicates that an
economically feasible hydropower potential of Ethiopia is estimated at 15,000 to 30,000 MW and
ten percent of this amount was suitable for small-scale development.
The Evangelical Church Mekaneyesus has installed many micro hydro turbines used for flour
milling in some rural areas. Though the MHPs are useful they are facing several problems. The
Yaye MHP is not the only plant that was closed. About ten hydropower systems were installed by
the government for electric generation, out of which nine have ceased operation. One of the major
reasons for the failure of these plants is lack of technical capability to maintain or recondition the
installations. shutdown micro hydro installations were built on completely imported hard ware’s
and were installed by the help of highly-paid foreign experts. The former national utility, the
Ethiopian Electric Power Authority, many years ago used to install and operate a number of small
hydropower stations. The stations were used to supply towns in isolated mode until the
1990s.When the inter-connected system was brought to the towns the importance of the micro
hydro systems was drastically reduced. Many of the hydro-systems were installed in the 1950s and
1960s were unreliable and extremely costly to operate.
Ethiopia is building huge hydropower projects in an effort to boost electricity supply that can
satisfy the local demand. ―Communities can generate income from MHPs. At the time of the
16
GSJ: Volume 7, Issue 3, March 2019 ISSN 2320-9186
1124
GSJ© 2019 www.globalscientificjournal.com

national grid extended to that region, the Yaye MHP was closed. But now it connects to the grid
and again servicing to the society.
2.4.2. Tungu Kabri micro hydropower [24]
The Tungu-Kabiri community micro hydo power project in the rural area around Mount Kenya
demonstrates how the use of micro hydropower can bring development to rural areas in Africa.
About 96% of the rural population in Kenya still lack access to grid-based electricity. A pilot
project initiated by Practical Action (previously Intermediate Technology Development Group
ITDG) in Kenya has shown the potential for decentralised micro hydro schemes to provide access
to electricity. In Tungu-Kabiri, rural Kenya, almost 200 households came together and formed a
commercial enterprise to own and operate a micro hydropower plant, which they constructed and
continue to maintain themselves. The micro hydro plant now supplies electricity to a number of
local enterprises and households, greatly improving quality of life in the area.
Only 4% of people in rural Kenya currently have access to grid-based electricity. Families instead
mainly rely on kerosene for lighting, woodfuel and dung for cooking, and diesel-powered systems
for tasks such as milling grain. Cooking with traditional biomass causes severe air-pollution and
health problems and takes considerable time and effort to collect fuel. Purchasing kerosene may
take up about 1/3 of a rural family's income.
In 1998 ITDG in collaboration with the Kenyan Ministry Energy (MoE) and with funding from the
UNDP, undertook a pilot project to illustrate the potential for decentralised micro hydro schemes to
address the lack of electricity. After an initial feasibility study, the Tungu-Kabiti community 185
km north of Nairobi was chosen as the site for the pilot project.
About 200 members of this community came together and formed a commercial enterprise to own,
operate and maintain a micro hydropower plant. Each individual bought a share in the company,
with a maximum share value of about US$50. The members also contributed labour, dedicating
every Tuesday for over a year to the construction work, which was overseen by the MoE and
ITDG. Involving the community in all aspects of project development from the start was critical to
reduce local technical barriers and it ensured that the community could effectively maintain and
repair the micro hydropower system themselves. The micro hydropower plant is owned and
17
GSJ: Volume 7, Issue 3, March 2019 ISSN 2320-9186
1125
GSJ© 2019 www.globalscientificjournal.com

managed by the community, and this complete community ownership has been central to the
project's success.
The day-to-day operations of the plant are managed by a 10-member community power
committee, and this committee also conducts consultations with the wider community about how
the power generated from the system should be used. The electricity is currently used mainly for
micro-enterprises, such as a welding unit, a battery-charging station and a beauty salon. This
project has shown that micro hydropower can effectively meet the energy needs of poor off-grid
communities. It has demonstrated that communities are willing to invest time and money for
improved energy services, and can organize themselves to build and operate a micro hydropower
plant.
2.4.3. Master plan of mini/micro hydropower to replace diesel power plants [28]
Master plan of mini/micro hydropower to replace diesel power plants was carried out by TEAM
Consulting Engineer Co,Ltd. and submitted to NEA in August 1983. The purpose of the study’s to
identify promising mini/micro-hydropower projects to replace the existing diesels power plants
scattered throughout rural Thailand. The aim of the study is to find a long-term solution to the
costly electricity generation by the diesel power Plants which depend on imported oil. Altogether,
there are 40 potential mini/micro hydropower sites. Among these, 29 sites were justified
economically suitable for further detailed feasibility study and engineering works. The selection of
the sites was done primarily based on 1:50,000 topographic maps prepared by the Royal Thai
Survey Department and then was checked by field surveys. Layout of project components was
made for each selected site. These project components include a low head diversion weir, an intake
to the conveyance channel, a penstock and a power house. The hydrologic study was carried out on
the basis of regional approach. Regional flow duration curves for the Northern, Northeastern and
Southern regions were developed from available stream flow records. Cost estimation of each
selected mini/micro hydropower project was based on the quantity estimates of the typical layout
with key dimensions varied from site to site. In conducting economic justification of the
hydropower projects, two bases were considered. For the isolated system, comparison with the
diesel power plant was made. Only one project was evaluated with this basis.
18
GSJ: Volume 7, Issue 3, March 2019 ISSN 2320-9186
1126
GSJ© 2019 www.globalscientificjournal.com

In case of interconnected system, the economic justification was undertaken on the basis of
comparison between the system which would be supplied by the national power system of EGAT
alone and the system which would be supplied by the national power system of EGAT with power
reinforcement by the mini/micro hydropower project. It was recommended that the 29 sites which
were considered economically feasible should be subjected for further work and detailed
engineering layouts and designs should be undertaken together with the revision of the economic
feasibility study with more accurate cost estimates. For those remaining sites, it was still
recommended that those load centers be hooked-up to the national transmission grid because they
would be more economical than utilizing existing diesel plants.
When come up to current study nothing like that of yaye town, the selected site area that
mountainous (2300 meter altitude) and remote area, is difficult to have time extending national
grid to it even in the future. That is why micro hydropower is the vital plant to electrify the site.
And also to overcome the problem of luck of maintenance human power (technician) as well as to
down frequency of accidental trouble on the plant, the work is carried out with better efficiency. In
addition to this, like that of Tungu-Kabiri, rural Kenya project, the designer (researcher) is native
of the country and dwelling around there, there for, it is simple to trains the household, in order to
carried out the construction as well as the maintain by themselves, and to take visual inspection.
The work of the thesis is to replace kerosene for lighting and diesel for power system with micro
hydro power that is great change to the society because they will get additional access that haven’t
currently like television and clinic laboratory equipments.
19
GSJ: Volume 7, Issue 3, March 2019 ISSN 2320-9186
1127
GSJ© 2019 www.globalscientificjournal.com

CHAPTER THREE
BASIC COMPONENTS OF MICRO HYDROPOWER
The figure 3.1 below shows that the basic components of a Micro Hydropower system on Temie
river. This system configuration is known as ―Run of river since the water that flows through the‖
turbine is not take away beyond what is necessary for short tern head regulation. This lets the river
run on depending on weather and power production not reservoir storage. Excess flow bypasses
the water diversion intake so that the eco system between the power house tail race and diversion
intake is left intact.
Figure 3.1: Micro Hydro Power System Components
20
GSJ: Volume 7, Issue 3, March 2019 ISSN 2320-9186
1128
GSJ© 2019 www.globalscientificjournal.com

The various components of micro hydro power plants are:-
3.1 Civil Components
A hydropower station has to divert water from the river. To perform this function civil structures
are necessary. These components are:-
Weir: - A hydro system must extract water from the river in a reliable and controllable way. The
water flowing in the channel must be regulated during high river flow and low flow conditions. A
weir can be used to raise the water level and ensure a constant supply to the intake. Sometimes it is
possible to avoid building a weir by using natural features of the river.
Usually it is sensible to adopt traditional water management techniques known to local people.
Temporary weir construction might be one of these techniques. The principle of the temporary
weir is to construct a simple structure at low cost using local labour, skills and materials. It is
expected to be destroyed by annual or bi-annual flooding. Advanced planning is made for
rebuilding of the weir whenever necessary. There are various types of weir in use. Like:-
Broad crested weir (or broad-crested weir)
Sharp crested weir
Crump weir (named after the designer)
Needle dam
Proportional weir
Combination weir
MF weir
V-notch weir
Rectangular weir
Cipolletti (trapezoidal) weir
Labyrinth weir
Tidal weir
Long crested weir - e.g. Duckbill and diagonal
Minimum Energy Loss weir.
21
GSJ: Volume 7, Issue 3, March 2019 ISSN 2320-9186
1129
GSJ© 2019 www.globalscientificjournal.com

The classification of weirs may be done is number of ways .like based on function:-
Storage weir: They are constructed purely for storing water. They are termed as low dams also.
Pick-up weirs: In a storage project the reservoir water is discharge in the river through supply
sluices. This released water is picked up by constructing a weir a cross the river where canals take
off a series of such pick-up weirs may be constructed to utilize the available water
Intake weir: They are constructed as a part of head works. They raise the water level by
obstructing the river flow. The water is then diverted to the canal.
Waste Weirs: They are generally used as spill ways for reservoirs. It protects the reservoir and the
main storage dam (Sahasrabudhe 1994) under this intake weir is selected.
Channels:-The channel conducts the water from the intake to the fore bay tank. The length of the
channel depends on local conditions. In one case a long channel combined with a short penstock
can be cheaper or necessary, while in other cases a combination of short channel with long
penstock suits better.
Most channels are excavated, while sometimes structures like aqueduct are necessary. To reduce
friction and prevent leakages channels are often sealed with cement, clay or polythene sheet.
Size and shape of a channel are often a compromise between costs and reduced head. As water
flows in the channel, it loses energy in the process of sliding past the walls and base material. The
rougher the material, the greater the friction loss and the higher the head drop needed between
channel entry and exit. Where small streams cross the path of the channel very great care must be
taken to protect the channel. A heavy storm may create a torrent easily capable of washing the
channel away.
Forebay tank: - The forebay tank forms the connection between the channel and the penstock.
The main purpose is to allow the last particles to settle down before the water enters the penstock.
Depending on its size it can also serve as a reservoir to store water. A sluice will make it possible
to close the entrance to the penstock. In front of the penstock a trash rack need to be installed to
prevent large particles to enter the penstock.
Penstock: - The penstock is the pipe which conveys water under pressure from the forebay tank to
the turbine. The penstock often constitutes a major expense in the total micro hydro budget. The
22
GSJ: Volume 7, Issue 3, March 2019 ISSN 2320-9186
1130
GSJ© 2019 www.globalscientificjournal.com

trade-off is between head loss and capital cost. Head loss due to friction in the pipe decreases
dramatically with increasing pipe diameter. Conversely, pipe costs increase steeply with diameter.
Therefore a compromise between cost and performance is required. The design viewpoint is first to
identify available pipe options, then to select a target head loss, 5 % of the gross head being a good
starting point. The details of the pipes with losses close to this target are compared for cost
effectiveness. A smaller penstock may save on capital costs, but the extra head loss may account
for lost revenue from generated electricity each year.
Power house - a small shed or enclosure to protect the water turbine and generator from the
elements. The basic objective of power house planning is to house all the equipments suitably in a
structural complex.
Types of Power House Planning
The basic requirement of power house planning is a functional efficiency coupled with aesthetic
beauty.
A power house can be classified as: surface power house: the power house is located in a building above the ground Underground power house: in this type of power house the power house carven, tunnels
and shafts for water conduits system, access tunnels and ventilation shafts are located
inside the mountain.
The geology of the rock strata should be such that various underground structures are able to stand
on their own without support. In recent years more and more underground power stations has come
has come in to practice .This is so because rapid development in rock mechanics , mechanized
tunnelling and mucking removal and lining equipment have made tunnelling both economical and
rapid .
On the other hand there has been rapid increasing in the cost of steel which has made surface
power scheme less attractive.
Selection of Site for Power House Planning
The site selection for the power house is based on the following criteria:
1. To provide maximum available head.
23
GSJ: Volume 7, Issue 3, March 2019 ISSN 2320-9186
1131
GSJ© 2019 www.globalscientificjournal.com

2. To minimize cost of construction and excavation.
3. To get easy access to the power plant.
3.2. Mechanical components
3.2.1 Turbines: - Hydraulic Turbines are being used from very ancient times to harness the energy
stored in flowing streams, rivers and lakes. The oldest and the simplest form of a Hydraulic
Turbine was the Waterwheel used for grinding grains. Different types of Hydraulic Turbines were
developed with the increasing need for power. In general turbine is rotating mechanical device,
which transfers the kinetic energy of water to mechanical energy by means of a rotation of a shaft.
Table 3.1: Classification of Hydraulic Turbine
Classification of Hydraulic Turbine
Classification criteria
No. Based on flow pathBased on pressure change
1 Axial flow Impulse
2 Radial flow Reaction
3 Mixed flow
In a reaction turbine the runners are fully immersed in water and are enclosed in a pressure casing.
The runner blades are angled so that pressure differences across them create lift forces, like those
on aircraft wings, and the lift forces cause the runner to rotate.
In an impulse turbine the runner operates in air, and is turned by one or multiple jets of water
which make contract with the blade. A nozzle converts the pressurized low velocity water into a
high speed jet.
24
GSJ: Volume 7, Issue 3, March 2019 ISSN 2320-9186
1132
GSJ© 2019 www.globalscientificjournal.com

Turgo Turbines
Figure 3. 2: Turgo Style Wheel [8]
Turgo turbine is an impulse type of turbine in which a jet of water strikes the turbine blades. The
structure of a Turgo wheel is much like that of airplane turbine in which the hub is surrounded by a
series of curved vanes. These vanes catch the water as it flows through the turbine causing the hub
and shaft to turn. Turgo turbines are designed for higher speeds than Pelton turbines and usually
have smaller diameters.
Pelton Turbines
Figure 3. 3: Pelton Turbine Style Wheel [8]
25
GSJ: Volume 7, Issue 3, March 2019 ISSN 2320-9186
1133
GSJ© 2019 www.globalscientificjournal.com

A Pelton turbine is also an impulse turbine but in this type of turbine the hub is surrounded by a
series of cups or buckets which catch the water. The buckets are split into two halves so that the
central area does not act as a dead spot incapable of deflecting water away from the oncoming jet.
The cutaway on the lower lips allows the following bucket to move further before cutting off the
jet propelling the bucket ahead of it. This also permits a smoother entrance of the bucket into the
water jet.
Cross-Flow Turbines
Figure 3. 4: Cross-Flow Turbines Style Wheel [8]
A cross-flow turbine, also sometimes called a Michell-Banki turbine (from the name of the
manufacturer) is a turbine that uses a drum shaped runner. A vertical rectangular nozzle is used
with this type of turbine to drive a jet of water along the full length of the runner. One advantage of
this type of turbine is that it can be used in situations where you have significant flow but not
enough head pressure to use a high head turbine.
Francis Turbine
Figure 3.6: Francis Turbine Style Wheel [8]
26
GSJ: Volume 7, Issue 3, March 2019 ISSN 2320-9186
1134
GSJ© 2019 www.globalscientificjournal.com

The Francis type of turbine is a reaction type of turbine in which the entire wheel assembly is
immersed in water and surrounded by a pressure casing. In a Francis turbine the pressure casing is
spiral shaped and is tapered to distribute water uniformly around the entire perimeter of the runner.
It uses guide vanes to ensure that water is fed into the runners at the correct angle.
Propeller Turbine
Figure 3.7: Propeller Turbine Style Wheel [8]
A propeller turbine is just what its name implies. It uses a runner shaped just like a boat propeller
to turn the generator. The propeller usually has six vanes. A variation of the propeller turbine is the
Kaplan turbine in which the pitch of the propeller blades is adjustable. This type of turbine is often
used in large hydroelectric plants. An advantage of propeller type of turbines is that they can be
used in very low head conditions provided there is enough flow.
Water nozzle - a nozzle which shoots a jet of water (impulse type of turbines only)
Generator shaft - a power transmission part that connects the runner to the generator.
Governor - The governor is a mechanism of controlling the rotational speed of the turbo generator
units .Constant speed must be maintained in order to obtain alternating current supply with a
constant frequency as the turbine and its inter connected generator tends to decrease or increase
speed as the load varies .The maintenance of almost constant speed requires the turbine by closing
or opening the gate or nozzle of the turbine automatically through the action of the governor.
27
GSJ: Volume 7, Issue 3, March 2019 ISSN 2320-9186
1135
GSJ© 2019 www.globalscientificjournal.com
Drive System: - Transmits power from the turbine shaft to the generator shaft or the shaft
powering other devices. It also has the function of changing the rotational speed from the one shaft
to another when the turbine speed differs from the required speed of the alternator or device.
3.3. Electrical components:
The main electrical components relevant for MHP plants are the generator, or an induction motor
used as a generator, the electric load controller, the electric power network, including conductors,
insulators, electricity meters etc., and the transformers. The following system structure shows the
basic elements:
One generator one step-up transformer transmission line several step-down
transformers distribution lines.
Electrical Generator: - is a device that generates electricity from mechanical energy, usually via
electromagnetic induction. Electromagnetic induction works by forcibly moving a loop of wire (a
rotor) around a stationary bar (a stator) that provides an electric field, either through a permanent
magnet or an electromagnet. By Faraday's law, this induces a current in the rotor, which can be
used to power machinery or charge batteries. Possible sources of mechanical energy include steam
engines, water falling through a turbine or waterwheel, an internal combustion engine, a hand
crank, a wind turbine, compressed air, solar energy, and many others. For hydro power generator,
the mechanical energy from the water through the turbine is transmitted to the generator by shaft.
Electronic Load Controller: - is a controller that controls the frequency of the generated voltage
in the micro-hydro systems.
Transformer: - is a device that transfers electrical energy from one circuit to another through
inductively coupled conductors—the transformer's coils. A varying current in the first or primary
winding creates a varying magnetic flux in the transformer's core and thus a varying magnetic field
through the secondary winding. This varying magnetic field induces a varying electromotive force
(EMF), or "voltage", in the secondary winding. This effect is called mutual induction. If a load is
connected to the secondary, an electric current will flow in the secondary winding and electrical
energy will be transferred from the primary circuit through the transformer to the load. In an ideal
transformer, the induced voltage in the secondary winding (Vs) is in proportion to the primary
28
GSJ: Volume 7, Issue 3, March 2019 ISSN 2320-9186
1136
GSJ© 2019 www.globalscientificjournal.com

voltage (Vp), and is given by the ratio of the number of turns in the secondary (Ns) to the number
of turns in the primary (Np) as follows:
Vs Ns
3.1Vp Np
By appropriate selection of the ratio of turns, a transformer thus allows an alternating current (AC)
voltage to be "stepped up" by making Ns greater than Np, or "stepped down" by making Ns less
than Np.
Transmission system:- is a system that interconnects generators and loads and generally provides
multiple paths among them. Multiple paths increase system reliability because the failure of one
line does not cause a system failure. Most transmission lines operate with three-phase alternating
current.
Distribution system: - is the system that carries energy from the local substation to individual
households, using both overhead and underground lines.
29
GSJ: Volume 7, Issue 3, March 2019 ISSN 2320-9186
1137
GSJ© 2019 www.globalscientificjournal.com

CHAPTER FOUR
SITE DESCRIPTION, DATA COLLECTION AND LOAD
CALCULATION
4.1. Site Description
Temie River is located on east Gojjam Zone hullet Ejju Enesie Woreda 2km from keranio town.
The river has a total length of 35.5km, a total catchments area of 119km2. The hydro energy
potential of Temie River is 14.3MW, where as in actuality case, currently the potential is lower due
to the utilization of the water for irrigation purpose by the population. Its designed water head is 76
meters high, its diverted discharge is 0.212m3/s. The river crosses two Kebelles these are shigie
and hizbe selam. shigie kebelle have 3377 male and 2905 female a total of 6282 people, and 1396
households. Hizbeselam kebelle have 4793 male and 4443 female a total of 9236 people, and 2116
households. From these kebelles some of the villages have get access of electricity from central
grid connection, where as Dombit and nib gasha saint marry monastery have no access. So the
thesis is focused on to electrify these villages. Dombit have 540 male and 459 female a total of 999
people and199 households. And also saint marry monastery have a total of 30 people and one
church. Currently the communities are primarily using kerosene, candle and dry cells for lighting.
Figure 4.1: Picture of the Site (Temie River, Dombit, and Saint Marry Monastery)
30
GSJ: Volume 7, Issue 3, March 2019 ISSN 2320-9186
1138
GSJ© 2019 www.globalscientificjournal.com

As see from the above figure 4.1, temie river is crosses the two villages, Dombit and Saint Marry
Monastery. Saint merry monastery is nearer to the river than Dombit so the transmission line
expense for the Dombit village is greater than for the saint mary monastery. As much as possible
the power house installation is proposed at the centre by taking in to consideration the place where
better head is getting.
Figure 4.2: Lay Out of the Site (Temie River, Dombit, and Saint Marry Monastery)
As see from the figure 4.2 above, Temie river is crosses the main road that is from bahir dar to
addis abeba through motta there fore it is cosy for the transportation system.
31
GSJ: Volume 7, Issue 3, March 2019 ISSN 2320-9186
1139
GSJ© 2019 www.globalscientificjournal.com

Figure 4.3: Picture of Temie River
As see from the figure 4.3 above, the topography of the site is irregular for the selection of power
house installation area which is related to the discharge head, as much as possible select labeled
area for the power house by takes in to account the designed discharge head.
4.2. Data collection
The design of micro hydropower system requires precise site information such as head, discharge
rate (flow rate), and electrical information like load type and time of use electrical appliance.
These requirements are going to be dealt here on this chapter in the subsequent section.
4.2.1. Determination of discharge rate
For a micro hydropower design it is very important to have flow data over as many years as
possible to be sure how much water is available to run a turbine. These data give the designer the
basic information for the selection of the turbine that works most efficiently. With this information
and the demand of the consumers, the designer can choose the proper turbine and generator as well
as he can define size and length of the grid for an isolated MHP.
Depending on the size of the river or stream there are different methods to measure the flow:-
32
GSJ: Volume 7, Issue 3, March 2019 ISSN 2320-9186
1140
GSJ© 2019 www.globalscientificjournal.com

1. Bucket methods
The bucket method is a simple way of measuring flow in very small streams. The entire flow is
diverted into a bucket or barrel and the time for the container to fill is recorded. The flow rate is
obtained simply by dividing the volume of the container by the filling time. Flows of up to 20 l/s
can be measured using a 200-litre oil barrel.
Figure 4.4: Discharge Measurement by Bucket Method [25]
2. Float method
The principle of all velocity-area methods is that flow Q equals the mean velocity Vmeans times
cross-sectional A:
Q=A × Vmean 4.1
One way of using this principle is for the cross-sectional profile of a stream bed to be charted and
an average cross-section established for a known length of stream. A series of floats, perhaps
convenient pieces of wood, are then timed over a measured length of stream. Results are averaged
and a flow velocity is obtained. This velocity must then be reduced by a correction factor which
estimates the mean velocity as opposed to the surface velocity. By multiplying averaged and
corrected flow velocity, the volume flow rate can be estimated.
33
GSJ: Volume 7, Issue 3, March 2019 ISSN 2320-9186
1141
GSJ© 2019 www.globalscientificjournal.com

Figure 4.5: Discharge Measurement by Float Method [25]
3. Current meters
These consist of a shaft with a propeller or revolving cups connected to the end. The propeller is
free to rotate and the speed of rotation is related to the stream velocity. A simple mechanical
counter records the number of revolutions of a propeller placed at a desired depth. By averaging
readings taken evenly throughout the cross section, an average speed can be obtained which is
more accurate than with the float method. This method is suitable for flow velocities ranging from
0.2 - 5 m/s and where you can safely wide the stream.
34
GSJ: Volume 7, Issue 3, March 2019 ISSN 2320-9186
1142
GSJ© 2019 www.globalscientificjournal.com

Figure 4.6: Discharge Measurement by Current Meters [25]
4. Measuring weirs
A flow measurement weir is a weir with a notch in it through which all the water in the stream
flows. The flow rate can be determined from a single reading of the difference in height between
the upstream water level and the bottom of the notch. For reliable results, the crest of the weir must
be kept sharp and sediment must be prevented from accumulating behind the weir. Sharp and
durable crests are normally formed from sheet metal, preferably brass or stainless steel, as these do
not corrode. Weirs can be timber, concrete or metal and must always be oriented at right angles to
the stream flow.
Sitting of the weir should be at a point where the stream is straight and free from eddies. Upstream,
the distance between the point of measurement and the crest of the weir should be at least twice the
maximum head to be measured. There should be no obstructions to flow near the notch and the
weir must be perfectly sealed against leakage. Rectangular notch measuring weir Temporary
measuring weirs are used for short-term or dry-seasoned measurements and are usually constructed
35
GSJ: Volume 7, Issue 3, March 2019 ISSN 2320-9186
1143
GSJ© 2019 www.globalscientificjournal.com

from wood and staked into the bank and stream bed. Sealing problems may be solved by attaching
a large sheet of plastic and laying it upstream of the weir held down with gravel or rocks. It is
necessary to estimate the range of flows to be measured before designed the weir, to ensure that the
chosen size of notch will be correct.
The use of permanent weirs may be a useful approach for small streams, but larger streams might
better measured by staging.
Figure 4.7: Discharge Measurement by Measuring Weirs [25]
5. Salt gulp' flow measurement
The `salt gulp' method of flow measurement is adapted from dilution gauging methods with
radioactive tracers used for rivers. It has proved easy to accomplish, reasonably accurate (error <7
%), and reliable in a wide range of stream types. It gives better results the more turbulent the
stream. Using this approach, a spot check of stream flow can be taken in less than 10 minutes with
very little equipment.
36
GSJ: Volume 7, Issue 3, March 2019 ISSN 2320-9186
1144
GSJ© 2019 www.globalscientificjournal.com

A bucket of heavily salted water is poured into the stream. The cloud of salty water in the stream
starts to spread out while travelling downstream. At a certain point downstream it will have filled
the width of the stream. The cloud will have a leading part which is weak in salt, a middle part
which is strong in salt and a lagging part which is weak again. The saltiness (salinity) of the water
can be measured with an electrical conductivity meter. If the stream is small, it will not dilute the
salt very much, so the electrical conductivity of the cloud (which is greater the saltier the water)
will be high. Therefore low flows are indicated by high conductivity and vice versa. The flow rate
is therefore inversely proportional to the degree of conductivity of the cloud.
The above argument assumes that the cloud passes the probe in the same time in each case. But the
slower the flow, the longer the cloud takes to pass the probe. Thus flow is also inversely
proportional to the cloud-passing time. Detailed mathematics will not be covered here because the
conductivity metre is usually supplied with detailed instructions. The equipment needed for `salt
gulp' flow measurement is:
a bucket,
pure table salt,
a thermometer (range 0 - 40° C),
a conductivity meter (range 0-1000 mS),
An electrical integrator (Optional).
Figure 4.8: Salt Gulp' Flow Measurement [25]
37
GSJ: Volume 7, Issue 3, March 2019 ISSN 2320-9186
1145
GSJ© 2019 www.globalscientificjournal.com

4.2.2. Determination of head
Head measurements play an important role in determination of hydroelectric system parameters
such as hydro turbine selection, system efficiency and hydrodynamic issues. For example; Kaplan,
Cross-flow, Francis or Pelton turbines, hydrodynamics of turbine runner blade or bucket design,
penstock material and strength, valve types, etc. are all impacted directly by the head
measurement. All of these in turn impact the engineering and financial side of the micro
hydropower system design.
Figure 4.9: Head Lay Out [25]
There are three accurate hydropower head measurement methods, these are:-
1. Surveyor’s Transit or Levels and a pole
This method uses a Surveyor’s transit or contractor’s levels and a marked pole. You can use 6.1
meter section of PVC (Polyvinyl chloride) pipe marked with a measuring tape attached for easier
reading. The transit can be replaced by a straight board and level for economy, watch out for
hydro head error buildup with short segments or warped boards or bad leveling though.
38
GSJ: Volume 7, Issue 3, March 2019 ISSN 2320-9186
1146
GSJ© 2019 www.globalscientificjournal.com

Figure 4.10: Surveyor’s Transit or Levels and a Pole Head Measurement
1. Surveyor’s Transit or Levels and a pole
By measuring the pressure in the hose, you can calculate the elevation change of your system. This
method relies on the constant that each vertical foot of HEAD creates 0.433 psi of water pressure.
(100 vertical feet would create 43.3 psi.). Allow the gauge pressure transients to settle to a stable
reading. Multiply by 2.31 that will give you feet of head, if the distance is short enough, you can
use one or more garden hoses to measure Head.
Figure 4.11: Measure Hydro Head with a Pressure Gauge & Hose
The formula is = A psi x 2.31 ft/psi = B feet of head or in meter, A psi x 0.704 m/psi = B Meters
39
GSJ: Volume 7, Issue 3, March 2019 ISSN 2320-9186
1147
GSJ© 2019 www.globalscientificjournal.com
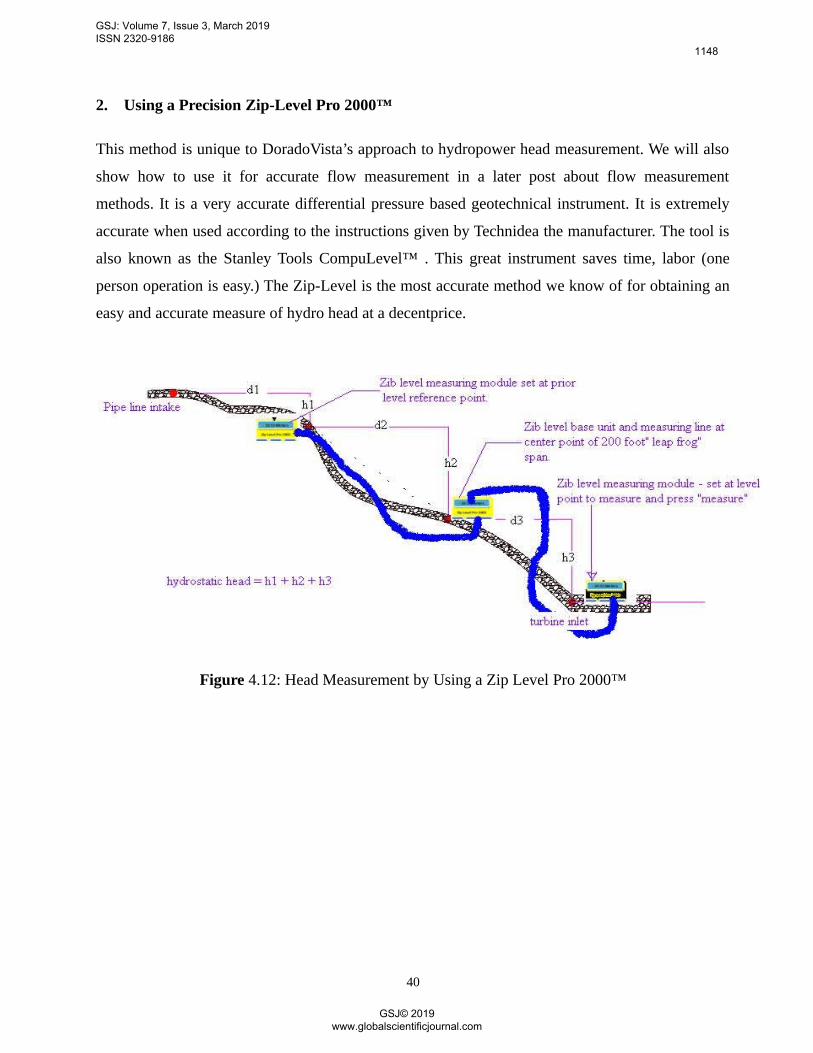
2. Using a Precision Zip-Level Pro 2000™
This method is unique to DoradoVista’s approach to hydropower head measurement. We will also
show how to use it for accurate flow measurement in a later post about flow measurement
methods. It is a very accurate differential pressure based geotechnical instrument. It is extremely
accurate when used according to the instructions given by Technidea the manufacturer. The tool is
also known as the Stanley Tools CompuLevel™ . This great instrument saves time, labor (one
person operation is easy.) The Zip-Level is the most accurate method we know of for obtaining an
easy and accurate measure of hydro head at a decentprice.
Figure 4.12: Head Measurement by Using a Zip Level Pro 2000™
40
GSJ: Volume 7, Issue 3, March 2019 ISSN 2320-9186
1148
GSJ© 2019 www.globalscientificjournal.com

4.3. Load Calculation
Once it has been estimated the hydropower data of the given site, in the next step it will be
attempted to estimate the electrical load demand of the community which is the most significant
steps in the design of a hydro power system. In the current study, Dombit which have 995 people
(199 households) and nib gasha saint marry monastery which have 30 people (30 households)
village community, are considered. A community school and religious institutions are also
provided for the community. The load is of two types, a primary load, i.e., a load that must be met
immediately, and a secondary load, i.e., a load that must be met within a certain time frame
(although the exact timing is not important). The future load demand of the community may
increase due to the rise the inhabitants in the village and additional requirement of power to use
other electrical appliances.
4.3.1. Primary Load
Primary load is electrical demand that the power system must meet at a specific time. Electrical
demands associated with lights, radio, TV and mobile charger are primary load as per the
community requirement. When a consumer switches on a light, the power system must supply
electricity to that light immediately the load cannot be deferred until later.
4.3.2. Deferrable Load
Deferrable load is electrical demand that can be met anytime within a defined time interval. Water
pump, mill are an example of deferrable load because the storage inherent to each of those loads
allows some flexibility as to when the system can serve them. The ability to defer serving a load is
often advantageous for systems comprising intermittent renewable power sources, because it
reduces the need for precise control of the timing of power production. If the renewable power
supply ever exceeds the primary load, the surplus can serve the deferrable load rather than going to
waste.
Calculation of Primary and Deferrable loads
Based on the Information obtained from different worker of the villages discussions held, and a
further quantitative survey conducted in the villages transpired that currently the communities are
primarily using kerosene for lighting, and dry cells. All households and institution establishments
41
GSJ: Volume 7, Issue 3, March 2019 ISSN 2320-9186
1149
GSJ© 2019 www.globalscientificjournal.com
maximum require lighting for 5 hours per day. Currently this is being met primarily with kerosene,
candle and dry cells. Based on information obtained, the quantitative non-cooking energy usage
and expenditure pattern assessment survey, the energy needs of rural households and commercial
establishments is characterized as follows. This has been done as per the two villages’ community
requirement.
Deferrable electrical load calculation
The deferrable load includes water pumps two in number for the monastery, eight for the Dombit
village. Each pump with a 150W power rating on bases of the maximum head on site and a
pumping capacity of 10 lit/min. These are able to pump 19900 lit/day for the 199 families (100
liters per family) and 3000 lit/day for the monastery. The deferrable load calculation for the total
households of the Dombit village and the monastery is given bellow. The water pumps operate 5
hour per day.
E = N× P× h 4.2
E1 = 8×150W×5hr = 6000Wh = 6.0kWh (for the village)
E2 = 2×150W×5hr = 1500Wh = 1.5kWh (for the monastery)
Therefore the total electrical energy requirement is:
Etotal = E1 + E2 = 6.0kWh + 1.5kWh = 7.5 kWh
Primary electrical load calculation
Primary load is electrical demands associated with lights, radio, and TV as per the community
requirement. Concerning about lighting, there are three different types of lamps options such as
incandescent, fluorescent/compact fluorescent and light emitting diode (LED). Here it has been
selected compact fluorescent lamp which is superior efficiency and longevity compared to an
incandescent lamp. It consumes quarter of the energy compared to an incandescent lamp. In
addition these bulbs generally work in either alternating or direct current system though the weight
must much the system’s nominal voltage and current type. Comparison compact fluorescent and
incandescent between is given in table 4.1 bellow.
42
GSJ: Volume 7, Issue 3, March 2019 ISSN 2320-9186
1150
GSJ© 2019 www.globalscientificjournal.com

Table 4.1: Comparison between Compact Fluorescent and Incandescent Lamps
Comparison criteria Compact fluorescent Incandescent
image
Energy Input (watts) 14 60
Light Output (lumens) 810 830
Useful life (hours) 10,000 1500
No. of bulbs 1 6.7
The type and power rating of the electric appliances that are going to be used by the community is
given on the following table so that it enable to estimate all the power required by the village and
monastery in the site.
Table 4.2: Typical Wattage Requirements for Electric Appliance
Types of electric appliance Power ratting in Watt
Compact fluorescent 14
Radio receiver/Caste player 15
14 color television‖50
Libratory equipment5184.15
The energy demand requirement of the households in the given village is different depend on their
current economic status. Therefore, the community is classified in to three categories according to
their energy demand.
The maximum power of primary load per household in the Dombit village is nearly to be 121 W
(15W radio receiver/Caste player, four 14W light bulbs and 50 W 14’’ color Television). The total
43
GSJ: Volume 7, Issue 3, March 2019 ISSN 2320-9186
1151
GSJ© 2019 www.globalscientificjournal.com

daily energy consumption of the families is 63,985Wh, if they are using 5 hours per day. And total
daily energy consumption institutions of the model Keble is depicted in table 4.2.
Table 4.3: Household Energy Demand Size of Dombit Village.
Daily power use ofElectrical Appliances No. of Use Hour per day System size [Watt]
household[Wh/day]
2bulb + Radio\ Caste player 79 5hr 43 16,985
3bulb + Radio \Caste player 80 5hr 57 22,800
4bulb + Radio\ Caste40 5hr 121 24,200
player+14" color TV
Total 199 15 221 63,985
Table 4.4: Monastery and Dombit Institution Daily Energy Demand
InstitutionsElectrical
WattUse hours per Daily energy
Appliances day use(Wh/day)
Monastery households 40bulbs 560 8 4,480
Monastery church 6bulbs 84 8 672
Dombit church 6bulbs 84 8 672
Dombit school12 bulb +14"
218 7 1,526color TV
10 bulbs 140 16 2240
Dombit health 14" color TV 50 24 1200
Center(Clinic) Libratory5184.15 8 41473.2
equipment
Total 6320.15 79 52263
Since the deferrable and primary load energy requirement once it estimated individually, the next
step is to estimate the total daily energy consumption for all of cosumptions. The total daily energy
consumption is therefore the sum of power consumption household of the monastery and Dombit
village, school and church, plus the deferrable load, which adds up to 78.7kWh.
44
GSJ: Volume 7, Issue 3, March 2019 ISSN 2320-9186
1152
GSJ© 2019 www.globalscientificjournal.com

Etotaldaily = Ediff + EDo + Ein 4.3
But, Ediff = 7.5kWh EDo = 63,985kWh Ein= 52.263kWh
Etotaldaily = 7.5kWh +63,985kWh + 52.263kWh = 123.748kWh/day
Peak Load
Interest of the people to use the appliance is vary with time and demand type, but the maximum
requirement of the hydropower system will exist when all the appliances are turn ON at the same
time and this load is called the peak load of the system. The peak load can be found by dividing the
total daily demand of the site with the operating hour of the appliances, i.e.
Peak load(kw) = ( electricity Demand(kwh))(hour of operation) 4.4
Peak load(kw) = 123.748kWh
5hour
= 24.75kW
And also there is additional appliance for the site i.e. grain mills (flour mills). For the case of this
thesis one machine for the Dombit and another machine for the monastery. A total of two grain
mills machine is applied. Each machine is consuming 15kw power.
So the total peak load is 15 + 15 +24.75 =54.75kW
Load Factor
The load factor of an energy technology is the ratio (expressed as a percentage) of the net amount
of electricity generated by a power plant to the net amount which it could have generated if it were
operating at its net output capacity. For any type of power plant it is possible to calculate the
probability of it not being able to supply the expected load. [16].
45
GSJ: Volume 7, Issue 3, March 2019 ISSN 2320-9186
1153
GSJ© 2019 www.globalscientificjournal.com

Table 4.5: Load Factor of Different Energy Technology, Source: [16]
Energy Technology Load factor
Sewage Gas 90%
Farmyard Waste 90%
Energy Crops 85%
Landfill Gas 70-90%
Combined Cycle Gas Turbine (CCGT) 70-85%
Waste Combustion 60-90%
Coal 65-85%
Nuclear Power 65-85%
Hydro 40-60%
Wind Energy 25-40%
Wave Power 25%
The load factor of hydro power varies according to the site and the type of turbine, where as for
this thesis takes the maximum i.e. 60%.
Peak load(kw) = 54.75/ 0.6 4.5
Therefore, the design load of the system is 91.25kW
46
GSJ: Volume 7, Issue 3, March 2019 ISSN 2320-9186
1154
GSJ© 2019 www.globalscientificjournal.com

CHAPTER FIVE
MICRO HYDRO POWER SYSTEM DESIGN ANALYSIS
5.1. Introduction
Once the all the input resources data have been estimated and analyzed, the next step to design and
model the micro hydro power system. Micro hydro power systems can be designed using
analytical methods and computer simulation based methods. Foremost, micro hydro power system
model is attempted to design analytically and then followed by using simulation programs. The
4.75
GSJ: Volume 7, Issue 3, March 2019 ISSN 2320-9186
1155
GSJ© 2019 www.globalscientificjournal.com

most popular simulation programs currently in use today are Ansys, CFD like Fluent, MATLAB,
and Solid Work etc. But here, due to time limitation the work is done only by analytically.
Weir
Weir for hydropower needs detail design, but for micro type it works only to divert the flow, so
detail design it may not be necessary. In this thesis intake and rectangular type of weir is selected
and sized.
Weir Water way (L)
It is the width provided at the site for the river water to flow. In other word, it is the length of the
weir. Approximate water way to provide between the abutments may be calculated from lacey’s
regime perimeter formula.
Pw Q 5.1
Where Pw – is the wetted perimeter at the site at the river, but in this case it denotes the length of
the weir between the abutments in meter and denoted by L.
Pw 4.75 0.424
= 3.1
Q – The maximum design discharge in m3/s
Q = Cw L H 0.55.2
47
GSJ: Volume 7, Issue 3, March 2019 ISSN 2320-9186
1156
GSJ© 2019 www.globalscientificjournal.com

For the Rectangular Weir without Contracted End
Where: Q = discharge, (m3/s)
Cw = weir coefficient, 1.84
L = weir length, (m)
H = head above weir crest, (m)
H= ((0.424)/1.84x3.1) 5.3
H = 0.273meter
Discharge intensity (q)
Discharge intensity (q) = (0.424m3/s)/3.1m = 0.137 5.4
Where
H-Total energy level above the crest of the weirq
H = ( 1.71 ) 2/35.5
= 0.186 meter
To get proper design take the maximum value i.e. 0.273
H =Hsd + ha 5.6
ha – velocity head.
Hsd – water head above the crest of the weir
Normal scour depth (R)
R 1.35x( q
f )1/ 3
5.7
Where q – discharge intensity.
f – Silt factor for standard silt 1.5
R – Scour depth
Then
R = 0.61meter
48
GSJ: Volume 7, Issue 3, March 2019 ISSN 2320-9186
1157
GSJ© 2019 www.globalscientificjournal.com

Regime velocity
Under the flood condition when the weir expected to attain regime condition
Regime velocity Vq
R
Where R – scour depth
V= 0.225m/s
Approach velocity head, ha V^22g
ha = 0.00257 Thus water head above the crest of the weir.
Hsd = H – ha
= 0.273 - 0.00257 = 0.27m
5.8
5.9
5.10
Channel
There are many different shapes of channel that flow occurs in and it is often necessary to estimate
the flow rate in the channel for engineering purposes, such as for designing concrete drainage
channels to handle the flow of storm water. Different channel types include:
Flow in Part full pipes.
Flow in Part full rectangular sections.
Flow in Rectangular channels.
Flow in Flat bottomed channels (with sloping sides).
Flow in V shape channels.
The size of the channel cross-section should be obtained from design drawings or measured in
the field. From this different type of channel due to its simplicity for construction select the
rectangular type for this work.
49
GSJ: Volume 7, Issue 3, March 2019 ISSN 2320-9186
1158
GSJ© 2019 www.globalscientificjournal.com

Figure 5.1: Rectangular Channel
Q = VA 5.11
A = Flow cross-sectional area [m2]
V = Average velocity of the water [m/s] according to K.N Sharmas (water power eng)
Q = Discharge or flow rate [m3/s]
V = k/n R^ (2/3) S^ (1/2) 5.12
R = A P 5.13
A = by = y25.14
P = 2y + b = 3y 5.15
b = Channel bottom width [m]
y = Water depth [m]
P = Wetted perimeter [m]
k = unit conversion factor = 1
n = Manning coefficient (n = 0.014, see Appendix-J)
R = Hydraulic radius of the flow cross-section (m).
S = Slope of channel bottom or water surface [m/m]. Vertical distance divided by horizontal
distance or is the slope of the water surface or the linear hydraulic head loss (S = 0.8, see
Appendix-J).
By substitute these values on the above equation,
50
GSJ: Volume 7, Issue 3, March 2019 ISSN 2320-9186
1159
GSJ© 2019 www.globalscientificjournal.com

By substitute these values on the above equation,
Y = 0.833 meter
F = CY 5.16
F = free board length in meter
C = freeboard coefficient = 0.0089
By substitute these values on the above equation,
F = 0.273meter
51
GSJ: Volume 7, Issue 3, March 2019 ISSN 2320-9186
1160
GSJ© 2019 www.globalscientificjournal.com

Penstock
Figure 5.5: Alignment of Penstock
Penstock diameter
Good penstock diameter depends on three factors:
Energy (head) losses due to friction between the water flowing in the pipe and the inside
pipe wall
Pressure limitations of the pipe as a function of wall
thickness Cost of the pipe and installation
For a given flow rate, as the pipe diameter decreases the velocity of the water must increase, and
the corresponding energy loss increases. This occurs because friction is a function of velocity. As
velocity increases, friction increases. On the other hand, a larger pipe diameter would mean a
decrease in velocity and a corresponding decrease in friction (head loss). The cost of the pipe
however, increases drastically with the increase in size. The procedure presented here will help you
balance energy loss with pipe size, material, and wall thickness. The energy losses associated with
friction can be expressed directly as meters of head loss. Friction losses in the penstock
52
GSJ: Volume 7, Issue 3, March 2019 ISSN 2320-9186
1161
GSJ© 2019 www.globalscientificjournal.com

system symbolize energy that is not available for power generation.
Sizing the proper penstock diameter is done by:-
1. reading from the graph
2. analytically
Reading from the graph
To read from the graph first calculate the optimum velocity of the flow through the pipe by using
USBR Formula i.e.
V = C* 2gh 5.17
Where
C = penstock roughness constant
V = optimum velocity in m/s
G = gravitational acceleration
H = maximum height
Therefore
V = 0.0625 X 2gh
= 2.4m/s
= 7.9 f/s
53
GSJ: Volume 7, Issue 3, March 2019 ISSN 2320-9186
1162
GSJ© 2019 www.globalscientificjournal.com
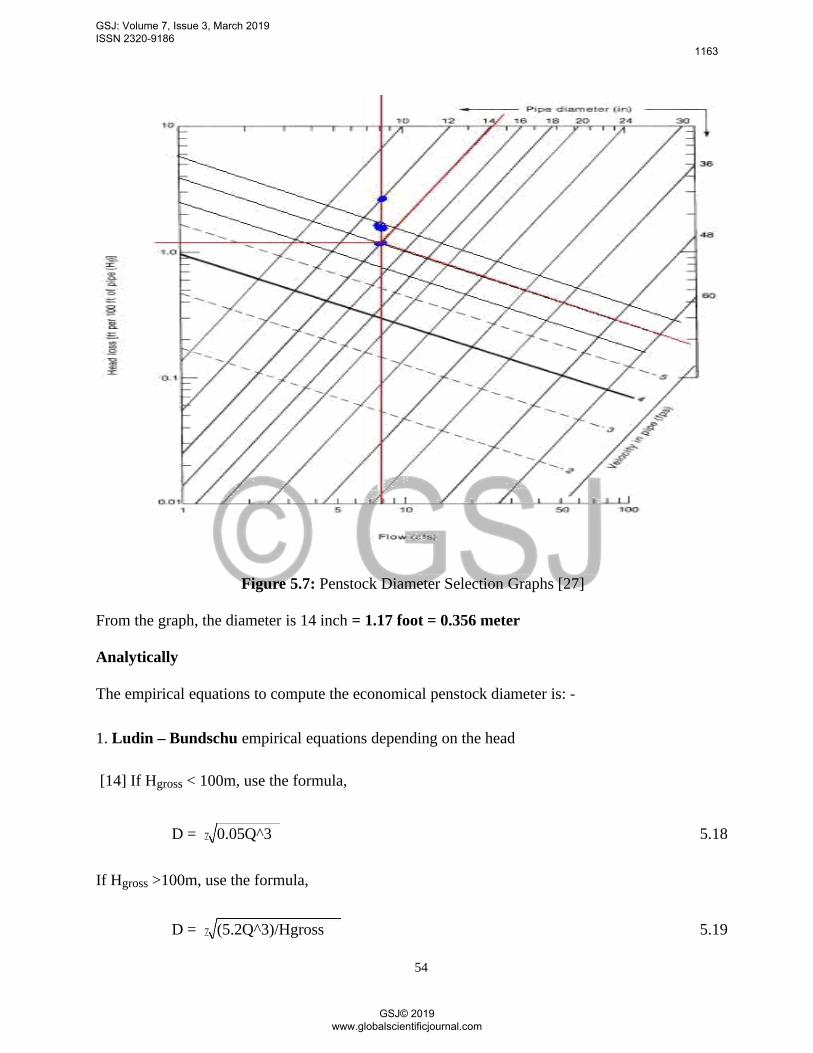
Figure 5.7: Penstock Diameter Selection Graphs [27]
From the graph, the diameter is 14 inch = 1.17 foot = 0.356 meter
Analytically
The empirical equations to compute the economical penstock diameter is: -
1. Ludin – Bundschu empirical equations depending on the head
[14] If Hgross < 100m, use the formula,
D = 7 0.05Q^3 5.18
If Hgross >100m, use the formula,
D = 7 (5.2Q^3)/Hgross 5.19
54
GSJ: Volume 7, Issue 3, March 2019 ISSN 2320-9186
1163
GSJ© 2019 www.globalscientificjournal.com
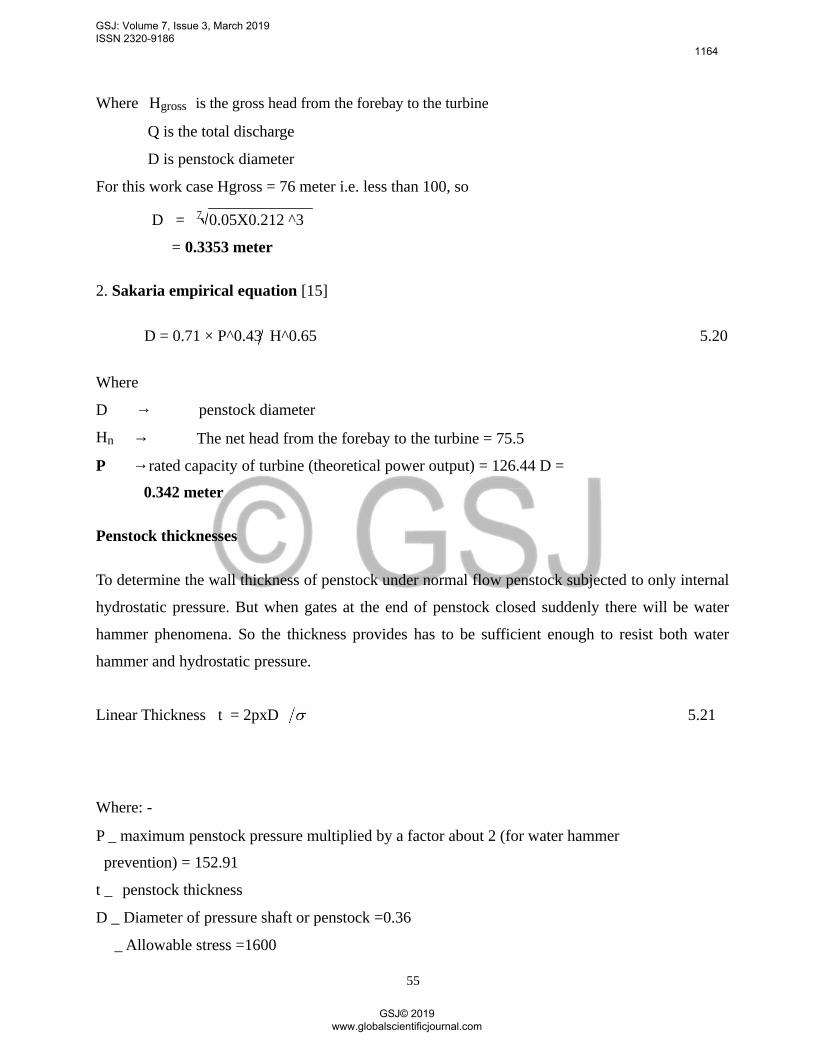
Where Hgross is the gross head from the forebay to the turbine
Q is the total discharge
D is penstock diameter
For this work case Hgross = 76 meter i.e. less than 100, so
D = 7 0.05X0.212 ^3
= 0.3353 meter
2. Sakaria empirical equation [15]
D = 0.71 × P^0.43 H^0.65 5.20
Where
D → penstock diameter
Hn → The net head from the forebay to the turbine = 75.5
P →rated capacity of turbine (theoretical power output) = 126.44 D =
0.342 meter
Penstock thicknesses
To determine the wall thickness of penstock under normal flow penstock subjected to only internal
hydrostatic pressure. But when gates at the end of penstock closed suddenly there will be water
hammer phenomena. So the thickness provides has to be sufficient enough to resist both water
hammer and hydrostatic pressure.
Linear Thickness t = 2pxD 5.21
Where: -
P _ maximum penstock pressure multiplied by a factor about 2 (for water hammer
prevention) = 152.91
t _ penstock thickness
D _ Diameter of pressure shaft or penstock =0.36
_ Allowable stress =1600
55
GSJ: Volume 7, Issue 3, March 2019 ISSN 2320-9186
1164
GSJ© 2019 www.globalscientificjournal.com

There fore
t = 2x152.91x0.36/1600
= 17mm
Additional thickness for protection of corrosion is provided around
1.5mm Total thickness = 18.5mm
Penstock Materials
The turbine manufacturer may have recommended a certain material for the penstock. You may
want to consider other material that might be less expensive. The most common penstock materials
include:
PVC (polyvinyl chloride)
Steel
Polyethylene
FRE (fiber reinforced epoxy)
Transite (asbestos cement).
To select penstock material, for each of these materials, you must consider a number of factors:
Cost
Availability
Physical properties
Joining methods and installation limitations.
The selection of penstock material and penstock wall thickness highly depends on the pressure that
the pipe will experience. There are two types of pressure to be considered:
Static pressure, which is the pressure at the bottom of the pipe when the pipe is filled and the
water, is not flowing.
Pressure waves, which are caused when the amount of water flowing is suddenly changed, as by
opening or closing a valve.
Static pressure depends on the head in the penstock. Pressure waves depend on how fast the flow
changes in the penstock.
To aid in determining the design pressure rating of the penstock and selecting the suitable pipe
56
GSJ: Volume 7, Issue 3, March 2019 ISSN 2320-9186
1165
GSJ© 2019 www.globalscientificjournal.com

material, Appendix-J lists the wall thickness(t)' pressure rating CPR)' and surge allowance factor
(SA) for pipe materials.
The static pressure in the penstock at the turbine can be determined
1. by using the Equation
S =0.433 x h 5.22
Where
S = static pressure
h = design head.
There fore
S = 0.433x76
= 32.91
2. Using the penstock diameter previously established, select from Appendix-J one or more
potential pipe materials and select the tw, P , and SA factors for these materials.R
3. For each pipe material selected, use Equation5.21 to determine the penstock design pressure (P ).
d
Pd = static pressure + pressure wave
Pd = S + (SA * V) 5.23
Where
Pd = penstock design pressure
S = static pressure
SA = surge allowance factor
v = velocity of the water in the pipe
Pd = 32.91 + (50*2.4)
= 152.91N/m2
57
GSJ: Volume 7, Issue 3, March 2019 ISSN 2320-9186
1166
GSJ© 2019 www.globalscientificjournal.com

Calculating Penstock System Head Loss
The total losses are a function of both turbulence and friction. Turbulence is caused by the intake
structure and by bends and obstructions in the pipe. Turbulence factors can best be considered by
adding equivalent pipe length to the overall length of the penstock to get the adjusted length (La).
This can be done by the following steps:
Multiply the number of 90 degree bends by 9.2 meter, Multiply the number of 45 degree bends by
4.6 meter, Add 4.6 meter for the entrance at the intake, Sum all the additions and add to the total
penstock length.
For this work the penstock length is 88 meter, and there is no bend, the pipe is installing straight
with supporter. So the adjusting length is:-
La = 88 + 4.6 = 92.6 meter 5.24
Friction losses are a function of pipe size, length, and material. The friction effect is accounted for
with the pipe material correction factors shown in Table 5.2.
Table 5.1: Friction Loss Correction Factor (Fc) [27]
Pipe Material Factor(fc)
Steel 1.16
PVC 0.77
PE 0.77
AC 0.87
FRP 0.77
To obtain the head loss due to turbulence and friction, multiply the adjusted penstock length (La)determined above by the material correction factor from Table 5-2. Multiply this number by the H
f
factor previously determined from Figure 5.7 and divides the result by 100. This final number is
the energy loss, in feet of head, for the flow, penstock length, and material selected. Use Equation
5.26 to determine total head loss. La
58
GSJ: Volume 7, Issue 3, March 2019 ISSN 2320-9186
1167
GSJ© 2019 www.globalscientificjournal.com

H1 = (fcxLaxhf) 100 5.25
Where
H1= head loss in meter
fc = friction loss correction
La= adjusted length of penstock in meter
hf = head loss factor from
H1 = (0.77X92.6X 0.3353) 100
= 0.24 meter
So the net head is = 76 – 0.24 = 75.7 meter
Turbine
From the electromechanical parts, turbine is the core of the plant in a sense that the final
hydropower output is highly depend on the performance of the turbine. Before design analytically
Selection of turbine based on the site data is the prior work. Which type of water turbine is best for
a particular situation often depends on the amount of head (water pressure) you will have in your
site and whether you want to suspend the turbine in the water (reaction) or whether you want to
use jets of water (impulse). By looking at these factors together you can get some indication of
what type of turbine design will work best:
Selection of Turbine
There are numerous parameters for selection of turbine .The usual practice is based on: Technical and economical considerations Operating head and power output Specific speed. Efficiency
Specific speed
Specific speed is the speed in revolution per minute at which the runner would run, if reduced in
size to deliver one gallon per minute against a total head of one foot. Runner for high heads usually
59
GSJ: Volume 7, Issue 3, March 2019 ISSN 2320-9186
1168
GSJ© 2019 www.globalscientificjournal.com

has low specific speed and runner for low head usually have high specific speed. Specific speed is
a useful parameter of turbine for a given condition and it is expressed as:
Ns= N P 5.26
H 5 / 4
Where: NS = specific speed
N= rotational speed (rpm)
P = power developed (kW)
H = effective head (m)
For the selected site area the specific speed is:-
NS = 150091.25
75.7^(5/4)
= 64.2rpm
Efficiency:
A significant factor in the comparison of different turbine types is their relative efficiencies both at
their design point and at reduced flows. Typical efficiency curves are shown in the figure below.
Figure 5.1: Efficiency of Various Turbines Based On Discharge Rate [19]
60
GSJ: Volume 7, Issue 3, March 2019 ISSN 2320-9186
1169
GSJ© 2019 www.globalscientificjournal.com
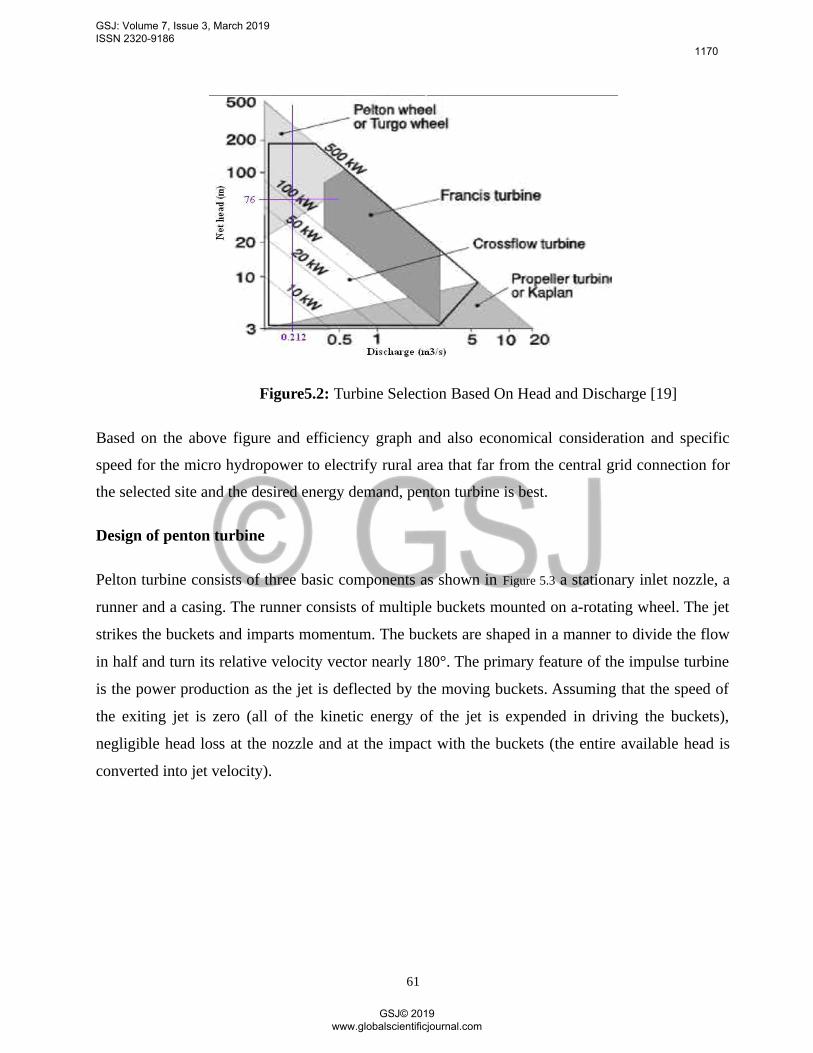
Figure5.2: Turbine Selection Based On Head and Discharge [19]
Based on the above figure and efficiency graph and also economical consideration and specific
speed for the micro hydropower to electrify rural area that far from the central grid connection for
the selected site and the desired energy demand, penton turbine is best.
Design of penton turbine
Pelton turbine consists of three basic components as shown in Figure 5.3 a stationary inlet nozzle, a
runner and a casing. The runner consists of multiple buckets mounted on a-rotating wheel. The jet
strikes the buckets and imparts momentum. The buckets are shaped in a manner to divide the flow
in half and turn its relative velocity vector nearly 180°. The primary feature of the impulse turbine
is the power production as the jet is deflected by the moving buckets. Assuming that the speed of
the exiting jet is zero (all of the kinetic energy of the jet is expended in driving the buckets),
negligible head loss at the nozzle and at the impact with the buckets (the entire available head is
converted into jet velocity).
61
GSJ: Volume 7, Issue 3, March 2019 ISSN 2320-9186
1170
GSJ© 2019 www.globalscientificjournal.com
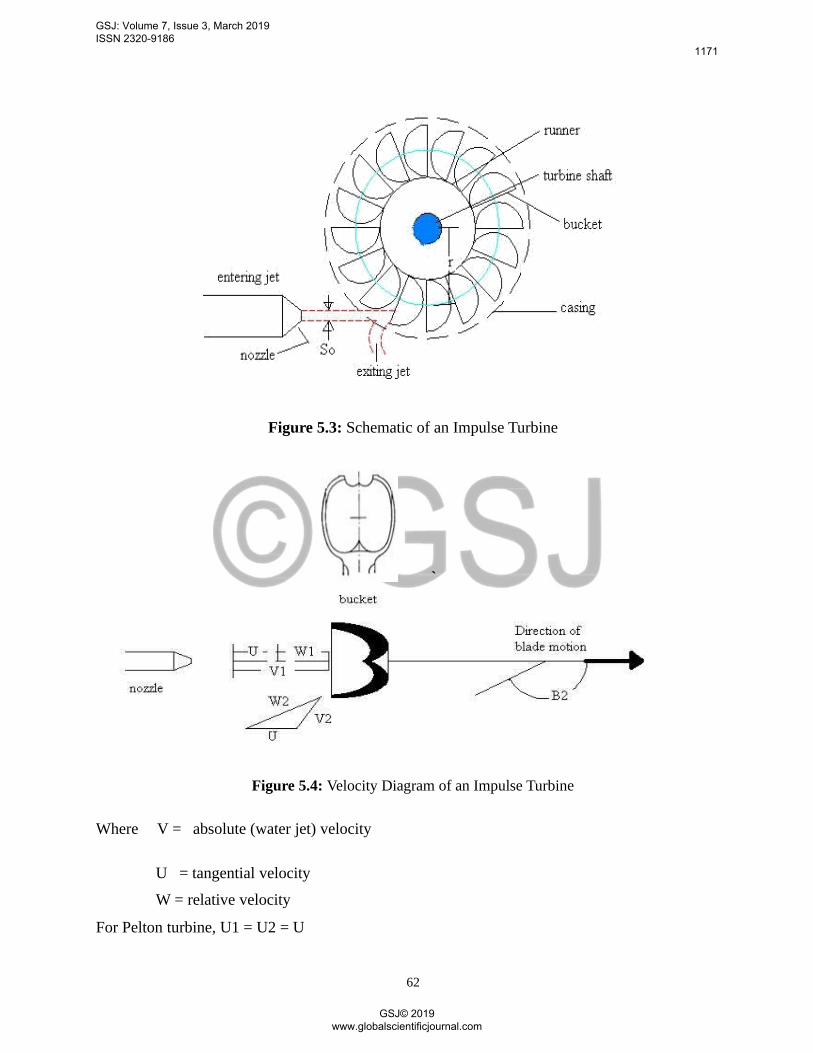
Figure 5.3: Schematic of an Impulse Turbine
`
Figure 5.4: Velocity Diagram of an Impulse Turbine
Where V = absolute (water jet) velocity
U = tangential velocity
W = relative velocity
For Pelton turbine, U1 = U2 = U
62
GSJ: Volume 7, Issue 3, March 2019 ISSN 2320-9186
1171
GSJ© 2019 www.globalscientificjournal.com

Site data
According to the head, can be classified in three categories: High head 100m and above Medium
head 30 – 100m Low head 2 – 30m
The site under consideration in the present work is a head of 76m and can be categorized high head
site. The volumetric flow rate available is 0.212m3/s.
Firm Power is the power that is always available from the stream, even at times of lowest flow and
lowest head. To calculate firm power you use the lowest expected flow in the stream (Qmin) and
the net head (Hn).
P = Qmin * g* Hg* ρ* η 5.27
Where:-
P = power (J/s or watts)
η = overall efficiency, = ηt*ηg*ηt*ηl
Qmin. = minimum flow rate (m³/s)
ρ = density of water (kg/m³)
g = acceleration of gravity (9.81 m/s²)
Hn = net head (m).
Therefore:
P = 0.80*0.90*0.92*0.90*1000*75.7*9.81*0.212
P = 93.86KW is the load that reached to the demand
63
GSJ: Volume 7, Issue 3, March 2019 ISSN 2320-9186
1172
GSJ© 2019 www.globalscientificjournal.com

Calculation of Runner rpm
The turbine and the generator are fixed (directly connected with shaft). The rated speed of the
turbine is the same as synchronous speed of the generator. The speed N for synchronous running is
given by:
N = 120 f 5.28Np
Where:
f = frequency of AC supply (50HZ)
Np = number of generator poles (4)
N = runner rpm
Then, N = 1500rpm
The speed of the turbine is an important parameter of design. The higher the speed, the smaller will
be the diameter of the turbine there for decrease material cost. High speed, however, makes the
turbine more disposed to cavitations. And also the lesser the speed gives the machine longer life
because of lesser wear and tear but increase in material cost.
Calculation of Water Jet Velocity
The water jet velocity or the absolute velocity is calculated using the head of the site, the
coefficient C accounts for the roughness in the water head i.e.
V1 = C 2gH 5.29
With H = 75.7m, g = 9.81m/s2, C = 0.98
V1 = 37.77m/s
Calculation of Runner Tangential Velocity
The maximum power is occur at V1 = 2U 5.30
U = 0.5x37.77
= 18.9m/s
64
GSJ: Volume 7, Issue 3, March 2019 ISSN 2320-9186
1173
GSJ© 2019 www.globalscientificjournal.com

Calculation of Runner (Turbine) Outer Diameter
U = rω 5.31
r = U
Ω = 2πN/60 = 2xπx1500/60 = 26.2 5.32
Then, r = 66.6cm
D = 2r = 133.2cm 5.33
Runner Inner Diameter
The suggested inner to outer diameter ratio for penton turbine is 0.7. [Aziz and Desai, 1991]
Therefore;
Runner inner diameter = 0.7x133.2 5.34
= 93.24cm
Radial rim width = (133.2-93.24)/2 5.35
= 19.98cm
Thickness of Water Jet
So = 0.2xD 5.36
= 0.2x133.2
= 26.6cm
65
GSJ: Volume 7, Issue 3, March 2019 ISSN 2320-9186
1174
GSJ© 2019 www.globalscientificjournal.com

Width of Bucket
For one nozzle turbine:-
B = 3.1X So 5.37
= 3.1x26.6
= 82.46cm
Turbine Alignement
The turbine-generator lay out can be either a horizontal shaft lay out or vertical shaft layout .In a
horizontal shaft lay out, the turbine and the generator are at the same elevation connected by a
horizontal shaft .On the other hand in vertical lay out the generator is on the top of the turbine,
both connected by a vertical shaft .for this thesis work the horizontal arrangement is preferred due
to The generator more weight than the turbine, therefore, vertical alignment is not fine for the
turbine
Selection of Material
Carbon Steel Castings are commonly used for turbine. ASTM A216 castings are of slightly higher
strength than the more commonly used ASTM A27 material. ASTM A216 material is therefore
used where increased mechanical strength is required. Keeping in view the unusually high flow
rate at the site under consideration, ASTM A216 is selected as the material for runner construction.
Besides strength, it also provides relatively better resistance against corrosion and sand erosion
(see Appendix-K).
66
GSJ: Volume 7, Issue 3, March 2019 ISSN 2320-9186
1175
GSJ© 2019 www.globalscientificjournal.com

Drive System
The drive system transmits power from the turbine shaft to the generator shaft. It also has the
function of changing the rotational speed from the one shaft to the other when the turbine speed is
different to the required speed of the alternator or device.
The following options can be considered for micro hydropower drive systems:
direct drive,
flat belt and pulleys,
V or wedge belt and pulleys,
chain and sprocket,
Gearbox.
Direct Drive
This system is only for the case where the shaft speeds are identical because it uses a flexible
coupling to join the two shafts together directly. Due to its low maintenance, high efficiency
(>98%) and low cost properties, selected for this thesis work. The only disadvantage is that the
alignment is far more critical than with an indirect drive.
67
GSJ: Volume 7, Issue 3, March 2019 ISSN 2320-9186
1176
GSJ© 2019 www.globalscientificjournal.com

CHAPTER SIX
ECONOMIC ANALYSIS OF MICRO HYDRO POWER
As with any other investment project, the economic feasibility of micro hydro projects must
be verified to attract the interest of investors, It is also of key importance in enabling
financial institutions to supply the funds necessary to finance the project in the promoter’s
own funds. A question a promoter has to answer prior to the decision to invest is taken
include the following. What are the costs incurred by the project? What will be the revenues does
the project generate a reasonable rate of return to their own investment funds? What are the
financial sources?
6.1. Cost
The cost of an MHP is site- specific. It depends on the necessary civil works, the generating
equipment and the electrical transmission/ distribution lines. While the cost of the generating
equipment is almost a linear function of power size ( in KW), the cost of civil works depends on
the physical characteristics of the site . Similarly , the cost of electrical lines depends on the type of
grid and on the distance to the connection point.
the development costs have to be taken into account : engineering studies, environmental impact
studies and the legal fees to submit the project for approval to the different public bodies involved.
Besides the investment costs, which have to be paid off duringthe initial life of the project
in the form of depreciation, operation and maintenance costs ( O& M ) have also to be
estimated and depend mainly on the permanent personnel involve, on the insurance costs
and on repair and maintenance contracts concluded with specialized firms. Certain expenses
which will not be encountered every year, like major repair / maintenance of machinery
and replacement of brushes, will also have to be take into account.
Payment of the debt and interest on bank loans will also need to be estimated. Usually the
whole calculation is made in current cost in order to avoid making estimates of inflation. Cost
evaluation must be conducted carefully because such projects are capital intensive and costs
68
GSJ: Volume 7, Issue 3, March 2019 ISSN 2320-9186
1177
GSJ© 2019 www.globalscientificjournal.com

depend very much on the characteristics of the site. In brief, the following typology of costs
applies to micro hydro projects;
6.1.1. Initial costs
Feasibility Studies and project development are typical items of MHP projects. They
include hydrological and environmental assessment, preliminary designs, permits and approvals
( for water, land use and construction), land rights, interconnection studies, power purchase
agreements (PPA), project management and financing fees.
6.1.2. Construction costs
This type of costs is incurred after the decision to go ahead with the project is taken. Such costs
include engineering, insurance premiums, civil works and equipment.
6.1.3. Operation and Maintenance costs
These are regular costs that occur on a yearly basis and include transmission line maintenance,
general administration, repairs and contingencies. Operation and maintenance cost most
importantly include maintenance of the civil works and the equipment of the micro hydropower
plant.
6.2. Assessing the Profitability of and MHP Project
Different summary measures are usually considered for the economic and financial appraisal of
investment projects. Among the most frequently used measures we can identify the following:
Payback period: number of years necessary to recover the investment. Usually we encounter
payback period from 5 to 10 years when assessing profitable MHPP projects, which themselves
can have a life span of 25 years or more. This varies according to the investment needed, tariffs
applied and Operation and maintenance expenditure.
Net present value (NPV): Sum of the discounted cash flows over the life time of the project
assuming a discount rate.
69
GSJ: Volume 7, Issue 3, March 2019 ISSN 2320-9186
1178
GSJ© 2019 www.globalscientificjournal.com

Table 6.1: Turbine Cost Analysis Using Package Soft Ware [14].
Table 6.2: Electro Mechanical and investment Cost Analysis Using Package Soft Ware [14].
Figure 6.1: Cost Break Down of Micro Scale Hydro Power [14].
70
GSJ: Volume 7, Issue 3, March 2019 ISSN 2320-9186
1179
GSJ© 2019 www.globalscientificjournal.com

Table 6.3: Breakdown Capital Costs of Temie River Micro hydro power [29]
Item Cost(Etbx103)Percentage
Remark(%)
Civil Work 2073.15 45
Electrical Equipment 691.05 15
Mechanical1151.75 25
Equipment
Project Management691.05 15
and others
Total 4607 100
Weir, Intake, Channel, Forbay,
Penstock, Power House, Tailrace.
Load controller, Electrical Generator,
Transformer, Transmission and
distribution Line.
Control panels, Nozzle, Turbine, power
transmission Shaft.
Planning, Tax, Insurance,
Transportation environmental
impact and feasibility studies.
In general, as seen from the above table 6.3. Cost of the power system is summarized. This cost
break down analysis is takes in to account: - calculated dimensions and specifications determined
in each section, world market manufacturers based on the specification, material and size
determined, the package soft ware value like Table 6.1 and Table 6.2., and the percentage
estimation cost that set in Figure 6.1.Finally after the consideration of all of these points, come to
the current economy and market stipulation of the country that the plant is designed (see appendix-
G).
71
GSJ: Volume 7, Issue 3, March 2019 ISSN 2320-9186
1180
GSJ© 2019 www.globalscientificjournal.com

The payback period is the length of time that it takes for a project to recoup its initial cost of the
cash receipts that it generates. This period is sometimes referred to as ―the time takes for an
investment to pay for itself . The basic premise of the payback period is that more quickly the cost‖
of an investment can recovered, the more desirable is the investment. The specific energy cost of
the system determines the payback period of the system. The specific energy cost can be calculated
as follows.
energycost income per yearannual energy consumptions
61
Whereas, the income per year is calculated with
incomeperyearci 6.2
(1 i)n1
[i(1 i)n]
Where, i- the interest rate and it is considered as 10% for Ethiopian economic condition.
n- The number of year.
Ci – investment cost.
After substituting all the values the income per year from the system is 506770ETB/year. And
from chapter three the annual energy demand including the pump power is 799350kWhr/year.
Therefore, the energy cost is
energy cost income per year 5067700ETB /Year 0.634 ETB799350
kwhrannual energy consumptions
yearkwhr
6.3
From the activity trends in the developed country the micro hydro power system the operation and
maintenance costs 1% of the investment cost per year. Therefore, the annual operations and
72
GSJ: Volume 7, Issue 3, March 2019 ISSN 2320-9186
1181
GSJ© 2019 www.globalscientificjournal.com

maintenance cost become 46070 /year. The expected annual saving cost per year is calculated as
follows.
Annual Saving = [Cost per unit of electricity × (Annual electricity generated by the equipment)] -
Annual Operation and Maintenance Cost.
= [ 0.634ETB/kWhr × (799350kWhr/year)] – 46070ETB/year = 461630ETB/year.
Therefore, the payback period of the system is
paybackperiod investmentcost 9.98 yearsAnnual Saving 6.4
Since in micro hydro power plant construction the great expense is investment cost. The maintenance
and operation cost is not so much. There for the result of the payback period (PP) is not more than 10
years which is a reasonable period.
73
GSJ: Volume 7, Issue 3, March 2019 ISSN 2320-9186
1182
GSJ© 2019 www.globalscientificjournal.com

CHAPTER SEVEN
RESULT AND DISCUSSION
As see from the Table 1.1., the total expense for energy is 1218233ETB per year. When we see the
twenty five years expense, it will be 30455825.00 that are too large compared to the micro hydro
power the twenty five years expense i.e. 5758750.00 and also currently the population have no TV
and libratory equipment access. In addition to this, all of the energy sources that are listed in the
Table 1.1. have their own negative impact on the environment and life of the society. Therefore
when takes in account environmental pollution and total expense, the micro hydro power plant that
designed by this theses is vital for the Dombit and saint marry monastery as well as for the local
government.
As see from appendix-A and –B, the village that selected in this thesis is second block and the
energy cost is 0.3564 for the domestic and 0.6088 for the commercial the average is 0.4826. And
the calculated energy cost in this thesis is 0.634 (see equation 4.3) which is approximately the
same to the current Ethiopia electric tariff. This indicated that cost analysis of the design is fair.
Here on the design of turbine the specific speed is 64.2rpm (see equation 5.27) which is indicated
that the runner is categorized as fast runner turbine (see table 6.1 below). High specific speed for a
given head will result in a smaller turbine and generator, with saving in capital cost. But it needs
proper material selection that has better Mechanical properties (strength). For this work Carbon
Steel ASTM A216 castings are selected in the reason that it has slightly higher strength and work
at low temperature (see Appendix-M).
Table 7.2: Specific Speed of Various Turbines
Type Runner Ns (rpm)
Slow medium Fast
Pelton 4 to 15 16 to 30 31 to 70
Francis 60 to 150 151 to 250 251 to 400
Kaplan 300 to 450 451 to 700 701 to 1100
74
GSJ: Volume 7, Issue 3, March 2019 ISSN 2320-9186
1183
GSJ© 2019 www.globalscientificjournal.com

For penton turbine, by using equation 4.5, the power is 91.25kw, to get analytically the bucket
velocity which is the power will be maximum, differentiate the power with the bucket velocity by
using turbine vector equation i.e. P= mu(v1-u)*(1-kcoseβ). And finally the power is maximum at
v1 = 2u. From the result of the equation 5.4, u =0.5*v1 = 18.9m/s, to show this with soft ware for
this thesis case use math lab.
Figure 7.1: Bucket Velocity versus Power Graph.
As see from the graph at 18.9m/s bucket velocity, the power is around15.7KW which is less than
that of done by analytically, this is due to some assumption like that of turbine efficiency and
others, anyway the load that consumed by the site households have to less than this value,
otherwise the bucket will be failed. Whereas for this thesis case the need is 91.34KW that is less
than the maximum power there for the design is safe.
75
GSJ: Volume 7, Issue 3, March 2019 ISSN 2320-9186
1184
GSJ© 2019 www.globalscientificjournal.com

CHAPTER EIGHT
CONCLUSION AND RECOMMENDATION
Micro-hydro power on Temie River has confirmed very successful as a tool to help Dombit and
saint marry people to develop their economic position and to improve their life-style. It provides
extra service in the area to reduce the toil of food processing and it can offer a means of generating
electric power.
The total expenses of the society for power is reduced by 18.9% and also if the kebelle
administration is try to use the power efficiently, they can improve their life style with additional
service that is not listed in this thesis (see appendix- O) because rating capacity of the river
(126KW) is larger than the current electric load demand of the village (91.25KW).
Exercising of the project practically is not only the success of the Dombit and saint marry village
but also for the world because it mitigate environmental pollution.
The financing of the installation of the technology through loans and subsidies is needs careful
planning.
In general most of the time, micro hydropower is installed in area, which far from the central grid
(urban area) like Dombit and saint marry monastery, So there is luck of intellectual human power,
who can maintain the plant when any trouble is occurred and also the economy of the society is not
as much of. Therefore the local man powers have to train.
Currently in amhara region have more than 26 hydropower capacity, where as there is scarcity of
electricity especially in rural areas, so anybody should toiling up to full fill the five year
Government transformation plan by changing these micro hydro power sites in to practical work
by takes as a reference this work.
As recommendation,
In view of the fact that the government alone cannot afford electrifying rural areas of
Ethiopia By micro hydropower, so maximum effort must be exerted to transform the
current attitude towards the private investors and NGOs to electrify rural off grid areas like
that of Dombit and Nib gasha villages.
Even though the study is based on the selected site area, can apply other micro hydropower
plants by changing value of the site data’s.
76
GSJ: Volume 7, Issue 3, March 2019 ISSN 2320-9186
1185
GSJ© 2019 www.globalscientificjournal.com

As seen from the Appendix-P the population that dwell around the site river (Temie River)
have been utilized the river for irrigation, due to this reason the flow rate of the river is
dwindle year to year, typically these who live above the diversion of the plant. So before
the installation of the plant, the Government as well as the local kebelle administration has
to take an assignment to solve these problem see appendix-P.
In the thesis the electrical part of the plant and some other parts are not sized, so anybody
who is interested can go ahead these parts.
77
GSJ: Volume 7, Issue 3, March 2019 ISSN 2320-9186
1186
GSJ© 2019 www.globalscientificjournal.com

Reference
1. Aklilu Dalelo (PhD). (n.d.). Rural electrification in Ethiopia: Opportunities and
Bottlenecks. Addis Ababa University, Ethiopia.
2. Anderson, D., and Khennas. (1999).Rural Energy Services - a Handbook for Sustainable
Energy Development, ITP. University of Warwick, UK.
3. Anrsremrdpa. (January, 2008). Small Hydropower Potential in the Region. Swedish.
4. Atilbulu (Prof, PHD).(n.d.).Hydroelectric power plants. College of civil engineering,
Istalbul technical university, Turkey.
5. Federal democratic republic of Ethiopia ministry of water resources, water sector
development program. Main report volume ii.(October, 2002).Ethiopia.
6. Geogr, H. (2003) Approach to the Dissemination of mini & micro hydropower the-case of
Ethiopia. World Bank, US.
7. Hans, Petter. (Jan, 2003).A Feasibility Study on the Implementation of a Micro-Hydro
Scheme in Somalia, Zambia.
8. Hough, R., J.A., and Crowe, C.T. (1993). Engineering Fluid Mechanics, 5th edition. New
Zealand.
9. http:// www.bwaa.com/energy/rely.htp. The british wind energy association. Retrieved from
September 11, 2010.
10. http://www.fun-led-light.com/incandescent-vs-fluorescent.html. Retrieved 20 may 2011.
11. http//:www.Industrial penstocks.co.uk/stoplogs. Retrieved 12 March 2011.
12. http://www.Engineering .lancs.ac.uk. Retrieved 12 March 2011.
13. http://www.gtz.de. Renewable energies in Ethiopia. Retrieved 20 may 2011.
14. http://www.ren21.net. Renewables–GlobalStatusReport2006Update. Retrieved April 19
2010.
15. http://en.wikipedia.org/wiki/Electricity.Statistics/Electricity and heat by country. Retrieved
October 21 2010.
16. Hydropowerengineering.retrievedfromhttp://studyvalue.com/_civil_engineering/hydropow
er_engineering/hydropower_advantages_4.html. Retrieved 13 March 2011.
17. HydropowerFundamentals.http://www.alternativeenergyresources.net/hydroelectricity.html ,
retrieved 20 may 2011.
78
GSJ: Volume 7, Issue 3, March 2019 ISSN 2320-9186
1187
GSJ© 2019 www.globalscientificjournal.com

18. Jos´e, Liria Monta˜n´es.(September, 2009). Hydraulic canal design, construction, regulation
and maintenance. United Kingdom.
19. Klaus, Joarde. (n.d.). Good and bad of mini hydropower. Volume1. Germen.
20. Mark.T. (September, 2004). A Feasibility Study for a Microhydro Installation for the
Strangford Lough Wildfowlers & Conservation Association. Thesis (Msc), University of
Strathclyde, UK.
21. Manfred, O. (2003). an Interdisciplinary Approach to the Dissemination of Mini and Micro
Hydropower - the Case of Ethiopia. Ethiopia.
22. Mcgraw, H. (1994). Fluid Mechanics, 3rd edition. New York.
23. Mengistu Teferra. (November, 2000). Energy for Rural Development in Ethiopia. Ethiopia.
24. M., Nechleba. (1957). Hydraulic Turbines Their Design and Equipment. England.
25. Practical action.org/micro hydro/.. Retrieved January 11 2011.
26. R., K. Bansal. (Jun 9, 2011).Fluid Mechanic and hydraulic machines. India.
27. Smail, K., and Andrew, B. (May, 2006). Micro-hydro power: an option for socio-economic
development. South Africa.
28. Solomon, S. (1998) Hydropower of Ethiopia: Status, Potential and Prospects. Ethiopia.
29. Tamburrini, M. (September, 2004). Feasibility Study for a Microhydro Installation for the
Strangford. Glasgow, UK.
30. Zelalem, Alemu. (2006). Renewable Energy Support Policy Options for Sustainable
Development: Using the Analytic Hierarchy Process: The case of Rural Ethiopia. Delft
University of technology. Netherland.
79
GSJ: Volume 7, Issue 3, March 2019 ISSN 2320-9186
1188
GSJ© 2019 www.globalscientificjournal.com

APPENDIXES
Appendix-A: Current (Augest16, 2011) Ethiopia electric tariff for domestic Service
Division Energy in kwh Tariff in birr/kwh
1st block 0-50 0.273
2nd block 51-100 0.3564
3rd block 101-200 0.4993
4rth block 201- 300 0.55
5thblock 301-400 0.5666
6 th block 401-500 0.588
7th block > 500 0.6943
Appendix-B: Current (Augest16, 2011) Ethiopia electric tariff for Commercial Service
Division Energy in kwh Tariff in birr/kwh
1st block 0-50 0.6088
2nd block50 < 0.6943
80
GSJ: Volume 7, Issue 3, March 2019 ISSN 2320-9186
1189
GSJ© 2019 www.globalscientificjournal.com

Appendix-C: Small Hydro Power Potential Site and Rivers Capacity in Amhara National Regional State
CatchRiver Energy Discharg Firm
Name of ment Head InstallationNo Zone Woreda length potential e Flow output
River area (M) Capacity(KM) (KW) (CMS) (KW)(KM2)
1 W/Gojjam Mecha Gilgel Abay 1148 66.5 164000 6 4.012 195.5 135.7
2 W/Gojjam Achefer Kilte 490 46.7 9260 5 0.397 14.43 5.3
3 W/Gojjam B/Dar Zuria Andassa - 1 401 65.7 21000 5.4 2.2 88.89 43.5
4 W/Gojjam B/Dar Zuria Andassa - 1 401 65.9 21400 11.6 1.03 88.89 88.8
5 W/Gojjam B/Dar Zuria Andassa - 1 401 66.2 21800 11.6 1.03 88.89 88.8
6 E/ Gojjam Hunet ejju Enese Temie 119 35.5 14300 76 0.212 122.2 122
7 E/ Gojjam Hunet ejju Enese Azawari-1 191 40.3 12500 5 0.797 28.86 9.5
8 E/ Gojjam Hunet ejju Enese Azawari-1 191 40.4 12600 76 0.212 122.2 122.2
9 W/Gojjam B/Dar ZuriaAndassa
298 27.9 11900 11.6 1.03 88.89 69Brach
10 W/Gojjam Mecha Koga 174 34.5 13300 4.8 1.22 44.44 25.5
11 E/ Gojjam Dejen Suha shet 488 49.6 20300 92.1 0.212 166.66 166.6
12 E/ Gojjam Dejen Muga hayk 524 79.4 29600 47.3 0.446 166.66 168.6
13 W/Gojjam Denbecha Gula-1 221 36.4 34700 9.2 0.42 26 16.7
14 W/Gojjam Denbecha Gula-2 221 39.4 34800 11.4 0.522 40 22
15 W/Gojjam Denbecha Temcha 400 38.2 72900 14 0.6 59.8 59.8
16 E/ Gojjam Machakel Gedaba-1 677 70 107000 30.4 0.708 166.66 127
17 E/ Gojjam Machakel Gedaba-2 810 89.6 150000 45.1 0.62 222.2 195.7
18 W/Gojjam Jabitenan Lahi 366 51 37800 19 0.422 59.6 49
19 W/Gojjam Jabitenan Birr 186 30.4 7800 10 0.154 13.6 13.6
20 W/Gojjam Banjashikudad Fettam-1 216 28 6600 25 1.36 277.8 102
21 Awi Wonberma Fittame-3 720 89.1 122000 58 0.966 434 235
22 Awi Ankisha Fettam-2 305 48.5 25800 18 1.492 224 71.8
23 Awi Dangila Asher 338 41.2 35800 11 1.912 166.66 75.5
24 Awi Gowangoa Ardie 251 52.6 35600 14.5 0.788 92 80
25 Awi Gowangoa Dura 619 74.8 151000 26 2.364 519 228
26 E/ Gojjam GozamenChemoga 1391(GW
290(MW)Yeda (I %&ii) H/Yr)
81
GSJ: Volume 7, Issue 3, March 2019 ISSN 2320-9186
1190
GSJ© 2019 www.globalscientificjournal.com

Appendix-D: Penton Turbine Model and Rated Capacity
82
GSJ: Volume 7, Issue 3, March 2019 ISSN 2320-9186
1191
GSJ© 2019 www.globalscientificjournal.com

Appendix-E: Coupling of Pentone Turbine with Generator
Appendix-F: Model of Different Turbine and Generator
83
GSJ: Volume 7, Issue 3, March 2019 ISSN 2320-9186
1192
GSJ© 2019 www.globalscientificjournal.com

Appendix-F: Electrical Components of micro hydro power
84
GSJ: Volume 7, Issue 3, March 2019 ISSN 2320-9186
1193
GSJ© 2019 www.globalscientificjournal.com

Appendix-G: Man power cost Estimation for the construction of micro hydro power
85
GSJ: Volume 7, Issue 3, March 2019 ISSN 2320-9186
1194
GSJ© 2019 www.globalscientificjournal.com
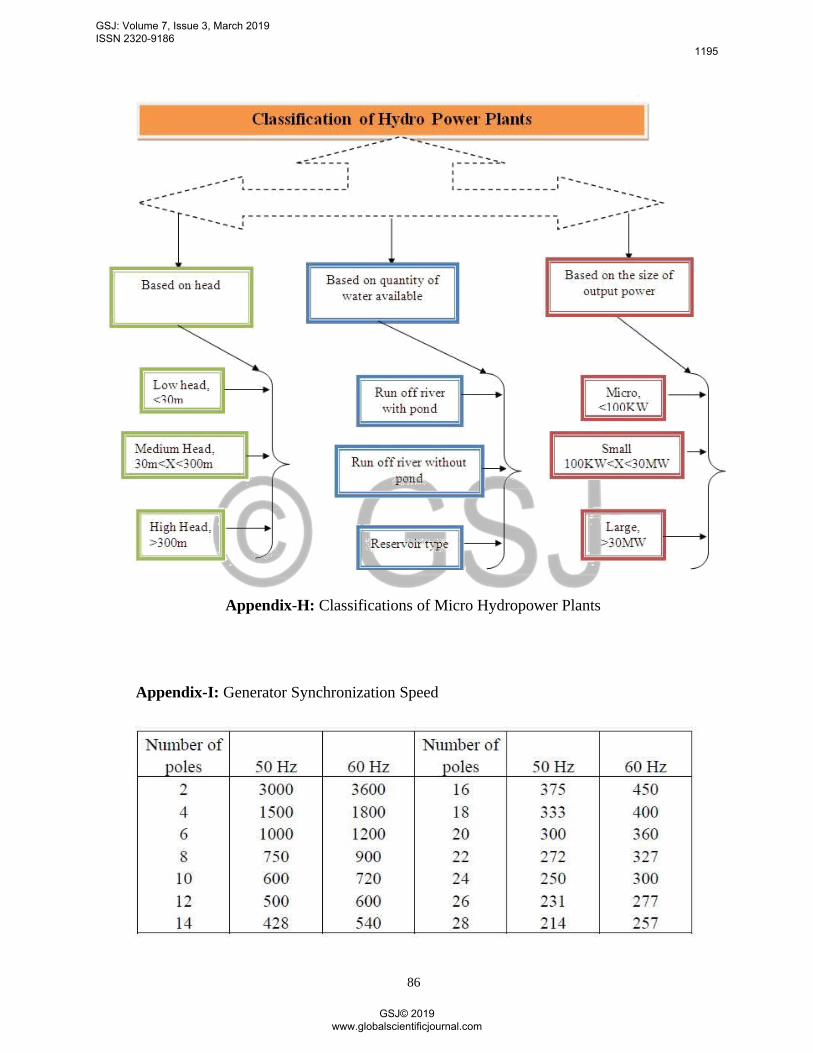
Appendix-H: Classifications of Micro Hydropower Plants
Appendix-I: Generator Synchronization Speed
86
GSJ: Volume 7, Issue 3, March 2019 ISSN 2320-9186
1195
GSJ© 2019 www.globalscientificjournal.com

Appendix-J: Penstock Material and Sizing
87
GSJ: Volume 7, Issue 3, March 2019 ISSN 2320-9186
1196
GSJ© 2019 www.globalscientificjournal.com

Appendix-K: comparison of penstock materials
material Friction Weight Corrosion Cost Joining Pressure
Ductile iron **** * **** ** **** ****
Asbestos sement *** **** **** *** *** *
concrete * * ***** *** *** *
Wood stave *** *** **** ** **** ***
GRP ***** ***** *** * **** *****
UPVC ***** ***** **** **** **** *****
mildsteeel *** *** *** **** **** *****
HDPE ***** ***** ***** ** ** *****
*= poor, *****= Excellent
Appendix-L: Material Properties
88
GSJ: Volume 7, Issue 3, March 2019 ISSN 2320-9186
1197
GSJ© 2019 www.globalscientificjournal.com

Appendix-M: ASTM Cross Reference Material Specification
89
GSJ: Volume 7, Issue 3, March 2019 ISSN 2320-9186
1198
GSJ© 2019 www.globalscientificjournal.com

Appendix-N: Renewable energies in all country in the world
90
GSJ: Volume 7, Issue 3, March 2019 ISSN 2320-9186
1199
GSJ© 2019 www.globalscientificjournal.com

91
GSJ: Volume 7, Issue 3, March 2019 ISSN 2320-9186
1200
GSJ© 2019 www.globalscientificjournal.com

92
GSJ: Volume 7, Issue 3, March 2019 ISSN 2320-9186
1201
GSJ© 2019 www.globalscientificjournal.com

93
GSJ: Volume 7, Issue 3, March 2019 ISSN 2320-9186
1202
GSJ© 2019 www.globalscientificjournal.com

Appendix-O: Tungu Kabri Micro Hydropower Components and Appliances
Intake Water control at intake Canal Water crossing
Canal Settling tank Spillway Forebay
Forebay cleaning Powerhouse Penstock Powerhouse
Turbine Generator Tailrace Power distribution
94
GSJ: Volume 7, Issue 3, March 2019 ISSN 2320-9186
1203
GSJ© 2019 www.globalscientificjournal.com

Small businness Barbershop Battery charging Battery charging
Cellphone charging Welding Welding
95
GSJ: Volume 7, Issue 3, March 2019 ISSN 2320-9186
1204
GSJ© 2019 www.globalscientificjournal.com

Appendix-P: Irrigation on Temie River
96
GSJ: Volume 7, Issue 3, March 2019 ISSN 2320-9186
1205
GSJ© 2019 www.globalscientificjournal.com