
DESIGN OF HYDRO POWER PLANT of hydro power plant water conveyans system a project report submitted...
76
DESIGN OF HYDRO POWER PLANT WATER CONVEYANS SYSTEM A PROJECT REPORT Submitted by JEYALALITHA.K RAMESH KUMAR.N.S SANTHOSH KUMAR.R SATHISH KUMAR.N in partial fulfillment for the award of the degree of BACHELOR OF ENGINEERING IN CIVIL ENGINEERING RATNAVEL SUBRAMANIAM COLLEGE OF ENGINEERING AND TECHNOLOGY, DINDIGUL - 5 ANNA UNIVERSITY :: CHENNAI 600 025 NOVEMBER - 2008
Transcript of DESIGN OF HYDRO POWER PLANT of hydro power plant water conveyans system a project report submitted...

DESIGN OF HYDRO POWER PLANT WATER CONVEYANS SYSTEM
A PROJECT REPORT
Submitted by
JEYALALITHA.K RAMESH KUMAR.N.S SANTHOSH KUMAR.R
SATHISH KUMAR.N
in partial fulfillment for the award of the degree
of
BACHELOR OF ENGINEERING
IN
CIVIL ENGINEERING
RATNAVEL SUBRAMANIAM COLLEGE OF ENGINEERING AND TECHNOLOGY,
DINDIGUL - 5
ANNA UNIVERSITY :: CHENNAI 600 025
NOVEMBER - 2008

DESIGN OF HYDRO POWER PLANT WATER CONVEYANS SYSTEM
A PROJECT REPORT
Submitted by
JEYALALITHA.K 91305103003 RAMESH KUMAR.N.S 91305103333 SANTHOSH KUMAR.R 91305103335 SATHISH KUMAR.N 91305103338
in partial fulfillment for the award of the degree
of
BACHELOR OF ENGINEERING
IN
CIVIL ENGINEERING
RATNAVEL SUBRAMANIAM COLLEGE OF ENGINEERING AND TECHNOLOGY,
DINDIGUL - 5
ANNA UNIVERSITY :: CHENNAI 600 025
NOVEMBER - 2008
ANNA UNIVERSITY : CHENNAI - 600 025

BONAFIDE CERTIFICATE
Certified that this project report “DESIGN OF HYTRO POWER PLANT
(WATER CONVEYANCE SYSTEM)”. is the bonafide work of
“JEYALALITHA.K, RAMESH KUMAR.N.S, SANTHOSH
KUMAR.R, SATHISH KUMAR.N” who carried out the project work
under my supervision.
SIGNATURE SIGNATURE
Mrs.B. KAMESHWARI,ME.ME.Ph.D., Mr. A.MANI, M Tech.Phd., HEAD OF THE DEPARTMENT ASSISTANT PROFESSOR
Department of Civil Engineering, Department of Civil Engineering Ratnavel Subramaniam College of Ratnavel Subramaniam College of Engineering And Technology, Engineering And Technology, Dindigul. Dindigul. Submitted for viva-voce examination held on INTERNAL EXAMINER EXTERNALEXAMINER

CHAPTER 1
INTRODUCTION
The growing energy demand worldwide on the one hand and the
emerging ecological awareness on the other are leading to an increased demand
for regenerative energy. As a continuously available base-load energy supply
option, hydropower is significant regenerative energy source.
Studies to determine new locations for hydropower plants have
explored innovative avenues, with due consideration of ecological and
economic aspects. There is, however, a strong need for updating the methods for
determining establishing and as far as predictable, future developments. The
hydropower plants that are currently being realized or about to be realized are
predominantly based on old studies, with economic data (investment costs and
revenue) having been updated, but without addressing the general actual issue in
view of energy demand, ecology and globalization.
Water is the most abundant resource in the world, it is important to
utilize the power of flowing water. The most efficient way to harness the power
of water is to collect the potential energy. This is done by damming up a body
of flowing water. A dam is an object that restricts the flow of water. In today’s
hydroelectric dams, the restricted water is diverted to a turbine using a penstock
and exits the turbine through the tailrace.
The turbine is made up of a shaft with blades attached. As a fluid
flows through the blades a rotational force is created. This force causes a torque
on the shaft. The turbine shaft is coupled to a generator, where electricity is
produced. The backbone of most power generation system is the generator. An
electric generator is “any machine that converts mechanical energy into
electricity for transmission and distribution.” The generator works by spinning
a rotor that is turned by a turbine.

The rotor is a shaft that has field windings. These windings are
supplied with an excitation current or voltage. As the rotor turns, the excitation
current creates a magnetically induced current onto a stator. The stator is a
cylindrical ring made of iron that is incased by another set of field windings and
is separated from the rotor by a small air gap.
Hydroelectric generations can vary from 1 watt to 100’s mega-
watts. With today’s technology it is possible to generate power with small scale
parameters. With low flow and low head parameters a micro generator can be
used to produce electric power. From the source of the flowing water, a weir,
small scale dam, can be used to restrict the flow of water. From this the water
can be piped to a turbine. Since the turbine is coupled to the generator, a micro
generator can generate about 1 watt to 100 kilowatts. This generator can be used
to power residential loads.
One of the first steps in planning is to measure the power potential
of the stream. The amount of power that can be obtained from a stream depends
on:
- The amount of water flow
- The height which the water falls (head)
- The efficiency of the plant to convert mechanical energy to
electrical energy.

CHAPTER 2
BACKGROUND
The implementation of the requirements is effected through a
framework plan. When elaborating the framework plan the following relevant
data are incorporated:
Basic data-energy aspects:
� Hydrology: gauge levels from hydrological yearbooks.
� Topography: catchments area sizes and potential head
conditions.
� Existing facilities: surveying using questionnaires and water
registers.
Basic data-ecological aspects:
� General information (e.g. protected areas).
� Linear information such as morphological structure,
distribution of sensitive species along a river stretch.
� Selective in formation such as biological quality of rivers
and streams.

CHAPTER 3
NOMENCLATURE
Ao = Area of orifice or ports
AP = Cross-sectional area of penstocks
At = Area of riser of differential surge tank
A, = Net cross-sectional area of surge tank
A, = Cross-sectional area of head race tunnel
J&h = Thoma area of surge tank
c = Velocity of propagation of pressure wave
D = Diameter of head race tunnel
F = Friction factor governing head loss
[to be taken from IS : 4880 ( Part 3 ) - 1976” ]
F, = Factor of safety over Ath
g = Acceleration due to gravity
H = Gross head on turbines
Ho = Net head on turbines
hr = Total head loss in head race tunnel system
hrp = Total head loss in penstock system
L = Length of head race tunnel
Ls, = Length of riser spill in crest
m = Reciprocal of Poisson’s ratio for rock
P = Power generated
Ph = Pressure due to water hammer in the conduit upstream of
surge tank
Qd = Maximum discharge supplied by the surge tank in case of
specified load acceptance
R1 = Internal radius of the pressure conduit

R2, = Outer radius of the pressure conduit
V’ = Volume of water in surge tank corresponding to Z
Y’ t = Volume of water in the conduit in a given time interval
∆t = V1,At. ∆t
vo* = Velocity of flow in tunnel corresponding to maximum steady
flow, upstream of surge tank
V1* = Velocity of flow in tunnel at any instant, upstream of surge
Tank
V2* = Velocity of flow in conduit at any instant, downstream of
surge tank
Z = Water level in surge tank measured positive above reservoir
level
Zm = Maximum surge level above maximum reservoir level
fi, f2, = longitudinal stresses, N/mm2
C = moment coefficient
E = modulus of elasticity
fi = total circumferential stress, N/mm2
fy = total longitudinal stress, N/mm2
l = height of stiffener ring or ring girder, mm
L = span length of pipe, mm
M = moments
P = internal pressure including water hammer, N/mm2
P1 = total reaction at support, N
q1 = shear stress, N/mm2
Y = radius of pipe shell, mm
rl = mean radius of shell, mm
S = hoop stress in pipe, N/mm2
St = equivalent stress, N/mm2
Sa, S, = principal stresses, N/mm2

I = temperature rise or drop, “C
t = thickness of pipe shell, mm
tl = thickness of stiffener ring or ring girder, mm
W = total distributed weight, that is, self-weight of shell + weight
of water, N/m2
WI = total weight, that is, weight of shell + weight of water, N
z = section modulus of pipe shell, ma
α = coefficient of linear expansion or contraction of pipe shell
material, per “C
µ = coefficient of friction.

CHAPTER 4
OBJECTIVE
The objective is to design a hydroelectric plant utilizing optimal
energy in the water, with minimum submergence and economic costs,
considering seasonal variation in power generation to meet the region's demand
during all seasons.
DEFINITIONS:
Head:
Water level is the highest possible water level at the station intake
in full operation and with zero bypass flow.
Tail:
Water level is the energy head of the water flowing out of the
turbines.
Total (gross) head:
= Vertical distance between head- and tail water.
Gross capacity:
Maximum capacity if all head losses, hydraulic and otherwise, are
considered zero.
Effective head:
It is losses subtracted from the gross head at installed capacity
output.

CHAPTER 5
DESIGN ASSUMPTIONS AND PARAMETERS:
Assumptions:
Detailed geological and topographical investigations carried out by
the Department of Mines and Geology to determine the best site for the dam,
pressure shaft alignment, power house location, etc., can be used for
implementing this design.
Parameters:
Input data consist of site specific data (discharge, water yield,
generation head, evaporation rate, seepage rate etc.), technical data (efficiency
of turbine and generator, and dependability norm for storage capacity, load
factor, etc.) and economic data (civil construction costs for various types and
heights of dam, cost of electrical machinery of various capacities,
environmental costs, rehabilitation costs, etc.).
Decision variables:
The decision variables determine the optimum storage capacity,
installed generation capacity and seasonal power drafts; net energy availability
in the region (objective function) needs to be maximized subject to seasonal
hydrological constraints, and costs and submergence area are to be minimized.

CHAPTER 6
HYDRO POWER
Head is defined as the difference in elevation between two
particular cross sections of the river. Making a head useful for hydropower use
needs a concentration by means of hydropower impoundment, diversion or tail
water lowering. At the point of concentration the powerhouse is situated.
The conversion of the energy potential of the river into electricity
requires a turbine (potential and kinetic energy into mechanical energy)
[rotation] and a generator [rotation into electrical energy]. The output of a
hydropower plant is given in terms of power [kW] and electricity production
[kWh].
Following an equation which computes monthly hydropower
production as a function of volume of water discharged (Q), gross head of this
water (H) and efficiency of the couple turbine generator (r), between 0.7 and
0.85).
Hydropower (kW) is given by:
P (kW) = Q (m3/s) x H (m) x ηtot x 9,81
and approximately = Q x H x 7.8
ηtot = total efficiency
(ηturbine x ηgenerator x ηspeed increaser x ηtrafo)
P = electrical power output
Q = rated discharge
H = net head
Electricity production - the thing we pay for - is power during a
certain time period.

The annual electricity production of a hydropower (HP) station is
approximately calculated as
E (kWh) = P (kW) x 4500 (h)
The head of a HP station is mainly determined by geographical and
topographical parameters. The discharge varies due to the natural flow regime.
Usually a Hydropower station runs at full load for roughly three months. The
rest of the year according to the lesser discharge the station is operated at part
load.
CLASSIFICATION OF HYDROPOWER PLANT:
Hydroelectric facilities range in size from large-scale power plants
to small- and micro-scale plants. Though the definitions may vary, hydropower
plants can be classified as follows:
� Large hydropower plants have a generation capacity of more than
30 000 kW (or 30 MW);
� Small hydropower plants have a generation capacity of between
1000 kW and 30 000 kW;
� Mini hydropower plants have a generation capacity of between
100kW and 1000 kW;
� Micro hydropower plants have a generation capacity of less than
100 kW.

THE BENEFITS OF HYDROPOWER:
Hydropower offers several environmental advantages:
� Hydropower uses the renewable power of naturally flowing water,
With out wasting or depleting it;
� Hydropower produces very few greenhouse gases and no other air
contaminants, and it does not generate any polluting or toxic waste
by-products;
� Hydropower projects with reservoirs can store water to generate
electricity for future use. This storage capacity means that
hydropower can support intermittent renewable sources of
electricity, such as wind and solar power, as well as run-of-river
hydropower;
� The storage capacity combined with unique operational flexibility
allows for optimized use of fossil fuel power plants, and therefore
leads to reduced greenhouse gas emissions and air pollutants from
the electricity sector. In addition to having many environmental
benefits, hydropower facilities can provide the following social and
economic benefits:
� Hydropower is a local resource and is not subject to the drastic
fluctuation of international oil markets;
� Low operating and maintenance costs, and long lifetime make
small hydropower projects virtually inflation proof;
� Hydropower projects have the flexibility to complement other
renewable energy technologies and help support a larger
deployment of the technologies;
� When built in conjunction with existing infrastructure, such as
dams and water level controls, the cost of developing small
hydropower projects are competitive with those of other energy
projects.
� Hydropower is a clean, domestic and renewable source of energy.
Hydropower plants provide inexpensive electricity and produce no
pollution. And, unlike other energy sources such as fossil fuels,
water is not destroyed during the production of electricity. It can be
reused for other purposes.
HOW HYDROPOWER WORKS?
Hydropower converts the energy in flowing water into electricity.
The quantity of electricity generated is determined by the volume of water flow
and the amount of "head" (the height from turbines in the power plant to the
water surface) created by the dam. The greater the flow and head, the more
electricity produced. A typical hydropower plant includes a dam, reservoir,
penstocks (pipes), a powerhouse and an electrical power substation.
The dam stores water and creates the head; penstocks carry water
from the reservoir to turbines inside the powerhouse; the water rotates the
turbines, which drive generators that produce electricity. The electricity is then
transmitted to a substation where transformers increase voltage to allow
transmission to homes, businesses and factories.

TYPES OF HYDRPOWER PLANTS
1. Conventional
Most hydropower plants are conventional in design, meaning they use one-way
water flow to generate electricity. There are two categories of conventional
plants:1 run-ofriver and 2: storage plants.
1.1. Run-of-river plants:
These plants use little, if any, stored water to provide water flow
through the turbines. Although some plants store a day or week's worth of
water, weather changes - especially seasonal changes - cause run-of-river plants
to experience significant fluctuations in power output.
(Figure No 1). The Tazimina project in Alaska is an example of a
diversion hydropower plant. No dam was required.

1.2. Storage plants:
These plants have enough storage capacity to off-set seasonal
fluctuations in water flow and provide a constant supply of electricity
throughout the year. Large dams can store several years’ worth of water.
2. Pumped Storage
In contrast to conventional hydropower plants, pumped storage
plants reuse water. After water initially produces electricity, it flows from the
turbines into a lower reservoir located below the dam. During off-peak hours
(periods of low energy demand), some of the water is pumped into an upper
reservoir and reused during periods of peak-demand.
3. Sizes of Hydroelectric Power Plants
Facilities range in size from large power plants that supply many
consumers with electricity to mall and micro plants that individuals operate for
their own energy needs or to sell power to utilities.
3.1 Large Hydropower
Although definitions vary, DOE defines large hydropower as
facilities that have a capacity of more than 30 megawatts.
3.2 Small Hydropower
Although definitions vary, DOE defines small hydropower as
facilities that have a capacity of 100 kilowatts to 30 megawatts.
3.3 Micro Hydropower
A micro hydropower plant has a capacity of up to 100 kilowatts. A
small or micro hydroelectric power system can produce enough electricity for a
home, farm, ranch, or village.

WATER CONVEYANCE SYSTEM
Power Canals:
Introduction, design-uniform flow, location and construction, unlined
canals in soft ground, lined canal in soft ground, canals in rocks.
Tunnels:
Introduction, geometric design, hydraulic design, cross-sectional forms
and size, rock tunneling procedure, tunnel support, tunnel lining , grouting.
Concrete Pipes:
Applications, pre cast concrete pipes, reinforced concrete pipes.
Penstocks:
Types of Penstocks, stresses in penstocks, economical diameter of
penstocks, design of penstock, number of penstocks and equivalent penstock
diameter, joints in pipeline, anchors and supports, valves.
Surge Tanks:
General function of a surge tank, types of surge tanks, design
consideration of surge tanks, stability of surge tanks, Lined canals, Layout of
lined canals.

CHAPTER 7
TUNNELS
1. INTRIDUCTION:
Tunnels can be designed as underground passages made without
removing the overlying rock or soil.
The headrace tunnel extending from the head pond to the surge
tank has a length of 11860 m. It has a D shaped cross section (20.42 m2) with a
concrete lining. The equivalent hydraulic diameter of the horseshoe section is
approximately D = 4.75 m. The original tunnel layout has a horizontal in the
downstream direction. In order to shorten the construction time of the tunnel it
was thought of working both from the upstream and the downstream end. For
the drilling from the upstream end of the tunnel this brings the question of
evacuation of the water which may come from eventual karstic springs.
Therefore it was proposed to investigate a change in the vertical profile of the
tunnel, where a high point created somewhere in the tunnel will allow to carry
out the drilling works upslope going from both ends. Of course such a solution
can only be feasible if the high point can be placed such that L1≈L2.
Hydraulic calculations were performed for several headrace tunnel
alternatives. It was seen that, it is not possible to create a high point at almost
equal distances from the two adits even by adding a penstock, which was not
envisaged in feasibility study. After all it is decided to keep the headrace layout
in the feasibility study.

CLASSIFICATION OF TUNNELS :
Tunnels may be classified according to their purpose, shape and
supporting arrangements.
Depending on their purpose the following two main groups of
tunnels may be distinguished:
� Traffic tunnels:
� Railway tunnels
� Highway tunnels
� Navigation tunnels
A. Conveyance tunnels:
� Hydroelectric power station tunnels-these shall be referred as
“hydraulic tunnels” in all further discussions.
� Water supply tunnels
� Sewer tunnels transportation tunnels in industrial plants.
B. Hydraulic tunnels can be further sub-divided into the following
categories:
� Pressure tunnels
� Free flowing tunnels
� Free flowing cum-pressure tunnels
C. Depending on their shape, tunnels may be classified as:
� D-shaped
� Horse-shoe shaped
� Circular shaped
� Elliptical shaped
� Square or rectangular shaped

THE SELECTION OF THE TUNNEL CROSS-SECTION IS
INFLUENCED BY:
The clearances specified in view of the vehicles and materials
transported in the tunnel,
� Geological conditions,
� The method of driving the tunnel, and
� The material and strength of tunnel lining.
Tunnels may also be classified as “lined” or “unlined” tunnels. If
the rock conditions are favorable and the tunnel is required to be used for a short
period of time, e.g., a diversion tunnel constructed for the construction of a dam,
the tunnel may be left unlined. However, in most cases, hydraulic tunnels are
invariably lined with cement concrete (Plain or reinforced) or short Crete,
hydraulic tunnels discharging silt - ladden water under high velocities. (E.g. silt
flushing tunnels) are required to be steel-lined.
Depending upon the type of supports, tunnels may be classified as:
i. Tunnels supported by R.S.J sections.
ii. Tunnels supported by rock bolts.
iii. Tunnels supported by short Crete.
iv. Tunnels supported by a combination of (i), (ii), (iii).

TUNNEL CROSS SECTION
Cross – section of a tunnel depends on the following factors:
� Geological conditions prevailing along the alignment,
� Hydraulic requirements,
� Structural considerations, and
� Functional requirements.
D-SHAPED SECTION:
D-shaped section is found to be suitable in tunnels located in good
quality, intact sedimentary rocks and massive external igneous, hard,
compacted, metamorphic rocks where the external or internal pressures.
SURGES IN TUNNELS
Water hammer is created in long closed tunnels by the sudden
closure of the turbine gates. The water hammer pressure provides the necessary
force to retard the flow in tunnel when load is rejected by the turbine. For very
long tunnels, the water hammer corresponding to normal operation of the
turbine may be very great and may require extra ordinary strength of the tunnel
to withstand it and the violent fluctuations of pressure in the tunnel may
seriously interfere with proper turbine regulation. Similarly, for sudden opening
of the gates, the resulting negative water hammer, or reduction of pressure,
provides the necessary force to accelerate the water and is correspondingly
objectionable for very long tunnels.

The simplest means of eliminating the positive and negative water
hammer pressures is to provide a surge tank at the lower end of the tunnel. The
steady state water level in the surge tank fluctuates up and down as the turbine
rejects or accepts the load.
The tunnel should be designed to withstand the maximum excess
pressure that is likely to occur. Similarly, it is very essential to determine the
sub-normal pressures in the surge tank for sudden acceptance of the load. Care
should be taken that the pressure in the tunnel never becomes negative as, under
such conditions, the tunnel is likely to collapse. For head race tunnels full,
maximum pressures occur at the time of load acceptance. However, for tail race
acceptance. Hence, to meet the safety requirements of a tail race tunnel, a surge
tank may be provided downstream of the power house also.
Methods of tunneling:
� Full face attack
� Top heading and benching
� Bottom heading and stopping
� Drift method.
TUNNEL SUPPORT:
When an underground opening is made, it generally becomes
necessary to install supports to hold the rock which has a tendency to drop out
of the roof of the opening .in the earlier day’s timber sections were used as
temporary supported till permanent lining could be placed. With the gradual
availability of steel sections, timber supports have now become almost obsolete.
More recently on the basics of work done by beiniiiawaski , Barton , rabcewicz
and others, even steel supports are being dispensed with and the present trend is
to reinforce the rock by means of rock bolting and shortcreting.

THE NEED FOR TUNNEL SUPPORT:
The necessity of tunnel support arises from the fact that the
excavated rock has a tendency to drop out of the roof of the tunnel. The time
which the loosened rock takes to drop out and also the amount of rock expected
to fall depend upon the “bridge action period” of the rock. The bridge action
period “to” be defined as the time which elapses between blasting and the
beginning of collapse of the unsupported roof. It may range from a few hors to a
few weeks. The bridge action period for cohesion less and or completely
crushed rock is almost zero.
TYPES OF STEEL SUPPORT SYSTEMS:
Tunnel support system by way of steel ribs may be classified into
the following:
(a) Continuous rib,
(b) Rib and post,
(c) Rib and wall plate,
(d) Rib, wall plate and post,
(e) full circle rib; and,
(f) Invert strut in addition to those shown in types (a) to (d).

CONSTITUENTS OF TUNNEL SUPPORTS:
Every type of tunnel support system consists of two or more
different elements, each of which serves a different function, the basic elements
are:
(a) Ribs
(b) Posts
(c) Invert strut
(d) Wall plates
(e) Crown bars
(f) Truss panels
(g) Bracings and spreaders
(h) Blocking
DESIGN PROCEDURE:
� Construction of load diagram
� Construction of force polygon
� Determination of thrusts and
� Computation of stresses in the arch rib
Lining in tunnels is a very important component and makes up for
30 to 40 percent of the total cost of tunnel. Tunnels forming part of water
conductor system have to be invariably lined with cement concrete-plain or
reinforced: or steel lined. However, in cases where it has served the purpose
e.g., diversion tunnels the lining could be avoided.

CONCRETE LINING:
The function of concrete lining is one or more of the following:
� To reduce head losses in the system;
� To protect steel ribs from deteriorating;
� To prevent leakage of water;
� To protect the turbines by preventing loose rock particles falling
into the water and being carried to the turbines;
� To take that part of the internal pressure. Which is not taken by
the rocking.
STEEL LINING
General:
As briefly described earlier, steel lining is provided where the
tunnel has to withstand high pressures. Steel lining consists of a steel plate of
adequate thickness provided to the inner surface of the tunnel and serves the
following purposes:
To prevent water loss fro the tunnel;
� To resist the bursting pressure of water carried by the tunnel;
� To provide protection from seepage of water from the
surrounding mass like rock, concrete etc. and
� To provide a smooth surface for flow of water.

CHAPTER 8
HYDRO PROJECT IN UTTARAKHENT
DESIGN DATAS:
FRL = 1017.00
MWL = 1020.00
MDDL = 1009.50
Length of HRT = 11.86Km
Proposed shape of HRT = D Shape
NO of units = 3
Power = 3 x 33 MW
TWL = 810
Net head = 204.5 – 16.4
= 188.1m
Gross head = 204.5m
Design discharge = 59.60 Cumec

1. HYDRAULIC DESIGN:
Discharge Q = V x A
.’. Q/V = A
= 0.905 D2
= 59.6 / ( 3 x 0.905 )
.’. dia D = 4.68m
D = 4.75m
.’. Vetted perimeter P = 3.58 D
P = 17M
Hydraulic Radius = A / P
= 0.2528 D
= 1.2m
Net head = H = ( MDDL – TWL ) + 2/3 ( FRL – MDDL )
= ( 1009.5 – 810 ) + 2/3 ( 1017 – 1009.5 )
H = 204.5m
Hydro power P = γQHη
= 9.81 x 103 x 59.6 x 204.5 x 0.92
Power = 110 MW
TFL at the end of the tunnel
= total head – friction loss

Mannings Formula:
hf = V2 x N2 x L / R4/3
where
N = Rugosity Co – efficient ( for inner tunnel )
Take N = 0.014
.’. hf = 32 x 0.0142 x 11.86 x 103 / 1.24/3
hf = 16.4m
.’. inner end of the tunnel
TFL = 204.5 – 16.4
= 188.1m = 188m
TYPE OF FLOW
Reynold No = ρVD / µ
R = 1000 x 3 x 4.75 / 1x10-2
= 1.425x10⁶ > 4000
.’. it is a turbulent flow

2. STRUCTURAL DESIGN:
Internal diameter of tunnel = 4.75m
Thick of lining (t) = 0.2m
Internal radius of tunnel (r) = 4.75/2
= 2.375m
Mean radius of tunnel lining (R) = 2.375+0.1
= 2.475m
Young’s modulus of lining material (E) = 2.1x10⁶/13 kg/cm2
= 1.6154x10⁶ t/m2
Moment of inertia (I) = bd3/12
(considering 1m strip of lining) = (1 x 0.23)/12
= 0.0007 m4
Unit weight of water (W) = 1.0 t/m3
Unit weight of concrete (Wc) = 2.5 t/m3
Total rock load on mean dia (P) = 5.15x1.287x2.5x1
Pressure p = (4.75+0.4)x(0.25x
4.75+0.2+0.2)
= 16.57 t
From table 4.2(S.l no:2) = 0.25 x (B)
= 0.25x(4.75+0.22)

φφφφ
Due to uniform vertical load
Due to conduit weight
Due to contained water
Total
00
= 0.125 PR = 0.125 x 17.06 x 2.475 = 5.278
= 0.4406 Wct R2
= 0.4406 x 2.4 x 0.2 x 2.4752 = 1.295
= 0.2203 Wr2R = 0.2203 x 1 x 2.3752 x 2.475 = 3.0755
9.945
450
Zero
= - 0.0334 Wct R2
= - 0.0334 x 2.4 x 0.2 x2.4752
= - 0.0970
= - 0.0167 Wr2R = - 0.33
- 0.427
900
= - 0.125 PR = - 5.278
= - 0.3927 Wct R2
= - 1.1546 = - 0.1963 Wr2R = - 2.7403
- 9.172
1350
Zero
= 0.0334 Wct R2
= 0.097 = 0.0167 Wr2R = 0.33
0.427
1800
= 0.125 PR = 5.218
= 0.3448 Wct R2
= 1.0138 = 0.1724 Wr2R = 2.407
8.698
Now m = Qbd2 Q = 13 b = 100 cm .’. d = 9945/(13 x 100) = 7.68 cm Actual thickness of lining provided = 20 cm Including over break in rock, Total thickness of concrete lining up to the payline = 30 cm
Hence the depth is considered to be adequated.
BENDING MOMENTS

φφφφ
Due to uniform vertical
load
Due to conduit weight
Due to contained water
Total
00
Zero
Zero
Zero
Zero
450
= - 0.25 P = - 4.142
= - 0.8976 WctR = - 1.066
= - 0.4488 Wr2
= - 2.749 - 8.551
900
Zero
= 0.1667 WctR = 0.1980
= 0.0833 Wr2
= 0.510 0.708
1350
= 0.25 P = 4.142
= 0.6732 WctR = 0.739
= 0.3366 Wr2
= 2.062 7.003
1800
Zero
Zero
Zero
Zero
Maximum radial shear = 8.551 t
.’. Shear stress = 8.551/(100 x 20) = 4.28 kg/cm2 < 5 kg/cm2
Hence the design is safe
RADIAL SHEAR

φφφφ
Due to uniform vertical
load
Due to conduit weight
Due to contained water
Total
00
Zero
= 0.1667 WctR = 0.198
= - 1.4166 Wr2 = - 8.678
- 8.48
450
= 0.25 P
= 1.1332 WctR = 1.346
= - 0.7869 Wr2
= 4.82 0.668
900
= 0.5 P
= 1.5708 WctR = 1.866
= - 0.2146 Wr2 = - 1.314
8.837
1350
= 0.25 P = 0.4376 WctR = 0.519
= - 0.4277 Wr2 = - 2.620
2.041
1800
Zero
= - 0.1667 WctR = - 0.198
= - 0.5834 Wr2
= - 3.574 - 3.772
Maximum negative thrust = - 8.48 t ( which indicates tension at the crown)
Tensile stress in concrete at crown
= 8.48 x 1000/(100 x 20) = 4.24 kg/cm2 < 5 kg/cm2
Hence the design is safe
NORMAL THRUST
φφφφ
Due to uniform vertical
load
Due to conduit weight
Due to contained water
Total
00 Zero Zero Zero Zero
450 = 0.01473 x PR3/EI
= 3.17 mm
= O.504 x WctR4/EI
= 0.81 mm
= 0.0252 x Wr2R3/EI
= 1.9 mm
5.88
900 = 0.04167 x PR3/EI
= 8.95 mm
= O.13090 x WctR4/EI
= 2.10 mm
= 0.06545 x Wr2R3/EI
= 5.29 mm
16.34
1350 = 0.01473 x PR3/EI
= 3.17 mnm
= 0.1309 x WctR4/EI
= 0.67 mm
= 0.02108 x Wr2R3/EI
= 1.59 mm
5.43
1800 Zero Zero Zero Zero
Deflections are with in permissible limits.
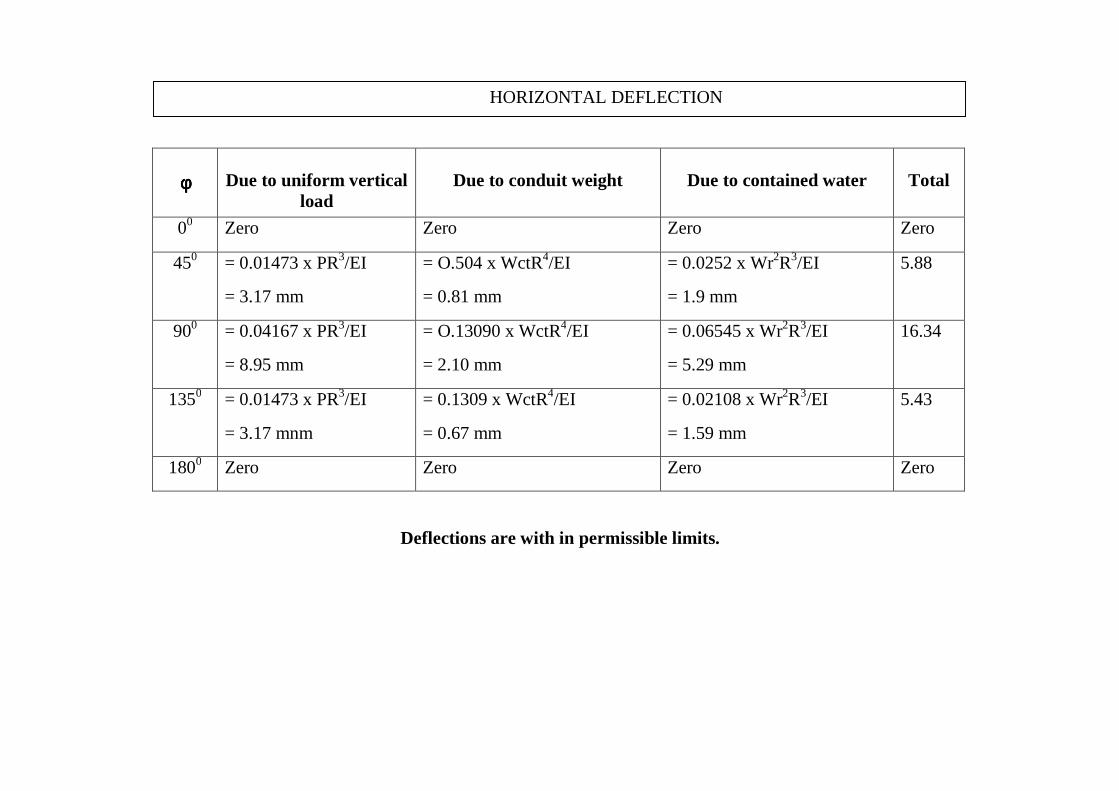
HORIZONTAL DEFLECTION

φφφφ
Due to uniform vertical
load
Due to conduit weight
Due to contained water
Total
00 Zero Zero Zero Zero
450 = 0.02694 x PR3/EI
= 5.9 mm
= 0.09279 x WctR4/EI
= 1.54 mm
= 0.0464 x Wr2R3/EI
= 3.5 mm
10.94 mm
900 = 0.04167 x PR3/EI
= 9.2 mm
= 0.13917 x WctR4/EI
= 2.31 mm
= 0.06958 x Wr2R3/EI
= 5.26 mm
16.77 mm
1350 = 0.0564 x PR3/EI
= 12.52 mm
= 0.18535 x WctR4/EI
= 3.08 mm
= 0.09268 x Wr2R3/EI
= 6.96 mm
22.56 mm
1800 = 0.0833 x PR3/EI
= 18.50 mm
= 0.2618 x WctR4/EI
= 4.34 mm
= 0.1309 x Wr2R3/EI
= 9.89 mm
32.73 mm
Deflections are with in permissible limits.
VERTICAL DEFLECTION

CHAPTER 9
FOR ECONOMICAL DIMENTIONS FOR TUNNELS
Using the following symbols and assumptions:
D = Tunnel Diameter in meters.
d = Mean he of Lining.
E = Mean unit price of tunnel excavation Rs.290/- per cum
L = Unit price of concrete lining = Rs. 485-per m3
G = Mean unit price of grouting = Rs. 250/- m3
A = Total cost of tunnel per meter length.
C = Contingencies [percentage of total cost = 5%]
S = Supervision charges [percentage of total cost = 15%]
O = Operating and maintenance cost = 10%
Y = Life project in years = 5 years
P = Depreciation factor ( for straight line method = 1/50)
N = Rate of interest ( 8%)
B = Manning’s co-efficient (0.014 for concrete lined tunnel )
R = Hydraulic mean radius ( D/4 for circular tunnel)
Q = Equivalent discharge = 120 m3/sec
U = Value of one unit of power = 0.10
e = Overall efficiency of plant = 0.85

Economical diameter of tunnel as per hand book of hydroelectric engineering by
Dr. P.S.Nigam is given by
D7.33 = (19.35Q3n2e x 4x105)/[(E+0.36)L x O]
D = Diameter of tunnel
Q = Discharge through tunnel = 59.6 m3/sec
n = Rigidity co-efficient = 0.014
e = overall efficiency = 85%
u = cost of power = 16 paisa/unit
CONSTRUCTION COST AND FIXED CHARGES:
(a) Cost of excavation:
= [E(D+2d)2]/4 Rs/m
(b) Cost of lining
= L [ (D+2d)ss-D2]/4 Rs/m
(c) Cost of grouting:
= g(D+2d)
That fore total cost per linear meter.
A = E[D+2d]/4 + L[(D+2d)2-D2]/4 + g(D+2d)
A = [ED2/4] + EDd + Ed2 + Ld2 + LDd + gD + 2gd
A = [ED2/4] + D[Ed + Ld + g] + Ed2+ Ld2 + 2gd

This must be increased by ‘C’ for contingencies and by S for
supervision charges.
Overall cost = A (1+c) x (1+s)/m
Annual charges of tunnel due to supervision & interest
= A (1+c) x (1+s) x (P+N)/m
OPERATION & MAINTENANCE COST:
Gross grass annual cost and expressed operation & maintenance cost
= A (1+c) x (1+s) x O
Value of annual cost:
Loss of head due to friction per M length =
h = n2 v2/R4/3
= n2 Q2/ [(D2/4)2 x (D/4)4/3]
h = 101.12 D-16/3 n2Q2
Power Loss = 9.8 Qh x e
Total number of hours of separation per year = 7925 hours
= 9.8 eTQ(101.12D-16/3 n2 Q2)
= 1000 en2 TQ3D-16/3U
That fore total annual cost.
T1 = A(1+c) x (1+s) x (P+N) + A(1+c) x (1+s) x
O+1000en2TQD-16/3 x w

Where
A = ED2/4 + D[Ed + Ld + G] + Ed2 + Ld2 + 2Gd
For the economy
dT1/dD = 0
Difference the above
[ED/2 + d(E+L) + g] x (1+c) x (1+s) x (p+N) - [(1000 x 16)/3] x
n2Q3TUeD-16/3 = 0
(OR)
[D+2d(E+L)+G]/E = [322000/3] x {[(n2Q3TUeD-19/3)]/
[E(1+c)x(1+s)x(P+N)}
(OR)
(32000/3) en2Q3 x [T.U/E(1+c).(1+s).(p+N)] x D-19/3
= D + [2d(E+L)+G]/E
(OR)
mD-19/3 = D + K
(OR)
loge m D-19/3 = D + K
(OR)
loge m D-19/3 = loge (D + K)
(OR)
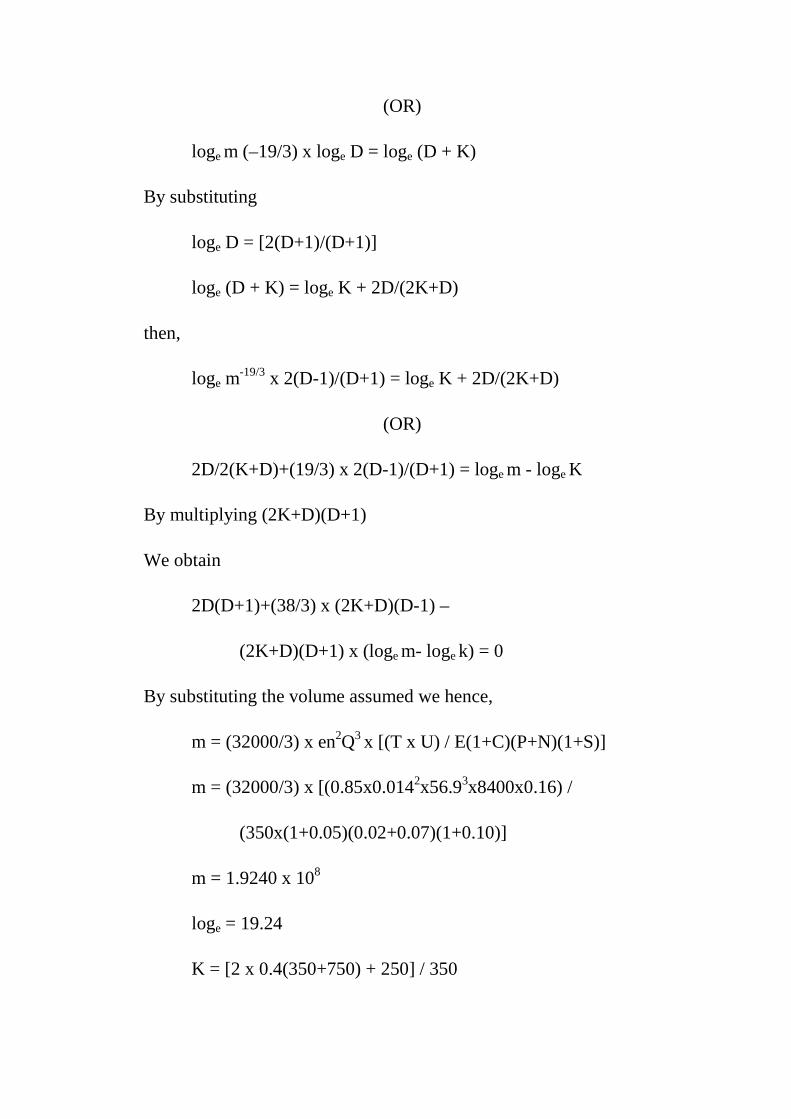
loge m (–19/3) x loge D = loge (D + K)
By substituting
loge D = [2(D+1)/(D+1)]
loge (D + K) = loge K + 2D/(2K+D)
then,
loge m-19/3 x 2(D-1)/(D+1) = loge K + 2D/(2K+D)
(OR)
2D/2(K+D)+(19/3) x 2(D-1)/(D+1) = loge m - loge K
By multiplying (2K+D)(D+1)
We obtain
2D(D+1)+(38/3) x (2K+D)(D-1) –
(2K+D)(D+1) x (loge m- loge k) = 0
By substituting the volume assumed we hence,
m = (32000/3) x en2Q3 x [(T x U) / E(1+C)(P+N)(1+S)]
m = (32000/3) x [(0.85x0.0142x56.93x8400x0.16) /
(350x(1+0.05)(0.02+0.07)(1+0.10)]
m = 1.9240 x 10⁸
loge = 19.24
K = [2 x 0.4(350+750) + 250] / 350

loge = 1.172
2D(D+1) + (38/3)(6.526xD)(D-1)-(6.556+D)(D+1)
(19.24-1.425) = 0
Solving this equation we will get.
D = 2.58 m

DESIGN OF TUNNEL C.S.I.R METHOD:
BIENIAWSKI (OR) C.S.I.R METHOD:
(a) Access the various parameters
(b) Access the rating of each the above parameters using table ten
percentages from tunnel design manual.
(c) Once the basic, rock mass value has been arrived at adjust for the joint
orientation.
(d) Arrived at the total rock mass rating and the classify the rock mass
accordingly.
(e) Having accessed the rock mass classification determined the expected
standard time figure 10.8 from tunnel design manual.
(f) After determined the rock mass classification and the stand up time
arrive at the support requirements in the table 10.2 from tunnel design
manual.

BARTON’S N.G.I METHOD:
Design of rock bolts and facing of rock bolts.
(i) Access various rock parameters and there corresponding values
using table 10.3 from tunnel design manual.
Q = [RQD/Jn] x [Jr/Ja] x [Jw/SRF]
(ii) Work out the value of De called the equivalent dimension using
the relationship .
(iii) Roof support.
Proof = (2/Jr)(Q)-1/3
(iv) Depending upon the value of rock mass quality.
DESIGN:
(1) Q = [RQD/Jn] x [Jr/Ja] x [Jw/SRF]
RQD = Rock quality of designation
Jn = Jt, structural number
Jr = Jt, roughness number
Ja = Jt, Alteration number
Jw = Jt, Water reduction factor
SRF = Stress reduction factor
Dc = Equivalent dimension

(ii) Dc = excavation span, Dia & Height/Excavation support ratio
Table 10.4
(iii) Roof pressure
Proof = [2/Jr] x Q-1/3
= (2/2) x (12)-1/3
= 0.44 kg/cm2 �(1)
(v) substituting (1) value for (i)
Q = [RQD/Jn] x [Jr/Ja] x [Jw/SRF]
= (72/6) x (2/2) x (1/1)
= 12 Very good rock.
Using table 10.4 [from tunnel manual]
Value of ESR = 1.6
Excavated diameter of tunnel = 5m
Dc = 3.125
Provide rock bolt 3m long @ 1.5 m c/c.
Determination of thrusts
T = 63000 kg

Computations of stresses in the area Rib
C = Chords length between following point in cm
C = 150 cm In our case
R = Radius of neutral axis of the rib in cm
R = 1750 cm
h = Rise of arc between blocking points in cm
h = R- sq root [R2-(c/2)]2
h = 1750 - sq root (17502 – (150/2)2
h = 1.6 cm
T = Thrust in kg = 6300 kg
Mt = Bending moment in kg.cm
Mt = hT = 1.6 x 63000
= 1,00,,800 kg.cm
M max = Maximum 3m in kg.cm in the rib
= 0.86 x 100800
= 86,608 kg.cm
Z = section modulus of the rib in cm3
Z = 8603.6 cm3 x RST x 300 x 140
A = 56.76 cm2
fr = (T/A) + (M max/Z) kg/cm2

fr = (63000/56.76) + (100800/8603.6)
fr = 1109.94 + 11.72
fr = 1121.76 kg/cm2Since allowable stress in the rib is 1150 kg/cm2
The Design considers being safe.
Hence ok.

ROCK MASS CALCULATION:
i) Q = ( RQD x Jr x Jw ) / ( Jn x Ja x SRF )
Where
RQD = Rock quality designation
Jr = Joint roughness number
Ja = Joint alteration number
Jw = Joint water reduction factor
SRF = Stress reduction factor
Dc = Equivalent dimension
ii) Dc = Excavation span, Dia ( or ) Height / Excavation support ratio
[ESR]
iii) Root Pr Proof = 2 x Q-1/3/ J6
= 2 x 12-1/3/ J6
= 0.44 Kg / Cm2
iv) Q = ( RQD x Jr x Jw ) / ( Jn x Ja x SRF )
= 72 x 2 x 1 / 6 x 2 x 1
= 12, Very good rock
Using table 10.4 value of ESR = 1.6
Excavated dia of tunnel = 5m
Dia = 5 / 1.6 = 3.125
Provide rock bolt 3m long @ 1.5m C/C
CHAPTER 10
SURGE TANK
A surge tank is provided at the end of the headrace tunnel in order
to protect the hydro mechanical equipment and the tunnel lining against a
possible damage from water hammer.
The operation of storage power plants requires a completely free
operation without any restrictions on changes in loading or flow of neither the
pumps nor the turbines. Examinations of traditional, simple Shafter chamber -
type surge tanks show their ineffectiveness due to the required chamber volume
and the resulting costs. This demand led to the development of a more effective
throttling device in connection with dual chamber surge tanks.
SELECTION OF SURGE TANK TYPE:
The principle demand on a surge tank is to compensate the mass
oscillation of the water flow in the pressure tunnel of load changes of turbines
and/or pumps, whereas the construction type in connection with a suitable
throttling device should effect in a most powerful damping of the amplitude
already in the very first period of oscillation. Partial or full-load rejection leads
to on upsurge oscillation, whereby the maximum pressure is limited by the
bearable stress of the concrete lining of the power tunnel. Load demand,
however is followed by a down surge oscillation and the damping effect of the
throttling device should avoid reaction on the turbine or pump. In this case the
minimum pressure must not come below the elevation of the power tunnel.
For the design of the pumped-storage power plant and later for
rebuilding of a new waterway of high-head power plant an investigation for the
most economic type of surge tank fulfilling the operational requirements has
been carried out. Four types of surge tanks with different throttling devices were

investigated with specific computer software developed by Verbundplan and the
results compared.
- (type 1) Shaft surge tank with orifice
- (type 2) Chamber surge tank with symmetric orifice
- (type 3) Differential surge tank with asymmetric orifice
- (type 4) Differential surge tank with reverse flow throttle
The obvious different characteristics and damping effects of
chamber surge tanks and differential types are compared as for example in
figure 1 for a single load case full load rejection. The graphs simply show the
benefit of differential surge tanks due to the much more effectiveness in
damping of the oscillation.
Loading cases for comparison of different surge tanks
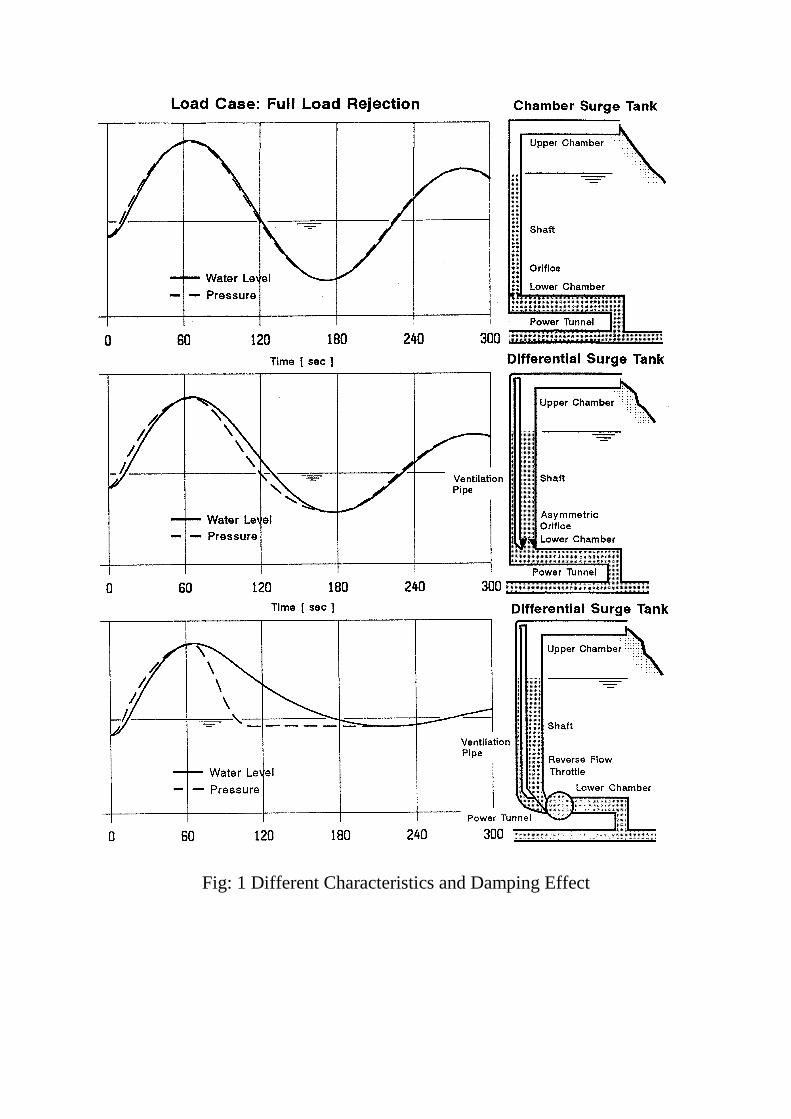
Fig: 1 Different Characteristics and Damping Effect
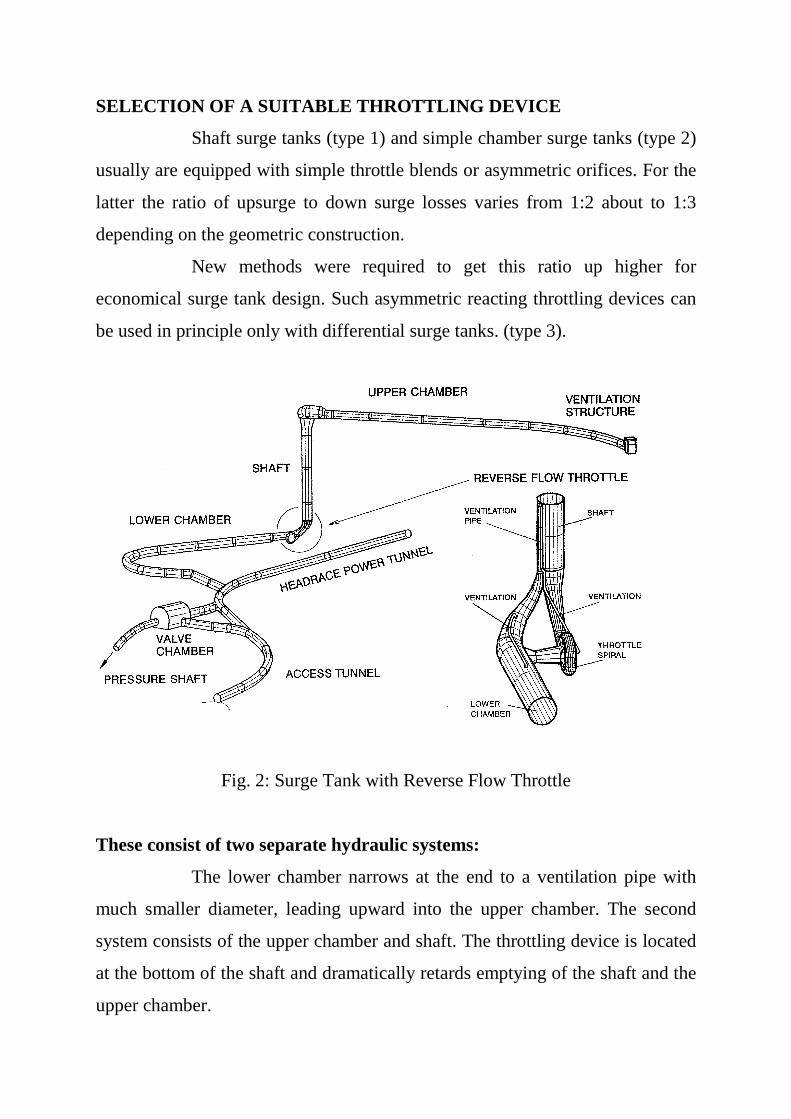
SELECTION OF A SUITABLE THROTTLING DEVICE
Shaft surge tanks (type 1) and simple chamber surge tanks (type 2)
usually are equipped with simple throttle blends or asymmetric orifices. For the
latter the ratio of upsurge to down surge losses varies from 1:2 about to 1:3
depending on the geometric construction.
New methods were required to get this ratio up higher for
economical surge tank design. Such asymmetric reacting throttling devices can
be used in principle only with differential surge tanks. (type 3).
Fig. 2: Surge Tank with Reverse Flow Throttle
These consist of two separate hydraulic systems:
The lower chamber narrows at the end to a ventilation pipe with
much smaller diameter, leading upward into the upper chamber. The second
system consists of the upper chamber and shaft. The throttling device is located
at the bottom of the shaft and dramatically retards emptying of the shaft and the
upper chamber.

The pressure is controlled by the level in the ventilation pipe which
drops very fast, because as it empties suddenly and unhindered into the lower
chamber. The so-called reverse flow throttle was developed based on an idea of
Thoma. It consists of a steel torus similar to a spiral casing of a Francis turbine
(fig. 2). The downsurge oscillation produces a vortex flow which stabilizes
within a few seconds. The water is forced to exit the torus through a small
connection pipe rectangular to the plane of the vortex flow and is discharged
into the lower chamber. This change of flow direction results in very high
pressure losses, these are 20 – 50 times higher than in reverse direction (type 4).
Steady Flow Calculations
For normal operation conditions, neglecting small (automatic)
discharge adjustments by the turbine governor (closing or opening the wicket
gates), the flow in the hydraulic conveyance system can be assumed to be in
steady state. To be able to obtain the available head (which is defined as the
lake level minus the total head loss) at the turbine entrance for a given
discharge, the head losses in the conveyance system must be calculated. By
subtracting the tail water elevation from the computed available head, the net
head for the operation of turbines is obtained. In order to be able to compute the
net head for all possible "incomingdischarge/ turbine-discharge" combinations,
a computation sheet for the steady state calculations was established for all
discharges appearing in the flow duration curve. The results presented in the
computation sheet are then used in obtaining the duration curves for ; turbine
discharges, available head, net head, total power generation, overall turbine
efficiency.

LOAD CASES CONSIDERED FOR SIMULATIONS:
The transient calculations have been carried out, with the program
SIMPIP, for 4 principal load cases:
Load case 1: Full load rejection:
At the beginning of the simulation, all three Francis turbines are
functioning at their nominal discharge, namely 19.87m3/s. The total discharge
passing through the headrace tunnel is 59.6m3/s. After 8 seconds of normal
operation, all three turbines are rapidly closed.
Load case 2: Load demand during power plant start-up:
At the beginning of the simulation all three turbines are stopped.
Everywhere in the system the discharge is null and hydrostatic conditions
prevail. The three Francis turbines are started as follows: The wicket gates of
the all turbines are opened 15% in 3s (This assumes that the wicket gates can be
opened from 0 to 100% in 20s). For the next 60s the turbines operate at 15%
opening while the machines are synchronized with the network. It is admitted
that at the end of this period the synchronization is obtained and the units are
connected to the network. The wicket gates of the units are opened to 100% in
the next 17s. From then on, turbines continue to operate at constant nominal
discharge which is 59.6m3/s.
Load case 3: Combined turbine emergency closure and start-up:
At the beginning of the simulation, all three Francis turbines are
functioning at their nominal discharge, namely 19.87m3/s. The total discharge
passing through the headrace tunnel is 59.6m3/s. After 8 seconds of normal
operation, all three turbines are rapidly closed. After closure, all three turbines
are started following the start-up procedure described in load case 2, when the
water level in the surge tank reaches its minimum level.

Load case 4: Load demand during power plant start-up:
At the beginning of the simulation all three turbines are stopped.
Everywhere in the system the discharge is null and hydrostatic conditions
prevail. The three Francis turbines are started as follows: The wicket gates of
the first turbine are opened 15% in 3s (This assumes that the wicket gates can be
opened from 0 to 100% in 20s). The wicket gates are left at 15% opening for 2s
in order to let the turbine to take up speed. The wicket gates are closed partially
to 10% opening in 1s. For the next 60s the turbines operate at 10% opening
while the machines are synchronized with the network. It is admitted that at the
end of this period the synchronization is obtained and the unit is connected to
the network. The wicket gates of the first unit are opened to 100% in the next
18s. From then on, the first turbine continues to operate at constant nominal
discharge which is 19.87m3/s. The above start-up procedure for the next unit
starts when the preceding machine is synchronized. Therefore during the first
three seconds of the 18s period, during which the first turbine discharges is
increased from 10% to 100%, the wicket gates of the second unit is opened to
15%; and so on.

CHAPTER 11
HYDRAULIC DESIGN OFSURGE TANK:
Ath = Lat/bV12 H0 . V1
2 /2g
` At = 20.41m
L = 11.86km
V1 = 3m/sec
H0 = 204.5m
Ath = (11860x20.41/1.822x32x204.5 ) x (32 / 2x9.81)
= 33.112m
β = hf / V12
hf = 16.40m
V1 = 3m/sec
.’. β = 1.822m
AREA OF SURGE TANK:
As = Ath [ 1-1.5(1-K)]
= 133.94m
SURGE HEIGHT:
Z* = V0√ L/g .At /A s
= 3 √11860/9.81 x 20.41/138.94
= 40.72m
Z* = 40.72m Po = 0.2048
Maximum upsurge = 1- 2/3 Po + 1/9 Po2
= 1-0.137+0.0047
= 0.863 neglecting the 3rd term,
Zm = 0.863 x 40.72
= 35.14m

The following down surge
Zm” = - 1/(1+0.478)
= - 0.676
Zm” = - 0.676 x 40.72
= - 27.53m
Instantaneous complete loading
Zm ’’ = - 1 - 0.0256
= - 1.0256
Zm = - 1.0256 x 40.72
= - 41.76m
Assume 50% load,
LOAD REJECTION
L/2gφb2 VO2 - Zm / b VO
2 - L/2gφb2 VO2 [ e – 2gφ/L(2m+ b VO
2)] = 0
e = 0.92
[turbine constant x 11.86/2x9.81x6.56x1.8222x32 - 35.14/1.822x32
- 11.86x10³/(2x9.81x6.56x1.8222x32
[0.92/[(2x9.81x6.56)/(11.86x103)] x [35.14+(1.822x32)] = 0
= 3.08 – 2.143 –3.08 [0.92-0.01085 x (51.54)] = 0
= - 0.174

STRUCTURAL DESIGN OF CIRCULAR SURGE TANK:
Circular tank with fixed base for capacity 4,00,000 litres. The
depth of water is to be 4m.
Area of surge tank = 133.94
Dia = 13.06m.
Use M20 grade concrete and grade – I mild steel.
Permissible direct tensile stress in concrete = 1.2N/mm2
Permissible stress in direct section = 100 N/mm2
Capacity of tank = 400000litres.
Dia = 13.06m.
Free board = 200mm.
Density of water w, = 10KN/m3
Tensile stress in steel = 100N/mm2
σcbc = 7N/mm2
j = 0.841
Q = 14.01
m = 13
overall height of tank = 4+0.2 = 4.2m.
The thickness of walls and base slab are assumed to be 160mm thick.
Bending moment, ring tension and shear
[H2/Dt] = [4.22/(13.06 x 0.16)]
= 8.4
= 8.5

Is : 3370 part (iv) -1967 table 14.2
Max bending moment = -0.0122 wH3 at base
= (-0.0122x8.5x4.2 3)
= -7.683KNm
Max shear = 0.158wH2
= (0.158x8.5x4.22)
= 23.7 KN at base
Max ring tension = 0.608[(WHO/2)] at 0.64 from top
= 0.608 x 8.5 x 4.2 x (13.06/2)
= 141.74 KN
Acting at 2.52 m from top.
Steel for hoop tension
Ast = 141.74x10³ /100 = 1417mm2
Using 20mm φ bars spacing
= [(100x314)/1417]
= 221.6m
Use 20mm φ bars at 200mm c/c (As = 1571mm2)
Wall thickness required from hoop stress consider is given by,
{ (141.74x10³)/(100t+(13-1)x1571)} = 1.2
T = 99.3mm <150mm adopted
Steel for bending moment:
The thick required from bending moment consideration is usually
very small. Hence the area of steel required will be calculated.
Ast = [(7.683x10⁶)/(100x0.84x1.30)]
= 702.7mm2
Use 12mm φ bars at 130mm centers.

Vertical reinforcements:
Max vertical reinforcements at top
= [(0.3/100)x150x1000]
= 450mm2
Distributing for each face
As = 225 mm2
Provide 12mmφ bars at 400mm c/c on both faces
Base slab reinforcements:
At junction of wall and slab provide 12mmφ at 130mm centers.
At center, top and bottom
As = [(0.3/100)x150x1000]
= 450mm2
Providing top and bottom
As = 450mm2
Use 8mm φbars at 200c/c both at top and bottom and both ways.
Check for shear stress:
Max shear at base v = 23.7 KN/m
Max shear stress τv = (v/bjd)
= [(23.7x10³)/(1000x0.841x130)]
= 0.22 N/mm2 < 1.7 N/mm2 permissible.

CHAPTER 12
PEN STOCK
INTRODUCTION:
A penstock is a piping system normally used in hydraulic power
plant for conveying water from the reservoir to the powerhouse where the
turbines are located to generate power. The height maintained between the
powerhouse and the reservoir is the driving potential for the water to flow
through the penstock and reaching to the turbine. When water flows through the
penstock from the reservoir, it induces pressure in the inside surface of the
penstock pipe. This pressure is the essential cause vibration in the pipe.
The cause of vibration may be due to bending of pipes, vortex
shedding, turbulence, water hammering. Vortex shedding occurs when the flow
past an obstacle such a sphere or any other disturbing object, resulting in
vortices behind the object which may induce vibration.
Water hammer normally occurs during the opening or closing of
valves. Severe vibrations may cause failure of the piping system that can cause
the economic loss for the plant and in extreme cases it leads to loss of human
lives. In order to minimize the vibration level to the best possible extent,
“Anchor Blocks (AB)” which is concrete structures provided at the pipe joint
with the ground and the intermediate portions of the pipe are supported by
“Rocker Arms (RA)”.
The aim of this work is to study the effect of flow-induced
vibration in a penstock by coupling the fluid flow and the solid surface through
the forces exerted on the wall by fluid flow.

The fluid flow causes the structure to deform it, and then produces
changes in the flow; as a result feedback between the structure and flow occurs.
This phenomenon is called as fluid structure interaction (FSI). FSI involves
mainly three discipline; namely, computational fluid dynamics, structural
mechanics and to some extent control systems theory.
The simulation is carried out by using a software package ANSYS
where sequentially coupled physics analysis method is used for solving FSI
problems.

PENSTOCKS
Penstocks can be installed over or under the ground, depending on
factors such as the nature of the ground itself, the penstock mate rial, the
ambient temperatures and the environmental requirements. Interred penstocks
should be generally preferred to exposed ones, because of the smaller visual
impact and possible movement barri ers for animals. Nevertheless the burying
of penstocks could have major geological risks connected with the stability of
steep slopes traversed by pipes, both during construction and operation. In fact
during operation water leakage from an interred penstock could trig ger
landslides much more easily than an exposed one.
The following measures help to reduce the environmental impact
of penstocks:
PENSTOCK INTERMENT:
Penstock interment should take place whenever possible. Pipe and
coating technologies have reached a very good reliability level, so that an
interred penstock requires practically no maintenance for decades and on the
other hand the result for the environment and especially for the landscape is
excellent. However to avoid problems connected with steel pipe corrosion, with
eddy currents in the ground and to reduce maintenance, the use of plastic pipes
(glass reinforced plastic or HDPE) is advisable.
UNCOVERED ANCHORING BLOCKS:
The impact of an exposed outdoor penstock can be further reduced
if the uncovered solution for anchoring blocks is adopted. That means that the
penstock is not covered with concrete at the anchoring blocks but is connected
to them by steel beams. This solution reduces the visual impact and allows for
the inspection of the whole pipe resulting in higher construction and operation
reliability.

Schematic diagram of water flow through the penstock.
PENSTOCKS WITHOUT EXPANSION JOINTS:
Where a penstock cannot be interred for some reason, construction
without expansion joints is preferable because it doesn’t require any
maintenance or any associated access tracks or roads to the penstock with the
consequent reduction of environmental impact.
The factors include but are not limited to the following:
a. Type of shutoff at the penstock intake:
A quick closing shutoff at the penstock intake, operable under
emergency conditions, may be an alternative to a shutoff at the powerhouse.
Where maintenance and emergency shutdown can be satisfied with the intake
shutoff, the requirement for powerhouse valves can seldom be justified.
b. Length of penstock:
A long section of penstock downstream of the shutoff will increase
the time required to shut the unit down during an emergency closure, increase
the time required to unwater the unit, and increase leakage losses. Maintenance
and emergency shutdown requirements will usually justify a powerhouse
shutoff when the penstock is several hundred feet long.

c. Head:
A shutoff valve near the unit will reduce the effective head on the
unit, which in turn will reduce the leakage.
d. Multiple units per penstock:
Operational and maintenance flexibility will normally require a
separate shutoff valve for each unit. Generally, maintenance requirements alone
will justify powerhouse shutoff valves for multiple unit penstocks.
e. Type of wicket gate seal:
A tight seal reduces leakage losses. However, deterioration of the
seal with time should be considered when determining the effects of leakage.
Evaluation of the factors should consider their effects on maintenance,
emergency operations, and costs. The factors considered and basis of
determination should be included in the mechanical design memorandum.
PENSTOCK SUPPORTS:
Ring Girders
Ring girders, which are used to support long span elevated
penstocks, are constructed by welding steel plate rings to penstocks. All loads
are transferred from the penstock to the ring girder and support legs. The
support legs are welded to the ring girder, then attached to bearing plates. The
bearing plates are attached to a concrete foundation.
Ring girders should be visually inspected for signs of deterioration
and distortion. Inspection of ring girders should also include the condition of the
.coatings. The potential for premature coating failure is greater at ring girders
than at adjacent smooth penstock surfaces because ring girder surfaces are
irregular.

Often, ring girder supports must allow penstock movement caused
by changes in temperature. This movement is usually accommodated in
bearings located under the support legs. -Rocker, roller, and low friction slide
bearings are commonly used for ring girder support. The bearings should be
inspected to verify theirintegrity. They should be clean and well maintained to
allow full penstock movement throughout the full range of design temperatures.
Clean, well maintained bearings will help minimize forces in the penstock and
anchorages.
Saddle Supports
Saddle supported penstocks typically span shorter distances
between supports than ring girder supported penstocks discussed above. Stress
concentrations occur at the tip of the saddle where "horn stresses" result in the
penstock shell becoming unsupported. Saddles are usually constructed from
reinforced concrete and support the lower 120-degree arc at the penstock invert.
However, saddle supports may also be fabricated from rolled steel plate. Sheet
packing that may be lubricated with graphite can be used as a cushion between
the saddle support and the penstock. The sheet packing also permits limited
movement of the penstock relative to the support as a result of temperature
changes.
If required, the penstock shell at saddle supports is stiffened by
welding steel rings to the shell at each side of the saddle support.
Saddle support inspection should include a coating inspection and
inspection for signs of deterioration and high stress areas similar to ring girders.
Localized buckling or distortion can occur at the penstock's upper contact points
with a saddle support.
In addition, the condition of the concrete saddles should be noted
and investigated for any signs of settlement or concrete deterioration. Inspection
of the surfaces between the saddle and the shell is difficult, but important,
because significant corrosion may be occurring in the contact area.
Anchor/Thrust Blocks
Anchor/thrust blocks are designed to provide restraint to exposed
penstocks at changes in alignment. They should be assessed to verify their
support function has not been compromised. Thrust blocks should be examined
for signs of settlement and movement and for any cracking or spalling of
concrete.
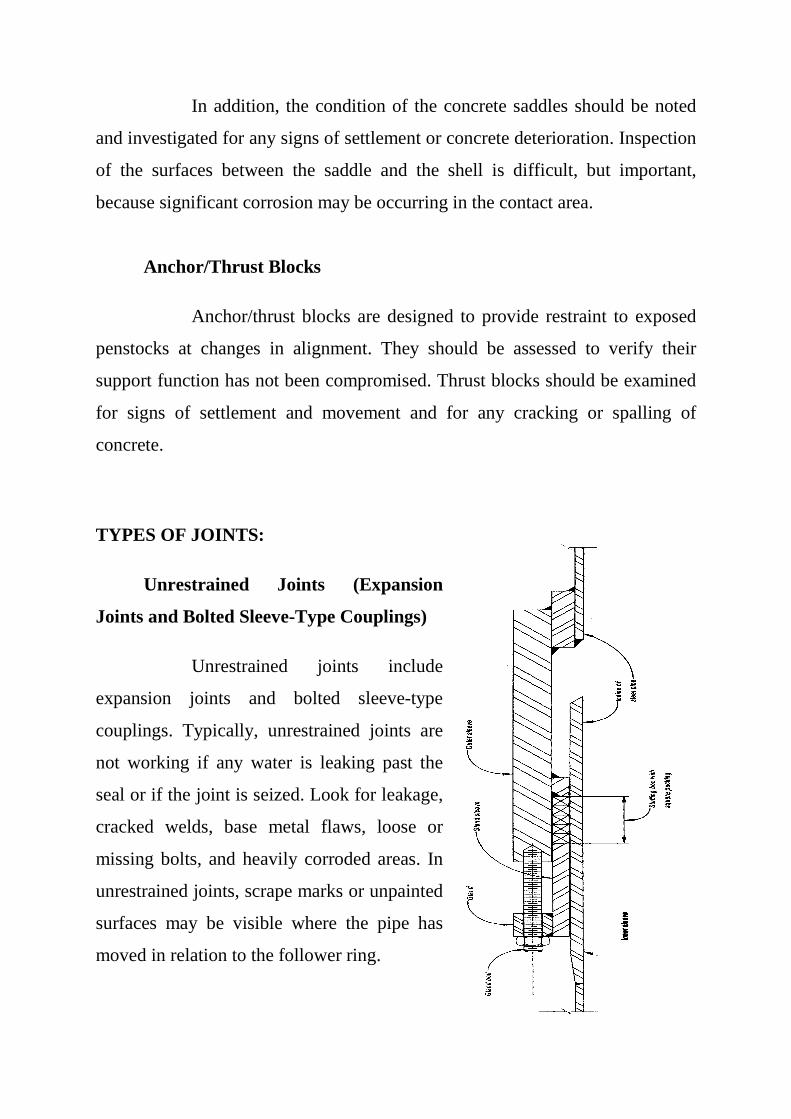
TYPES OF JOINTS:
Unrestrained Joints (Expansion
Joints and Bolted Sleeve-Type Couplings)
Unrestrained joints include
expansion joints and bolted sleeve-type
couplings. Typically, unrestrained joints are
not working if any water is leaking past the
seal or if the joint is seized. Look for leakage,
cracked welds, base metal flaws, loose or
missing bolts, and heavily corroded areas. In
unrestrained joints, scrape marks or unpainted
surfaces may be visible where the pipe has
moved in relation to the follower ring.

Restrained or Fixed Joints
Some basic types of restrained joints include lap welds, butt welds,
flanges, butt straps, and various rubber-gasketed joints. Several methods used to
attach these types of connections include rivets, forged welds, and arc-welds.
Corrosion, erosion, and flaws in the original construction can affect the
condition of structural welds, bolts, and rivets in the penstock.
i. Riveted Joints
In riveted joints, examine the
rivet head, butt strap, plate, and caulked edge
conditions (fig. 5). Look for leakage past the
rivets or the edges of the bands. Rivets may
be missing, broken, or may have corroded or
abraded heads. The base metal may also be
corroded to the extent that rivets can pull
through and be ineffective.
ii. Forge-Welded Joints
Experience with forge-welded joints has not been good. Flaws and
other fabrication defects, such as lack of fusion and slag, may be prevalent. The
welding process used in forge-welded penstocks, in which the steel is heated to
about 2000 EF, produces a loss of carbon, which makes the steel more
susceptible to corrosion. As a result, if forge-welded joints are not well
protected, corrosion may occur faster in the joints than in the base metal.

iii. Welded Joints
A representative portion of all
structural welding performed on the inside and
outside of the penstock is visually examined for
signs of rusting, pitting, or other structural
defects. For welded joints, look for cracked
base metal or welds, surface flaws, etc. Flaws
in welds during construction can occur from
high carbon content of the base material,
embrittlement of the heat affected zone,
improper preheat, and improper rate of cooling
after welding. Typically, these problems are
more likely to occur as the plate becomes
thicker or when the joint is made under adverse
construction conditions.

HYDRAULIC DESIGN OF PENSTOCK
Design discharge for penstock pipe ( 10% over design discharge )
= 59.60 cumec
.’. for single = 19.87 cumec
Full supply level at fore bay = 1020.00
Lowest elevation of penstock = 810.00
Length of penstock (approximately) = 300m
Dia of penstock D1 = 1.12 Q0.45 H-0.12
= 3.72m
Velocity through penstock = 5.5 m/Sec
Area of penstock = 10.87 m2
Head loss through penstock
HL = 0.34 x ( V1.9 / D1.1 )
x ( L / 1000)
Substitute in feet
= 0.34 ( 18.041.9 / 12.211.1 )
x ( 984 / 1000 )
= 5.2 feet
= 1.6m

WATER HAMMER PRESSURE
Ph = ( C V0 / g ) x { 1 / ( 1+ 0.5 φ) x [ 1 + As2 φ /( 4 Ao2 )
– Vo / C x ( 1/ ( 1 + 0.5 φ)) ]}
Where,
Vo = velocity of flow in tunnel corresponding to maximum study
flow, upstream of surge tank.
φ = Ratio of surge tank to that of conduit = As/At = 6.56
As = Net cross section or of surge tank
Ao = Area of the orifice ( or ) port = 20.42m2
Ph = ( 930.16 x 3 / 9.81) x [ 1/( 1 + 0.5 x 6.56 ) x { 1 + 133.942 x
6.56 / ( 4 x 20.422) – 3 / ( 930.16 ) x ( 1 / ( 1 + 0.5 x 6.56 ))}]
= 4.75MN/m2 in upstream side.
Consider C is a thin pipe the thick of which is small as compared to its
diameter.
C = [ ( g / w) / ( 1/ Ew ) + D / E.e] ½
Where
g = acceleration due to gravity ( 9.81 m2 / Sec).
w = Specific weight of water.
Ew = Young’s modulus of elasticity of water.
D = Dia of Head race tunnel.

E = Young’s modulus of elasticity of the conduit wall ( steel )
e = 0.92 ( constitutional joint efficiency )
Propagation of pressure wave:
From clause 5.5.3.6 in IS 7396 ( part – 1 ) 1985
Yo = 204.5
Interpolation:
C = 883 + ( 1000 – 883 ) / ( 300 – 140 )
x ( 204.5 – 140 )
C = 930.16m/Sec
TO FIND THE PRESSURE P:
The internal pressure P is due to Static head + Dynamic head
P = Static Head + Dynamic Head
= Ps + Ph
= γh + Ph
= 9.81 x 204.5 + 4.755x103
= 6.761 N/mm2

LONGITUTINAL STRESS DUE TO BEAM ACTION:
f = M/Z
Weight of water = 9.81 x 22/7 x 3.722/4
= 106.62 kN/m
.’. Maximum moment at center = Wl2/8
= 2.998x10⁶ Nm
Add 15% Extra moment due to self weight = 0.45x10⁶ Nm
.’. M = 3.5x10⁶ Nm
Moment of inertia I = 22 x (3.7564 - 3.724 )/( 7 x 64 )
= 0.369 m4
Y = 1.86 m
Z = I/Y
= 0.1985 m3
.’. f = M/Z
= 17.63 N/mm2
.’. Assume allowable stress f1 = 17.63 N/mm2

CIRCUMFERENTIAL STRESS:
Circumferential Stress f1 = Pd/2t
.’. t = f1 x 2 / P x d
= 0.0014 mm
But we provide 18 mm thick steel pipe
Hence The Design Is Safe
LONGITUDINAL STRESS:
Longitudinal Stress = half of the hoop stress
= 8.815 N/mm2
CHECK:
Longitudinal Stress = 8.815 N/mm2
Circumferential Stress = f1 = 17.63 N/mm2
Max Shear Stress = q = 800 N
Sx = (f1 + f2)/2 + (f1 + f2)2/2 +q2
Sx = 813.24 N/mm2
Sy = - 786.8 N/mm2
Se = Sx2 + Sy2 + 2 Sx Sy
Se = 26.44 N/mm2
For exceptional condition
Se ≥ Maximum Longitudinal stress x 0.8
≥ 8.81 x 0.8
26.44 N/mm2 ≥ 7.048 N/mm2
Hence The Design In Safe In Stress
DIAMETER OF BRANCH PIPE
Y junction is required to be provided at the end of the Penstock for
more then one unit.
The present case having three units,
The area required for each unit = 3.62 m2
Dia of Pensock D2 = D1/20.4
= 2.82 m
Provide 2.82 m internal Dia Penstock of 18 mm thick having Outer Dia of
2.856 m.
Area provided = 6.24 m2 > 3.62 m2
Hence the Design Is Safe

LINER THICKNESS:
.’. Thickness of steel liner as per Clause 8.2 in IS11639 (part 1) – 1986
t = (D + 50)/ 800
= (372+50)/800
= 0.53cm

SUMMARY AND OUTLOOK:
Essential results of the study are:
• Evaluation and assessment of the existing small-scale hydropower plants.
• Evaluation of ecologically justifiable development potential in existing plants that is of interest with regard to energy production
Evaluation of ecologically justifiable development potential in undeveloped river stretches that is of interest with regard to energy production.
On account of the worldwide growing energy demand renewable
energy sources play an increasingly important role. Energy generated from
hydropower which, in contrast to wind energy, ensures base-load supply,
comprises an important component of the diversifications of energy resources.
The interdisciplinary study of existing energy resources permits ecologically
sustainable resources to be systematically developed in future in order to join
the worldwide efforts for environmentally friendly and sustainable construction.
New studies on the erection of new hydropower projects are
needed. Most of the power plant projects currently being designed and built are
based on more than 20-year-old studies. The technical, economic and ecological
boundary conditions have changed significantly when one takes into account the
globalization of the energy market. That is why it is necessary to elaborate
power plant studies which address these changed conditions in order to achieve
the best possible efficiency and effectiveness when implementing new
hydropower projects.