Design of Experimental Setup for Visualization Studies of ...
3
Twelve International Conference on Thermal Engineering: Theory and Applications February 23-26, 2019, Gandhinagar , India 1 Design of Experimental Setup for Visualization Studies of Two Phase Liquid Nitrogen G. K. Singh, R. Patel, R. Panchal, H. Nimawat, S. Pradhan and V.L. Tanna Institute for Plasma Research, HBNI, Bhat, Gandhinagar-382 428 Gujarat, India Abstract A lab-scale experimental setup for Liquid Nitrogen (LN2) two-phase visualization has been custom designed, fabricated and realized [1]-[2]. Studies of the flow structure in horizontal two-phase flow involving cryogenic fluid is classified according to the phase distributions. "Flow patterns" or "regimes" are the categorized according to phase distribution within the channel. For various LN2 flows, vapor quality is estimated for fixed Gaseous Nitrogen (GN2) flow. The setup comprises a Pyrex viewing section for the observation and recording of the flow structure or patterns using a digital imaging device, several sensors such as temperature, pressure and flow meters are mounted in experiment setup to monitor the flow conditions. Visualizations studies of the flow with LN2 have revealed several transitions in flow structure depending on the initial conditions. This experiment on two-phase flow characteristics, in a horizontal line, has shown several flow patterns. These flow patterns are repetitive at the given inlet conditions. As there is a heat exchanger after testing section, the LN2 is converted to GN2 for the flow measurement. There are some fluctuations in mass flow rate and accordingly, it is reflected in the flow patterns. Keywords: Two phase flow, cryogenics, liquid nitrogen, void fraction, vapour quality. 1. Introduction The turbulent mixing of the two different phases and compressible nature of the gas phase lead to the complexity in the two-phase flow. Several other factors like mass flow rates of individual phases, fluid thermo- physical properties, channel geometry and orientation etc. also influence the turbulent nature of the flow. In order to quantify and visualize the flow patterns of the Two-Phase (TP) flow in a horizontal configuration an experimental investigation is carried out, which is presented in this paper. A custom designed laboratory scale Liquid Nitrogen (LN2) TP visualization experimental facility is fabricated to study the flow structure in horizontal TP flow. Based on different flow patterns the TP flow has been categorized into different flow regimes. Keeping the GN2 flow fixed, the vapor quality is calculated for various LN2 flow rates. The flow structures are observed through a Pyrex viewing section. The data are recorded using a digital imaging device. Several other sensors are employed to measure the temperature and pressure to monitor the flow conditions. 2. Experimental Setup 2.1. Optimization of the experimental parameters Operating pressure, dimensions of the process tube and measurement probe and the design of the heat exchanger must be optimized for visualization experiments. A 50 litre cryostat with an upper limit on the operational pressure head of 500 mbar is used as the LN2 supply source. This limit has been one of the prime considerations in designing the experiment. The variation of flow pattern with varying mass flow during cool down is recorded. To determine the quality of the flow two Venturi flow meters are employed to measure the mass flow flow of the gas and the total mass flow. Using these values of the flow quality the void fraction is calculated using empirical correlations. The void fraction determines the flow regime and flow pattern for the given quality. Table 1: Dimensions of the Test section and heat exchanger Process Line Outer Jacket Heater exchanger Pyrex glass L= 1 m I.D=9 mm O.D=12 mm Pyrex glass L= 1 m I.D=25 mm O.D=28 mm L=1.5 m Material= Cu I.D= 10mm Based on the operating pressure, vacuum conditions and visible access to the flow the Pyrex glass process tube and vacuum jacket dimensions are determined. The leak tightness of the connections of the glass to metal flanges is ensured at cold temperatures before the experiment. All the interconnections are thermally insulated. The flow patterns are recorded at different places in a test section of 1 m length. TP LN2 is converted to nitrogen gas by a heat exchanger, made of
Transcript of Design of Experimental Setup for Visualization Studies of ...

Twelve International Conference on Thermal Engineering: Theory and Applications February 23-26, 2019, Gandhinagar , India
1
Design of Experimental Setup for Visualization Studies of Two Phase Liquid Nitrogen
G. K. Singh, R. Patel, R. Panchal, H. Nimawat, S. Pradhan and V.L. Tanna
Institute for Plasma Research, HBNI, Bhat, Gandhinagar-382 428 Gujarat, India
Abstract A lab-scale experimental setup for Liquid Nitrogen (LN2) two-phase visualization has been custom designed,
fabricated and realized [1]-[2]. Studies of the flow structure in horizontal two-phase flow involving cryogenic fluid is classified according to the phase distributions. "Flow patterns" or "regimes" are the categorized according to phase distribution within the channel. For various LN2 flows, vapor quality is estimated for fixed Gaseous Nitrogen (GN2) flow. The setup comprises a Pyrex viewing section for the observation and recording of the flow structure or patterns using a digital imaging device, several sensors such as temperature, pressure and flow meters are mounted in experiment setup to monitor the flow conditions. Visualizations studies of the flow with LN2 have revealed several transitions in flow structure depending on the initial conditions. This experiment on two-phase flow characteristics, in a horizontal line, has shown several flow patterns. These flow patterns are repetitive at the given inlet conditions. As there is a heat exchanger after testing section, the LN2 is converted to GN2 for the flow measurement. There are some fluctuations in mass flow rate and accordingly, it is reflected in the flow patterns. Keywords: Two phase flow, cryogenics, liquid nitrogen, void fraction, vapour quality.
1. Introduction The turbulent mixing of the two different phases and
compressible nature of the gas phase lead to the complexity in the two-phase flow. Several other factors like mass flow rates of individual phases, fluid thermo-physical properties, channel geometry and orientation etc. also influence the turbulent nature of the flow. In order to quantify and visualize the flow patterns of the Two-Phase (TP) flow in a horizontal configuration an experimental investigation is carried out, which is presented in this paper.
A custom designed laboratory scale Liquid Nitrogen (LN2) TP visualization experimental facility is fabricated to study the flow structure in horizontal TP flow. Based on different flow patterns the TP flow has been categorized into different flow regimes. Keeping the GN2 flow fixed, the vapor quality is calculated for various LN2 flow rates. The flow structures are observed through a Pyrex viewing section. The data are recorded using a digital imaging device. Several other sensors are employed to measure the temperature and pressure to monitor the flow conditions.
2. Experimental Setup
2.1. Optimization of the experimental parameters Operating pressure, dimensions of the process tube
and measurement probe and the design of the heat
exchanger must be optimized for visualization experiments. A 50 litre cryostat with an upper limit on the operational pressure head of 500 mbar is used as the LN2 supply source. This limit has been one of the prime considerations in designing the experiment. The variation of flow pattern with varying mass flow during cool down is recorded. To determine the quality of the flow two Venturi flow meters are employed to measure the mass flow flow of the gas and the total mass flow. Using these values of the flow quality the void fraction is calculated using empirical correlations. The void fraction determines the flow regime and flow pattern for the given quality.
Table 1: Dimensions of the Test section and heat exchanger
Process Line Outer Jacket Heater exchanger
Pyrex glass L= 1 m I.D=9 mm O.D=12 mm
Pyrex glass L= 1 m I.D=25 mm O.D=28 mm
L=1.5 m Material= Cu I.D= 10mm
Based on the operating pressure, vacuum conditions
and visible access to the flow the Pyrex glass process tube and vacuum jacket dimensions are determined. The leak tightness of the connections of the glass to metal flanges is ensured at cold temperatures before the experiment. All the interconnections are thermally insulated. The flow patterns are recorded at different places in a test section of 1 m length. TP LN2 is converted to nitrogen gas by a heat exchanger, made of
2
copper, installed at the end of the test section. T\At this point, he Venturi flow meter measures the total mass flow rate. This also contributes into the pressure drop. The heat exchanger dimensions are optimized according to the mass flow rate and operating conditions.
2.2. Experiment Setup
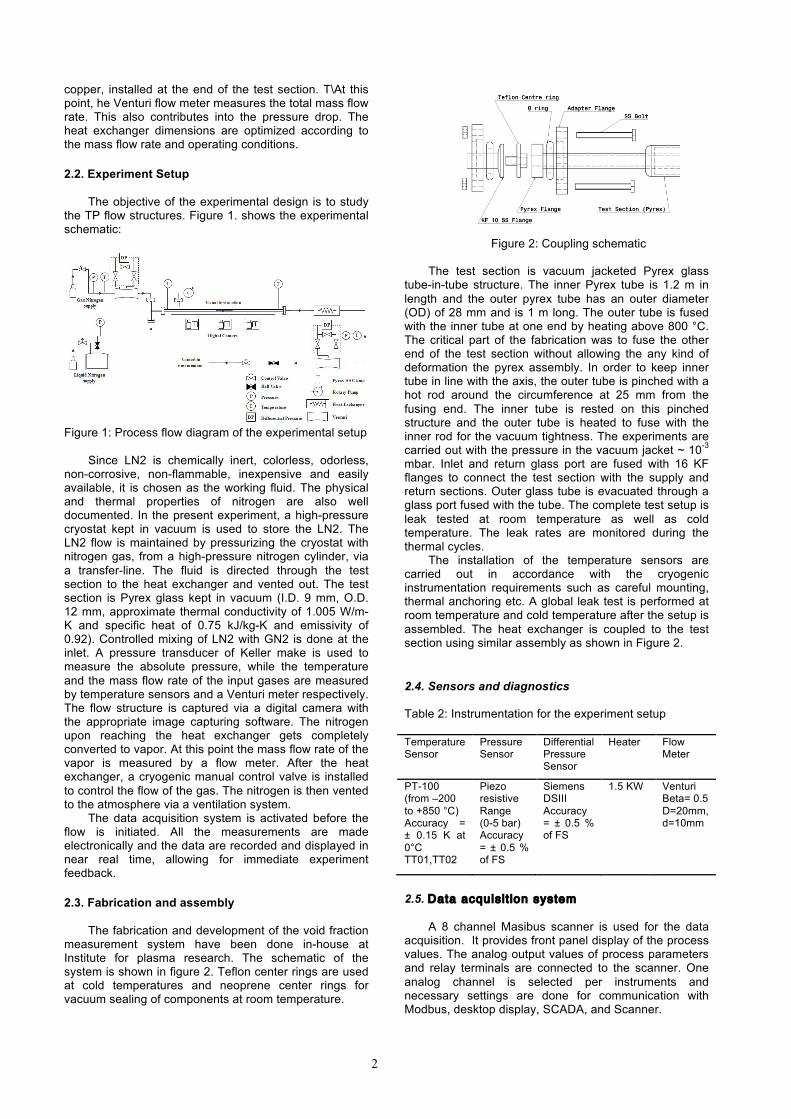
The objective of the experimental design is to study the TP flow structures. Figure 1. shows the experimental schematic:
Figure 1: Process flow diagram of the experimental setup
Since LN2 is chemically inert, colorless, odorless,
non-corrosive, non-flammable, inexpensive and easily available, it is chosen as the working fluid. The physical and thermal properties of nitrogen are also well documented. In the present experiment, a high-pressure cryostat kept in vacuum is used to store the LN2. The LN2 flow is maintained by pressurizing the cryostat with nitrogen gas, from a high-pressure nitrogen cylinder, via a transfer-line. The fluid is directed through the test section to the heat exchanger and vented out. The test section is Pyrex glass kept in vacuum (I.D. 9 mm, O.D. 12 mm, approximate thermal conductivity of 1.005 W/m-K and specific heat of 0.75 kJ/kg-K and emissivity of 0.92). Controlled mixing of LN2 with GN2 is done at the inlet. A pressure transducer of Keller make is used to measure the absolute pressure, while the temperature and the mass flow rate of the input gases are measured by temperature sensors and a Venturi meter respectively. The flow structure is captured via a digital camera with the appropriate image capturing software. The nitrogen upon reaching the heat exchanger gets completely converted to vapor. At this point the mass flow rate of the vapor is measured by a flow meter. After the heat exchanger, a cryogenic manual control valve is installed to control the flow of the gas. The nitrogen is then vented to the atmosphere via a ventilation system.
The data acquisition system is activated before the flow is initiated. All the measurements are made electronically and the data are recorded and displayed in near real time, allowing for immediate experiment feedback.
2.3. Fabrication and assembly The fabrication and development of the void fraction
measurement system have been done in-house at Institute for plasma research. The schematic of the system is shown in figure 2. Teflon center rings are used at cold temperatures and neoprene center rings for vacuum sealing of components at room temperature.
Figure 2: Coupling schematic
The test section is vacuum jacketed Pyrex glass
tube-in-tube structure. The inner Pyrex tube is 1.2 m in length and the outer pyrex tube has an outer diameter (OD) of 28 mm and is 1 m long. The outer tube is fused with the inner tube at one end by heating above 800 °C. The critical part of the fabrication was to fuse the other end of the test section without allowing the any kind of deformation the pyrex assembly. In order to keep inner tube in line with the axis, the outer tube is pinched with a hot rod around the circumference at 25 mm from the fusing end. The inner tube is rested on this pinched structure and the outer tube is heated to fuse with the inner rod for the vacuum tightness. The experiments are carried out with the pressure in the vacuum jacket ~ 10-3 mbar. Inlet and return glass port are fused with 16 KF flanges to connect the test section with the supply and return sections. Outer glass tube is evacuated through a glass port fused with the tube. The complete test setup is leak tested at room temperature as well as cold temperature. The leak rates are monitored during the thermal cycles.
The installation of the temperature sensors are carried out in accordance with the cryogenic instrumentation requirements such as careful mounting, thermal anchoring etc. A global leak test is performed at room temperature and cold temperature after the setup is assembled. The heat exchanger is coupled to the test section using similar assembly as shown in Figure 2.
2.4. Sensors and diagnostics Table 2: Instrumentation for the experiment setup
Temperature Sensor
Pressure Sensor
Differential Pressure Sensor
Heater Flow Meter
PT-100 (from –200 to +850 °C) Accuracy = ± 0.15 K at 0°C TT01,TT02
Piezo resistive Range (0-5 bar) Accuracy = ± 0.5 % of FS
Siemens DSIII Accuracy = ± 0.5 % of FS
1.5 KW Venturi Beta= 0.5 D=20mm, d=10mm
2.5. Data acquisit ion system
A 8 channel Masibus scanner is used for the data acquisition. It provides front panel display of the process values. The analog output values of process parameters and relay terminals are connected to the scanner. One analog channel is selected per instruments and necessary settings are done for communication with Modbus, desktop display, SCADA, and Scanner.
3
Figure 3: Data acquisition system block diagram The Output voltage V of the electronics for particular
instrument is connected with the analog input channel of the scanner. Programming for the analog input channel number, upper, lower voltage range, baud rate, parity bit etc. is done manually. The scanner does A/D conversion and gives proportional count values for communication with SCADA. RS485 interface is required for communication configuration with the PC. Figure 3 shows the block diagram for the data acquisition done for the setup. Each process value from the scanner is addressed with Modbus formatting.
3. Experimental results
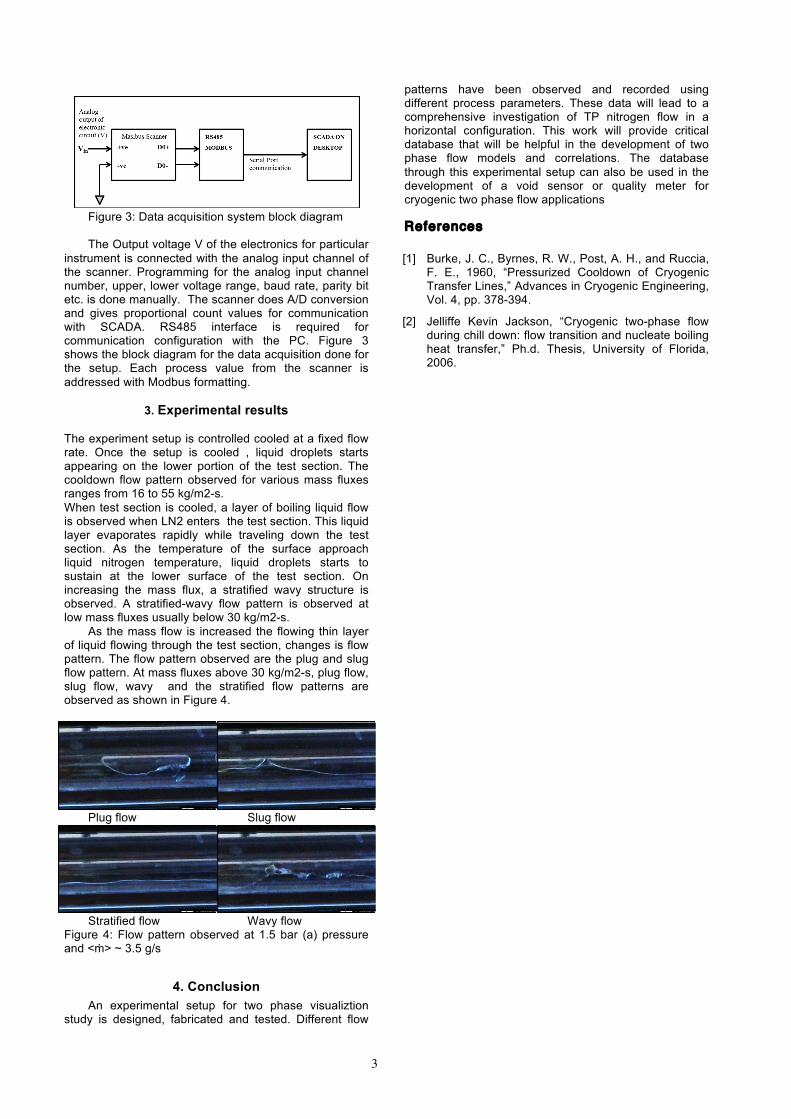
The experiment setup is controlled cooled at a fixed flow rate. Once the setup is cooled , liquid droplets starts appearing on the lower portion of the test section. The cooldown flow pattern observed for various mass fluxes ranges from 16 to 55 kg/m2-s. When test section is cooled, a layer of boiling liquid flow is observed when LN2 enters the test section. This liquid layer evaporates rapidly while traveling down the test section. As the temperature of the surface approach liquid nitrogen temperature, liquid droplets starts to sustain at the lower surface of the test section. On increasing the mass flux, a stratified wavy structure is observed. A stratified-wavy flow pattern is observed at low mass fluxes usually below 30 kg/m2-s.
As the mass flow is increased the flowing thin layer of liquid flowing through the test section, changes is flow pattern. The flow pattern observed are the plug and slug flow pattern. At mass fluxes above 30 kg/m2-s, plug flow, slug flow, wavy and the stratified flow patterns are observed as shown in Figure 4.
Plug flow Slug flow
Stratified flow Wavy flow Figure 4: Flow pattern observed at 1.5 bar (a) pressure and <ṁ> ~ 3.5 g/s
4. Conclusion An experimental setup for two phase visualiztion
study is designed, fabricated and tested. Different flow
patterns have been observed and recorded using different process parameters. These data will lead to a comprehensive investigation of TP nitrogen flow in a horizontal configuration. This work will provide critical database that will be helpful in the development of two phase flow models and correlations. The database through this experimental setup can also be used in the development of a void sensor or quality meter for cryogenic two phase flow applications
References
[1] Burke, J. C., Byrnes, R. W., Post, A. H., and Ruccia, F. E., 1960, “Pressurized Cooldown of Cryogenic Transfer Lines,” Advances in Cryogenic Engineering, Vol. 4, pp. 378-394.
[2] Jelliffe Kevin Jackson, “Cryogenic two-phase flow during chill down: flow transition and nucleate boiling heat transfer,” Ph.d. Thesis, University of Florida, 2006.