Design of a nature-based air purifier
92
Master Thesis of Antonio Chozas Plasencia Design of a nature-based air purifier
Transcript of Design of a nature-based air purifier

Master Thesis ofAntonio Chozas Plasencia
Design of a nature-based airpurifier

Master Thesis of Antonio Chozas Plasencia
Faculty of Industrial Design Engineering MSc Integrated Product DesignDelft University of TechnologyDelft, December 2020
Supervisory team:
Chair: David Keyson
Mentor: Dicky Brand
Graduate student:
Antonio Chozas PlasenciaAan’t Verlaat 33G 2612 XW DelftThe Netherlands+34 637048789
Delft University of TechnologyLandberghstraat 152628CE DelftThe Netherlands
01

Executive summaryAcknowledgements
Before starting, I would like to thank the support of several people that, in one way or another, have helped me to take this project forward.
In the first place, thanks to my supervisors David Keyson and Dicky Brand for their wise tips during the process, their flexibility and for allowing me to manage the project in the way I found convenient. With the University partially closed, it hasn’t been an usual coaching, but it has been crucial for me to keep pace and be able to progress with the certainty of being in the correct way. In times of overwhelm, nothing like a good supervisor’s feedback session!
Secondly, I would like to thank all the people that have accepted to help me during the project, by doing questionnaires, user tests, interviews or simply giving support. Thanks for your time and kindness. Special mention to Martin Verwaal, Satya and Ali for introducing me properly into the world of electronics, and solving all the doubts that appeared during the process.
I would also like to thank Adán Sánchez for introducing me into the botanical biofiltration world, for the good time of collaboration and for the advice and guidance during the project.
In the moral aspect, thanks to my beloved family for their support and economic help to live this beautiful journey, and thanks to my multinational friends for their love and company.
This report showcases the design process of an air purifier that is based on the technology ‘active botanical biofiltration’, is designed specifically for a target group and it serves as an exploration of solar power applied to the mentioned technology.
Indoor air contamination is a big problem for our urbanized societies, as it causes chronic diseases and SBS symptoms (headache, dizziness, irritation, etc…) to the buildings occupants. Active botanical biofiltration has been proved in the last decades as a valuable option to reduce indoor air contamination. It can target a big range of pollutants, increase the thermal comfort and improve the indoors spatial quality, in a low maintenance and low energy requiring way. Currently, several portable active botanical biofilters can be found in the market. All the products follow the main principle of the technology: plant combined with an airflow; and differ from each other with other features such as air monitoring, water tank or app interface.
Given the described situation, a research process is carried out about the active botanical biofiltration (literature research), the functionalities and aesthetics desired by the user (questionnaires and interviews) and the possibilities around powering the device with solar energy (literature research). After synthesizing this research, the design requirements that the product should follow are:
- Product targeted to Western Europeans, living in big cities and older than 30 years old.
- Product to include the functionalities: airflow generated by one fan; solar powered; water tank with water level indicator; upgradeable system and not including monitoring functionalities.
- Product to look like a normal potted plant but doing something extra; minimalistic, subtle, neutral, timeless, functional and natural.
- Product to use white ceramic and wood as main materials.
After showing the process of research and synthesis, the final result of the product is shown in detail (digital design and functional prototype) together with the steps that lead to that final shape (prototyping, iterations, user testing, etc…).
As a last step in the process, the prototype is used to carry out a design evaluation regarding the user experience and product’s performance in improving air quality (for CO2, VOCs, T and %H). With respect to the results performed, it seems that the device is able to increase the relative humidity (from 50% to 55% in the tests), but no big effects were noticed in contaminants removal. However, a big part of the obtained results are inconsistent, which points to the need of repeating the tests in a more controllable environment. On the other hand, the user experience test results are positive, as the users felt a positive effect in their perception over the space the product was being used, and the aesthetic style is appropriate according to the user’s opinions. Besides, two areas were recommended to be improved: making the integration of the solar panels in a more subtle way, and accompanying the device with clear and reliable performance results about the product in real life scenarios.
02 03

1. Introduction 10 - 21
1.1. Indoor air quality 10 - 13
1.1.1. Sources of indoor air contamination 11 - 12
1.1.2. Effects on human health 12 - 13
1.1.3. Recommended solutions to reduce the indoor air contamination 13
1.2. Active botanical biofiltration 14 - 21
1.2.1. How do active botanical biofilters work? 15 - 16
1.2.2. Advantages & disadvantages with respect to other systems 17
1.2.3. Portable active botanical biofilters: a view into the market 18 - 21
2. Assignment 24 - 32
2.1. Current state of active botanical biofiltration 24
2.2. Scope 25 - 26
2.2.1. Out of the scope 25
2.2.2. Inside the scope 25 - 26
2.3. Problem definition 27
2.4. Methodology 28 - 32
3. Research 36 -
3.1. A deeper view into the active botanical biofiltration 36 - 41
3.1.1. Basic components 36 - 37
3.1.2. Factors that influence the performance 38 - 41
3.2. What do West Europeans think about nature-based air purifiers 42 - 69
3.2.1. Questionnaire results 42 - 47
3.2.2. Interviews results 48 - 69
3.3. Powering an indoor device with solar energy 70 - 75
3.3.1. Indoor light conditions 70 - 71
3.3.2. Outdoor solar cells and indoor solar cells 72 - 75
4. Synthesis 78 - 85
4.1. Conclusions from the research 78 - 83
4.1.1. Indoor solar power 78 - 79
4.1.2. Target group 79 - 80
4.1.3. Functionalities 80 - 81
4.1.4. Look & feel 81 - 83
4.2. Design requirements overview 84 - 85
5. Design proposal 88 - 141
5.1. Proposed solution 88 - 118
5.1.1. Product components 98 - 103
5.1.2. Biofiltering system 104 - 105
5.1.3. Power system 106 - 111
5.1.4. Watering system 112 - 113
5.1.5. Preliminary manufacturing and cost production 114 - 118
5.2. Design process 120 - 141
5.2.1. Looks and components configuration 120 - 133
5.2.2. Electronics configuration 134 - 141
6. Design evaluation 144 - 166
6.1. User test 145 - 149
6.1.1. Test purpose 145
6.1.2. Test setup 145
6.1.3. Test results & discussion 146 - 149
Index
04 05

6.2. Performance test 150 - 166
6.2.1. Test purpose 150
6.2.2. Test setup 151 - 153
6.2.3. Test results 154 - 164
6.2.4. Discussion 164 - 166
7. Conclusions 170 - 171
8. References 174 - 177
06 07

Introduction

1.1.1. Sources of indoor air contamination Why is the air contaminated indoors? Shouldn’t it be contaminated outdoors, where the cars and factories are running?
Besides the cars and factories that contaminate the air in the cities, there are also contamination sources that are commonly found at interior spaces. It is well known that specific household materials and products become a contamination source just by their presence, as they gassoff pollutants that are harmful for human health. Added to these materials, activities like heating, cooking, printing, smoking, using cleaning products or just the presence of other human beings bring contaminants to the air as well.
The most common indoor air contamination pollutants are: volatile organic compounds (VOCs) which are mainly released by the mentioned gassing-off effect of some household products; inorganic gases (ICs) such as CO or NO2; and particulate matter (PM), which includes those particles present in the air smaller than 10 micrometers like dust, soot or pollen.
Here is a short sample of the long list of contaminants and the main sources they are coming from:
The time that the human being spends at indoor spaces is different depending on the lifestyle, the climate or the occupation of the person in question. It is very probable that an agriculturist living in Malaysia will spend much more time outdoors than a lawyer based in New York.
When observing the last decades, as the populations are becoming more urbanised, the average time spent indoors is also increasing significantly. As a reference number, in 2001 it was estimated that the USA inhabitants were spending 86% of their time indoors (N. E. Klepeis et al, 2001).
The big amount of time that the human being spends indoors, ‘isolated’ from the exterior,
implies that all this time is breathing an air that is also ‘isolated’ from the exterior as well. Then it is important to ask, how good is the quality of this air? The World Health Organization (2010) answers this question by pointing that the contamination present at indoor spaces is responsible for nearly 1,6 million deaths per year, as well as the 3% of the global burden of disease, having a larger impact in health than the outdoors contamination.
Taking these data into account, and with the prospect of a society which tends to become more and more urbanised in the coming years, it seems to be a good idea to prepare better these indoor spaces for human biology, transforming them into habitable and healthy environments.
1.1 Indoor air quality
Figure 1. Time that USA inhabitants spent in 6 different
locations on the diary day. Source: NHAPS, 2001
Indoors 68.7%
Office 5.4% 11% Other indoors
5.5% Vehicles
7.6% Outdoors
1.8%
Bar - Restaurant
Building materials and furniture such as plywood, PVC, paints, adhesives, etc (MRC Institute for Environment and Health, 1999) (WHO, 2010)
Benzene
Benzene
Benzene
Formaldehyde
Formaldehyde
CO
CONO2
PM
Gasolines vapours from attached garages (Dodson RE et al, 2008) (EPA, 2020)
Fuels such as coal, wood, gas, kerosene, liquid petroleum used in heating and cooking (Ilgen et al, 2001) (WHO, 2010) (EPA, 2020)
Household cleaning products such as detergents, disinfectants, softeners and carpet cleaners (WHO, 2010)
Polycyclic aromatic
hydrocarbons
10 11
- Aggravation of coronary and respiratory disease symptoms (EPA, 2020)- Premature death in people with heart or lung disease (EPA, 2020)
NO2:
- Development of acute or chronic bronchitis (EPA, 2020)- Increased risk of respiratory infections, specially in young children (EPA, 2020)
1.1.3. Recommended solutions to reduce the indoor air contamination
How can the indoor air contamination be avoided or reduced? The United States Environmental Protection Agency (EPA) (2020) suggests 3 different routes to tackle the indoor air contamination problem: source control, improve the ventilation and the implementation of air cleaners.
Source control:
This approach suggests to spot those elements that are the cause of the contamination, to then be able to locally fix them. For instance, in the case of finding an asbestos source, this one can be sealed or enclosed. Or in case of finding out that the contamination comes from the gas stoves, these ones can be adjusted to reduce their emissions.
Ventilation:
Improving the ventilation means increasing the amount of outdoor air that gets into the indoor space. This effect can be achieved by simply opening windows and doors; or by the
implementation of mechanical systems integrated in the building, which can also be connected to the HVAC (Heating Ventilation Air Conditioned) system.
Air cleaners: The basic functioning of these devices is to circulate air through their inner filters, so harmful substances such as VOCs, IC, PM or allergens (depending on the type of air cleaner) can be captured. They can be portable, or integrated in the HVAC system.
They use different ways of eliminating the pollutants from the air:
HEPA filters: These filters use materials such as fiberglass, cotton or foam to trap inside the particle matter.
Ionizers, ozone generators and electrostatic filters: The aim of these filters is to charge the particles in the air, making them stick to surfaces or be attracted by the device.
Active botanical biofilters: In this case, the system formed by the plant and the substrate acts as the filter. A quick overview of these systems is shown in the next chapter.
On the other hand, the effect that the indoor contamination has on health becomes greater as the indoor space is more isolated from the exterior. If the air renovation ratio is greater, the contaminants will have less time to accumulate around us. In this way, a well ventilated room will have a better air quality than a room with poor ventilation.
However, with the intention of building more energetic efficient buildings, a new generation of airtight constructions has been built in the last decades. In these buildings, the heat transfer with the outside is decreased by reducing the air exchange with the outside. As commented before, a low air exchange with the outside increases the effect contaminants have on human health, and therefore new health problems have appeared in the occupants of these buildings.
1.1.2. Effects on human health
The effect of these contaminants can be divided in two: the ones that occur after a short time exposure to the contaminants (hours), and the ones that occur after long time exposure (years).
Short term effects
There is a link with the symptoms of the phenomenon called “Sick Building Syndrome” (SBS) (Goodman et al, 2017). These symptoms are (Potter, 1988):
- Sensoric irritation in eyes, nose or throat.- Skin irritation- Mental fatigue, drowsiness, difficulty of concentration, headache, nausea, tiredness- Runny nose and eyes- Unpleasant odour and taste
Long term effects
There is a relationship between chronic exposure to these contaminants and some critical diseases.
Benzene:
- Hematological effects such as aplastic anaemia, pancytopenia, thrombocytopenia, granulopenia, lymphopenia and leukaemia (WHO, 2010)- Lung cancer (Yin SN et al, 1996)
Formaldehyde:
- Nasopharyngeal cancer (WHO, 2010)- Sinonasal cancer (IARC, 2006)
Polycyclic aromatic hydrocarbons:
- Bronchitis, asthma and asthma-like symptoms (Miller LR et al, 2004)- Lung cancer (WHO, 2010)
Particulate matter:
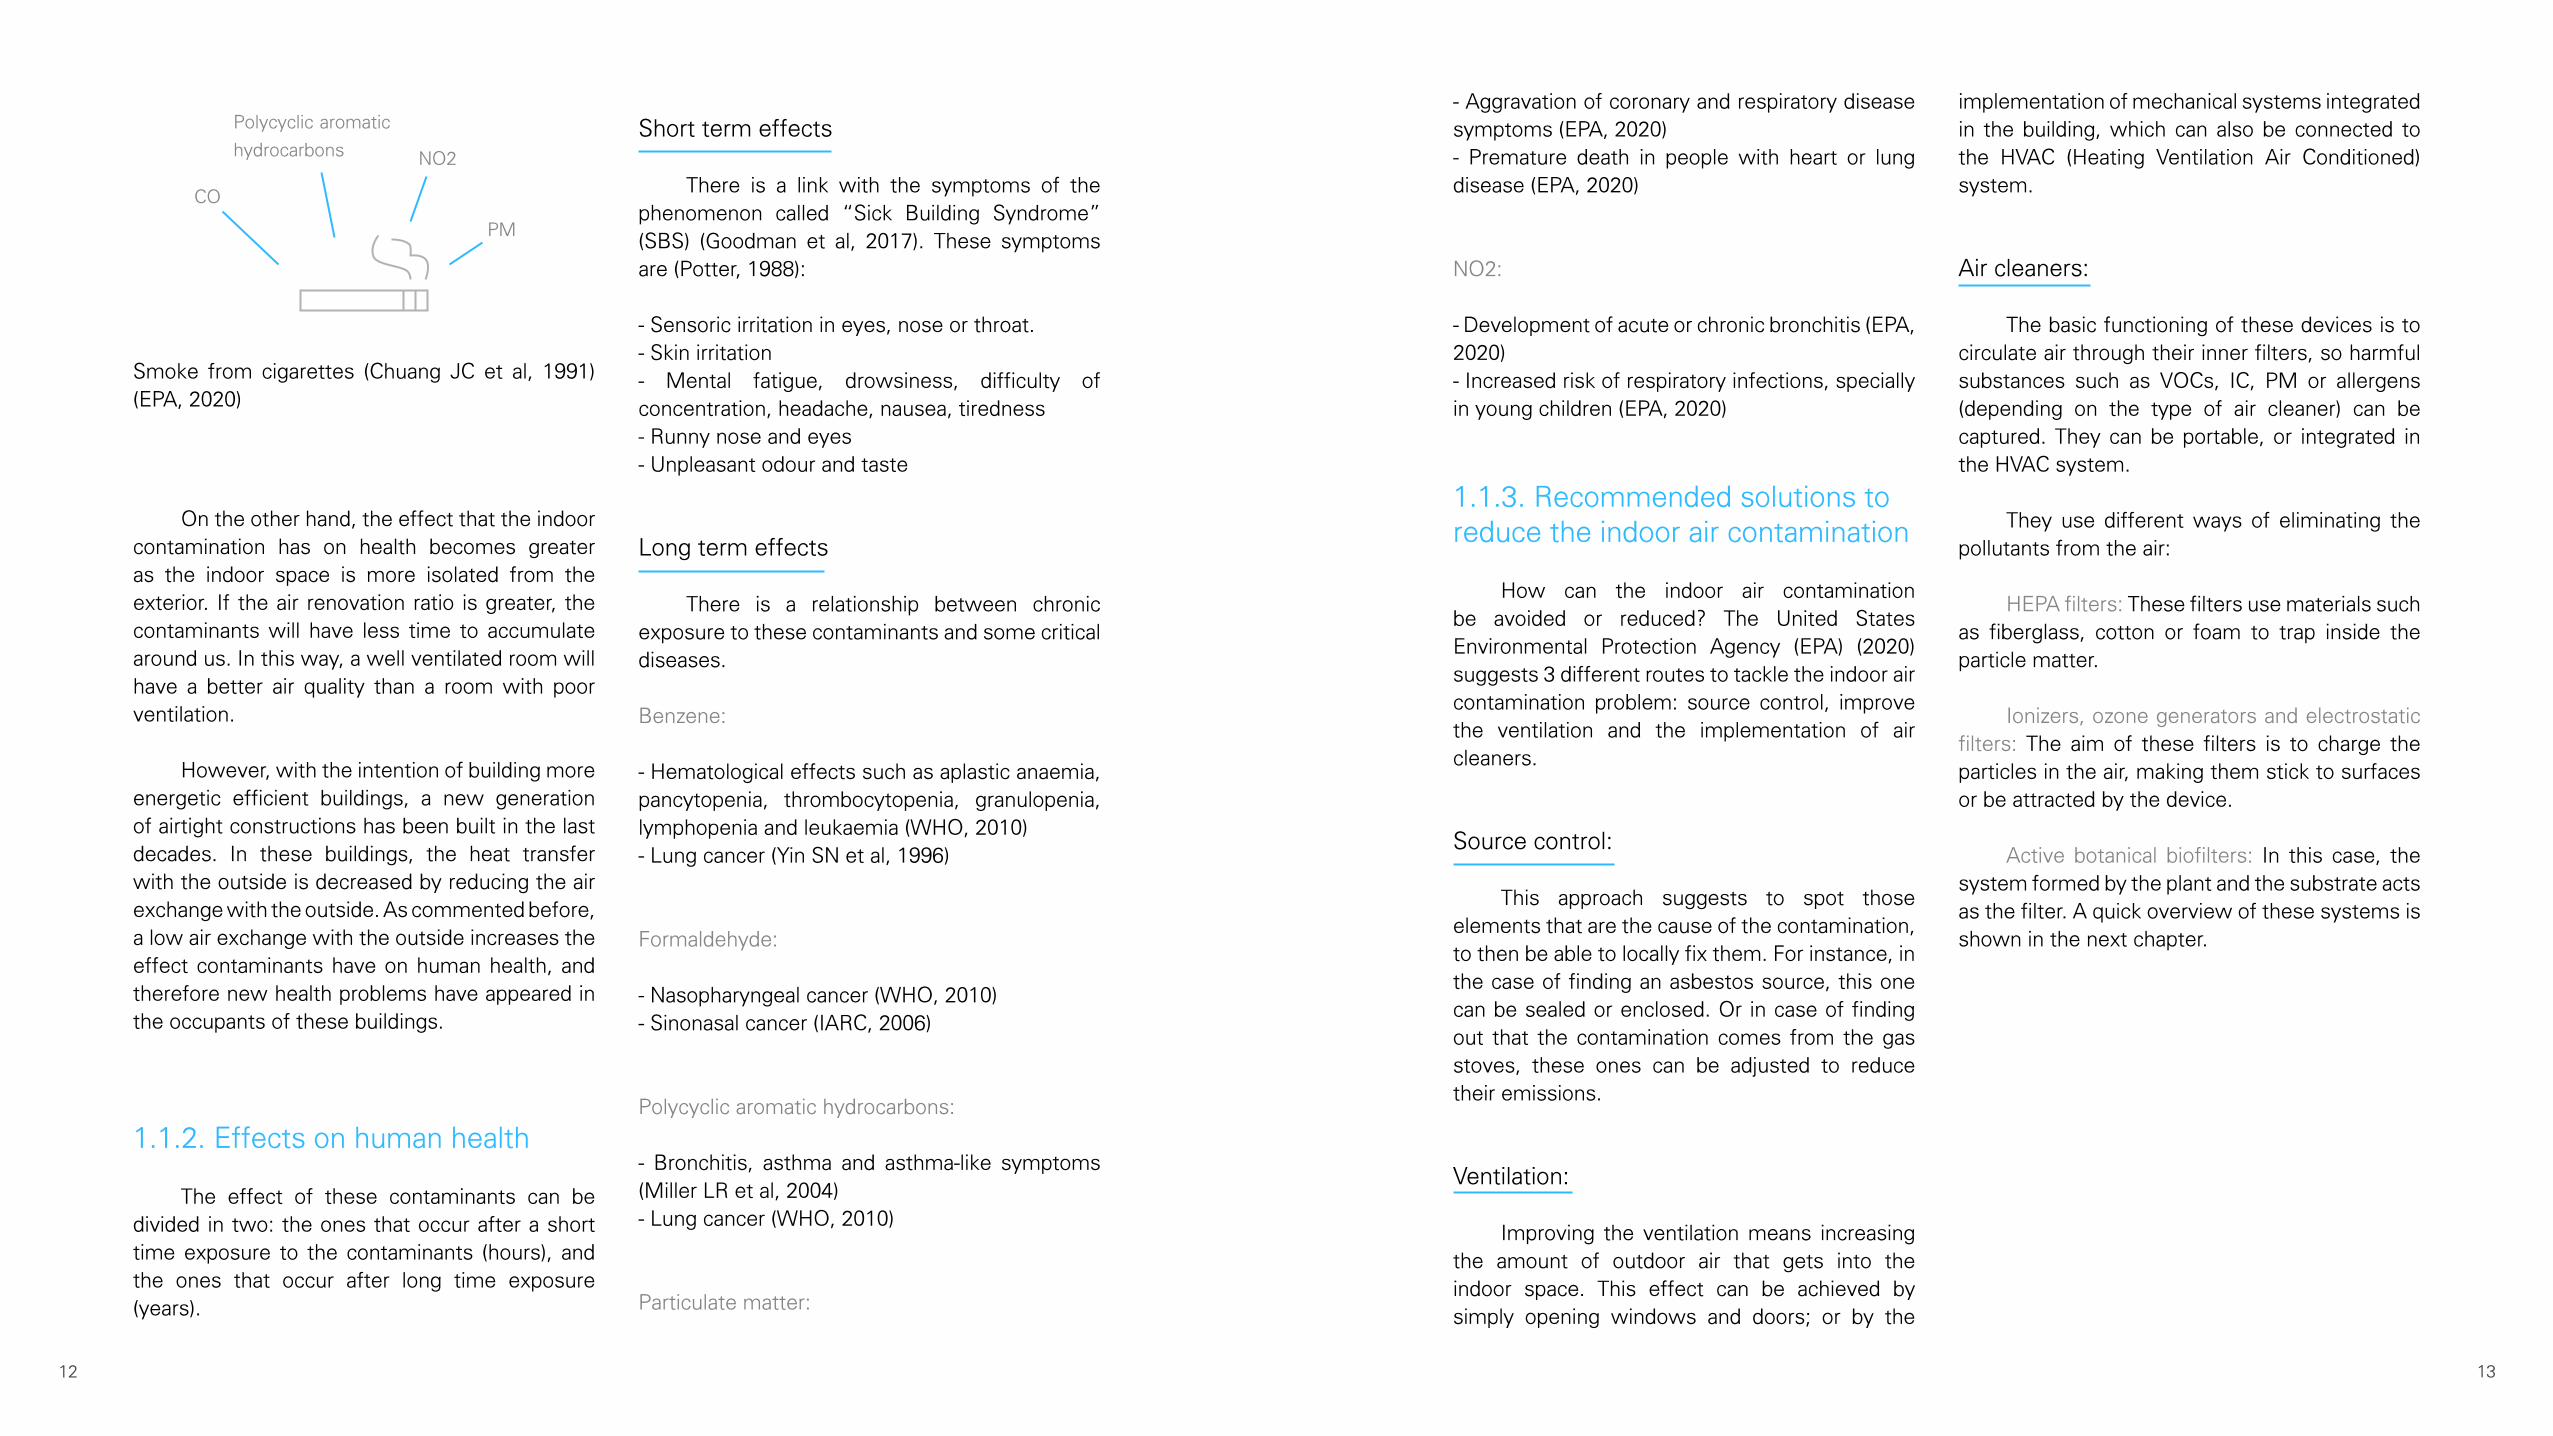
Smoke from cigarettes (Chuang JC et al, 1991) (EPA, 2020)
CO
NO2
PM
Polycyclic aromatic
hydrocarbons
12 13

The term ‘active botanical biofiltration’ refers to those systems that use plants and the microorganisms present in the rhizosphere (area which is near or inside the roots) to remove pollutants from an air stream that is actively forced through the filter (Gabriela Soreanu et al, 2013).
1.2.1. How do active botanical biofilters work?
These systems are able to reduce the air contamination due to the combination of two processes: ‘biofiltration’ and ‘phytoremediation’
Biofiltration:
1. The contaminated air stream is attracted to the biofilter
2. The media filters the PM and ICs, and adsorpts and absorpts the VOCs.
3. Less contaminated, the air stream is forced away the biofilter
This technology can be scaled to process different amounts of air volume. It can be found applied in different scenarios such as large green walls that purify big buildings or small one-plant portable devices that can be used for a standard room.
1.2. Active botanical biofiltration
Figure 2. 18m tall - green wall installed at the University of
Guelph-Humber, Canada. (Nedlaw Living Walls, 2004)
IC
IC
IC
PM
PM
PM
VOC
VOC
VOC
14 15

Phytoremediation:
1. The microbial community living in the rhizosphere, uses the VOCs as a nutrients source
2. After using these compounds, they are converted into less harmful substances such as water or biomass
nutr.
VOC
biom.
H20
1.2.2. Advantages & disadvantages with respect to other systems
Why would it make sense to decide for an active botanical biofilter instead of a mechanical filter, or just rely on the ventilation of the building?
In the first place, the energy consumption of the building where it is used can be significantly improved. Due to the generation of ‘fresh air’ indoors, there is less need of bringing the clean air from outdoors, and therefore, less energy needed to heat/cool it. A research conducted by Zhiqiang Wang and Jensen S. Zhang (2010) estimates that a building -for the Syracuse climate- can save between 10% and 15% of its annual energy consumption costs, by replacing the 20% of the outdoors air with the biofiltered air.
Regarding the pollutant removal capability, active botanical biofilters target a big range of pollutants, being proved effective in removing VOCs (Zhiqiang Wang et al, 2010), PM and ICs (Thomas Petit et al, 2020). On the contrary, other available mechanical filters are usually targeted to remove just specific contaminants (PM, specific gasses, etc..) and not all of them at the same time (EPA 2018).
The removal efficiency of mechanical filters has been proved to be very high, being able to reach 99,99% for particulate matter. It is difficult to state the general removal efficiency of active botanical filters, as it is not the same for every kind of pollutant, and every research uses different configurations of active botanical biofilters. To be used as a reference, Idihar Z. I. et al (2018) achieved a PM removal efficiency of 85% to 71,9% for different particle sizes, and Zang et al (2011) obtained VOCs removal efficiencies of 90% for formaldehyde and 33% for toluene with their system. Thus, mechanical filters are probably more efficient for the pollutants they are targeted for, but active botanical biofilters cover a bigger
range of pollutants.
Active botanical biofiltration can increase the relative humidity and balance the temperature of the treated air (Fernández-Cañero et al, 2012). These factors can contribute to keeping the environment in what is considered thermal comfort: 20-26 °C and 30% - 65% of relative humidity (ASHRAE, 2013).
It is also important to highlight that thanks to the phytoremediation process, the contaminants that are trapped in the media will be naturally removed from there. Thus, these systems don’t need to be replaced by their filter saturation (Gabriela Soreanu et al, 2013), as it happens with the standard mechanic filters that normally need to be replaced each 60-90 days (EPA, 2018).
Finally, several researches suggest that the presence of plants in buildings have a positive effect on the building’s occupants. Lohr et al (1996) points that plants may improve workers productivity and reduce their stress levels. It was also indicated by Candice A. Shoemaker et al (1992) that employees will perceive a working space with plants as a more desirable place to work.
+ Improvement of the energy efficiency of a building
+ Removal of a big range of pollutants
+ Increase of relative humidity
+ Balance of the temperature
+ Easy maintenance
+ Possitive effect in mental health (plants)
- Lower removal efficiency
16 17

1.2.3. Portable active botanical biofilters: a view into the market
This technology still has a big space for improvement, as there is currently a big lack of knowledge about the pollutant removal processes. Nevertheless, there are already products in the market that use its main principle: combination of plants with airflow to achieve indoor air purification.
In order to help the reader to have an idea of how the explained technology has already been implemented in the market, an overview of the currently available products is displayed in this section.
Airy
70 € Medium Small88 €
Plant Air Purifier
Air quality
/ Airflow through the soil and roots driven by chimney effect, not powered by any fan.
/ Airflow through the soil and roots, powered by a fan
/ Water tank that lasts 2 weeks/ Visual water indicator
/ Water tank that lasts 1 week/ Window to check the water level
/ No monitoring / No monitoring
/ No electricity needed / Needs to be plugged/ Only the fan consumes electricity
Assited watering Assited watering
Monitoring Monitoring
Energy efficiency Energy efficiency
Air quality
18 19

UrbieAndrea NatedeBreth
MediumLargeLargeLarge 400 €356 €178 €150 €
Assited wateringAssited wateringAssited wateringAssited watering
MonitoringMonitoringMonitoringMonitoring
Energy efficiencyEnergy efficiencyEnergy efficiencyEnergy efficiency
Air qualityAir qualityAir qualityAir quality
/ Airflow through the soil and roots powered by fans / Extra biodegradable filter / Condensation to reduce mold
/ Airflow through the soil and roots powered by a fan / Extra light to improve the photosynthesis
/ Airflow through the soil and roots, powered by a fan
/ Airflow through the soil and roots powered by a fan / Extra photocatalytic filter
/ Water tank that lasts 2 weeks/ Autowatering system/ Water information in the app
/ Water tank that lasts 10 days/ Water indicator/ App watering reminder
/ Water tank that lasts 2-3 days/ Removable tray to change the water
/ Water tank that lasts 2 weeks/ Visual water indicator
/ Air quality (PM, VOC, humidity and temperature) monitoring
/ Water level monitoring via app / Possibility of turning ON and OFF from the app
/ No monitoring / Air quality (PM, VOC, humidity and temperature) monitoring
/ Needs to be plugged/ The fans, the sensors, decoration light and the extra filter need electricity
/ Needs to be plugged/ The fans, the sensors, and the light need electricity
/ Needs to be plugged/ Only the fan needs electricity
/ Needs to be plugged/ The fans and the sensors, need electricity
20 21

Assignment

and technical expertise in the topic can be crucial to achieve good results for such a research project. For this reason, and due to the lack of these conditions in the graduation project setting, it seemed more useful to not waste energies in this question and to focus more in other areas, contributing more from the integrated product design perspective.
2.2.2. Inside the scope
Market wise, from the two existing alternatives -static greenwall, or small and portable- it was decided to implement the technology in a portable small device. By designing the product in such a way that a single occupant of a building can buy it and use it, enables more people to take action, and makes the ‘fight against indoor air contamination’ more democratic.
In addition, the current market shows proof that such a product can work in the market, and on the other side, is small enough to give space for placing a product that differs from the others.
Purification wise, it was decided not to try to improve it, but understand the process to then be able to design a product around it.
Besides, by keeping the purification part basic, the outcome of the project can then be used as a solid base for testing variations, where, as an example, test the effect of different types of plants in a fixed environment.
Active botanical biofiltration still in its infancy
Although there is clear evidence of the potential of the technology, researchers commonly remark that it is a topic with still big knowledge gaps, and that it needs thorough lab studies to bring more relevant data about the uncertainties.
It is well known that the technology can remove VOCs, ICs and PM from the air; that the processes happening in the rhizosphere play an essential role; or that numerous factors such as the type of plant, media content, roots morphology, airflow rate, etc… influence the purification process. However, a better understanding of these factors, the true processes around pollutant removal or the efficacy of the technology in real life settings (not in a controlled chamber), are still issues that need to be thoroughly researched.
Portable active botanical biofilters: a young market
When taking a view into the market, the technology can be found applied in two different kinds of products: systems to create greenwalls that aim to purify the air of buildings as a whole; or small portable devices designed to purify the air of a room.
Although the principle used is the same, there is a big difference in regards to the target customer of each product. While the greenwalls are targeted to the reduced group of people who are in charge of designing or equipping a building,
As stated before, ‘active botanical biofiltration’ is a complex topic with room for research in several directions. However, how can an Integrated Product Design graduation project contribute to this topic, while being a rich product-design learning process for the student?
In this section it is explained what the main scope is, which areas are not included there and the reasons behind the decisions.
2.2.1. Out of the scope
Although it could be the most relevant topic to research, it was decided to leave out the question:
Including research possibilities such as which kind of plant would bring better results, what substrate composition, characteristics of the airflow or just the design of innovative configurations which may improve the performance.
This research direction should be accompanied with continuous lab research, where different alternatives can be tested in detail and compared to each other. It is likely that having a long period of time, precise testing equipment
the second ones are targeted to anybody who is occupying a building, broadening considerably the target group’s size.
These portable devices started to appear in the market in 2009 (Andrea). Currently only 6 products can be purchased, being 2 of them (Natede and Urbie) still in an early crowdfunding stage.
2.1. Current state of active botanical biofiltration 2.2. Scope
0. How to improve the purification capacity
of an active botanical biofiltration system?
1. What are the requirements to design a
basic active botanical biofilter?
24 25

Reducing the attention from the technical part, there is more space to research about the potential user of the product, and how such a technology can be adapted to its needs and
One of the beauties of botanical biofiltration is that nature, by its natural processes, is able to clean our environments. This idyllic idea is a bit tarnished by the fact that active botanical biofiltration needs an active airflow that usually consumes electricity. Therefore, in order to explore alternatives to the cable connection solution, another scope of this project goes around the option of powering the system with solar energy.
Besides sustainability, the solar solution opens a window for market differentiation, as no product in the market uses solar power
2. Which group of people is interested in
such an active botanical biofilter?
3. What kind of product (aesthetics,
features, size, price, etc...) will meet their
values and needs?
4. How suitable is solar power for such a
product?
Once the scope is clear, the problem definition for this project can be formulated as follows:
2.3. Problem definition
“ Design a portable air purifier, that combines active botanical biofiltration technology with solar power, while being appealing for the target group, meeting their needs and values.”
26 27

How can the problem definition be transformed into a final design?
In order to get to the final objective, the design process is structured in smaller stages. Each stage aims to different mid-term goals and proposes specific tools to achieve these goals.
The project’s methodology is based in the Double Diamond Method (see figure 3), where, by combining divergent thinking and convergent thinking in four phases, it helps the designer first “to design the right thing” and afterwards “to design things right”.
During the Discover phase, the purpose is to accumulate knowledge about the relevant topics for the assignment: active botanical biofiltration, solar power, market and user.
To achieve this, it is carried out a literature research on the studies around botanical biofiltration and indoor solar energy; the market’s state is analyzed to get an understanding of other similar products; and a questionnaire is sent to 111 people to get a first approximation about the user’s opinion and interest on similar products.
In this chapter, it is described how these four phases are implemented in the project and what it is intended with each of them.
2.4. Methodology
1. Discover:
Figure 3. Revamped Double Diamond scheme. UX
Collective, 2016
Assignment
Unestructured research findings
Market analysis
User Questionnaires
Literature Research
28 29

In the second stage, the intention is to converge the previous findings into requirements for the final design. This is, adapt the technical findings from the literature to the results of the user and market research.
To be able to make this definition process, some meetings with experts were arranged to contrast findings and get recommendations towards the decision making; nine extensive interviews were conducted with potential customers, to understand their needs and values,
explore the current market, and dig into their interest in such a product; and as a final step, the requirements for the product were stated together with the elaboration of personas representing the potential customers.
Design requirements are usually open enough to be approached in very different ways. The goal of the Develop phase is to explore these ways and generate different variations of how the design could meet the requirements.
To reach a valuable set of ideas, an iterative ideation - user test process was carried out. In this process, ideas were generated, contrasted with the user and transformed into new iterations, to be contrasted again.
2. Define: 3. Develop:
Different ways of meeting the requirements
List of requirements, Personas
List of requirements, Personas
User interviews
Usertesting
Ideation
Experts meetings
Unestructured research findings
30 31

The final phase’s objective is to polish the decided variation and bring it to its final shape.
For this purpose, a thorough process of building prototypes, testing and learning was carried out. With all the details finalized, the design was prepared to be presented (technical drawings, visualizations, etc…)
4. Deliver:
Final design
Iterate
Finalise
Test
Prototype
Different ways of meeting the requirements
32 33

Research

Along this chapter, it is elaborated on those details about active botanical biofiltration that can be relevant at the time of designing an active botanical biofilter.
The information that is presented here comes from a literature research on scientific papers about “botanical biofiltration”, “phytoremediation”, “indoor air”, “VOC removal” and “green wall biofilter” combined with information-matching with an expert in the topic “botanical biofiltration for the indoor environment”
3.1.1. Basic components
As explained in the introduction, the active botanical biofiltration is a combination of two
processes, biofiltration and phytoremediation. However, what components are necessary for these processes to happen?
For the biofiltration process, an airflow and a filtering media are indispensable elements. The need of a filtering media implies also the need of a container that encloses it. Besides, to let the air get in and out, the container must have openings. With respect to the way the airflow is generated, it can be done passively with the mentioned openings creating a chimney effect, or actively with the integration of a fan in the system. In case of using a fan, an energy source would be needed.
The phytoremediation process occurs in the microbial community living in the rhizosphere. Therefore, the only indispensable component for this process is the plant and its roots.
3.1. A deeper view into active botanical biofiltration
Biofiltration
Phytoremediation
Airflow
Rhizosphere microorganisms
Air circulation
Plant
Filteringmedia
Container
Openings
Fan Power source
Figure 4. Dependance between processes and components Figure 5. Basic components of an active botanical biofilter
Plant
Filtering media
Container
Fan
36 37

- Decrease of
the retention
of hydrophobic
contaminants
Another relevant factor about the filtering media is its water content. The research reveals that the contaminants are removed with different efficiencies for different water content values. Besides, the ideal value is not the same for every contaminant.
Wang and Zhang tested in their research different water contents, resulting that formaldehyde was removed more efficiently with higher content of water, while less amount of water was more effective for toluene. It was suggested that this difference might be due to the different water solubility of the two compounds.
Airflow
Another crucial factor for the biofiltration process is the way the air flows through the media. On one hand, when the contact time between the contaminants (air) and the media is higher, the media will have better retaining capacity (Darlington et al., 2001). A higher contact time could be achieved by decreasing the air speed. However, when the speed is higher, a greater amount of media is involved in the biofiltration process (Irga et al., 2017), and the air of the room will be processed quicker.
Therefore, there should be a middle point in the air speed where the filtration efficiency peaks. Irga et al. (2017) experimented with 5 different rates for their system: 0, 3.75, 7.5, 11.25 and 15 L/s; resulting that the most efficient rate was 11.25L/s, and suggesting that at higher rates the air was forced out of the filtering matrix before there was enough time for a complete filtration of the contaminant.
3.1.2. Factors that influence the performance
The group of factors and variables that influence the air purification performance is another area that is convenient to have clear when designing for active botanical biofilters. What does the correct functioning of the system depends on? How can design decisions affect positively or negatively to performance?
As a starting point, it should be clarified what good performance means. The system will have a better performance as better the performance is of its two main processes: biofiltration and phytoremediation. In other words, the system’s performance will be higher when the capability of retaining pollutants and the capability of regenerating the filter are higher.
In the following section, it is exposed the way the main components of the system can have an influence on the system’s performance.
Media
Regarding the biofiltration process, it will filter better when the media has high capacity of absorbing and adsorbing contaminants. The research shows that different compositions have different filtering results, although it is not yet evident which is the best media composition.
For instance, Aydogan and Montoya (2011) found that activated carbon was more effective than expanded clay and growstone in removing formaldehyde. Part of the same research concluded that substrates providing microbe sites could lead to a better VOC removal.
Component
FAN INCREASE AIR RATE
MEDIA GOOD SELECTION OF
SUBSTRATE
INCREASE OF WATER
CONTENT
Modified parameter
Positive effect on performance
Negative effect on performance
+ Increase of the air
volume that can be
processed
+ Increase of the
biofilter volume that
contributes to the
biofiltration
+ Increase of the
filtration, absorption
and adsorption of
contaminants
+ Provision of
microbial sites
+ Increase of the
relative humidity of the
environment
+ Increase of the
retention of hydrophilic
contaminants
- Decrease of the
exposure time
between the media
and the air
Figure 6. How a parameter modification can affect the
system’s performance
38 39
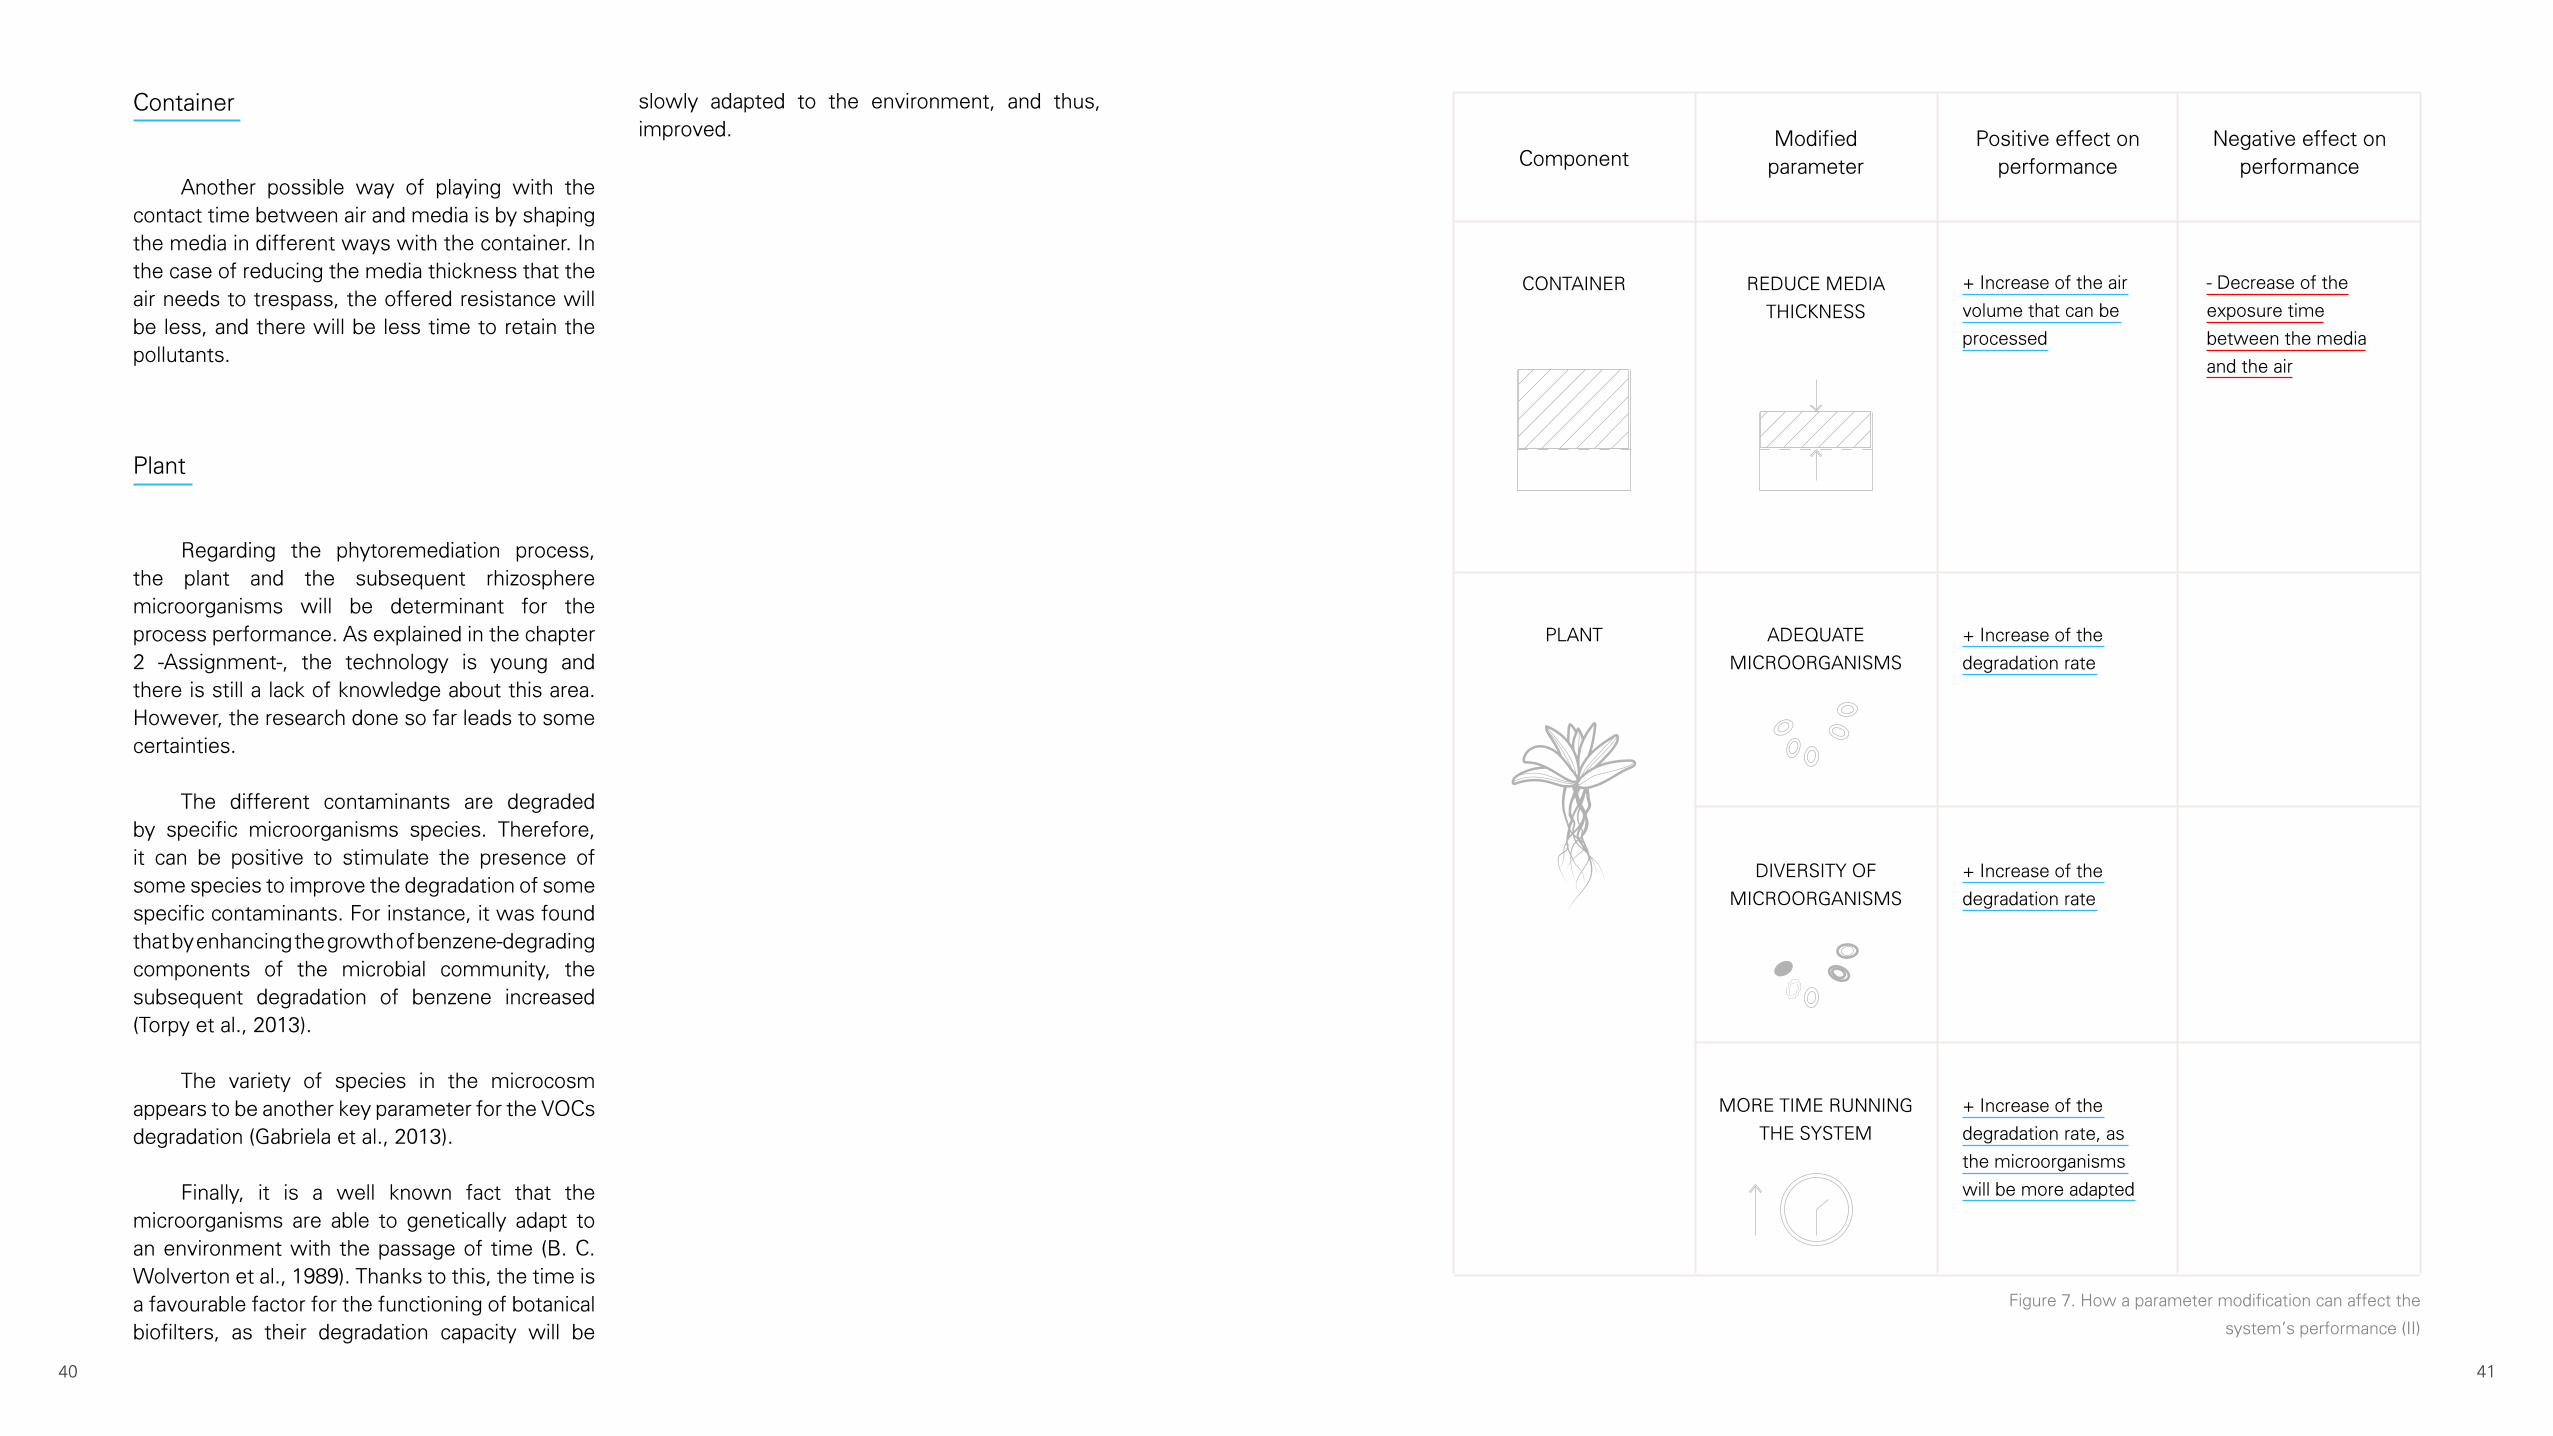
Container
Another possible way of playing with the contact time between air and media is by shaping the media in different ways with the container. In the case of reducing the media thickness that the air needs to trespass, the offered resistance will be less, and there will be less time to retain the pollutants.
Plant
Regarding the phytoremediation process, the plant and the subsequent rhizosphere microorganisms will be determinant for the process performance. As explained in the chapter 2 -Assignment-, the technology is young and there is still a lack of knowledge about this area. However, the research done so far leads to some certainties.
The different contaminants are degraded by specific microorganisms species. Therefore, it can be positive to stimulate the presence of some species to improve the degradation of some specific contaminants. For instance, it was found that by enhancing the growth of benzene-degrading components of the microbial community, the subsequent degradation of benzene increased (Torpy et al., 2013).
The variety of species in the microcosm appears to be another key parameter for the VOCs degradation (Gabriela et al., 2013).
Finally, it is a well known fact that the microorganisms are able to genetically adapt to an environment with the passage of time (B. C. Wolverton et al., 1989). Thanks to this, the time is a favourable factor for the functioning of botanical biofilters, as their degradation capacity will be
slowly adapted to the environment, and thus, improved.
Component
CONTAINER REDUCE MEDIA
THICKNESS
PLANT ADEQUATE
MICROORGANISMS
DIVERSITY OF
MICROORGANISMS
MORE TIME RUNNING
THE SYSTEM
Modified parameter
Positive effect on performance
Negative effect on performance
+ Increase of the air
volume that can be
processed
+ Increase of the
degradation rate
+ Increase of the
degradation rate
+ Increase of the
degradation rate, as
the microorganisms
will be more adapted
- Decrease of the
exposure time
between the media
and the air
Figure 7. How a parameter modification can affect the
system’s performance (II)
40 41
Note: The term “Nature-based air purifiers” is the common way to refer to “active botanical biofilters” in the market.
The strong ‘decorative component’ of nature-based air purifiers, together with the youth of the market, increases the importance of having an accurate picture of the user’s opinion about these products. Which particular group of people is interested in purchasing a nature-based air purifier? Which are the reasons, values or needs that are tried to fulfill with such a purchase? What features should the product include?
In order to answer these questions, information from the user was obtained through a questionnaire answered by 111 people and interviews carried out to 9 people. The collected results are summarized in the rest of the chapter.
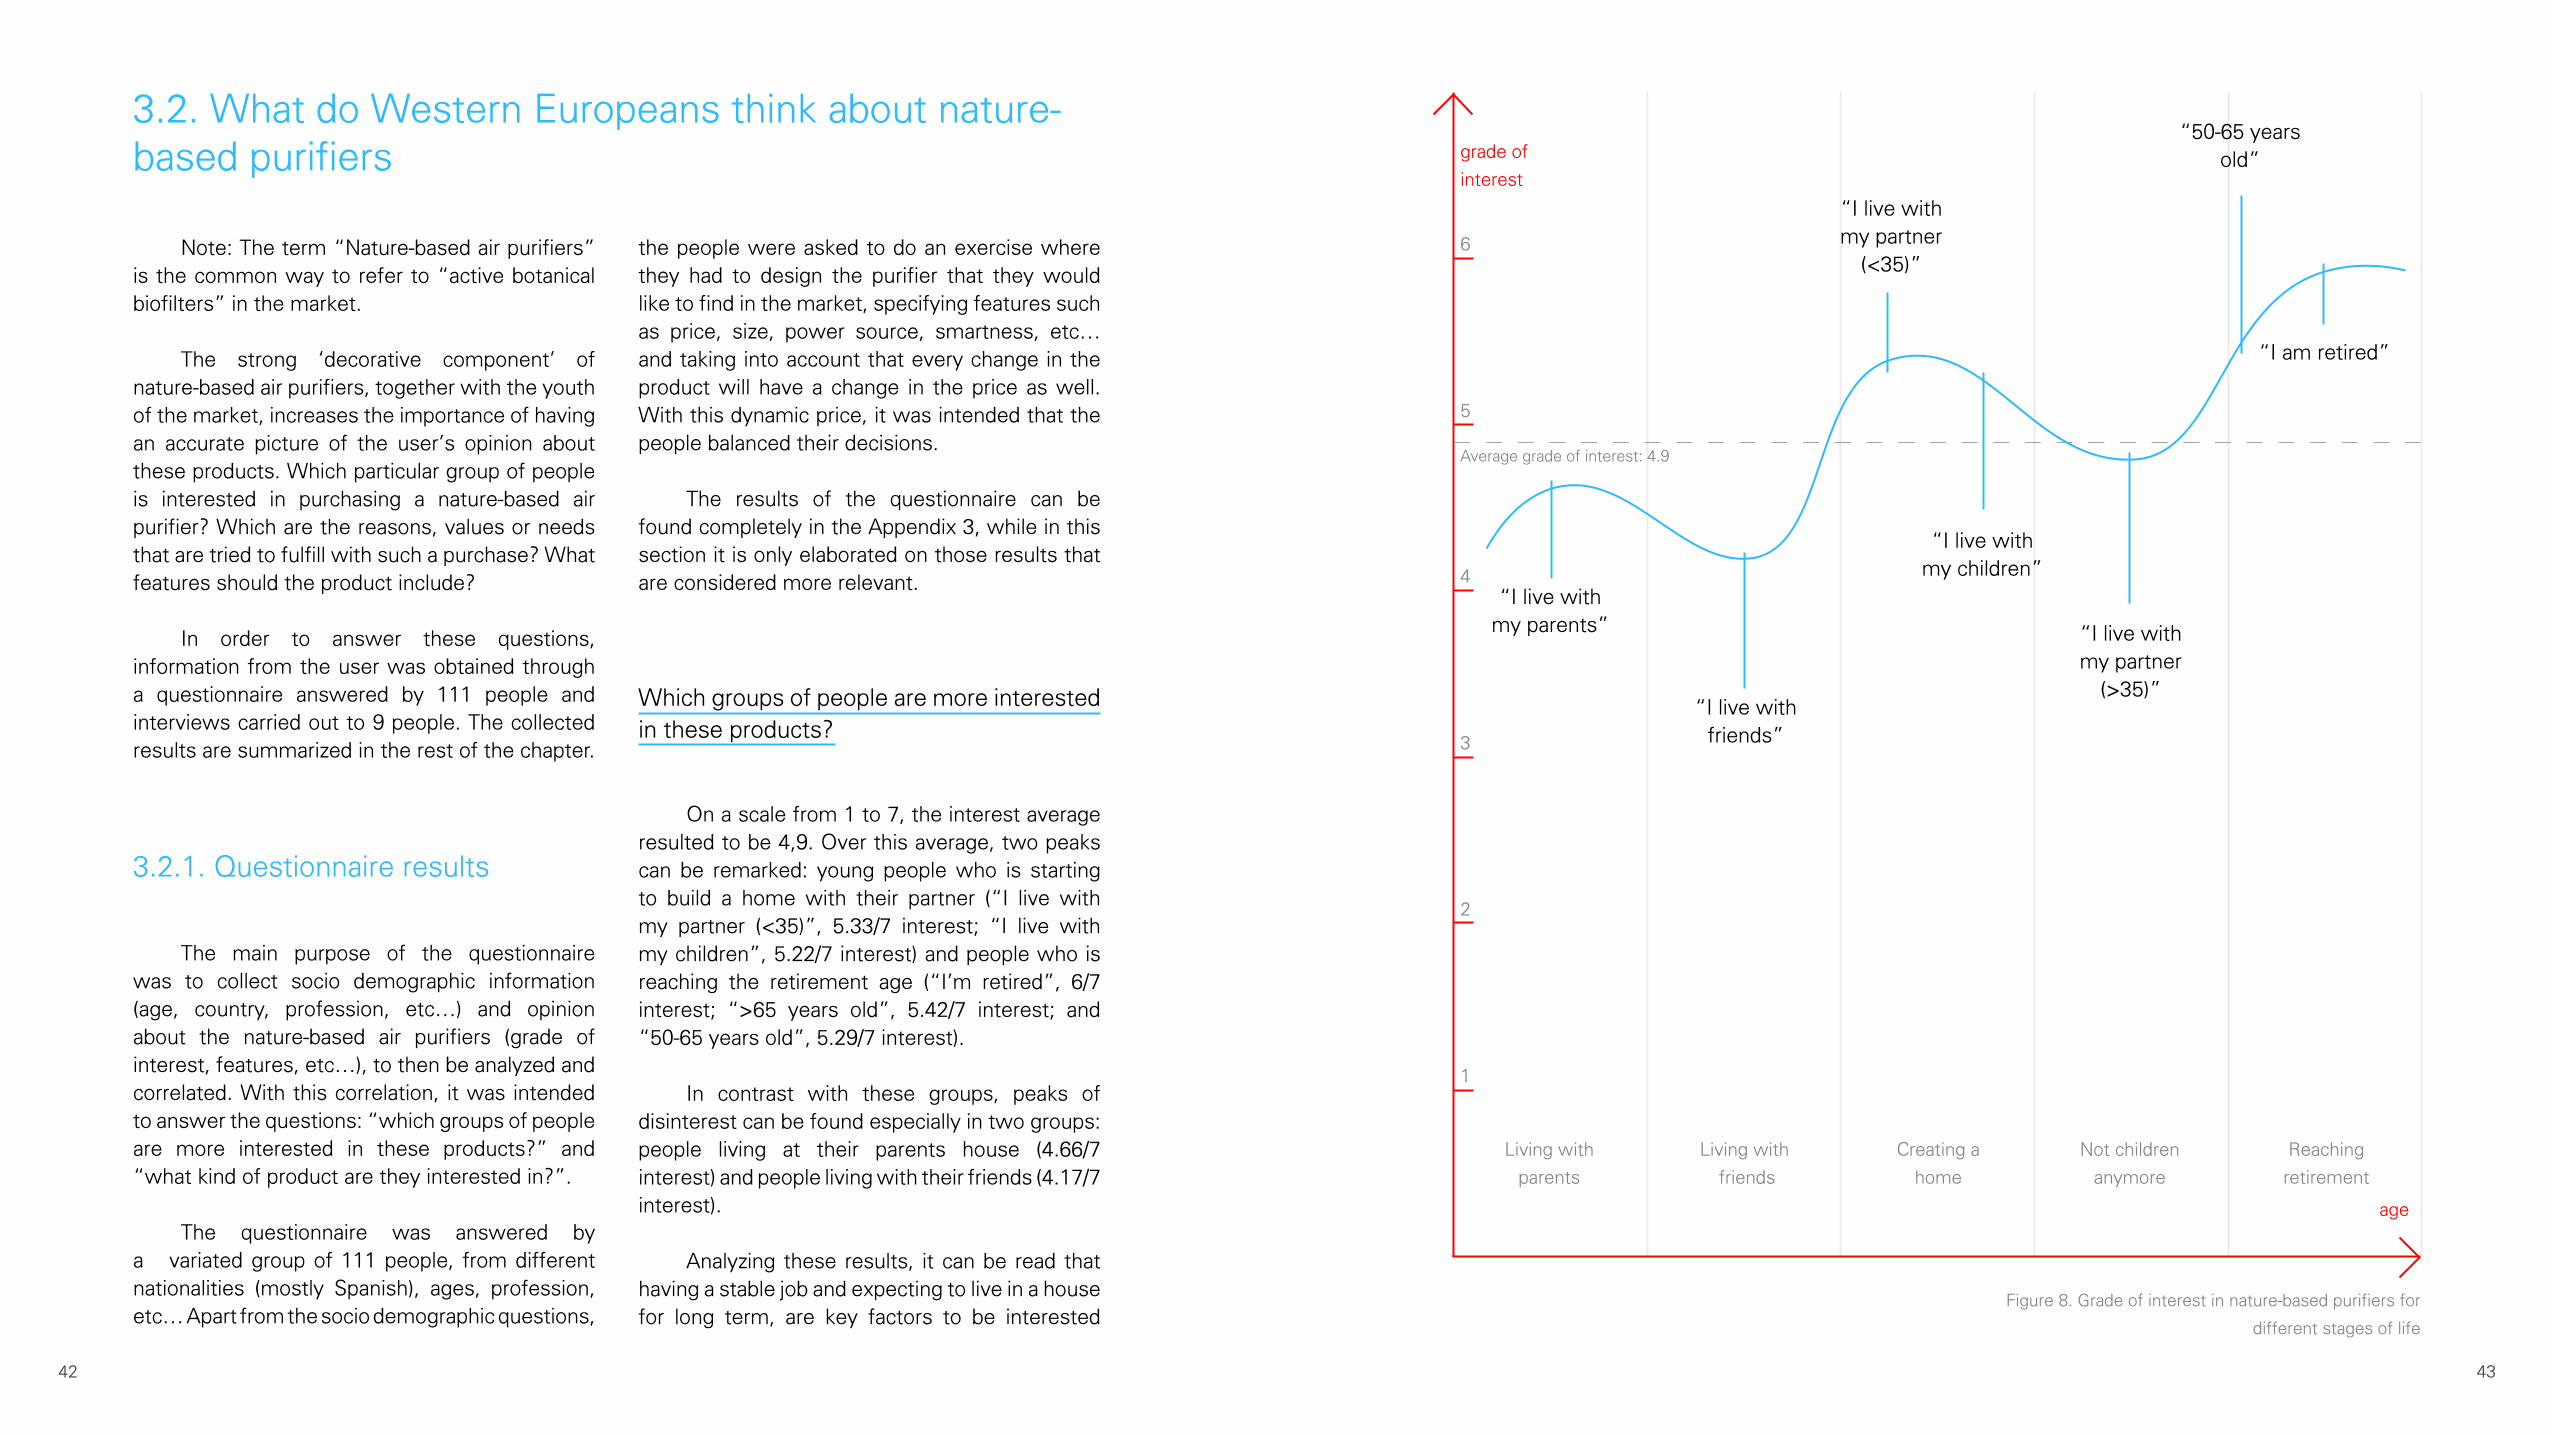
3.2.1. Questionnaire results
The main purpose of the questionnaire was to collect socio demographic information (age, country, profession, etc…) and opinion about the nature-based air purifiers (grade of interest, features, etc…), to then be analyzed and correlated. With this correlation, it was intended to answer the questions: “which groups of people are more interested in these products?” and “what kind of product are they interested in?”.
The questionnaire was answered by a variated group of 111 people, from different nationalities (mostly Spanish), ages, profession, etc… Apart from the socio demographic questions,
the people were asked to do an exercise where they had to design the purifier that they would like to find in the market, specifying features such as price, size, power source, smartness, etc… and taking into account that every change in the product will have a change in the price as well. With this dynamic price, it was intended that the people balanced their decisions.
The results of the questionnaire can be found completely in the Appendix 3, while in this section it is only elaborated on those results that are considered more relevant.
Which groups of people are more interested in these products?
On a scale from 1 to 7, the interest average resulted to be 4,9. Over this average, two peaks can be remarked: young people who is starting to build a home with their partner (“I live with my partner (<35)”, 5.33/7 interest; “I live with my children”, 5.22/7 interest) and people who is reaching the retirement age (“I’m retired”, 6/7 interest; “>65 years old”, 5.42/7 interest; and “50-65 years old”, 5.29/7 interest).
In contrast with these groups, peaks of disinterest can be found especially in two groups: people living at their parents house (4.66/7 interest) and people living with their friends (4.17/7 interest).
Analyzing these results, it can be read that having a stable job and expecting to live in a house for long term, are key factors to be interested
3.2. What do Western Europeans think about nature-based purifiers
1
3
5
2
4
6
grade of
interest
age
Living with
parents
Living with
friends
Creating a
home
Not children
anymore
Reaching
retirement
Average grade of interest: 4.9
“I live with my parents”
“I live with friends”
“I live with my partner
(<35)”
“I live with my children”
“I live with my partner
(>35)”
“50-65 years old”
“I am retired”
Figure 8. Grade of interest in nature-based purifiers for
different stages of life
42 43

in purchasing a nature-based air purifier. On the other hand, it seems that the type of housemates is also determinant, as within people with similar age range and professional status, there is a big interest difference between the people “living with friends” and the people “living with their partner and/or kids”.
What kind of product are they interested in?
The main results about which are the desired features can be seen in the figure 9. As commented previously, the respondent had to include/reject possible features, influencing the purifier’s price until the best suitable option was found.
The offered alternatives were based on the different options that can be found in the market’s products nowadays. The respondent could decide about: delivered air quality, watering mechanism, air quality monitoring, powering and size. In the figure 10, the different levels for each of these functionalities, and the respective influence in the price are displayed.
Analyzing the results, it can be concluded that people is willing to invest more for the air quality, declining the most basic option (9%) and deciding for advanced (50%) and medium (41%); the watering tank together with a level indicator was significantly more selected (50% against 29% and 21%); about the powering there is not unanimity, however solar power (32%) and cable (32%) were the most prefered options; regarding to monitoring/smartness of the device, the most basic options were the favourite ones: simple temperature & humidity sensors (32%) or no sensors at all (26%); at last, the medium size -25cm- was the most appreciated (59%).
It is important to remark that these prefered features results are from those respondents that
declared high interest in such a product, grading their interest with 6 or 7 out of 7.
Figure 9. Features that the most interested people decided
to include in their suitable nature-based air purifier
Air quality
Size Average price to pay
Monitoring Powering
Watering system
50% Advanced
58% Medium 142,25 €
32% Displays T & %H 32% Solar power
50% Level indicator
41% Medium
24% Large
26% No sensors 32% Cable
29% Normal plant
9% Basic
18% Small
24% Watering sensor 18% USB
18% Air quality monitored 18% Batteries
21% Water tank
44 45

T, %H T, %H, VOCs, T, %H,
Air quality
0 €
Airflow through the soil and
roots powered by chimney
effect. No fans
Water like a standard potted
plant
No sensors, no app
Connected by a cord
Temperature and humidity
sensors + soil humidity
USB chargeable, to be
charged once per month
Temperature and humidity
sensors
Batteries that I have to
change once per year
Temperature and humidity
sensors + soil humidity +
VOCs
Solar power
Airflow through the soil and
roots powered by a fan
Water tank
Airflow through the soil and
roots powered by a fan +
extra filter
Water tank + water level
indicator
0 €
0 €
0 €
+10 €
+5 €
+40 €
+10 €
+20 €
+10 €
+60 €
+15 €
+120 €
+20 €
Monitoring
Watering system
Powering system
Figure 10. Possible features and its influence to the total price
46 47

3.2.2. Interview results
The interviews were carried out with diverse goals: confirm findings from the questionnaires; dig a bit in the general opinion about air quality; understand the mental processes (concerns, opinions, needs, values, etc…) going on in the customer when taking a look to the current market of nature-based purifiers; get feedback on the first prototypes; and get comments about a selection of different aesthetic styles that the project could take. The full interview script can be found at the appendix 4.
In order to access a rich and varied source of opinions, 9 people from different population groups were interviewed: students, working, living with friends, young couple, close to retirement and a recent mother were the selected groups. Due to the pandemic situation present during the project, most of the interviews were taken via video meeting, taking an average of 90 minutes per interview.
The results of the interview can be divided in two groups: those opinions that were shared by most of the interviewees; and those opinions that made evident the differences between them (reasons driving their interest, desired aesthetics, etc…). To facilitate the visualization of these diverging opinions, they are represented in 5 different personas.
Converging opinions:
When walking through the nature-based air purifiers of the market, and asking the interviewee to simulate a purchase, the mental process followed by most of the interviewees was the following:
while walking through the streets (skin irritation, smell, visually, etc...).
Those interviewees without a stable job and house pointed to “having a stable life, with a house that I know I will live there for a long time, and some years working… At that point I would be interested in buying these household products”. For the people which already had a stable house
1 - It’s an unknown product, maybe it just doesn’t work2 - Fear of being ripped off3 - Monitoring could be a way to know how effective it is. If it doesn’t work, it can be given back4 - Monitoring feature makes is too expensive
This common reaction reveals an issue about the lack of trust that the product generates. Being a new and unknown technology, that ensures a benefit which is difficult to prove, brings to the people the feeling of being ripped off. On the other hand, the air quality monitoring feature was generally found as a good way of ensuring that the device works, however too expensive.
When discussed about the air quality perception, it resulted that the big majority of the interviewees perceived the air quality at home as good air quality, and that indoor air quality was not a concern.
On the other hand, outdoors air quality was found as a concern in those interviewees living in big cities (Madrid, Rotterdam), as it could be felt
and job, they affirmed that they were in the right time to be interested in such a product.
About the aesthetics, there were different opinions and preferences, but most of the interviewees agreed on some basic recommendations for the appearance of the product:
1 - Simplicity, minimalistic, subtle, normal2 - Neutral and timeless, to fit in the house and not get tired of it3 - To look like a normal pot. The plant should be the protagonist.4 - Get away from weird, artificial or unnatural configurations.
When asked for feedback about the different materials and shapes, the most accepted option was a combination of white ceramic and wood, remarking the terms “clean” “warm” “contrast” and “natural”. On the contrary, the most disliked options were wicker and cork, perceived as not appropriate for the product; and plastic, mentioned to be precarious and cheap.
Diverging opinions: personas
In the following pages, the diverging opinions can be found clustered in different personas.
Figure 11. White ceramic: the most accepted aesthetic style
At home, I have the feeling of
having good air quality
A good moment to buy this
product would be when I have a
stable job and house. Just the same
moment I will think of getting an air
conditioning
Something simple, like a normal
pot with a subtle twist. Cool but
neutral
Does it actually work?
48 49

#1 Amaia, 32Clinic owner
Why am I interested?
Having my clinic in the
-contaminated- center
of Madrid, I’m afraid of
opening the windows
I want to ensure that
my clients enjoy the
best air comfort
/ Single
/ 14 years living in Madrid
/ Born in Valladolid
/ 2 Masters in
Physiotherapy and
Podology
/ Physiotherapist and
manager of her own
clinic
50 51

Favourite: Natede
Features
SimpleBeautifulWhiteWarm
350 €
High quality, as I see
this purchase as an
investment for my
business
Useful. I can control it
how I want
Remote control
“I would like to turn ON the device two hours before going, so when I arrive to clinic, it is ready to receive clients”
“Checking the app, I will know if the room is ready. Maybe I have to go 30 minutes earlier to actvate some heaters”
No windows
“Will the plants survive in the room with no windows? I would be interested in a lamp for this situation”
Water tank
“Water tank would be very useful. I could go one month on vacation and ask somebody to go once to water the plants, that is easy”
Electricity bill
“It would be very important to know how much I will spend by having the device connected”
“When I bought the Crock-pot, I did it because they ensure me the electricity consumption was very low”
52 53

#2 Sophie, 43Recent mother
Why am I interested?
Increasing the humidity
of the room will solve
the nasal congestion
of the kid, and he will
sleep better
All my friends
used humidifiers
for their kids. They
recommended it to me
/ 5 years married
/ Lives in Lyon
/ Born in Lyon
/ Studied Marketing in
Paris
/ 15 years working for a
big consultancy
54 55

Favourite: Natede
Features
CareBeautifulCleanQuality
350 €
When it’s about the
kid’s health, we don’t
care about investing
more money
We want to trust the
device. Information
about its performance is
therefore something we
would value
Humidifier
“A lot of parents are interested on humidifiers. I would say that all of us, we had a humidifier for the baby stage”
“The kids feel the difference. They ask me to activate it during the nights”
“Generally, spending money in the kids ‘doesn’t hurt’, imagine if it also makes them sleep better! Every parent would invest on that”
Air quality
“Kid’s respiratory problems is a usual concern among other parents. This device is definitely interesting for them”
Trust
“If I find this kind of product in a garden store, I may think that they want to trick me by selling it”
“I would trust more in the device if I find it in a pharmacy or an electronics store”
56 57

#3 Paz, 51Contamination concerned
Why am I interested?
The contamination is
a big problem in the
cities. In the village is
different, you can still
breathe fresh air
I can feel it everywhere
in the city, and I don’t
want it to enter to my
house
/ Divorced
/ Born in Segovia
/ Living in Madrid for the
last 30 years
/ Studied Philosophy in
Salamanca
/ After working as a
hairdresser, she opened
a hand crafted jewlery
shop
58 59

Favourite: Plant Air Purifier
Features
EcologicNaturalAestheticWarm
90 €
I was already looking for
air purifiers, but if I can
clean the air with plants
much better!
The monitoring
features are definitely
interesting, but increase
the price too much
Solar power
“If the device can be solar powered, that would make me to be inclined for such a product”
Aesthetic
“Aesthetics are very important. I don’t want something weird and ugly”
No sensors and app
“As how I understand plants, I don’t need any extra help to be able to take care of the plants”
Water tank
“It can be very useful for the times I go to my town. It will mean one plant less to worry about”
60 61

#4 Pietro, 58Pragmatic
Why am I interested?
I am very attracted by
the idea of changing
my ‘passive’ pots for
‘active’ pots that purify
the air
Contamination is real, I
can feel it in the city
/ Lives with his partner
/ Born and living in Rome
/ Studied Architecture in
Rome
/ 35 working as an
architect in Rome
62 63

Favourite: Airy
Features
PlantSubtleFunctionalNot artificial
55 €
What I would like to
have, is something that
looks like a normal pot,
but it also purifies the
air
I think it’s an interesting
product, but I don’t see
myself spending more
than 60 euros on it
No extra features
“Currently I’m taking care of the plants of the house without the help of sensors, apps and water tanks. I don’t need them”
Functional materials
“I know that terracotta will make the plant breathe through the pot, which is healthy for it”
“For the base I would like to have some impermeable material to not ruin the floor. ”
Plants variety
“I like the fact that I can use the plant I want”
“If I want to have these ‘pots’ at different places of the house, I wouldn’t like the idea of having the same plant everywhere”
Solar power
“The best would be not to use electricity”
“If there is a need of using electricity, then it should be solar powered”
64 65

#5 Anja, 29New home!
Why am I interested?
Knowing that we will
be in this house for long
term, we want to invest
in creating a healthy
atmosphere
Now I’m not a poor
student anymore, so
I can spend money
on nice-but-not-need
products!
/ Lives with her partner
/ Born in Zagreb
/ Just moved to Berlin 3
months agho
/ Studied Biochemistry in
Zagreb
/ Recently got a job in a
promising start-up in the
sector
66 67

Favourite: Urbie
Features
250 €
I would like to know
if it’s doing anything.
Without monitoring I
will always have the
feeling of being ripped
off
I want something that
stands out but not too
much. Cool but neutral
Water sensor, water tank
“Having a water sensor in the substrate that tells you when to water is a cool idea, I want it”
“Not having to be constantly watering will make our lifes easier at home”
Monitoring
“I want to be sure that the device is working. We don’t want to invest in useless products that may work”
Aesthetic
“It is very important that it looks nice in our apartment”
“The aesthetics should be minimalistic and neutral, I don’t want to be tired of it in 2 years”
NeutralPremium
EquilibratedMinimalistic
68 69

Along this chapter, it is elaborated about those details that are important to know when designing a product that is powered by solar energy, and specifically at indoor settings, where the light is less accessible.
It is important to remark that the energy that a solar panel can generate depends basically on two factors: the panel characteristics and the light that is receiving.
3.3.1. Indoor light conditions
With respect to the light that is receiving, the first difference that can be found at indoors settings is that the artificial light has a different spectrum than the sunlight (see figure 12). This difference will affect to the way panels can generate energy.
The second main difference is the intensity of the light. Depending on the place that the panel
is located, the weather and the time of the day, this intensity will vary drastically. Generally, a solar panel will generate much more energy in a sunny day than in a cloudy day, as well as generate more outdoors than indoors.
In order to quantify how illuminated a place is, the S.I. uses Lux as the unit, representing the amount of light that hits a surface. Outdoors, in a sunny day the illumination value will be around 10.000 - 1.000.000 lx, while it will be around 100 - 10.000 lx if the sky is cloudy (Unifore, 2020). Indoors, in a place that is artificially illuminated, the value lies between 50 - 1.000 lx (Unifore, 2020).
However, indoor places also receive natural illumination that gets into the building through the windows. When approximating to a window, the illumination that the solar panel can harvest increases significantly, finding intensity values around 1.000 - 30.000 lx. From figure 13 to 16, it can be read the illumination value of the settings shown in the pictures.
3.3. Powering an indoor device with solar energy
Figure 14. Artificially and naturally illuminated workplace:
1.010 lx
Figure 16. On a table next to a window, direct sunlight:
18.270 lx
Figure 13. Artificially illuminated workplace: 638 lx
Figure 12. Different light spectrums for different light
sources. Source: Power Film Solar (2018)
Figure 15. On a table next to a window, indirect sunlight:
1.690 lx
100
60
80
DaylightIncandescentFluorescentLED
Inte
nsity
(arb
)
Wavelength (nm)
40
20
400 500 600 700
70 71

3.3.2. Outdoor solar cells and indoor solar cells
Given these special indoors light conditions, would be possible to use standard solar cells, specifically designed for outdoors? Does it exist another solution that suits better?
Outdoor solar cells
In the case of using standard solar cells, it needs to be taken into account that these cells are optimized to get the maximum energy from the sunlight. Therefore, when they are inmersed in other light spectrums such as LEDs, it is expected that its performance decreases significantly.
In the first graph (figure 17), the Quantum Efficiency (QE) of some popular solar technologies is plotted. The QE is used to know how well a solar panel adapts to different colours of the spectrum. As it can be seen, each of the technologies varies its efficiency at different wavelenghts.
Indoor solar cells
Alternatively, it exists a different type of solar cells specifically designed for indoor settings. These type of solar panels, known as indoor photovoltaics, are optimized to generate energy from the artificial light spectrums.
It is a recent technology that is growing and that still is not easily available. However, there is a big interest and effort to develop it, as it has a great potential for powering low consuming devices in the Internet of Things ecosystem (Mainville
and Leclerc, 2020). Among the most notable indoor photovoltaics are Dye Sensitized Solar Cells (DSSCs), Perovskite Solar Cells (PSCs) and Organic Solar Cells (OSCs). In the second graph (figure 18), the efficiencies these technologies have achieved in the last years are plotted.
Size-power estimation
In order to get an idea of the relation between the size of the panel and the power that can be generated, and estimation was carried out, where different solar panel sizes and types are linked to their capacity of powering a small fan (figure 19 and 20).
For the indoors option, it was decided to chose one of the indoor solar panels currently available in the market: the solar panel LL200-4.8-37 (Power Film Solar). The available data from the product specifications states that, under 1.000 lx of artificial light, a surface of 94 x 38.1 (mm) can generate 0.871 mW.
For the outdoors estimation, the 0.5W Solar Panel from Seeed Studio was the chosen one, as it is one of the cheapest and easily available options. With a surface of 70 x 55 (mm) and an efficiency of 17%, it can generate 0,5W in optimal conditions (direct sunlight outdoors), and it is estimated that can generate around 10 mW under 1.600 lx (close to a window receiving indirect sunlight).
For the element to be powered -the fan-, it was decided to chose the small and low consuming NF-A4x10, which has a power consumption of 250 mW. All these numbers were taken as the reference for the calculations.
c-SI
DSSCs
PSCs
OSCs
GaAs
CIGS
a-SI
Qua
ntum
Eff
icie
ncy
(%)
Eff
icie
ncy
(%)
Wavelength (nm)
Year
500
2012 20162014 2018 2020
800700 10004000
0
5
25
15
35
10
30
20
40
20
50
90
10
40
80
30
70
60
100
600 900
Figure 17. Quantum Efficiency of different some popular solar
power technologies. Source: Power Film Solar (2018)
Figure 18. Efficiencies achieved by some indoor
photovoltaics. Source: Yan et al. (2020)
72 73

Figure 20. Estimation for the required size of outdoor solar
panels to power a 0,25W fan
Figure 19. Estimation for the required size of indoor solar
panels to power a 0,25W fan
Indoor solar panels 1.000 lx 1.600 lxArtificial light Close to a window, indirect sunlight
Able to power 50% of the required
energy
Able to power 50% of the required
energy
Able to power 100% of the required
energy
Able to power 100% of the required
energy
Oudoor solar panels
70 cm
70 c
m
32 c
m32
cm
32 cm
16 cm
100 cm
100
cm
74 75

Synthesis

This chapter corresponds to the second stage of the designing process: Define. Along it, all the decisions based on the research are exposed and argued, concluding with the final design requirements that the product should meet.
4.1.1. Indoor solar power
Solar powered device
On the basis of the estimations and the light characteristics that can be found indoors, solar power doesn’t seem to be the best solution for having a reliable constant airflow system. This can suppose a problem, as research about active botanical biofiltration suggests that lower airflow leads to lower purification.
However, there are some other matters that support the use of solar power:
- Using solar power will eliminate the electrical consumption of the product
- Exploring the solar power applied to active botanical biofiltration, answering the research questions “How much air purification can be achieved with a solar panel system” and “In case of bringing less purified air than a connected-by-cable-system, how big is the difference?” It would be important to quantify this difference to then be able to decide if it worths the other advantages or not.
- Solar power has a good acceptation within the questionnaire contestants, being the option “pay 20€ extra for having the device solar powered” the most selected one together with
“powered by cable” (32% and 32%).
- A solar powered device would be a good way of differentiating from other products in the market, as no one is currently using this way of powering.
- Solar power technology is experiencing a continuous development, and thus the development of more efficient systems can be expected during the coming years.
Due to all these reasons, it is concluded that solar powering the device is a direction that worths taking, even being possible that ends in just an exploration to collect data.
Scenario: next to a window, using outdoor cells
From the analysis made about the different indoor spaces characteristics and their potential to host a system that harvests light, it seems that, in a just artificially illuminated place, the required solar cells surface would be disproportionately big.
On the other hand, the required surface under undirect sunlight next to a window seems to be appropriate. This, together with the fact that most of plants need sunlight to survive, makes the window surroundings the most convenient place where the product can be placed, and thus it is decided to design the product for such a place.
So, the product must be designed to harvest sunlight (therefore use outdoors solar cells) and function properly with a changing environment
where the intensity of light will vary from 0 lx (during night) to 1.000 - 30.000 lx, depending on the orientation, weather and moment of the day.
Upgradable system
Due to the mentioned expectation of finding more efficient systems in the following years, it seems like a good idea to keep the design modular and allow eventual upgrades when better performances are assured.
4.1.2. Target group
The decided target group is “Western European, living in big cities, older than 30 years old”. The following points explain each of the elements of the sentence.
Western Europeans
In the first place, the decision about chosing Western Europeans as the target group is not because they have shown more interest in the research, but becuase they were the great majority of the user research participants. Therefore, the obtained results make sense for this specific population, and it is possible that doesn’t apply to other different populations.
Living in big cities
Based on the interviews results, people living in big -and more contaminated- cities such as Madrid or Rotterdam is aware about the city’s contamination and perceives it as an important problem. On the other hand, people living in less contaminated places don’t perceive contamination as a problem in their lifes. Therefore, it is decided to target the product to people living in big cities, as it is expected that a greater awarenes about contamination can lead to more interest in a product related to reduce contamination, even being aimed to indoor contamination.
> 30 years old
The user research respondents found that they would be only interested in such a product when their life’s situation meets two essential requirements: having the perception of living in an own house for long term and having a stable job.
Regarding the “long term own house”, it has to be remarked that the purifier is a household product, and these type of products are usually bought by people in charge of a house, and not
4.1. Conclusions from the research
Figure 21. Chosen place to design the product for: Indoors,
next to a window
78 79

Medium size, to be placed on a table
The questionnaire results point, with 58% of the votes, to the medium size option (25 cm height). Besides, answering the question “Where would you place the purifier?”, the most chosen options were “On a table where I don’t work” (46%), “On the floor” (30%) and “On a table where I work” (19%). Based on these results, it is decided to keep the product around the size of 25 cm (height) and suitable to be placed on a table.
100€ -150€
Finally, regarding to the price that the product should have in the market, the average of the price that the respondents would pay is 142.25€. With this number as a reference, the product should be designed to be kept in the range price of 100€ - 150€.
4.1.4. Look & feel
Normal potted plant doing something extra
The concept that the interviewees found most attractive about the project was the idea of having something that looks like a normal potted plant, but that brings the extra value of purifying the air at home. “The thing that I like the most is the fact that I can have a standard potted plant, like any other one, but that by being slightly modified can also increase the air quality of my home” “Instead of wasting my plants with ‘pasive’ pots, I could use these special pots that are ‘actively’ generating something”
by people living at their parents or temporary with friends.
On the other hand, the purifier was considered by the interviewees as a not essential product but nice to have, and they found that only when being in a safe economical position they would be interested in such expenses.
In an attempt to translate these two main prerequisites into a simpler variable, it was decided to target the product to people above 30 years old, expecting that most of them already have a stable house and a stable job.
4.1.3. Functionalities
Medium-level air purifying system
Airflow generated with 1 fan:
From the three options considered in the beginning (airflow generated by chimney effect, airflow generated by one fan and airflow generated by one fan + extra filter), the first one was clearly rejected, chosen by only 9% of the respondents, leaving the other two options with similar interest: fan + filter 50%, and just 1 fan 41%.
Between these two options, it is decided to keep the system as elementary as possible with the selection of the “airflow generated by one fan” option. As commented previously, having still a big lack of knowledge about the purification processes, it seemed the best option to keep this part of the system simple, and leave it to be developed apart in a future stage of the product development.
Also, it was shown to the interviewees some pictures of the prototypes made so far, to get feedback about them (see figures 22 and 23). One of the outcomes of this feedback session, is that the product should look more like a normal pot.
Based on these opinions, it is decided that the product’s appearance should be similar to a normal pot, but with a slight modification that adds an extra value.
Standard configuration, plant and substrate:
Following the previous line of thought about keeping the purification system in an elementary state, it was decided to keep the configuration of the main elements (container, fan, substrate and plant) as shown by the literature and market. Besides, the decision about which plant and substrate should be chosen is kept open for the one that eventually suits better, just by its aesthetics or practicallity.
Include a water tank with level indicator
With respect to the watering system, the user research respondents were clearly interested in including the water tank feature (71% water tank, 29% no water tank) with a water level indicator that lets the user know when to fill the tank (70% of the people choosing the water tank also wanted the level indicator). Based on these results, it is decided to include the mentioned features in the product.
Not include monitoring
About the possibility of including monitoring functionalities (temperature, humidity, soil humidiy, air quality), the questionnaire results point as the most accepted options to “just temperature and humidity” (32%) and “no sensors at all” (26%).
Between these two options, it is decided to not include any sensor in the product, as the inclusion of temperature and humidity sensors, together with the screen to display the data, would suppose electric consumption and could compromise the possibility of the device being solar powered.
Figure 22. Front view of one of the prototypes shown during
the interviews
Figure 23.Top view of one of the prototypes shown during
the interviews
80 81

Minimalistic, subtle, neutral, timeless, functional and natural
During the interviews, the most used terms to define how the product should look like were: “minimalistic”, “subtle”, “neutral”, “timeless”, “functional” and “natural”. The terms minimalistic, subtle, functional and natural can be aligned with the concept explained in the previous point. The device’s formal language should add an extra functionality, in a subtle way and respecting the plant’s naturality.
With respect to the terms neutral and timeless, when asked the interviewees to elaborate on them, they refered to them as a solution to the need of the device fitting in their daily life at home. “Neutral”, so it can fit with the other elements present in the house. “Timeless”, because “it is a product you will find lots of times everyday, and I don’t want to get tired of it in two years”.
Therefore, it is decided that the design’s aesthetics should transmit these adjectives.
Materials: white ceramic and wood
Regarding the materials to use for the device, the most liked options were white ceramic and wood, being suggested several times a combination of both of them. Following this feedback, it is decided that the design should use white ceramic for the pot, and wood as a secondary material for the details.
Figure 24. Pot styles and materials that were shown during
the interviews
#1: Plastic #3: Legs#2: Terracotta
#4: Wicker #6: Scandinavian#5: Ceramic
#7: Contrast #9: Cork#8: Texturized
82 83

4.2. Design requirements overview
All the design requirements discussed in the previous chapter are summarized in this scheme:
Target group
Product scenario
Features
Aesthetics
Airflow generated by one fan
Normal potted plant + something extra
Western Europeans
On a table
Solar powered device
Transmit:
- Minimalistic
- Subtle
- Neutral
- Timeless
- Functional
- Natural
No monitoringWater tank with level indicator
Main material: White ceramic
Living in big cities
Next to a window
Upgradable system
Secondary material: Wood
>30 years old
Medium size: 25 cm height aprox
100€ - 150€
84 85

Design proposal

5.1. Proposed solution
How to meet the requirements stated in the previous chapter? Or more important, which of the possible ways of meeting them should be the one to choose? To find answers to these questions, the design methodology (explained in the second chapter) suggests to do a first stage of ideation and prototyping (phase 3: develop), to then evaluate and decide for one option, and finally polish that option to be presented (phase 4: deliver).
It should be mentioned that in this chapter the report will stop following the chronological order of the design phases. Alternatively, it is first shown the outcome of the phase 4 - Deliver, introducing the details (3D visualizations, context pictures and working mechanisms) of the design that is selected to meet the product requirements, and then elaborated on the steps that lead to decide for that design (phase 3 - Develop).
In a short way, the resulting solution consists of a pot that is equipped with an airflow system. When placing a plant in the pot, the system forces air through the soil and roots, eliminating contaminants and increasing the relative humidity of the indoor space. The needed electronic components are powered by solar panels. Besides, it has a water tank and a level indicator that enables the user to water the plant less frequently and be aware of the correct watering times.
Air purification Water tank
Solar powered
Figure 25. Illustration of the proposed solution and its main
functionalities
88 89

Figure 27. Visualization of the proposed solutionFigure 26. Visualization of the proposed solution
90 91

Figure 29. Visualization of the proposed solutionFigure 28. Visualization of the proposed solution
92 93

Figure 32 (up). Close view of the base. Figure 33 (down).
View of the device’s bottom part.
Figure 30 (up). Solar panels in detail. Figure 31 (down). Close
view of the level indicator.
94 95
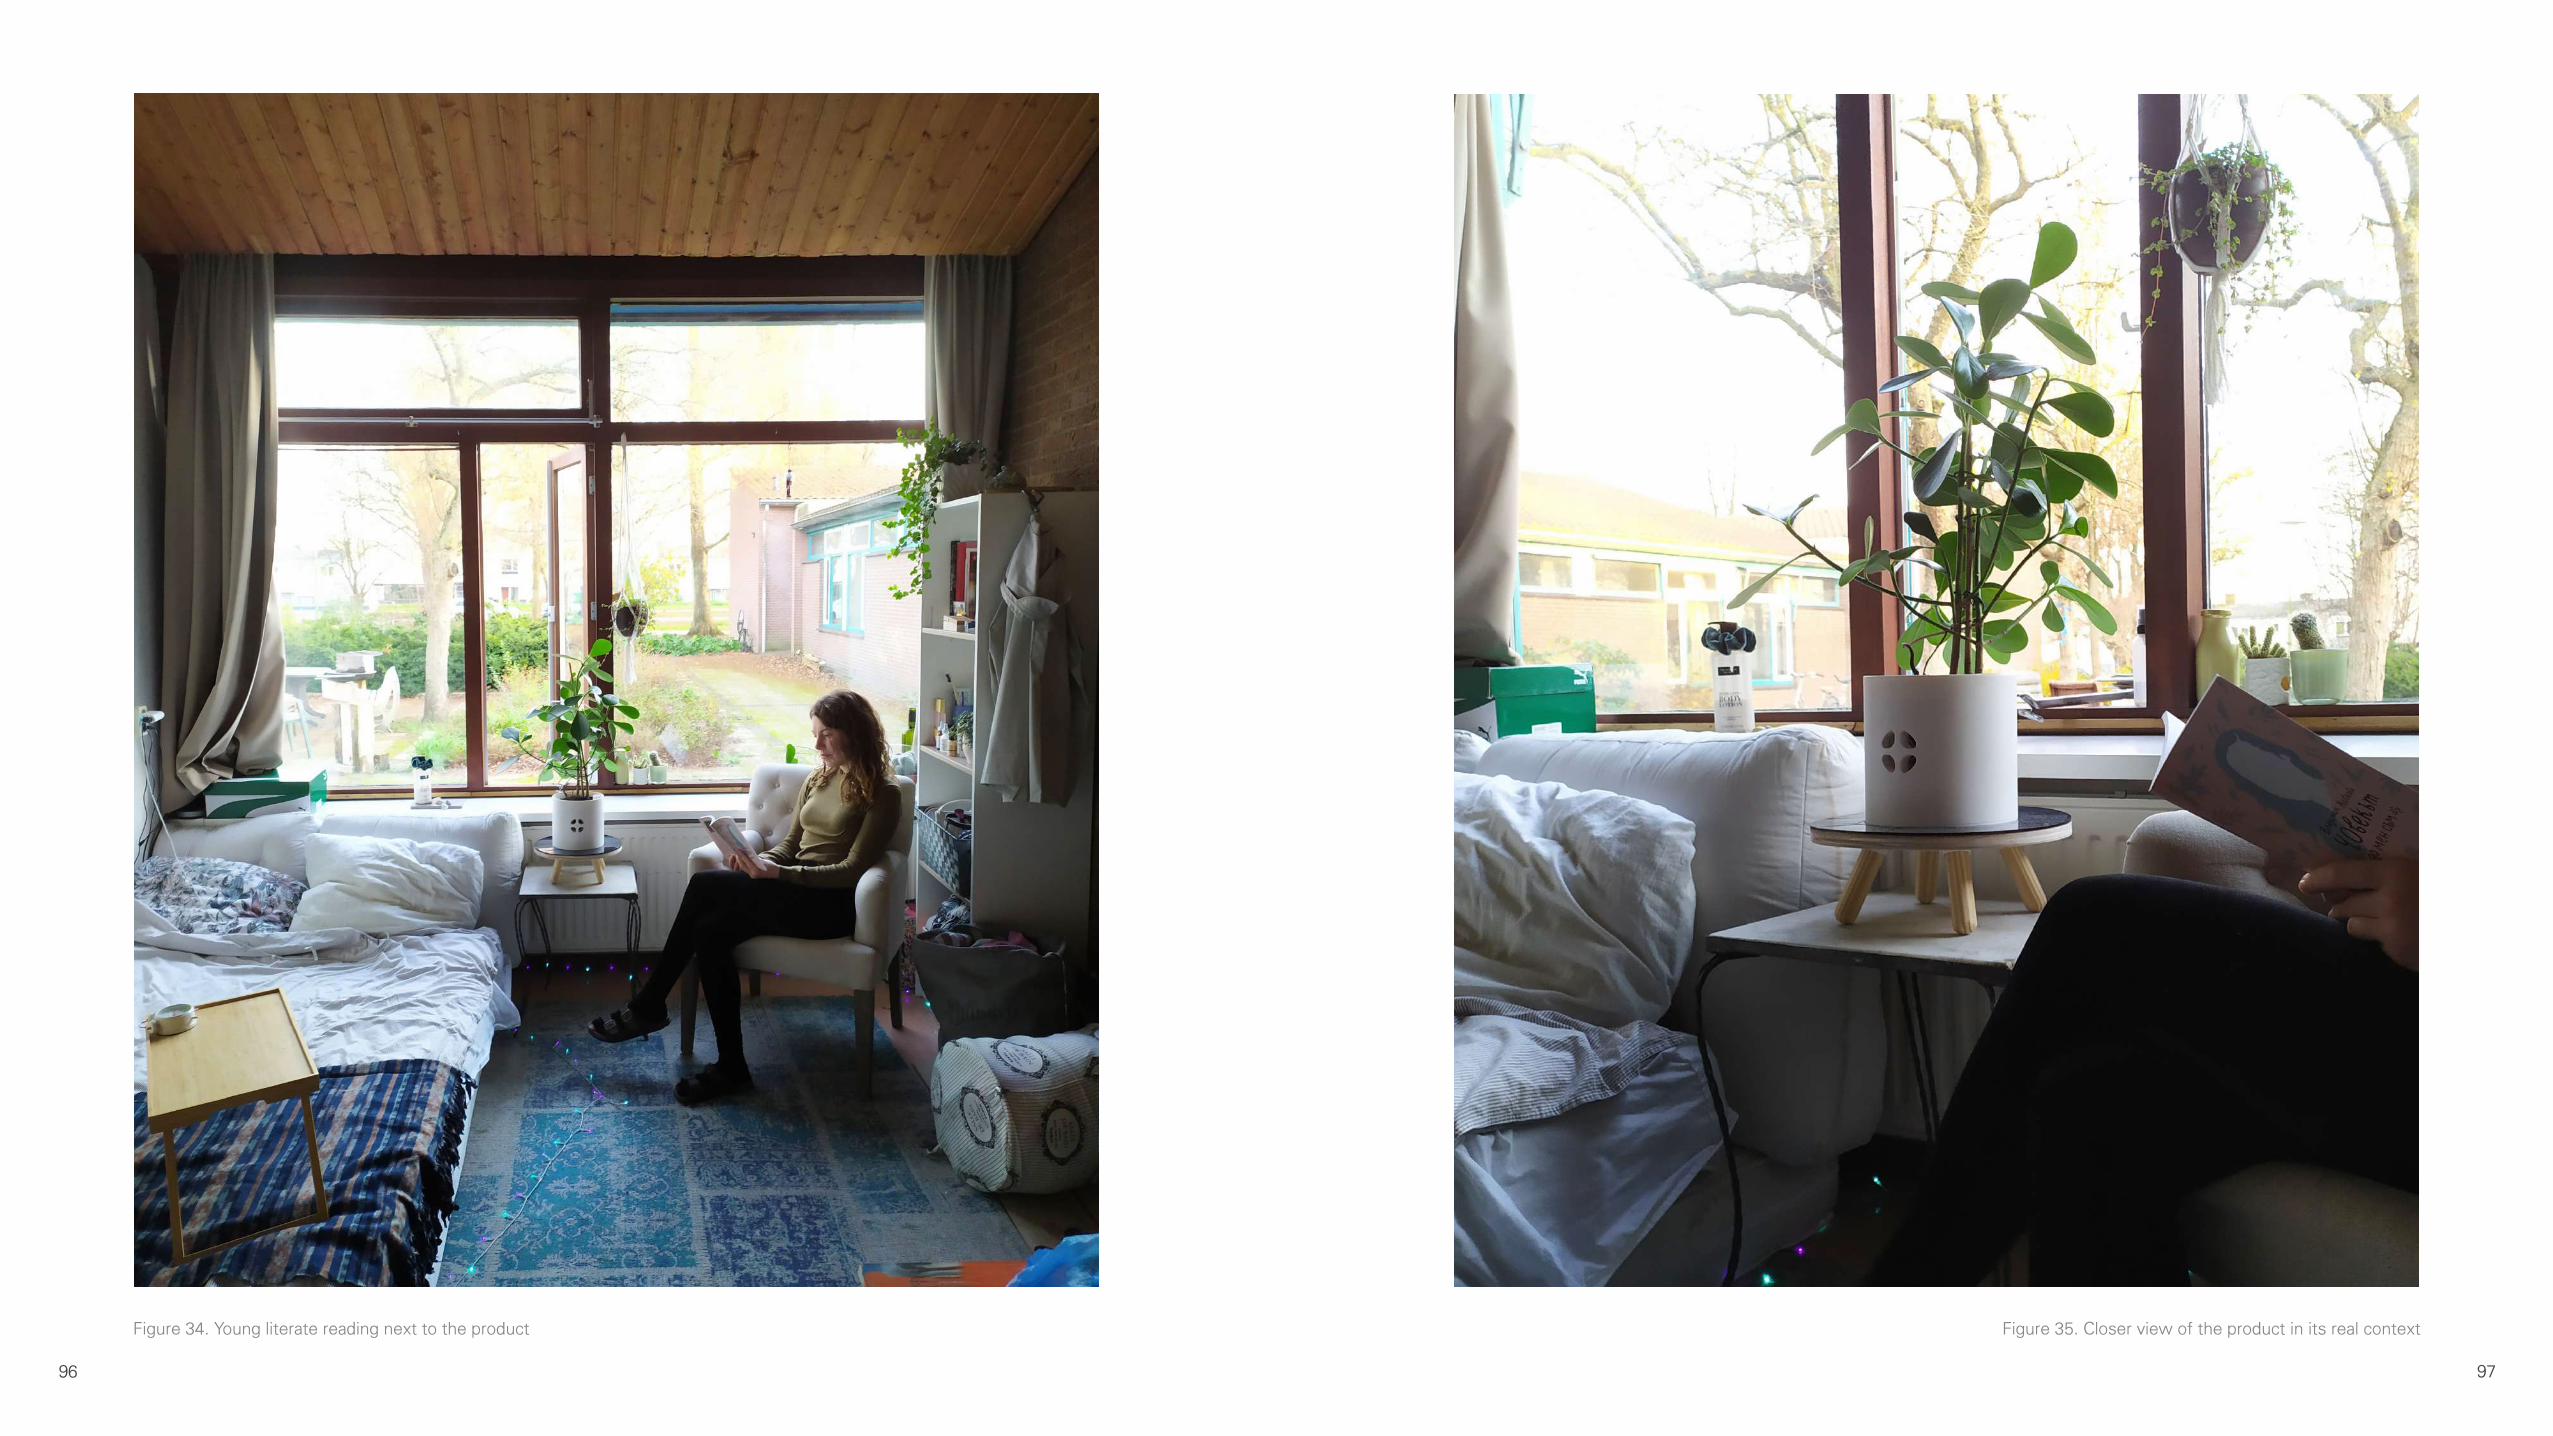
Figure 35. Closer view of the product in its real contextFigure 34. Young literate reading next to the product
96 97

6 - Water level indicator:
A foam piece attached to a red cylinder is used as the water level indicator. The foam floats over the water contained in the big pot, while the bar sticks out through the lateral container’s hole.
5.1.1. Product components
Along this chapter, the different components that form the product are briefly described, indicating the composition/material of the element and the relative location within the product.
The functionalities of these components are described in further chapters.
1 - Main pot:
The main pot, made with ceramic, contains the following components.
2 - Plant container:
A plastic plant container is placed inside the bigger pot.
3 - Sealing band:
A rubber band surrounds the top part of the plant container
4 - Pebbles:
Volcanic pebbles are placed at the deepest part of the container.
5 - Soil:
Mixture of black peat with activated carbon, to be placed inside the container.
5
6
3
4
2
1
98 99

14 - Solar panels case:
The plastic case contains the solar panels and its connections, and is screwed between the solar panels cover and the wood base.
7 - Electronics case:
A plastic case hosts the electric circuit and a fan. It is located inside the main pot, where it can be slided through the bottom’s slot. Besides, It is screwed on the wood base (described in the page 103).
8 - Fan:
A fan is screwed inside the electronics case, where it is connected to the power system.
9 - Electric circuit:
The electric circuit is placed inside the electronics case.
10 - Electronics case lid:
A plastic lid is screwed in the electronics case.
11 - Sealing rings:
Two rubber sealing rings are placed around the two faces of the fan, embedded in the electronics case.
12 - Solar panels:
Eight solar panels are placed on the solar panels case, and connected to the electric circuit.
13 - Solar panels cover:
The acrylic piece is placed at the same level of the solar panels, screwed on the wood base.
14
8
10
13
12
7
9
11
100 101

15 - Wood base:
The previously mentioned components lay on the wood base, being screwed to the electronics case and solar panels case.
16 - Legs footings:
The plastic footings are screwed to the wood base from the bottom of it.
17 - Legs:
The legs are introduced inside the footings and secured with one screw each.
15
17
16
102 103

hand, it absorbs and adsorbs harmful pollutants present in the air, and on the other hand, its water content increases the relative humidity and balances the temperature of the air. As suggested by the literature, activated carbon is added to the soil mix to improve the pollutant removal capacity.
Plant: Once the pollutants are retained within the media, the plant uses them as nutrients for its own growth. Thanks to this process, the filter gets constantly rejuvenated.
Container A, container B and sealing elements: The goal of these elements is to ensure that the airflow is forced through the media and not through other spaces. The fan and the media are placed in the middle of two openings: the four holes of the main pot (container A) and the top part of the plant container (container B). To ensure that there are only these two openings, the sealing elements are placed in those spaces where the air might be leaking, so the volume between container A and B is airtight. The container B (plant container) has numerous holes throughout its surface, so the air can pass through it.
5.1.2. Biofiltering system
Main function of the system:
The purpose of this system is to increase the air quality level of the space where the device is located, by removing pollutants, increasing the relative humidity and harmonizing the temperature.
Involved components and their role in the system:
Fan: Generate an airflow that goes through the plant media. This action should be made as less noisy as possible (to be user friendly) and as low energy consuming as possible (given the limited available energy).
Media: With an airflow passing through it, the media changes the composition of the air. On one
Figure 36. Visualization of the device without the main pot Figure 37. Cross section of the involved components
Airflow
CO2
VOCs
+H%
Sealing band
Sealing ring
Sealing band
Sealing ring Plant container’s holes
Plant
Opening 1
Opening 2
Container A
Media
Container B
Fan
pm
104 105

Involved components and their role in the system:
Solar panels: Transform the light into energy, to be stored in the capacitor and then be used by the fan. The solar panel system is formed by 8 solar panels connected in parallel to the rest of the circuit.
Energy buffer: The energy buffer is placed with two purposes: store the energy produced by the solar panels, and open/close the connection with the fan depending on the energy levels.
To achieve this double functionality, the buffer is composed by different elements: a capacitor, which will be the element storing the energy; and a combination of 4 resistors, 3 diodes and 2 transistors, which will act as the ‘door’ that connects the capacitor’s stored energy to the fan.
The circuit is designed to switch ON when the capacitor reaches 3,75V and switch OFF when it has decreased to 2,65V.
Fan: Use the energy produced by the solar panels.
Electronics case: This component encases both the fan and the energy buffer components, keeping them in the correct place and protecting them. The energy buffer case has some openings to ventilate and avoid heat accumulation.
Solar panels case: Encases the solar panels, guides its connections and protects them.
Upgradeable system:
One of the outcomes of the research is that the device should be upgradeable, to be adapted to
5.1.3. Power system
Main function of the system:
The purpose of this system is to supply solar energy to the fan that is creating the airflow, being the device placed in a variable light setting such as ‘next to a window at an indoor space’.
Variable light conditions:
Light conditions are not the same for different buildings (building’s orientation, window’s size, etc…), different times of the day (day, night) and different weather conditions (sunny, cloudy).
On the other hand, the fan needs a minimum energy level to be running, and if this level is not reached it will not run. With the selected solar panels, this minimum energy level is reached only when direct sunlight (through the window) hits them. On the contrary, for the rest of situations (cloudy, sunny but indirect light, night, etc…) the energy levels are not enough to activate the fan.
Given these factors, the power system is designed in such a way that it is constantly storing energy until a certain level is reached, at which the fan will use the energy and start working. Thus, when the conditions are optimal (direct sunlight), the fan will work without the need of storing energy; and when the conditions get worse, the fan will work from time to time when enough energy has been stored
Figure 38. Diagram of the power system’s circuit and its
components specifications
C1 Z1
D1
Z2
R1
R3
R2
R4
Tr1
Tr2
Components specifications:
- Solar panels: Model SEEED-313070004 /
5,5V / 100mA
- Fan: Model Noctua NF-A4x10 / 5V / 0,25W /
0,05A
- C1: Capacitor Supercap / Model AVX
SCMR18C105 / 1F / 5,5V
- Z1: Diode / Model T2X5V1A
- Z2: Diode / Model T2X4V3B
- D1: Diode / Model IN4148
- R1: Resistor / 47K ohm
- R2: Resistor / 47K ohm
- R3: Resistor / 18K ohm
- R4: Resistor / 5,6K ohm
- Tr1: Npn transistor / Model BC550
- Tr2: Pnp transistor / Model BC560
106 107

the coming improvements in the light harvesting technology. For this reason, the described power system is differentiated from the rest of the product, and it is designed to be easily detachable from the other parts and easily accessible for eventual fixes or components replacement.
To remove the system from the rest of components -the pot and the base- it is only needed a cross screwdriver. The pot is attached to the power system just by gravity, and the base is fixed to it by 4 screws. Within the power system, the components can be detached with the same cross screwdriver.
Figure 40. Cross section of the involved componentsFigure 39. Visualization of the power system components
Solar panels case
Solar panels
Energy buffer
Connections
Fan
Solar panels cover
Electronics case
Open geometry to ventilate
the energy buffer
Screws to attach the
case to the wood base
Cavity where to fit the
main pot
108 109

Performance for the possible scenarios:
As explained before, the device will face different scenarios that will have different effect in its performance.
With a working prototype of the product, a test was carried out in real settings to check the behaviour of the product and monitor the time that the fan was running.
In the following schemes, the results of this test are summarized in three possible scenarios: direct sunlight, cloudy/not direct sunlight and night.
Figure 41. Prototype used for the test
Figure 42. Different performances for different scenarios
Scenario 1: Direct sunlight
Scenario 2: Cloudy
Scenario 3: Night
Capacitor’s voltage
Capacitor’s voltage
Capacitor’s voltage
The fan stays ON all the time
The fan stays OFF, accumulating energy
The fan stays OFF all the time
The fan stays ON, using energy
5V
5V
5V
4V
4V
4V
3V
3V
3V
2V
2V
2V
1V
1V
5´ 10´ 15´
1V
Time
Time
Time
110 111

5.1.4. Watering system
Main function of the system:
The purpose of this system is to reduce how often the plant should be watered, while making visually noticeable the moment that the water tank needs to be refilled.
Involved components and their role in the system:
Outside container: The outside’s container is the water tank and therefore its function is just to store the water.
Inside container: The main function of the inside container is to keep the plant and the media partially separated from the water, making sure that the contact between both volumes is just existing at a specific area (where the pebbles are placed). There are holes along the surface of the container to let the water get into the media. By supplying water from the bottom, the plant gets access to it without over saturating the media.
This component has integrated a vertical hollow pipe on one side, which is both used as an access to fill the water tank and as a guide for the level indicator.
Pebbles: The volcanic pebbles are placed at the bottom of the ‘inside container’, where there is contact with the water level. The reason for having pebbles instead of normal soil is that the pebbles absorb less amount of water, which helps to ration the amount of water that goes up to the plant.
Level indicator: Its purpose is to inform visually about the water tank’s level, making clear the maximum and minimum values that the system needs to perform correctly.
A little floating foam piece is attached to a vertical bar that reaches the top of the pot (guided by the hollow pipe integrated in the inside container). When the water level raises, the bar will stick out more, indicating the maximum value so the user knows when to stop filling the tank. When the level decreases, the bar will descend until it doesn’t stick out anymore, which indicates that the water tank should be filled again.
Figure 43. Cross section of the involved components
Outside container
Inside container
Level indicator at its maximum level
Level indicator at its minimum level
Pebbles
112 113

Along the rest of the chapter, the price of every component of the product is estimated. The price for each component is derived from the price of producing/sourcing 2000 of them. Based on this exercise, a production cost estimation of the whole product is given at the end of the chapter.
5.1.5. Preliminary manufacturing and cost production
In this chapter, a preliminary exercise of the product’s cost estimation is carried out.
Kickstarter campaign with 2000 units to produce
To be able to determine the production cost of a product, it is necessary to know first the number of units that are going to be produced, which is directly related with the characteristics and strategy of the company that is going to produce it.
But then, in this case, how many units want ‘the company’ to produce? Because it is an independent project with no company behind, it is needed first to set a possible scenario. Given the nature of the project, a realistic scenario would consist of a small company that launches the product in Kickstarter (crowdfunding campaign), receiving funds from backers in exchange of delivering them an unit of the product when it is produced.
Therefore, the number of units to be produced equals the number of backers that the campaign achieves. In order to set a realistic number of backers, other similar campaigns are taken as reference. The product Breth (shown in the page 20) obtained 780 backers (Kickstarter, 2020); while the product Natede (shown in the page 21) achieved the amount of 3821 backers (Kickstarter, 2020). Thus, it estimated that a Kickstarter campaign of the product could achieve a middle-point number of 2000 backers.
Component
1 - Soil Plusjop, Netherlands (Plusjop, 2020)
Zhengzhou Zhulin Activated Carbon Development Co.,
China (Alibaba, 2020)
Grind-Split, Netherlands
(Grind-Split, 2020)
BGT Technology, China
(Alibaba, 2020)
Dongguan Yueyi Rubber Products, China
(Alibaba, 2020)
Dongguan Yiyou Electronics Technology,
China (Alibaba, 2020)
2 - Activated carbon
3 - Pebbles
4 - Level indicator
5 - Sealing band
6 - Sealing rings (x2)
290 € (3.000L)
252 € (200kg)
100 € (800kg)
2.000 €
42,2 €
100 €
0,145 €
0,12 €
0,05 €
1 €
0,021 €
0,05 €
Sourced from: 2.000 units cost Cost per unit
114 115

7 - Fan
13 - Screws (x32)
Dongguan Xingdong Electronics, China
(Alibaba, 2020)
Dongguan Dalang Xinxin Hardware
Factory, China (Alibaba, 2020)
Shangai Green Tech Co., China (Alibaba,
2020)
Guangzhou Veitop Libang Co., China
(Alibaba, 2020)
Jieyang Kehe Electronic Industrial Co., China
(Alibaba, 2020)
Foshan Youyao Hardware Products,
China (Alibaba, 2020)
Mate Ford International Co., China (Alibaba,
2020)
Yiwu Shuodian Electronic Commerce,
China (Alibaba, 2020)
Fuzhou Aoling Donghua Electronics Co., China
(Alibaba, 2020)
Hebei Strudex Technology Co., China
(Alibaba, 2020)
Dongguan Guyland Electronic Technology L.C., China (Alibaba,
2020)
Qingdao Hinergy New Energy Co, China
(Alibaba, 2020)
8 - Capacitor
14 - Wood legs (x4)
9 - Transistors (x2)
15 - Legs Footings (x4)
10 - Resistors (x6)
16 - Wood base
17 - Pot
18 - Plant container
11 - PCB
12 - Solar panels (x8)
3.580 €
1.340 €
620 €
1.686,56 €
13,4 €
1.146,86 €
102 €
4.720 €
7.560 €
Mold: 20.238,72 €Material (PP: 235,64
kg): 268,62 €
7.420 €
25.500,79 €
1,79 €
0,67 €
0,31 €
0,84 €
0,0067 €
0,57 €
0,051 €
2,36 €
3,78 €
10,25 €
3,71 €
12,75 €
Component
Component
Sourced from:
Manufactured:
2.000 units cost
2.000 units cost
Cost per unit
Cost per unit
116 117

Hebei Strudex Technology Co., China
(Alibaba, 2020)
Hebei Strudex Technology Co., China
(Alibaba, 2020)
Hebei Strudex Technology Co., China
(Alibaba, 2020)
Hebei Strudex Technology Co., China
(Alibaba, 2020)
19 - Electronics case
20 - Electronics case lid
21 - Solar panels cover
22 - Solar panels case
Mold: 2.698,5 €Material (PP: 169,68
kg): 193,43 €
Mold: 1.349,25 €Material (PP: 4,26 kg):
4,85 €
Mold: 2.698,5 €Material (PP: 103,58
kg): 118,08 €
Mold: 2.698,5 €Material (PP: 678,88
kg): 773,92 €
1,44 €
0,677 €
1,4 €
1,73 €
43,72 €87.441,4 €
Component Manufactured: 2.000 units cost
Total cost 2.000 units
Cost per unit
Total cost per unit
118 119

5.2. Design process
Once the final design has been explained in detail, in this chapter it is elaborated about the previous step in the design process (step 3: develop).
The aim of this chapter is to showcase the design process that was carried out, as well as helping the reader to understand which circumstances and processes lead to the design decisions that can be appreciated in the final design.
5.2.1. Looks and components configuration
The following step after specifying the design requirements is the ideation: generate different concepts that accomplish the stated goals in different ways. After some ideas generation sessions, the most promising concepts were selected to be evaluated with the user.
Looks and components configuration: User test
As part of the evaluation process, the best 5 concepts were shown to 34 people to comment on them and fill a questionnaire (appendix 5) where to grade each alternative in different areas. The figure 44 shows the 5 proposed concepts together with the questions formulated in the questionnaire.
The results from this test (appendix 6) point
Alternative 1
Formulated questions:
1. Grade from 1 to 7, being 1 “I don’t agree at
all” and 7 “completely agree” :
/ Aesthetics of the product is neutral
/ Aesthetics of the product is timeless
/ The product is beautiful
/ The product fits in my space
/ The product looks professional
/ The product is functional
2. Decide for the best and the worst option
Alternative 2
Alternative 4
Alternative 3
Alternative 5
Figure 44. Visualizations and questions of the user test
about the basic configuration and looks of the product
120 121

to the alternative 5 as the most desired (35%), followed by the option 2 (29%) and the 1,3,4 with 12% each of them. Regarding the least desired option, the number 4 (40%) and the number 3 (36%) are the most selected ones, followed by the number 2 (12%) and the 1 and 5 with 6% each of them.
With respect to the other formulated questions, there are no remarkable results.
Decision taking: Harris Profile
Once the user test’s results are analyzed, every concept is evaluated taking into account also other factors: potential capability of harvesting light, simplicity, flexibility for plant selection and used space.
In order to compare how convenient is each of the options at each of the mentioned aspects, a Harris Profile comparison is carried out. The Harris Profile is a design tool that, with a 4 point matrix, allows to visualize and compare the strengths and weaknesses of each option.
The figure 45 shows the results of the comparison, where the alternative 5 results to be the most promising option, and thus the selected one for further development.
In the pages 124 and 125, the concept #5 is explained in greater depth, as it was shown in the user test.
Figure 45. Harris Profile comparison between the 5
generated concepts
#1
+5
User
Light
har
vest
ing
Simpli
city
Plant f
lexibi
lity
Used
spac
e
+2
-2
-5
+6
#2
#3
#4
#5
122 123

Figure 46 (up). Visualization of the concept #5 alone. Figure
47 (down). Visualization of the concept in its context
Figure 48 (up). Visualization of the concept’s components. Figure
49 (down). Detail of the advantages of being detachable
Indoor solar panel Pot with water tank
Plant containerSlot to insert the fan + battery
module
Watering pipeFan
Stand Battery
Repair !!
New version, upgrade it !!
124 125

Prototyping
Once the concept is fixed, the following step in the process is the prototyping. The aim of this step is to learn by building, and find tangible mistakes or possible improvements that can be implemented in following iterations. After a few iterations, the final prototype is achieved, ready to be used as a working product to be tested by users, as well as test its performance regarding air quality improvement.
In the following pages, there is a sample of some of the prototyping techniques utilized during this stage (3D printing, laser cutting, ceramics, etc…) and its results.
Figure 50 . Prototyping of a first model to get an idea about
the product’s size
126 127

Figure 51. Prototyping of the main pot and the plant container,
including the pebbles the media and the water level indicator
Figure 52. Prototyping with 3D printing, wood and plaster to
explore possible molds for the ceramic piece (main pot)
128 129

Figure 54. Prototyping with laser cutting of wood and acrylic
to build the base of the product
Figure 53. Prototyping with wood and 3D printing to explore
different legs options
130 131

Figure 56. Final result of the prototype, placed in he context
where it’s supposed to be
Figure 55. Prototyping with solar panels, Arduino, multimeter
and soldering to develop the electronics of the product
132 133

5.2.2. Electronics configuration
Along this chapter, the design process of the electronic system is explained in more detail, showing the taken steps, the explored possibilities and the reasons that lead to the final electronics system.
Goal to achieve:
Make the fan run as much time as possible with the available energy harvested by the solar panels.
Testing with the components:
As a first step, it is important to test what is the real performance of the components that are going to be used, and how they will behave in the specific conditions of this project.
Fan: The selected fan (Noctua NF-A4x10) specifies that it works with 5V and 0,05A. However, this kind of fans usually are able to also run with less energy, but rotating with less speed. Therefore, it is interesting to find out what is the minimum energy that the fan needs to run. By knowing this value, the rest of the device can be designed to supply less energy and thus increase the time that the fan will work, although it will work with less speed.
The lowest values that made the fan run are 2,76 V and 0,025 A.
Solar panels: According to the product
specifications, each solar panel it’s supposed to generate 0,1A with a voltage of 5,5V under optimal conditions. However, the solar panel’s ideal conditions are being outdoors under direct sunlight, which is different from the project’s specific conditions. Therefore, it is necessary to test how much energy can be harvested in the scenarios where the product is going to be used.
As it can be observed in the figure 57, the obtained results for the proposed scenarios are substantially different. In light of this, it is decided that the device must work (fully or partially) in each of the possibilities, but being specifically designed for the ‘middle ground’ second situation. This scenario is generally possible to be found indoors, and thus accessible for the user, plus it is the scenario where the best efficiency can be achieved.
Scenario 1: Artificial illumination
/ Light: 1.010 lux
/ Intensity: 0,003 A
/ Voltage: 4,14 V
Scenario 2: Indirect sunlight
/ Light: 1.690 lux
/ Intensity: 0,007 A
/ Voltage: 4,71 V
Scenario 3: Direct sunlight
/ Light: 18.000 lux
/ Intensity: 0,047 A
/ Voltage: 4,85 V
Figure 57. Intensity (A) and voltage (V) generated by the solar
panels in different light settings
134 135

Iteration 1: Solar panels - Fan
The ideal situation, and therefore the first one to be checked, is the one where the solar panels are able to generate enough energy to supply the fan without the necessity of previously storing it. By not using a middle element, the system gains in simplicity and avoids energy losses from using more components.
In order to check whether this option is realistic, the fan is connected to the panels in the different scenarios previously described.
Results: The fan runs only in the scenario where the sunlight is directly hitting the solar panels.
Therefore, this option is ruled out, as it constrains excessively the situations where the product would be useful.
Figure 58 (up). Scheme of the used components. Figure 59
(down). Picture of the test at the second case scenario
136 137

Iteration 2: Solar panels - Low consumption motor
With the previous intention of avoiding the energy storing step, in this iteration it is aimed to reduce the fan’s energy consumption by replacing it for a low consumption motor attached to externally designed blades.
The used motor is the motor SOL300 (brand: Sol Expert), which according to its specifications it starts running with 0,18V and 0,008A.
In order to carry out the test, the same process as in iteration 1 is repeated, but connecting the system to the motor instead of the fan.
Results: As in the previous case, the motor is only activated in the scenario where the sunlight hits directly the solar cells. Besides, when the motor is working, the noise that generates is considerably high. For these reasons, this option is also declined.
Figure 60 (up). Scheme of the used components. Figure 61
(down). Picture of the test at the second case scenario
138 139

Iteration 3: Solar panels - Capacitor - Transistor circuit - Fan
Once dismissed the option of connecting the fan directly to the panels, the next iteration brings the idea of storing energy when there is not enough to run the fan, so it can be accumulated and used from time to time.
To effectuate this idea, two elements must be added between the solar panels and the fan: an element ‘A’ that stores energy, and an element ‘B’ that decided when to let the stored energy go to the fan or not.
The first option that comes to the table is the use of a battery (element ‘A’) in combination with a microcontroller (element ‘B’) that will open/close the circuit when certain battery values are reached. However, this option is declined for two reasons: the microcontroller consumes energy in order to work, meaning that it is possible that the generated energy ends up being consumed by the microcontroller; and the fact that batteries usually have important energy losses.
As an evolution of the first option, a new option arises: the use of a capacitor, as the storing element, in combination with a transistors circuit that opens/closes for specific voltage values reached by the capacitor. The advantages of this idea are, in first place, the no energy consumption of the transistors circuit, and secondly, the low energy loss of the capacitor.
To observe this idea in practise, a first test is carried out where, on one side, the capacitor is connected to the solar panels, and on the other side, the transistor circuit’s role is done manually (see figure 62). After the success of this test, the transistors circuit is built and all the components are soldered together (see figure 63).
Results: The fan works constantly under direct sunlight, and runs approximately 1 minute every 5 minutes when the sunlight is indirect (behind clouds, or different orientation).
Therefore, it is decided to keep this option as it achieves the stated goal: making the fan work in each of the possible light scenarios.
Figure 62 (left). Scheme of the used components. Figure 63
(right). Picture of the test at the second case scenario
140 141

Design evaluation

Design evaluation
After finalizing the fourth step of the process (deliver), the result is already a product. However, the design of a product is a constant iterative cycle, where every new iteration should be evaluated and analyzed to obtain useful information for the following iterations.
Therefore, taking advantage that a functional prototype is already made, a primary evaluation of the design is carried out about two different areas: how the user experiences the product and what is the product’s effect on air quality.
In order to obtain this feedback, two tests are carried out, whose results will be transformed into project conclusions and recommendations for further iterations.
6.1. User test
6.1.1. Test purpose
The main objective of the user test is to obtain feedback about the experience of living with the product, getting deeper in the following areas:
- Process of placing the product (given the importance of the light conditions)
- Effect on the user comfort during the use of the product
- Handling of the product
- Aesthetics
6.1.2. Test setup
To obtain the previously mentioned information, it is designed a 3-step test:
1 - Give the product to the user in the building where it is going to be used. At this moment, the advantages of the product regarding the air comfort are explained (decrease of pollutants levels, increase of the relative humidity and temperature balance) and the fact that the light conditions where it is placed affect its performance.
2 - The user, by its own, decides where the product is going to be placed and cohabits with it during 2 days.
3 - The product is taken back and the user is interviewed (around 30 minutes).
Figure 64. One of the users being interviewed
144 145

6.1.3. Test results & discussion
After processing the conversations, the opinions considered to be more relevant are clustered in different groups. Along this chapter, these opinions are shown together with the discussion on how the insights can affect the further development of the product.
Feeling doubtful while placing the device
The decision about where to place the product was conditioned by different factors: “in which room do I want to have better air quality?”, “Where does it get more light?” and “Where does it look better?”. Each user considered these three questions and took stock of the three aspects, giving more importance to the aesthetics in some cases or basing the decision just on the light that is receiving in other case.
A common opinion in all the interviewees, is the fact that they felt unsure about how the possible places will affect the product’s performance, generating uncertainty about their house being appropriate for such a product. Given this problem, it was suggested by one of the users that before the acquisition of the product, the customer should have clear information about where the product will/won’t perform well.
Discussion: From such a reduced number of interviewees, it cannot be assumed that the object is ‘too big’, as they were influenced by the characteristics of their home. It is possible that in different places, for instance with larger tables, the product can suit better without disturbing other activities.
However, it seems that making the product more adaptive, or including product variations will make the placing experience less rigid. Some possible solutions could be the mentioned
Discussion: The feeling of doubts or disinformation in the user contributes negatively to the product experience, and thus it should be avoided.
With this aim, as it was commented during one interview, before getting the product the user should be certain about how apt is the product for the specific characteristics of his house. Besides, it should be possible to know which is the difference (performance wise) between using the product in one position with respect to another one. With this information clearer, the user would potentially feel more sure about the final decision.
Some possible solutions for this issue could be having an elaborated narrative where the user (and his space) feels identified, or including some sort of feedback such as a little LED that shows visually when the product is working, letting the user have an idea of the frequency at which the device is working at the current place.
Big object, needs a place for its own
Another insight related to the placing of the device, is the fact that every user decided that the product should have a place for its own. This is explained by the size of the product, as it can be impractical or feel too busy when sharing space with other objects/activities.The chosen options were a window sill (1) and a side table (2) (one of them can be seen in the figure 65).
This need of finding a liberated spot for the product adds complexity to the action of placing the product. During one interview, it was commented that the possibility of detaching the legs would make it easier for her, as she would have more options to play with.
possibility of having detachable parts, or bringing the possibility of buying the product together with a stand. This second option is included in other products in the market (see figure 65).
Positive impact in the perception of the room quality
The use of the product brought a positive impact in the perception that the user had about the space where they were cohabiting with it. In other words, with the product’s presence, the user felt that the quality and comfort of the space increased, making the stay more enjoyable.
The origin of this positive feeling was directly related to what the product means for them. It was defined as a mix of various positive elements: good air quality, plants, beauty and solar powering.
I was feeling too much its presence while having it in my
working desk
As a user, I would like to be sure that my room is apt for this
product
Figure 65. Table used by one of the users (left) and stand
available with the air purifier Natede (right) (Vitesy, 2020)
146 147

The idea of sharing space with the product works as a psychological support, as it brings the idea of being in a “a bit better environment” which is exclusively produced by natural things such as plants and the Sun.
Regarding the question “Did you feel any difference while breathing?”, two of the users answered “No”, and the third one replied that in a couple of times she found the room less stuffy than she would expect. However, she was aware that it could be a placebo effect.
Discussion: This psychological positive impact mainly comes from the notion of the product increasing the air quality. Therefore, it has to be taken into account that the air quality is the base where the project lays, and thus it is extremely important to have laboratory tests that back up the performance of the product.
Good handling experience
Any user had problems with handling the device. The place where to grab was clear, there was no fear about touching the exposed solar panels, the product was stable and the weight appropriate.
Discussion: When preparing the user test, the solar panel’s location was perceived as a potential problem for the user, as it could lead to the user being afraid of touching and breaking the electronics part of the product.
The interviewees didn’t perceive this as a problem at all. However, due to the small amount of people interviewed, this cannot be discarded as a potential problem. It would be interesting to see how people from different backgrounds and age react to this situation.
Good aesthetics style
All the users liked the overall aesthetics of the product, describing it as beautiful, cute, natural, appropriated and neutral. In the same vein, the colours (green, white and wood), the natural materials and the rounded shapes (holes, legs) were positively appreciated.
Regarding the negative remarks about the aesthetics, it was mentioned that the solar panels area should also have rounded edges (in a front view of the product), and that the level indicator’s red colour didn’t match the rest of the components.
Discussion: From these results, it can be concluded that the chosen style is appropriated and should be kept in future iterations. Besides, the users pointed to looking natural and neutral as the way to go, which confirms the research findings.
Integration of the solar panels can be improved
Another common opinion in all the users is the suggestion of improving the way the solar panels are integrated in the product. The main reason causing dislike is the excessive contrast between very natural elements (wood, plant, ceramic) with very tech-looking and artificial components such as the solar panels and the black acrylic.
When asked to brainstorm about ways of solving this part in a different way, the solutions that came up were in the direction of making it more natural-looking or directly hiding the solar panels. The specific solutions were: hiding the panels by sticking them in the back part of the main pot; change the color of the solar panels and the black acrylic; and change the black acrylic for a more natural material.
Discussion: Given these results, the solar panel transition should be redesigned to make it
look more natural, or, at least, make the transition smoother.
A different option to consider would be to place the solar panels in the back of the main pot. However, this redesign would have greater influence in the rest of the product.
Anyway, as mentioned before, the number of users is small, and final conclusions should be taken when a bigger sample of the population is interviewed. It would be interesting to see how people from different population segments react to the presence of the solar panels, and check whether they prefer to hide or show them.
For me it worked as a psychological support, making me feel that my
working area is better
Easy to handle, no cables, perfect for moving it around!
I like to feel the technology but not to see it
Figure 66. Close view of the solar panels area
148 149

6.2. Performance test
6.2.1. Test purpose
The two objectives that are aimed to achieve with this test are:
1 - Get an idea of the influence that the device has on: VOCs levels, CO2 levels, Temperature and Relative Humidity inside a room. This is: Device-ON results vs Device-OFF results.
2 - Compare the effect that the device has when working with solar energy (1 minute each 5 minutes) with the effect that the device has when constantly working. This is: [Device-ON-Cable vs Device-OFF] vs [Device-ON-Solar vs Device-OFF].
The intention behind this comparison is to generate numeric data that can be used to inform the design decision about using solar energy or connecting the device by cable. Presumably, the constantly working device will have a better performance than the solar power, but how big is the difference?
6.2.2. Test setup
In order to compare the three mentioned modalities (OFF, ON-Solar and ON-Cable), some elements are needed:
Closed space: A closed space where to bring together the contamination and the purifier. A small bedroom (3x3x2,5 m) is used in this test.
Contamination: The contamination needs to be relatively high so the effect of the purifier can be noticed easier. Besides, it is important that
the contamination levels are similar in each of the modalities to test, so the later comparison is fair. The different sources of contamination used are explained below.
Sensors: A VOCs&CO2 sensor (model SGP30 from Adafruit) and a T&H sensor (SHT31 from Grove) are connected to Arduino, which is programmed to collect air quality data (VOCs, CO2, T, H) and save it in an Excel sheet each 10 seconds (see figure 68).
With these elements prepared, three different tests are carried out where different contamination sources are used.
Figure 67. The three modalities to be tested
Figure 68. Circuit that connects the VOCs&CO2 sensor, and
the T&H sensor with the Arduino to collect the data
Device-OFF Device-ON-Solar
/ Fan working 1 minute each 5
minutes
Device-ON-Cable
/ Fan working constantly
150 151

Figure 69. Room that was used for the test
Test 1: Human being as main contamination source
For this test, it is designed a routine that a human being (me) will follow daily. The routine is as follows:
9:00 - 9:30 Open windows and door
9:30 Close windows and door
9:30 - 13:00 Stay working inside the room
13:00 - 14:00 Lunch break outside the room
14:00 - 19:00 Stay working inside the room
19:00 - 22:00 Stay outside the room
22:00 - 22:30 Open windows and door
22:30 Close windows and door
22:30 - 9:00 Stay inside the room
While this routine is being followed, each of the modalities will be running during 4 days.
Test 2: Window cleaner spray as main contamination source
In this case, the routine is:
- Open windows and door for 30 minutes
- Close windows and door
- Spray 4 times in each corner of the room
- Leave the room closed for 4 hours (me outside as well)
These actions are repeated twice for each of the modalities.
Test 3: Incense as main contamination source
For the last test, the routine taken is:
- Open windows and door for 30 minutes
- Close windows and door
- Burn an incense stick and leave it in a fixed place in the center of the room
- Leave the room closed for 3 hours (me outside as well)
This routine is repeated 5 times for each modality.
152 153

6.2.3. Test results
Test 1: Human being as main contamination source
While carrying out the test, it was observed that the contamination coming from the human being (me) was not close to be similar for every day. With such a fluctuating contamination source, it will be difficult to appreciate the effect of the device. Therefore, it was decided to abort the test and look for a more stable contamination source.
Test 2: Window cleaner spray as main contamination source
The results of the test are displayed in the pages 155-157, differentiated by VOCs, CO2 and T&H, for each of the three modalities.
Regarding the VOCs and CO2 results, it is
observed what was expected: a big peak of high values at the beginning, that decreases constantly throughout time. In the case of the Device-ON-Solar modality (pag 157), there is a periodical decrease of the values that can be observed in one of the measurements (#1). This decrease, which is higher when the contaminant values are higher, corresponds to the time that the fan is activated. As it can be noticed in the figure 70, the falls are repeated every 5 minutes, lasting 1 minute each of them.
Regarding the relative humidity, it starts with high values (influenced by the humidity outdoors), but in a short period of time it decreases and stabilizes around a value. In the case of Device-ON-Solar, the same “periodical fall” effect previously mentioned can be appreciated again, although this time the humidity increases instead of decreasing.
With respect to the temperature, it starts influenced by the outdoors temperature bringing low values. The line quickly raises and stabilizes around a temperature value.
1´ 5´
VOCs (1)
Figure 70. Periodical fall in the VOCs (1) values
0
1000
2000
3000
4000
5000
6000
7000
1 20 39 58 77 96 115
134
153
172
191
210
229
248
267
286
305
324
343
362
381
400
419
438
457
476
495
514
533
552
571
590
609
628
647
666
685
704
723
742
761
780
799
818
837
856
875
894
913
932
951
970
989
1008
1027
1046
1065
1084
1103
1122
1141
1160
1179
1198
1217
1236
1255
1274
1293
1312
1331
1350
1369
1388
1407
0
1000
2000
3000
4000
5000
6000
7000
12
03
95
87
79
61
15
13
41
53
17
21
91
21
02
29
24
82
67
28
63
05
32
43
43
36
23
81
40
04
19
43
84
57
47
64
95
51
45
33
55
25
71
59
06
09
62
86
47
66
66
85
70
47
23
74
27
61
78
07
99
81
88
37
85
68
75
89
49
13
93
29
51
97
09
89
10
08
10
27
10
46
10
65
10
84
11
03
11
22
11
41
11
60
11
79
11
98
12
17
12
36
12
55
12
74
12
93
13
12
13
31
13
50
13
69
13
88
14
07
0
10
20
30
40
50
60
70
80
1 20 39 58 77 96 115
134
153
172
191
210
229
248
267
286
305
324
343
362
381
400
419
438
457
476
495
514
533
552
571
590
609
628
647
666
685
704
723
742
761
780
799
818
837
856
875
894
913
932
951
970
989
1008
1027
1046
1065
1084
1103
1122
1141
1160
1179
1198
1217
1236
1255
1274
1293
1312
1331
1350
1369
1388
1407
Cam - T Cam - H Cpm - T Cpm - H
1h
1h
1h
2h
2h
2h
3h
3h
3h
6000
60
6000
2000
20
2000
4000
40
4000
0
0
0
1. Window cleaner / Device-OFF
VOCs (1)
CO2 (1)
%H (1)
%H (2)
T (1)
T (2)
VOCs (2)
CO2 (2)
154 155

3. Window cleaner / Device-ON-Solar
0
1000
2000
3000
4000
5000
6000
7000
8000
1 20 39 58 77 96 115
134
153
172
191
210
229
248
267
286
305
324
343
362
381
400
419
438
457
476
495
514
533
552
571
590
609
628
647
666
685
704
723
742
761
780
799
818
837
856
875
894
913
932
951
970
989
1008
1027
1046
1065
1084
1103
1122
1141
1160
1179
1198
1217
1236
1255
1274
1293
1312
1331
1350
1369
1388
1407
Bam - VOCs Bpm - VOCs
1h 2h 3h
0
10
20
30
40
50
60
70
1 20 39 58 77 96 115
134
153
172
191
210
229
248
267
286
305
324
343
362
381
400
419
438
457
476
495
514
533
552
571
590
609
628
647
666
685
704
723
742
761
780
799
818
837
856
875
894
913
932
951
970
989
1008
1027
1046
1065
1084
1103
1122
1141
1160
1179
1198
1217
1236
1255
1274
1293
1312
1331
1350
1369
1388
1407
Bam - T Bam - H Bpm - T Bpm - H
0
1000
2000
3000
4000
5000
6000
1 20 39 58 77 96 115
134
153
172
191
210
229
248
267
286
305
324
343
362
381
400
419
438
457
476
495
514
533
552
571
590
609
628
647
666
685
704
723
742
761
780
799
818
837
856
875
894
913
932
951
970
989
1008
1027
1046
1065
1084
1103
1122
1141
1160
1179
1198
1217
1236
1255
1274
1293
1312
1331
1350
1369
1388
1407
Bam - CO2 Bpm - CO2
1h
1h
1h
2h
2h
2h
3h
3h
3h
VOCs (1)
CO2 (1)
%H (1)
%H (2)
T (1)
T (2)
VOCs (2)
CO2 (2)
6000
60
6000
8000
2000
20
2000
4000
40
4000
0
0
0
0
1000
2000
3000
4000
5000
6000
7000
1 20 39 58 77 96 115
134
153
172
191
210
229
248
267
286
305
324
343
362
381
400
419
438
457
476
495
514
533
552
571
590
609
628
647
666
685
704
723
742
761
780
799
818
837
856
875
894
913
932
951
970
989
1008
1027
1046
1065
1084
1103
1122
1141
1160
1179
1198
1217
1236
1255
1274
1293
1312
1331
1350
1369
1388
1407
0
500
1000
1500
2000
2500
3000
3500
4000
4500
5000
1 20 39 58 77 96 115
134
153
172
191
210
229
248
267
286
305
324
343
362
381
400
419
438
457
476
495
514
533
552
571
590
609
628
647
666
685
704
723
742
761
780
799
818
837
856
875
894
913
932
951
970
989
1008
1027
1046
1065
1084
1103
1122
1141
1160
1179
1198
1217
1236
1255
1274
1293
1312
1331
1350
1369
1388
1407
0
10
20
30
40
50
60
70
80
90
1 19 37 55 73 91 109
127
145
163
181
199
217
235
253
271
289
307
325
343
361
379
397
415
433
451
469
487
505
523
541
559
577
595
613
631
649
667
685
703
721
739
757
775
793
811
829
847
865
883
901
919
937
955
973
991
1009
1027
1045
1063
1081
1099
1117
1135
1153
1171
1189
1207
1225
1243
1261
1279
1297
1315
1333
1351
1369
1387
1405
1423
Aam - T Apm - H Apm - T Apm - H
6000
VOCs (1)
CO2 (1)
%H (1)
%H (2)
T (1)
T (2)
VOCs (2)
CO2 (2)
2000
4000
0
0
2000
20
1000
0
3000
40
4000
60
5000
80
2. Window cleaner / Device-ON-Cable
156 157

The comparison between the obtained graphs is the most important part of this test, as it can lead to knowing the air quality differences between the device turned off, turned on 1 minute each 5 minutes and turned on constantly. The graphs are plotted together in the following page.
VOCs: When comparing the VOCs results, there is no purifying effect that can be observed. One of the measurements (both with ON-Solar and ON-Cable) shows lower levels than the Device-OFF levels, but the other measurement shows higher levels. Therefore, given the inconsistency of the results, no clear conclusion can be taken.
CO2: In this case, it can be observed how the CO2 levels are reduced in the ON-Solar and ON-Cable. In both cases, the CO2 levels are reduced at a higher speed than when the device is turned off. The values performed by each ON-option are similar. However, the data amount is small and more data would be needed to confirm the results.
Relative Humidity (%H): With regards to the humidity, it seems that there is a positive influence when using ON-Cable (between +0% and +6%) and ON-Solar (between (+3% and +7%) respect to the device off. However, as said before, the amount of data is too small to confirm any results. On the other hand, there is an influence of the outdoors humidity, which can lead to misleading results.
Temperature (T): There are no observed effects about the temperature.
0
1000
2000
3000
4000
5000
6000
7000
8000
1 20 39 58 77 96 115
134
153
172
191
210
229
248
267
286
305
324
343
362
381
400
419
438
457
476
495
514
533
552
571
590
609
628
647
666
685
704
723
742
761
780
799
818
837
856
875
894
913
932
951
970
989
1008
1027
1046
1065
1084
1103
1122
1141
1160
1179
1198
1217
1236
1255
1274
1293
1312
1331
1350
1369
1388
1407
Aam - VOCs Apm - VOCs Bam - VOCs Bpm - VOCs Cam - VOCs Cpm - VOCs
0
1000
2000
3000
4000
5000
6000
7000
1 20 39 58 77 96 115
134
153
172
191
210
229
248
267
286
305
324
343
362
381
400
419
438
457
476
495
514
533
552
571
590
609
628
647
666
685
704
723
742
761
780
799
818
837
856
875
894
913
932
951
970
989
1008
1027
1046
1065
1084
1103
1122
1141
1160
1179
1198
1217
1236
1255
1274
1293
1312
1331
1350
1369
1388
1407
Aam - CO2 Apm - CO2 Bam - CO2 Bpm - CO2 Cam - CO2 Cpm - CO2
0
10
20
30
40
50
60
70
80
90
1 20 39 58 77 96 115
134
153
172
191
210
229
248
267
286
305
324
343
362
381
400
419
438
457
476
495
514
533
552
571
590
609
628
647
666
685
704
723
742
761
780
799
818
837
856
875
894
913
932
951
970
989
1008
1027
1046
1065
1084
1103
1122
1141
1160
1179
1198
1217
1236
1255
1274
1293
1312
1331
1350
1369
1388
1407
Apm - H Apm - H Bam - H Bpm - H Cam - H Cpm - H
Window cleaner. Comparison between the three device’s modalities
1h
1h
1h
2h
2h
2h
3h
3h
3h
6000
70
6000
8000
2000
50
2000
4000
90
4000
0
30
0
VOCs_ON-Cable (1,2)
CO2 _ON-Cable(1,2)
%H_ON-Cable (1,2)
VOCs_ON-Solar (1,2)
CO2_ON-Solar (1,2)
%H_ON-Solar (1,2)
VOCs_OFF (1,2)
Device-OFF Device-ON-Cable Device-ON-Solar
CO2_OFF (1,2)
%H_OFF (1,2)
158 159

0
10
20
30
40
50
60
70
80
11
22
33
44
55
66
77
88
91
00
11
11
22
13
31
44
15
51
66
17
71
88
19
92
10
22
12
32
24
32
54
26
52
76
28
72
98
30
93
20
33
13
42
35
33
64
37
53
86
39
74
08
41
94
30
44
14
52
46
34
74
48
54
96
50
75
18
52
95
40
55
15
62
57
35
84
59
56
06
61
76
28
63
96
50
66
16
72
68
36
94
70
57
16
72
77
38
74
97
60
77
17
82
79
38
04
81
58
26
83
78
48
85
98
70
88
18
92
90
39
14
92
59
36
94
79
58
96
99
80
99
11
00
21
01
31
02
41
03
51
04
61
05
71
06
81
07
9
Chart Title
H - 1.1 H - 1.2 H - 1.3 H - 1.4 H - 1.5 H - 1.6
0
1000
2000
3000
4000
5000
6000
1 8 15 22 29 36 43 50 57 64 71 78 85 92 99 106
113
120
127
134
141
148
155
162
169
176
183
190
197
204
211
218
225
232
239
246
253
260
267
274
281
288
295
302
309
316
323
330
337
344
351
358
365
372
379
386
393
400
407
414
421
428
435
442
449
456
463
470
477
484
491
498
505
512
519
526
533
540
547
554
561
568
575
582
589
596
603
610
617
624
631
638
645
652
659
666
673
680
687
694
701
708
715
722
729
736
743
750
757
764
771
778
785
792
799
806
813
820
827
834
841
848
855
862
869
876
883
890
897
904
911
918
925
932
939
946
953
960
967
974
981
988
995
1002
1009
1016
1023
1030
1037
1044
1051
1058
1065
1072
1079
1086
CO2 - 1.1 CO2 - 1.2 CO2 - 1.3 CO2 - 1.4 CO2 - 1.5 CO2 - 1.6
0
2000
4000
6000
8000
10000
12000
14000
16000
18000
1 8 15 22 29 36 43 50 57 64 71 78 85 92 99 106
113
120
127
134
141
148
155
162
169
176
183
190
197
204
211
218
225
232
239
246
253
260
267
274
281
288
295
302
309
316
323
330
337
344
351
358
365
372
379
386
393
400
407
414
421
428
435
442
449
456
463
470
477
484
491
498
505
512
519
526
533
540
547
554
561
568
575
582
589
596
603
610
617
624
631
638
645
652
659
666
673
680
687
694
701
708
715
722
729
736
743
750
757
764
771
778
785
792
799
806
813
820
827
834
841
848
855
862
869
876
883
890
897
904
911
918
925
932
939
946
953
960
967
974
981
988
995
1002
1009
1016
1023
1030
1037
1044
1051
1058
1065
1072
1079
1086
VOCs - 1.1 VOCs - 1.2 VOCs - 1.3 VOCs - 1.4 VOCs - 1.5 VOCs - 1.6
Test 3: Incense as main contamination source
The results of this test are displayed in the pages 161-163, again differentiated in VOCs, CO2 and H for each of the three modalities. Given the results from test 2, Temperature values were not taken into account.
With respect to the VOCs and CO2 level, the line follows a similar but different behaviour than the one resulting from the window cleaner experiments. In this case, it slowly reaches the highest values after the first hour, to then constantly decrease during the following two hours. It is important to remark that in this test, the periodical falls seen before in the Device-ON-Solar are not present anymore.
Regarding the Relative Humidity levels, the first values shown are high due to the influence of the outdoors humidity, but the line quickly decreases and stabilizes around one value. In this case, the periodic peaks effect can be appreciated in th Device-ON-Solar (see figure 71).
1h
1h
1h
2h
2h
2h
6000
60
12000
16000
2000
50
4000
4000
8000
0
0
1. Incense / Device-OFF
VOCs (1-6)
CO2 (1-6)
%H (1-6)
1´ 5´
%H_ON-Solar (1-5)
Figure 71. Periodical raises in the %H (1-5) values
160 161

0
10
20
30
40
50
60
70
80
1 91
72
53
34
14
95
76
57
38
18
99
71
05
11
31
21
12
91
37
14
51
53
16
11
69
17
71
85
19
32
01
20
92
17
22
52
33
24
12
49
25
72
65
27
32
81
28
92
97
30
53
13
32
13
29
33
73
45
35
33
61
36
93
77
38
53
93
40
14
09
41
74
25
43
34
41
44
94
57
46
54
73
48
14
89
49
75
05
51
35
21
52
95
37
54
55
53
56
15
69
57
75
85
59
36
01
60
96
17
62
56
33
64
16
49
65
76
65
67
36
81
68
96
97
70
57
13
72
17
29
73
77
45
75
37
61
76
97
77
78
57
93
80
18
09
81
78
25
83
38
41
84
98
57
86
58
73
88
18
89
89
79
05
91
39
21
92
99
37
94
59
53
96
19
69
97
79
85
99
31
00
11
00
91
01
71
02
51
03
31
04
11
04
91
05
71
06
51
07
31
08
11
08
9
1:5 - H
H - 2.1 H - 2.2 H - 2.3 H - 2.4 H - 2.5
0
5000
10000
15000
20000
25000
30000
1 11 21 31 41 51 61 71 81 91 101
111
121
131
141
151
161
171
181
191
201
211
221
231
241
251
261
271
281
291
301
311
321
331
341
351
361
371
381
391
401
411
421
431
441
451
461
471
481
491
501
511
521
531
541
551
561
571
581
591
601
611
621
631
641
651
661
671
681
691
701
711
721
731
741
751
761
771
781
791
801
811
821
831
841
851
861
871
881
891
901
911
921
931
941
951
961
971
981
991
1001
1011
1021
1031
1041
1051
1061
1071
1081
1091
-
VOCs - 2.1 VOCs - 2.2 VOCs - 2.3 VOCs - 2.4 VOCs - 2.5 VOCs - 2.1 VOCs - 2.2 VOCs - 2.3 VOCs - 2.4 VOCs - 2.5
0
1000
2000
3000
4000
5000
6000
7000
1 9 17 25 33 41 49 57 65 73 81 89 97 105
113
121
129
137
145
153
161
169
177
185
193
201
209
217
225
233
241
249
257
265
273
281
289
297
305
313
321
329
337
345
353
361
369
377
385
393
401
409
417
425
433
441
449
457
465
473
481
489
497
505
513
521
529
537
545
553
561
569
577
585
593
601
609
617
625
633
641
649
657
665
673
681
689
697
705
713
721
729
737
745
753
761
769
777
785
793
801
809
817
825
833
841
849
857
865
873
881
889
897
905
913
921
929
937
945
953
961
969
977
985
993
1001
1009
1017
1025
1033
1041
1049
1057
1065
1073
1081
1089
CO2 - 2.1 CO2 - 2.2 CO2 - 2.3 CO2 - 2.4 CO2 - 2.5
40
50
60
70
0
2000
4000
6000
8000
10000
12000
14000
16000
18000
20000
1 13 25 37 49 61 73 85 97 109 121 133 145 157 169 181 193 205 217 229 241 253 265 277 289 301 313 325 337 349 361 373 385 397 409 421 433 445 457 469 481 493 505 517 529 541 553 565 577 589 601 613 625 637 649 661 673 685 697 709 721 733 745 757 769 781 793 805 817 829 841 853 865 877 889 901 913 925 937 949 961 973 985 997 1009
1021
1033
1045
1057
1069
1081
1093
VOCs - 3.1 VOCs - 3.2 VOCs - 3.3 VOCs - 3.4
0
1000
2000
3000
4000
5000
6000
7000
1 9 17 25 33 41 49 57 65 73 81 89 97 105
113
121
129
137
145
153
161
169
177
185
193
201
209
217
225
233
241
249
257
265
273
281
289
297
305
313
321
329
337
345
353
361
369
377
385
393
401
409
417
425
433
441
449
457
465
473
481
489
497
505
513
521
529
537
545
553
561
569
577
585
593
601
609
617
625
633
641
649
657
665
673
681
689
697
705
713
721
729
737
745
753
761
769
777
785
793
801
809
817
825
833
841
849
857
865
873
881
889
897
905
913
921
929
937
945
953
961
969
977
985
993
1001
1009
1017
1025
1033
1041
1049
1057
1065
1073
1081
1089
CO2 - 3.1 CO2 - 3.2 CO2 - 3.3 CO2 - 3.4
VOCs (1-4)
CO2 (1-4)
%H (1-4)
4000
8000
12000
16000
20000
0
0
2000
4000
60
6000
50
2. Incense / Device-ON-Cable
1h
1h
1h
2h
2h
2h
10000
20000
30000
0
0
2000
4000
60
6000
50
1h
1h
1h
2h
2h
2h
3. Incense / Device-ON-Solar
VOCs (1-5)
%H (1-5)
CO2 (1-5)
162 163

0
1000
2000
3000
4000
5000
6000
7000
8000
9000
0246 81 01 21 41 6
0
500
1000
1500
2000
2500
3000
3500
4000
0246 81 01 21 41 6
0
10
20
30
40
50
60
70
80
90
02468 10 12 14 16
As in the previous test, the important part of this experiment lays on the comparison between the performance of each modality. In order to make it less busy, it is only plotted the value (VOCs, CO2 or %H) that was sensed when t=3h. In other words, it is only shown how clean/humid the environment was after having 3 hours of the device running.
VOCs and CO2: There is no effect that can be appreciated regarding VOCs and CO2 removal. The values from Device-ON are similar to Device-OFF, meaning that there is no influence. However, the values are also not similar inside each modality. It can be observed in the graphs how different are the results for the same action happening (e.g. VOCs_OFF_n5 = 4425 and VOCs_OFF_n6 = 8111). With this unstable setup, the results can be misleading, and thus no conclusions should be taken from this test.
Relative Humidity: Regarding the humidity, a positive effect can be observed, similar to the one achieved during the previous test. The final relative humidity achieved with the Device-ON-Cable with respect to the Device-OFF varies from 0% to +3%, while the increase that Device-ON-Solar shows goes from 3% to +7,6%. As commented in the previous test, these results are also affected by the humidity from outdoors, which was not always the same.
6.2.4. Discussion
About the results
The goals that were intended to achieve with this test were: getting an idea of the product’s performance about improving air quality; and
finding the difference between the performance of a solar powered model with respect to a powered by cable one.
With the obtained results, it cannot be concluded about any of these research questions. The results about possible VOCs and CO2 removal are inconsistent, and show that the test setup was not ideal for such research questions.To get more reliable data, a more stable setup is needed (to avoid different results for the same scenario) together with a greater amount of samples.
On the other hand, the periodic falls effect observed in one of the test 2 measurements suggest that the purifier is having a positive effect, as the contamination values decrease when the purifier is working and increase when it’s not working. However, in case of this positive effect to be real, is the case of a small effect, since if the effect was big, it would have been reflected in the results.
Regarding the humidity, the results suggest that the device is able to increase the relative humidity of the room approximately from 50% to 55%. These data are not precise, as they are influenced by the outdoors humidity, but they reveal that a humidification effect exists. When the effects achieved by the Device-ON-Solar and the Device_ON-Cable are compared, any noticeable differences can be observed.
In summary:
- A big effect of the purifier in removing contaminants (CO2 and VOCs) can be discarded.
- The purifier probably has a small effect in removing contaminants (CO2 and VOCs).
- The purifier is able to raise the relative humidity from 50% to 55%, without noticeable differences between the solar and the cable options.
Incense. Comparison between the three device’s modalities
6000
3000
80
8000
4000
2000
1000
40
4000
2000
60
0
0
20
Device-OFFvalue after 3h
VOCs_OFF (1-6)
CO2_OFF (1-6)
%H_OFF (1-6)
VOCs_ON-Cable (1-4)
CO2_ON-Cable (1-4)
%H_ON-Cable (1-4)
VOCs_ON-Solar (1-5)
CO2_ON-Solar (1-5)
%H_ON-Solar (1-5)
Device-OFFvalue t=0
Device-ON-Cablevalue after 3h
Device-ON-Cablevalue t=0
Device-ON-Solarvalue after 3h
Device-ON-Solarvalue t=0
164 165

- There is no influence in the temperature
About the future testing
Considering the future development of the project, there are two interesting tests to carry out:
First, a continuous performance test should be done by the hand of the design process, informing design decisions with data and comparisons of different possibilities. For instance, the comparative carried out in this project about between solar power and cable power, types of substrates, types of plants, fan speed, etc… For this test, it is crucial to have a setup where a fixed contamination level can be achieved, that doesn’t vary from one sample to another. Regarding the sensors, the test should include a particulate matter sensor as well.
On the other hand, it would be interesting to know the effect that the device has in a real environment, out of the laboratory, such as a house or an office. With this information, the question formulated by the user “how and how much can this device improve my space?” could be answered with real data. Given that these scenarios are very variable (in terms of contamination types, amount, etc…), this test would require a great amount of samples (months) to be able to bring averages that can be used to do fair comparisons about the device’s performance.
166 167

Conclusions

From the research done
- The target group interested in portable active botanical biofilters responds to: Western European; living in big cities and >30 years old (with a stable house and a stable job).
- Main reasons driving the interest in the product: worried about the bad air quality effects on employers/clients; worried about contamination; healthy home atmosphere; kids health and attraction towards the idea of optimizing home plants.
- The product functionalities that the target group prefers are: advanced air quality system; water tank including a level indicator; solar powered device/powered by cable and no monitoring functionalities / display T&H.
- The price that the target group is willing to pay: average of 142 €.
- The look&feel desired by the target group is: look like a normal potted plant but doing something extra; minimalistic, subtle, neutral, timeless, functional and natural; and white ceramic together with wood the materials to be used.
- With the currently available technology, the combination ‘outdoor solar cells’ + ‘product to be placed next to a window’ requires approximately 10 times less solar panels surface than the needed for the combination ‘indoor solar cells + product receiving artificial light’.
From the prototype built
- For the selected product dimensions, an energy-storing middle step between the solar panels and the fan is required. The best found solution for this element consists of a capacitor combined with a transistors circuit.
- A preliminary analysis of manufacturing and production cost suggests that the product will have a production cost of 43,72 €.
From the design evaluation
- It should be considered to include a stand with the purchase of the product.
- Clear and reliable tests about the product’s performance should be accompanying the product at the selling place, with the intention of strengthening the air quality face of the product and to clarify in which scenarios the product will have effect.
- Results from the performance test carried out point that the prototype don’t have a big effect in contaminants removal; may have little effect in contaminants removal; have a positive effect in increasing the relative humidity (from 50% to 55%); and it has no effect on temperature.
Recommendations for further development
- Redesign the product components so the production cost is reduced, as 43,72 € is a high price that will probably exceed the 142 € that user is willing to pay.
- Redesign the way the solar panels are integrated in the design, trying to make it look more natural
- Explore the option of placing the solar panels at the back of the main pot, being hidden from sight and only oriented to get light from the window.
- For future performance tests, use a professional setup where the contamination, humidity, temperature, etc… can be kept at specific levels.
170 171

References

/ N E Klepeis, W C Nelson, W R Ott, J P Robinson, A M Tsang, P Switzer, J V Behar, S C Hern, W H Engelmann. (2001). The National Human Activity Pattern Survey (NHAPS): a resource for assessing exposure to environmental pollutants.
/ WHO. (2010). Guidelines for indoor air quality: selected pollutants.
/ MRC Institute for Environment and Health. (1999). IEH report on the benzene in the environment.
/ Dodson RE et al. (2008) Influence of basement, garages and common hallways on indoor residential volatile organic compound concentrations. Atmospheric Environment, 42:1569–1581.
/ Ilgen E et al. (2001). Aromatic hydrocarbons in the atmospheric environment. Part II: univariate and multivariate analysis and case studies of indoor concentrations. Atmospheric Environment, 35:1253–1264.
/ Chuang JC et al. (1991) Polycyclic aromatic-hydrocarbons and their derivatives in indoor and outdoor air in an 8-home study. Atmospheric Environment, Part B, Urban Atmosphere, 25:369–380.
/ EPA. Retrieved on 12th October, 2020 from https://www.epa.gov/indoor-air-quality-iaq/carbon-monoxides-impact-indoor-air-quality
/ EPA. Retrieved on 12th October, 2020 from https://www.epa.gov/indoor-air-quality-iaq/nitrogen-dioxides-impact-indoor-air-quality
/ EPA. Retrieved on 12th October, 2020 from https://www.epa.gov/indoor-air-quality-iaq/indoor-particulate-matter#Health_Effects
/ Goodman NB, Steinemann A, Wheeler AJ, Paevere PJ, Cheng M, Brown SK. (2017). Volatile organic compounds within indoor environments in Australia. Build Environ 122:116–125
indoor air biofilter system for the atmospheric particle removal.
/ Thomas Pettit, Peter J.Irga, Fraser R. Torpy. (2020). The botanical biofiltration of elevated air pollution concentrations associated the Black Summer wildfire natural disaster / EPA. (2018). Guide to air cleaners in the home.
/ Fernandez-Cañero, R., Urrestarazu, L,P., Franco Salas, A. (2012). Assessment of the cooling potential of an indoor living wall using different substrates in a warm climate.
/ Lohr, VI, Pearson-Mims, CH, Goodwin, GK. (1996). Interior plants may improve worker productivity and reduce stress in a windowless environment.
/ Shoemaker, C. A., Randall, K., Relf, P. D., Geller, E. (1992). Relationships between plants, behavior, and attitudes in an office environment.
/ UX Collective. (2016). Revamped Double Diamond scheme.
/ Ahu Aydogan, Lupita D. Montoya. (2011). Formaldehyde removal by common indoor plant species and various growing media.
/ Alan B. Darlington, James F. Dat, Michael A. Dixon. (2001).The Biofiltration of Indoor Air: Air Flux and Temperature Influences the Removal of Toluene, Ethylbenzene, and Xylene / P.J. Irga, N.J. Paull, P. Abdo, F.R. Torpy. (2017). An assessment of the atmospheric particle removal efficiency of an in-room botanical biofilter system.
/ Fraser R. Torpy, Peter J.Irga, Dov Moldovan, J. Tarran (2013). Characterization and Biostimulation of benzene biodegradation in the potting-mix of indoor plants.
/ B.C. Wolverton, Anne Jonson, Keith Bounds.
Potter, I.N. (1988). BSRIA.Technical Note 4/88.
/ Yin SN et al.(1996). A cohort study of cancer among benzene-exposed workers in China: overall results. American Journal of Medicine, 29:227–235.
/ International Agency for Research on Cancer. (2006). :39–325 (IARC Monographs on the Evaluation of the Carcinogenic Risk of Chemicals to Humans, Vol. 88).
/ Miller RL et al. (2004). Polycyclic aromatic hydrocarbons, environmental tobacco smoke, and respiratory symptoms in an inner-city birth cohort. Chest, 126:1071–1078
/ EPA. Retrieved on 15th October, 2020 from https://www.epa.gov/indoor-air-quality-iaq/indoor-particulate-matter#indoor_pm
/ EPA. Retrieved on 15th October, 2020 from
/ EPA. Retrieved on 9th September, 2020 from https://www.epa.gov/indoor-air-quality-iaq/improving-indoor-air-quality
/ Gabriela Soreanu, Michael Dixon, Alan Darlington. (2013). Botanical biofiltration of indoor gaseous pollutants - A mini-review.
/ Nedlaw Living Walls (2004). 18m tall - green wall installed at the University of Guelph-Humber, Canada. Picture retrieved from http://nedlawlivingwalls.com/projects/ on 14th October, 2020.
/ Zhiqiang Wang, Jensen S. Zhang. (2010). Characterization and performance evaluation of a full-scale activated carbon-based dynamic botanical air filtration system for improving indoor air quality.
/ Izdihar Zahirah Ibrahim, Wen-Tong Chong, and Sumiani Yusoff. (2018). The design of the botanical
(1989). Interior landscape plants for indoor air pollution abatement. NASA.
/ Power Film Solar. (2018). Outdoor vs Indoor solar: the key differences
/ Unifore. Retrieved on 1st of November, 2020 from https://www.unifore.net/analog-surveillance/security-camera-illumination-and-artificial-lighting.html
/ Mathieu Mainville, Mario Leclerc. (2020). Recent Progress on Indoor Organic Photovoltaics: From Molecular Design to Production Scale
/ Nanfu Yan, Chaowei Zhao, Shengyoung You, Yuefeng Zhang. (2020). Recent progress of thin-film photovoltaics for indoor application
/ Kickstarter. Retrieved on 22nd of November, 2020 from https://www.kickstarter.com/projects/breth/brethtm-the-next-generation-air-purifier
/ Kickstarter. Retrieved on 22nd of November, 2020 from https://www.kickstarter.com/projects/vitesy/natede-the-most-amazing-smart-natural-air-purifier
/ Plusjop. Retrieved on 23rd of November, 2020 from https://www.plusjop.nl/winkelmand/
/ Alibaba. Retrieved on 23rd of November, 2020 from https: / /www.al ibaba.com/product -deta i l /Bulk-benzene-adsorption-activated-carbon-for_62204448213.html?spm=a2700.7724857.discountZoneStyleB_top.3.20fc6761xZXXcK
/ Grind-Split. Retrieved on 23rd of November, 2020 from https: / /www.gr ind-sp l i t .n l /gr ind-sp l i t / lava k o r r e l ? g c l i d = C j w K C A i A t e j 9 B R Av E i w A0 U AW X j a b C _ - Q d O S k c R y S j n t n v V E E O 2 -
174 175

RmptXvi0yn5kGpclx2HS_fc4tAxoCxNwQAvD_BwE
/ Alibaba. Retrieved on 23rd of November, 2020 from https: / /www.al ibaba.com/product -deta i l /Ch ina-suppl ier- lowest -pr ice-customized-Water_1600135342943.html?spm=a2700.g a l l e r y o f f e r l i s t . n o r m a l _ o f f e r . d _ t i t l e .b61f4b23J0EKP8
/ Alibaba. Retrieved on 23rd of November, 2020 from https: / /www.al ibaba.com/product -deta i l /R u b b e r - B a n d - R u b b e r - B a n d - D u r a b l e -E last ic_62456304323.html?spm=a2700.g a l l e r y o f f e r l i s t . n o r m a l _ o f f e r . d _title.22167082mVNEul&s=p
/ Alibaba. Retrieved on 23rd of November, 2020 from https: / /www.al ibaba.com/product -deta i l /Ring-Seal-Ring-Seal-Ring-O_1600109635779.html?spm=a2700.galleryofferlist.normal_offer.d_title.7df775f6lWyUkF&s=p
/ Alibaba. Retrieved on 23rd of November, 2020 from https://www.alibaba.com/product-detail/40mm-Fan-4010-Fan-40x40-40mm_62213561086.html?spm=a2700.ga l le ryof fer l is t . topad_creative.d_title.31335b52MUH2CO
/ Alibaba. Retrieved on 23rd of November, 2020 from https: / /www.al ibaba.com/product -deta i l /super-capaci tor-5-5v-1f - for_1746332932.html?spm=a2700.gal leryoffer l ist .normal_offer.3.6fd7165a3SkuuZ
/ Alibaba. Retrieved on 23rd of November, 2020 from https: / /www.al ibaba.com/product -deta i l /Transistor-Transistor-Bc547b-Manufacturer-T r a n s i s t o r - T O 9 2 _ 6 0 7 8 6 6 5 5 2 3 3 .
Bolts-9-Degree-Zinc-Plating_62296478413.html?spm=a2700.galleryofferlist.normal_offer.d_image.78d665a1YOFikN
/ Alibaba. Retrieved on 23rd of November, 2020 from https: / /www.al ibaba.com/product -deta i l /S o l i d - W o o d - H o u s e h o l d - F r u i t s - C a k e -P l a t e _ 6 2 2 5 8 6 8 8 6 5 2 . h t m l ? s p m = a 2 7 0 0 .g a l l e r y o f f e r l i s t . n o r m a l _ o f f e r . d _title.3c17587clnY7rV
/ Alibaba. Retrieved on 23rd of November, 2020 from https://www.alibaba.com/product-detail/2019-Ins-New-Design-Cylinder-Home_62405947902.html?spm=a2700.galleryofferlist.normal_offer.d_title.47083f43aSG3QP
/ Alibaba. Retrieved on 23rd of November, 2020 from https: / /www.al ibaba.com/product -deta i l /I n j e c t i o n - M o l d i n g - C u s t o m i z e d - P l a s t i c -I n j e c t i o n - M o l d i n g _ 1 6 0 0 1 5 0 6 8 9 1 8 3 .h t m l ? s p m = a 2 7 0 0 . 7 7 2 4 8 5 7 .normalList.11.1f0d5d60QuNVgE&s=p
/ Alibaba. Retrieved on 23rd of November, 2020 from https: / /www.al ibaba.com/product -deta i l /I n j e c t i o n - M o l d i n g - C u s t o m i z e d - P l a s t i c -I n j e c t i o n - M o l d i n g _ 1 6 0 0 1 5 0 6 8 9 1 8 3 .h t m l ? s p m = a 2 7 0 0 . 7 7 2 4 8 5 7 .normalList.11.1f0d5d60QuNVgE&s=p
/ Alibaba. Retrieved on 23rd of November, 2020 from https: / /www.al ibaba.com/product -deta i l /I n j e c t i o n - M o l d i n g - C u s t o m i z e d - P l a s t i c -I n j e c t i o n - M o l d i n g _ 1 6 0 0 1 5 0 6 8 9 1 8 3 .h t m l ? s p m = a 2 7 0 0 . 7 7 2 4 8 5 7 .normalList.11.1f0d5d60QuNVgE&s=p
/ Alibaba. Retrieved on 23rd of November, 2020
html?spm=a2700.ga l le ryof fer l is t . topad_creative.3.3db03b56nhHY9M
/ Alibaba. Retrieved on 23rd of November, 2020 from https: / /www.al ibaba.com/product -deta i l /R e s i s t o r - R e s i s t o r - M a t e f o r d - E x c e l l e n t -S t a b i l i t y - M e t a l _ 1 7 0 0 0 0 2 8 8 2 4 9 1 .html?spm=a2700.gal leryoffer l ist .normal_offer.3.757d114bojnc9x&s=p
/ Alibaba. Retrieved on 23rd of November, 2020 from https: / /www.al ibaba.com/product -deta i l /P c b - B o a r d - C h i n a - P c b - M a n u f a c t u r e r -Customized_1600137093901.html?spm=a2700.g a l l e r y o f f e r l i s t . n o r m a l _ o f f e r . d _title.1d98690bxtwUjv&s=p
/ Alibaba. Retrieved on 23rd of November, 2020 from h t t p s : / / w w w . a l i b a b a . c o m / p r o d u c t -d e t a i l / C u s t o m - m a d e - s m a l l - s i z e - 5 v -1 w _ 6 0 5 3 5 5 2 4 7 4 6 . h t m l ? s p m = a 2 7 0 0 .themePage.5238101001031.9.755f233dcqc1wT
/ Alibaba. Retrieved on 23rd of November, 2020 from https: / /www.al ibaba.com/product -deta i l /M3-Screws-M3-M4-M5-M6_62428313078.html?spm=a2700.galleryofferlist.normal_offer.d_title.2d33eec1FyV2eP&s=p
/ Alibaba. Retrieved on 23rd of November, 2020 from https: / /www.al ibaba.com/product -deta i l /Cabinet-Unfinished-Wood-dinning-Carved-s o f a _ 6 0 7 8 2 3 7 7 4 5 4 . h t m l ? s p m = a 2 7 0 0 .g a l l e r y o f f e r l i s t . n o r m a l _ o f f e r . d _image.78d665a1YOFikN
/ Alibaba. Retrieved on 23rd of November, 2020 from https://www.alibaba.com/product-detail/M8-
from https: / /www.al ibaba.com/product -deta i l /I n j e c t i o n - M o l d i n g - C u s t o m i z e d - P l a s t i c -I n j e c t i o n - M o l d i n g _ 1 6 0 0 1 5 0 6 8 9 1 8 3 .h t m l ? s p m = a 2 7 0 0 . 7 7 2 4 8 5 7 .normalList.11.1f0d5d60QuNVgE&s=p
/ Alibaba. Retrieved on 23rd of November, 2020 from https: / /www.al ibaba.com/product -deta i l /I n j e c t i o n - M o l d i n g - C u s t o m i z e d - P l a s t i c -I n j e c t i o n - M o l d i n g _ 1 6 0 0 1 5 0 6 8 9 1 8 3 .h t m l ? s p m = a 2 7 0 0 . 7 7 2 4 8 5 7 .normalList.11.1f0d5d60QuNVgE&s=p
/ Vitesy. Retrieved on 3rd of December, 2020 from https://vitesy.com/natede/buy
176 177