DESIGN OF A HIGH TEMPERATURE EROSION APPARATUS …
74
DESIGN OF A HIGH TEMPERATURE EROSION APPARATUS FOR TESTING OF BOILER TUBES A THESIS SUBMITTED TO THE GRADUATE SCHOOL OF NATURAL AND APPLIED SCIENCES OF MIDDLE EAST TECHNICAL UNIVERSITY BY HÜSEYİN ERGÜN IN PARTIAL FULFILLMENT OF THE REQUIREMENTS FOR THE DEGREE OF MASTER OF SCIENCE IN METALLURGICAL AND MATERIALS ENGINEERING OCTOBER 2010
Transcript of DESIGN OF A HIGH TEMPERATURE EROSION APPARATUS …

DESIGN OF A HIGH TEMPERATURE EROSION APPARATUS FOR TESTING OF BOILER TUBES
A THESIS SUBMITTED TO THE GRADUATE SCHOOL OF NATURAL AND APPLIED SCIENCES
OF MIDDLE EAST TECHNICAL UNIVERSITY
BY
HÜSEYİN ERGÜN
IN PARTIAL FULFILLMENT OF THE REQUIREMENTS FOR
THE DEGREE OF MASTER OF SCIENCE IN
METALLURGICAL AND MATERIALS ENGINEERING
OCTOBER 2010

Approval of the thesis:
DESIGN OF A HIGH TEMPERATURE EROSION APPARATUS FOR TESTING OF BOILER TUBES
submitted by HÜSEYİN ERGÜN in partial fulfillment of the requirements for the degree of Master of Science in Metallurgical and Materials Engineering Department, Middle East Technical University by Prof. Dr. Canan Özgen _________________ Dean, Graduate School of Natural and Applied Sciences Prof. Dr. Tayfur Öztürk _________________ Head of Department, Metallurgical and Materials Eng. Prof. Dr. Tayfur Öztürk ________________ Supervisor, Metallurgical and Materials Eng. Dept., METU Prof. Dr. Mustafa Doruk ________________ Co-Supervisor, Metallurgical and Materials Eng. Dept., METU Examining Committee Members Prof. Dr. Tayfur Öztürk _________________ Metallurgical and Materials Eng. Dept., METU Prof. Dr. Mustafa Doruk ________________ Metallurgical and Materials Eng. Dept., METU Prof. Dr. Kadri Aydınol ________________ Metallurgical and Materials Eng. Dept., METU M.Sc. Nurettin Savruk ________________ Elektrik Üretim A.Ş. Genel Müdürlüğü M.Sc. Mücella Ersoy ________________ Türkiye Kömür İşletmeleri Kurumu Genel Müdürlüğü
Date: 16 /09/2010

iii
I hereby declare that all information in this document has been obtained and presented in accordance with academic rules and ethical conduct. I also declare that, as required by these rules and conduct, I have fully cited and referenced all material and results that are not original to this work.
Name, Last name: Hüseyin ERGÜN
Signature :

iv
ABSTRACT
DESIGN OF A HIGH TEMPERATURE EROSION APPARATUS FOR
TESTING OF BOILER TUBES
Ergün, Hüseyin
M.Sc., Department of Metallurgical and Materials Engineering
Supervisor: Prof. Dr. Tayfur Öztürk
Co-supervisor: Prof. Dr. Mustafa Doruk
October 2010, 58 pages
In this thesis an apparatus is designed which enables the testing of thermal power
plant boiler tubes against erosion. The apparatus makes use of a tube sample directly
cut from the boiler tubes and simulates conditions similar to those prevailing in
boilers in lignite fired power plants. The apparatus is composed of three components;
a furnace for heating the sample, a loading system which allows application of
tensile stresses while allowing the rotation of the sample, and a particle blower that
delivers abrasive particles to the surface of the sample. The abrasive material used in
the test is mixture of oxides, 90% of which is Al2O3 and the average particle size is
approximately 300 µm. The unit as designed would allow testing of boiler tubes up
to a temperature of 650oC, and particle velocity of up to 50 m/s. The apparatus as
tested at room temperatures for four identical samples have yielded very similar
erosion values based on measurement of weight loss. At elevated temperature,
erosion could be measured by a thickness loss since the oxidation that occurs
complicates the erosion measurement. Two economizer material; P235GH and

v
16Mo3 were tested at 500oC with particle velocity of 10 m/s. The testing has shown
that 16Mo3 has better performance than P235GH, the erosion rate differing by 20
percent.
Keywords: Boiler tubes, Erosion, Economizer, Thermal power plant

vi
ÖZ
TERMİK SANTRAL KAZAN BORULARININ TESTİ İÇİN BİR YÜKSEK
SICAKLIK AŞINMA TESTİ DÜZENEĞİ TASARIMI
Ergün, Hüseyin
Yüksek Lisans, Metalurji ve Malzeme Mühendisliği Bölümü
Tez Yöneticisi: Prof. Dr. Tayfur Öztürk
Ortak Tez Yöneticisi: Prof. Dr. Mustafa Doruk
Ekim 2010, 58 sayfa
Bu çalışmada termik santral kazan borularının aşınmaya karşı test edilebilmesine
olanak sağlayan bir deney düzeneği geliştirilmiştir. Düzenek kazan borularından
kesilmiş numuneleri kullanmakta ve linyitle çalışan termik santral kazan koşullarını
canlandırmaktadır. Cihaz numunenin dönmesini sağlarken aynı zamanda çekme
gerilimi uygulayan bir yükleme sistemi, numuneyi ısıtmak için bir fırın ve aşındırıcı
parçacıkları numune yüzeyine gönderen parçacık püskürtücü olmak üzere üç ana
kısımdan oluşmaktadır. Testlerde aşındırıcı parçacıklar olarak %90 oranında Al2O3
içeren ortalama parçacık boyutu 300µm mertebesinde bir oksit karışım kullanılmıştır.
Sistem en çok 650oC sıcaklığa ve 50 m/s parçacık hızlarına kadar test
yapılabilinmesine olanak sağlamaktadır. Düzenek dört aynı özellikte numune ile,
ağırlık kaybı ölçülmek sureti ile test edilmiş ve tekrarlanabilir sonuçlar verdiği ortaya
konmuştur. Yüksek sıcaklıklarda aşınma, oksitlenmenin ölçümleri zorlaştırması
nedeniyle kalınlık kaybı ile değerlendirilmiştir. Ekonomizer bölgesi için P235GH ve
16Mo3 malzemeleri 500oC de 10 m/s hızla test edilmiş yapılan test sonucunda

vii
16Mo3’ün P235GH’dan %20 aşınma hızı farkı ile daha iyi performans gösterdiğini
tespit edilmiştir.
Anahtar Kelimeler: Erozyon, Ekonomizer, Kazan boruları, Termik santral

viii
To my family and Öznur…

ix
ACKNOWLEDGEMENTS
I would like to express my deepest gratitude to my supervisor Prof. Dr. Tayfur
Öztürk, co-supervisor Prof. Dr. Mustafa Doruk and Prof. Dr. kadri Aydınol for their
guidance, criticism and continuous support throughout the course of this thesis.
I would like to thank Oğuz Özgören EÜAŞ, and to the employees of Çayırhan,
Çatalağzı, Yatağan, Kemerköy and Yeniköy thermal power plants for their help
during the collection of data on the boiler tube failures. I would also like to thank to
the personel of Metallurgical and Materials Department, Cengiz Tan, Yusuf
Yıldırım, Salih Türe, and Cemal Yanardağ for their help in the experimental part of
this study. I am grateful to Serkan Şenyurt and Erkan Köse both employee of Öz-San
AŞ where the test setup was constructed.
I wish to thank to design project group T7 of 2007 graduates who carried out the
preliminary design of the test setup. I am also grateful to my friend and colleague
Özgür Öztürk and also to Onur Rauf Bingöl, Sadık Bayramoğlu, Serdar Savaş and
Göksu Gürer for their support for various aspects of this work.
Financial support for this study was provided by DPT (BAP-03-08-DPT-
2007K120220) which I gratefully acknowledge.

x
TABLE OF CONTENTS
ABSTRACT ................................................................................................................ iv
ÖZ ............................................................................................................................... vi
ACKNOWLEDGEMENTS ........................................................................................ ix
TABLE OF CONTENTS ............................................................................................. x
LIST OF TABLES ..................................................................................................... xii
LIST OF FIGURES .................................................................................................. xiv
CHAPTERS
1. INTRODUCTION.................................................................................................... 1
2. LITERATURE REVIEW ........................................................................................ 3
2.1 Boiler in Coal Fired Power Plants .................................................................. 3
2.2 Boiler Tube Failures ....................................................................................... 8
2.2.1 Water-side Corrosion ................................................................................... 8
2.2.2 Deposit Formation and Fire-side Corrosion ................................................ 9
2.2.3 Overheating ................................................................................................ 11
2.2.4 Fatigue ....................................................................................................... 12
2.2.5 Erosion ....................................................................................................... 13
2.3 Fly Ash Erosion Failure.................................................................................... 14
2.4 Fly ash in lignite fired power plants ............................................................... 15
2.5 Factors Affecting Erosion Rate ........................................................................ 17
2.6 Test Setups for Erosion of Boiler Tubes .......................................................... 25

xi
3. EXPERIMENTAL SETUP .................................................................................... 32
3.1. Sample Loading System .................................................................................. 32
3.1.1 Selection of Spring .................................................................................... 35
3.1.2 Sample Preparation .................................................................................... 39
3.1.3 Electric Motors and Auxiliary Units of the Loading system ..................... 40
3.2 Heating System ................................................................................................. 41
3.3 Particle Blower system ..................................................................................... 43
3.4 Method of Experiments .................................................................................... 46
4. RESULTS AND DISSCUSSION .......................................................................... 48
4.1 Room Temperature Testing .............................................................................. 48
4.2 Elevated Temperature Testing .......................................................................... 48
4.3 Testing of Economizer Tubes ........................................................................... 53
5. CONCLUSION ...................................................................................................... 54
REFERENCES ........................................................................................................... 56
xii
LIST OF TABLES
TABLES
Table 2.1 Lignite fired thermal power plants in Turkey ............................................. 4
Table 2.2 Boiler steam parameters of Çayırhan Thermal Power Plant ....................... 6
Table 2.3 Boiler tube materials of Çayırhan Thermal Power Plant ............................ 6
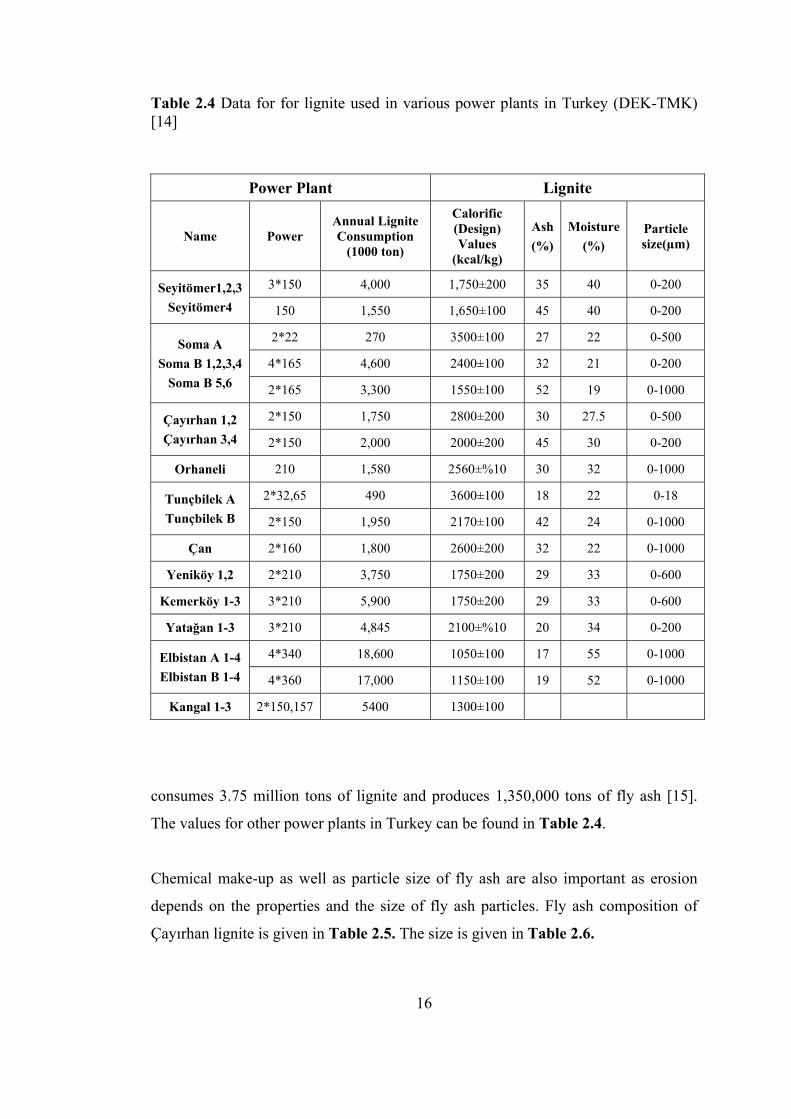
Table 2.4 Data for for lignite used in various power plants in Turkey ..................... 16
Table 2.5 Fly ash compositions of Çayırhan Power Plant ........................................ 17
Table 2.6 Fly Ash particle sizes of Çayırhan Power Plants ...................................... 17
Table 2.7 Erosion wear rates for three set temperatures, the four velocity value were
tested. ......................................................................................................................... 19
Table 2.8 Physical properties of erodent materials ................................................... 22
Table 2.9 Worn out specimen surface morphology due to impact of different solid
particles ...................................................................................................................... 22
Table 2.10 Erosion loss for various conditions, in mmpy ......................................... 23
Table 2.11 Target coating Materials .......................................................................... 24
Table 2.12 Thickness loss of target materials tested under condition (T=300oC,
V=60m/s, 375g bed ash) ............................................................................................ 25
Table 3.1 Stress values of Çayırhan Thermal Power Plant Boiler Tubes ................. 35
Table 3.2 Compression spring types and their properties ......................................... 37
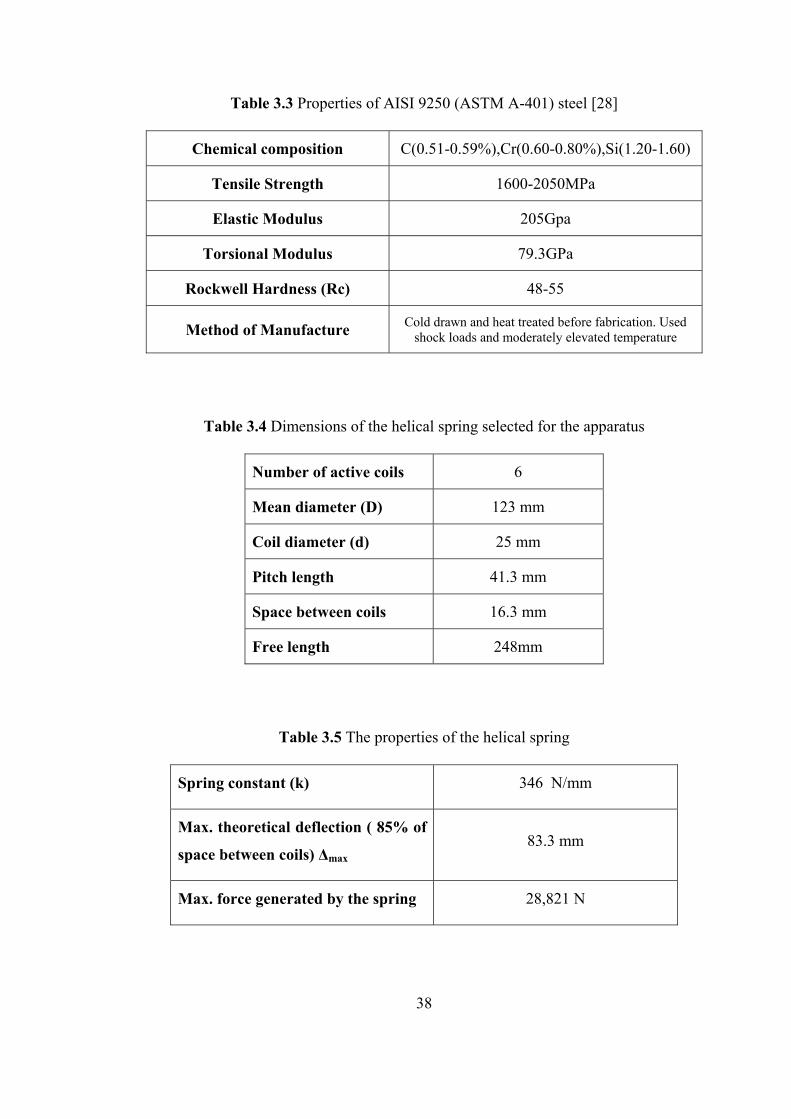
Table 3.3 Properties of AISI 9250 (ASTM A-401) steel .......................................... 38

xiii
Table 3.4 Dimensions of the helical spring selected for the apparatus ..................... 38
Table 3.5 The properties of the helical spring ........................................................... 38
Table 3.6 Deflection tests of the helical spring ......................................................... 40
Table 4.6 Composition of the erosive powder used in the experiments .................... 46
Table 3.7 Erosive powder mesh analysis .................................................................. 46
Table 4.1 Chemical compositions of tube materials tested at high temperature
according to TS EN 10216-2 standard ....................................................................... 49
Table 4.2 Weight measurements of 10CrMo910 materials at room temperature ..... 49

xiv
LIST OF FIGURES
FIGURES
Figure 2.1 Schematic representation of a typical boiler in a coal fired power plant ... 5
Figure 2.2 Temperature distributions inside the boiler in Çayırhan power plant ....... 7
Figure 2.3 Steam temperatures in boiler tubes in Çayırhan power plant .................... 7
Figure 2.4 Effect of pH on the rate of corrosion of steel by water at 310oC .............. 9
Figure 2.5 Waterwall fire-side corrosion and high temperature coal ash corrosion . 10
Figure 2.6 Long-term overheating ............................................................................ 11
Figure 2.7 Fish mouth opening which arises as a result of short term overheating 11
Figure 2.8 Thermal fatigue cracks at the surface of a boiler tube ............................. 13
Figure 2.9 Fly ash erosion thinning and failure ........................................................ 15
Figure 2.10 Weight loss against time for 1020 steel at 45 and 91 g/min feed rates,
300µm Al2O3 erodent, 400oC sample temperature, 40 m/s particle velocity, 90o
impingement angle ..................................................................................................... 18
Figure 2.11 Effect of particle velocity on erosion wears .......................................... 19
Figure 2.12 Variation of material removal with particle collision angle .................. 20
Figure 2.13 Erosion thickness loss vs. impact angle for three coatings eroded by bed
ash .............................................................................................................................. 20
Figure 2.14 Effect of particle size on erosion wear at various erosion time ............. 21
xv
Figure 2.15 Graph showing differences in particle erosivities of SiO2, SiC and fly
ash at a constant particle velocity V = 24±2 m/s and a particle flux between 0.16 and
0.23 kg/m2s. ................................................................................................................ 23
Figure 2.16 Relationship between content of Cr in steels and erosion rate .............. 24
Figure 2.17 Schematic representation of the room temperature gas-blast erosion
apparatus .................................................................................................................... 26
Figure 2.18 Acoustic emission test setup .................................................................. 26
Figure 2.19 Erosion test rig ....................................................................................... 27
Figure 2.20 Diagram of high temperature erosion apparatus used to simulate the
required boiler conditions. ........................................................................................ 28
Figure 2.21 High-temperature erosion apparatus schematic ..................................... 29
Figure 2.22 The diagram of the HEAT Apparatus .................................................... 30
Figure 2.23 Main structure of the centrifugal high temperature erosion apparatus .. 30
Figure 3.1 Schematic representation of test setup simulating operating condition of
the thermal power plant boiler tubes and photograph of the test apparatus ............... 33
Figure 3.2 Sample loading system in the setup ......................................................... 34
Figure 3.3 Helical spring ........................................................................................... 36
Figure 3.4 Test piece used in the setup. .................................................................... 39
Figure 3.5 Photograph of reduction gear motors and the spring ............................... 41
Figure 4.5 Furnace refractory elements with embedded Khantal resistors ............... 42
Figure 3.6 Portion of setup showing the split tube furnace, test piece and the feeder
tube ............................................................................................................................. 42
xvi
Figure 3.7 Split furnace used in the experiments ...................................................... 43
Figure 3.8 Schematic representation of the Particle Blower System ........................ 44
Figure 3.9 Photograph of air conditioning furnace connected to the particle feeding
system and copper tube assembly. ............................................................................. 44
Figure 4.1 High temperature test specimens used in experiments (a) Tested tube
sample (on the right) and zones of prepared specimen (b) Specimen piece prepared
for thickness measurements ....................................................................................... 50
Figure 4.2 Thickness loss values of 1st 10CrMo910 boiler tubes eroded at high
temperatures ............................................................................................................... 51
Figure 4.3 Thickness loss values of 2nd 10CrMo910 boiler tubes eroded at high
temperatures ............................................................................................................... 51
Figure 4.4 Thickness loss values of P235GH boiler tubes eroded at high
temperatures ............................................................................................................... 52
Figure 4.5 Thickness loss values of 16Mo3 boiler tubes eroded at high temperatures
.................................................................................................................................... 52
1
CHAPTER 1
INTRODUCTION
Coal fired thermal power plants continue to have a substantial share in power
generation, i.e. 42% of the total [1]. They have also a significant share in the power
generation in Turkey. According to 2009 annual sector report of Elektrik Üretim AŞ
(EÜAŞ), 28% of the electricity was generated in coal fired thermal power plants [2].
The most of the coal reserves in Turkey are lignite with calorific values usually
between 1000-2000 kcal/kg [3].
Low calorific lignite results in high fly ash content, which generally comprises
Al2O3, SiO2 and Fe2O3 [4]. The fly ash leads to erosion in boiler tubes especially in
regions where they have high velocities. Thus, they may lead to failure of tubes
resulting forced outage of the boiler.
Main failure modes observed in boiler tubes are erosion, short term overheating
usually linked with deposit formation, creep (long term overheating), and corrosion.
The laboratory reports of EÜAŞ [5] indicate that, the erosion make up 28% the total.
This is followed by failures caused by short term overheating (deposit formation)
22%. These failures are observed mainly in the superheater, reheater and economizer
regions of the boiler. Erosion failure arises mostly from fly ash which inside the
boiler move with speeds in the order of 15-55 m/s. Fly ash erosion is quite dominant
in economizer regions where the tube arrays have close spacing.
Forced outage of boiler leads to considerable loss of energy and the resources and
there is considerable interest for minimizing or eliminating the failures mostly arises

2
in tubes. Thus, the testing of boiler tubes against failures has attracted considerable
interest over the decades.
The current study deals with erosion failures with reference to tubes in economizer
region of power plant. The work was undertaken to develop a test apparatus which
can be used to test and evaluate the boiler tube materials against erosion.

3
CHAPTER 2
LITERATURE REVIEW
Coal fired power plants has a share of 42% in the electricity generation in the world
as whole in 2007. According to EUAŞ [2], in 2009 the share is lower for Turkey
making up only 28% of the total, greater portion of the remaining part is made up of
power plants based on natural gas (49%). Three fourth of the coal fired power plants
in Turkey make use of lignite. Lignite is the most important indigenous energy
resource in Turkey with the estimated reserve of 11.5 billion tons. The lignite
deposits are spread across the country, lignite deposits at Afşin-Elbistan being
particularly noteworthy.
The power plants making use of lignite have a total capacity of 8079 MW in Turkey,
Table 2.1. Additionally there are 2 domestic one hard coal (300 MW) and the other
asphaltite (135 MW) and 3 imported hard coal power plants (1780 MW).
According to 2009 TKİ report [3] the calorific values of lignite reserve range
between 1000-4200 kcal/kg. The 66% of these reserves have calorific value of 1000-
2000 kcal/kg and 25% has calorific value of 2001-3000 kcal/kg. For instance, Afşin-
Elbistan the lower calorific value is between 900-1250 kcal/kg.
2.1 Boiler in Coal Fired Power Plants
Figure 2.1 shows a diagram of a boiler in a conventional thermal power plant. The
main components are i) furnace and evaparator ii) superheaters, iii) reheater, iv)

4
Table 2.1 Lignite fired thermal power plants in Turkey (TKİ, 2010) [3]
Project Name Coal Consumption C i ( h d )
Power(MW) Muğla-Yatağan 5350 630
Muğla Milas-Yeniköy ‐ 3750 420
Muğla‐Hüsamlar-Kemerköy 5000 630
Çanakkale Çan 1800 320
Kütahya Seyitömer 7100 600
Kütahya Tunçbilek 2450 365
Manisa Soma 8000 1034
Bursa Orhaneli 1500 210
Afşin Elbistan A 18000 1360
Afşin Elbistan B 18000 1440
Sivas Kangal 5400 450
Ankara Çayırhan 4300 620
Total 80650 8079
economizer, vi) steam drum. These components will below be described below
based on Kitto and Stultz [6].
The furnace and evaporator is an enclosed chamber where the coal is combusted to
heat the boiler. The evaporators provide heat exchange from hot flue gas to water or
steam, primarily by convective heat transfer.
Superheater is a part in the boiler designed to remove all moisture from the steam
by increasing the temperature of the steam to higher values than its saturation point.
Reheater is the same but does the same on steam returned from the turbine. In
addition, the intermediate-pressure steam has given up some of its energy in
expansion through the high-pressure turbine. The operating temperatures of both
superheater and reheater are quite high and therefore, tubes used in these parts are
heavily alloyed. The position of these tubes, normally in bundles, can be horizontal

Figure 2.1 Schematic representation of a typical boiler in a coal fired power plant (Kitto and Stultz, 2005) [6]
or vertical in the boiler and the design and location of these tubes are differentiated
according to the aimed pressure and temperature of the steam as well as the fuel
used.
Economizers are to heat the feed water by extracting the heat from exhaust gases
leaving the boiler. Thus, its purpose is to improve the efficiency of the boiler. Tubes
in the economizer are very closely spaced so as to provide efficient heat transfer.
5

6
Table 2.2 Boiler steam parameters of Çayırhan Thermal Power Plant [7]
Designation Parameter
Maximum continuous superheated steam flow 477t/h
Superheated steam temperature 538oC
Continuous flow of reheated steam 422.6t/h
Reheated steam temperature(in/out) 363.5/538oC
Superheated steam pressure 166 bar
Reheated steam pressure 38.7 bar
Feedwater temperature 250oC
Boiler Efficiency 90%
Table 2.3 Boiler tube materials of Çayırhan Thermal Power Plant [7]
Boiler Parts Tube Materials
Evaporator 15Mo3, 13CrMo44
Sh-1 15Mo3
Sh-2 15Mo3, 13CrMo44
Sh-3 10CrMo910, 13CrMo44
Sh-4 10CrMo910, 13CrMo44
Sh-5 10CrMo910, X20CrMoV121
Rh-1 15Mo3, 13CrMo44, ST35.8
Rh-2 15Mo3, 13CrMo44, 10CrMo910
Eco-1 15Mo3,ST35.8
Eco-2 15Mo3, ST35.8
Drum Wb36
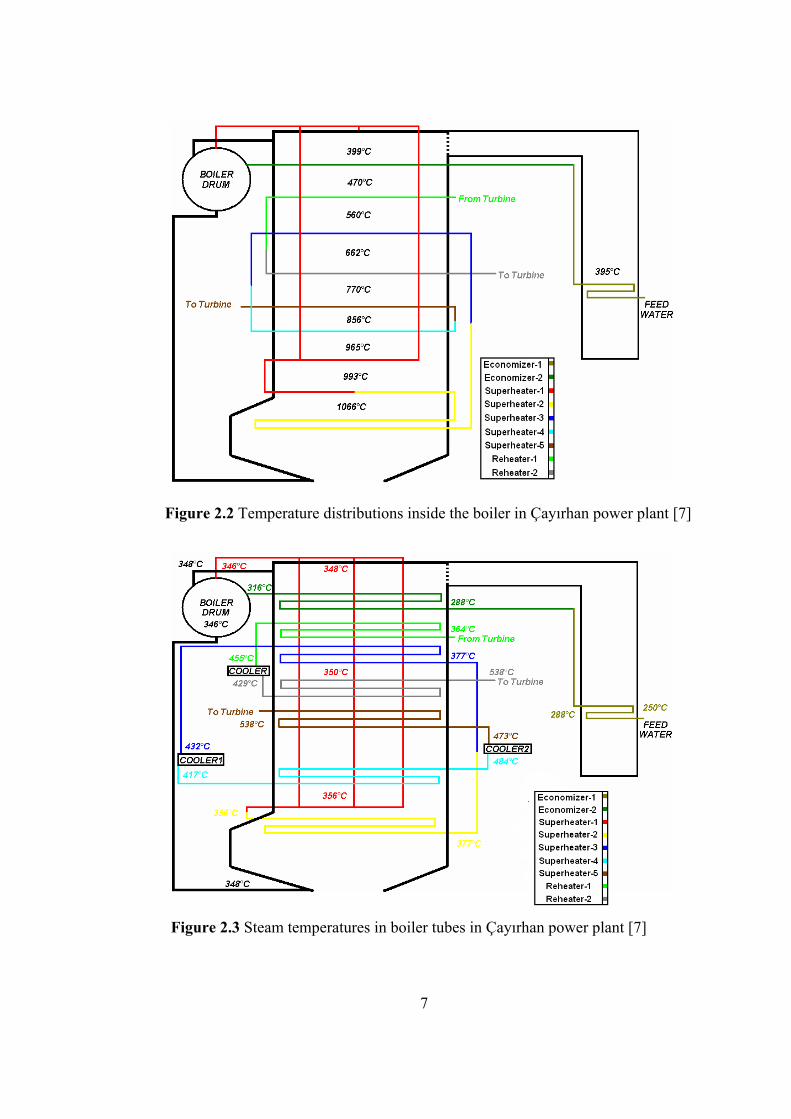
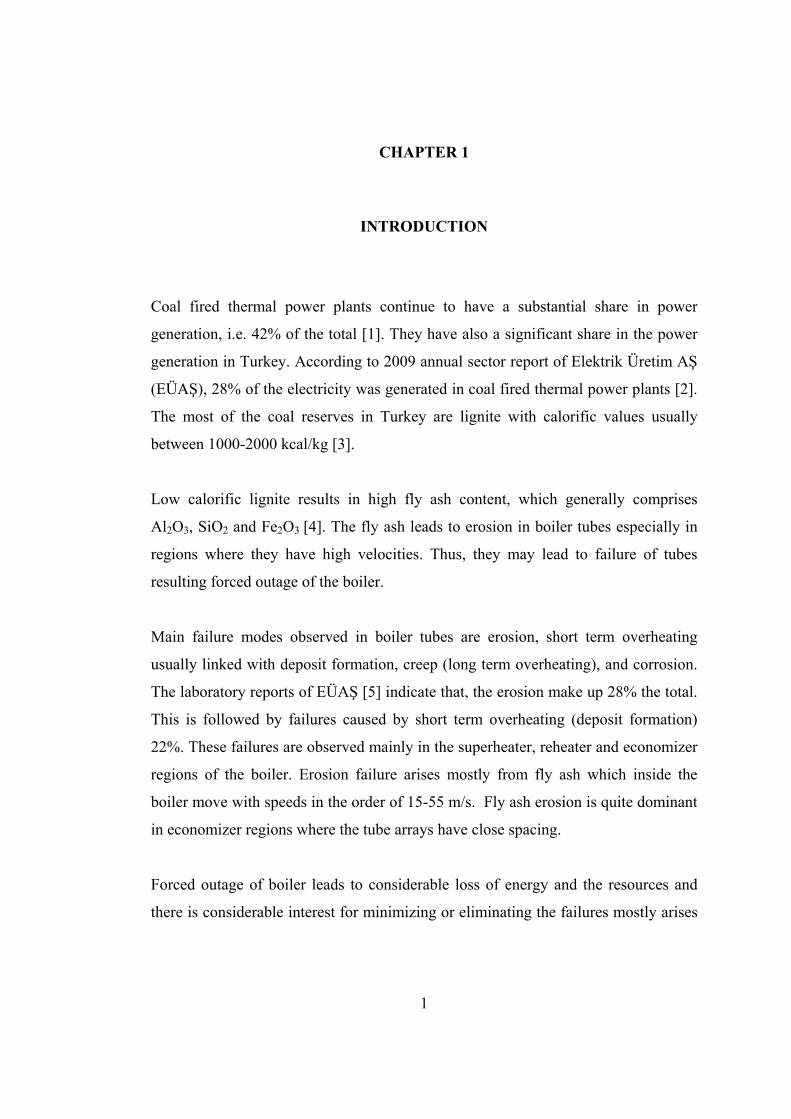
Figure 2.2 Temperature distributions inside the boiler in Çayırhan power plant [7]
Figure 2.3 Steam temperatures in boiler tubes in Çayırhan power plant [7]
7

8
The steam drum is a large cylindrical vessel, located at the top of the boiler. Its
purpose is to separate steam from the steam water mixture.
In thermal power plants, boiler tubes are selected from different grades of steel.
Table 2.3 gives the material grades used in different parts of boiler in Çayırhan
power plant. This plant operates at 538oC and 166 bar pressure. Temperature
distribution inside the boiler is given in Figure 2.2. As seen in the figure, the
temperature is highest in the burning zone and decreases toward the top and across
and down to economizer region. Temperature distribution in the boiler tubes are
given in Figure 2.3. Here the values again refer to Çayırhan power plant. The
temperature in the evaporator tubes is quite low. The temperature at the inlet part of
the superheater is 346oC and it increases to 538oC at the outlet. At the reheater, the
steam returns from the turbine at 364oC and heated up again to 538oC. In the exit
zone of the boiler, the temperature in the economizer ranges from 316oC to 250oC.
2.2 Boiler Tube Failures
According to EPRI 2004 report, the main tube failures observed in coal fired power
plants are water-side corrosion, deposit formation and fire-side corrosion, erosion,
overheating and fatigue.
2.2.1 Water-side Corrosion
Water-side corrosion refers to inside corrosion of tubes in contact with water or
steam. According to the EPRI report [4] water chemistry is an important factor in
affecting the internal surface corrosion and operation life of boiler tube materials.
The corrosion endurance of the boiler tube is tied on the pH level of the water and
the amount of contaminants. Normally, the water is reacted with steel spontaneously
at high temperatures and forms a protective layer of magnetite iron oxide (Fe3O4)

Figure 2.4 Effect of pH on the rate of corrosion of steel by water at 310oC (Grabowski and Klein, 1964) [9]
that ceases the further reaction [8]. Figure 2.4 is taken from Grabowski and Klein [9]
and shows the rate of attack in steel as function of PH value. The figure shows that
the protective magnetite is unstable and soluble at pH values below 5 and above 12.
Normally, in the boiler, water treatment is carried out so as to maintain a moderately
alkaline environment so as to prevent the oxide dissolution. EPRI subcategorizes the
water–side corrosion into four types which are caustic corrosion, hydrogen damage,
pitting (localized corrosion) and stress corrosion cracking. (see Ref. 4)
2.2.2 Deposit Formation and Fire-side Corrosion
Deposit formation refers to fouling of pyrosulfates on the boiler tubes. According to
Project Calcium [10], there are two fouling problem in boiler tubes; conventional
9

(a) (b)
Figure 2.5 a) Waterwall fire-side corrosion, b) High temperature coal ash corrosion (EPRI Report, 2004) [4]
high-temperature fouling and low temperature fouling. This distinction refers to the
bonding mechanisms of the deposits. In high temperature, the bonding is affected by
silicate and iron rich liquid phases. At low temperature the bonding occurs via sulfate
formation, such as CaSO4.
The fire-side corrosion refers to corrosion formed on the outer surface of the boiler
tubes. The occurrence of fire-side corrosion and the operation life of the boiler tube
depend on the fuel ingredients and the metal temperatures [4]. According to EPRI,
corrosion failure may be subdivided into subcategories as low temperature corrosion,
waterwall fire-side corrosion, high temperature coal ash corrosion. An example of
waterwall fire-side corrosion taken from the 2004 EPRI report is given in Figure 2.5.
This corrosion is reported to occur as a result of incomplete fuel consumption, i.e. at
reducing atmosphere which results in the formation of low melting point pyrosulfates
(less than 427oC). These molten pyrosulfates may remove the magnetite formed on
the surface of the tube and this causes metal disintegration in the outer surface of the
tube [11]. High temperature coal ash corrosion is experienced in the superheaters and
reheater tubes [12]. This is also known as liquid phase corrosion and is observed
when the metal temperature is in the range between 595oC and 705oC.
10
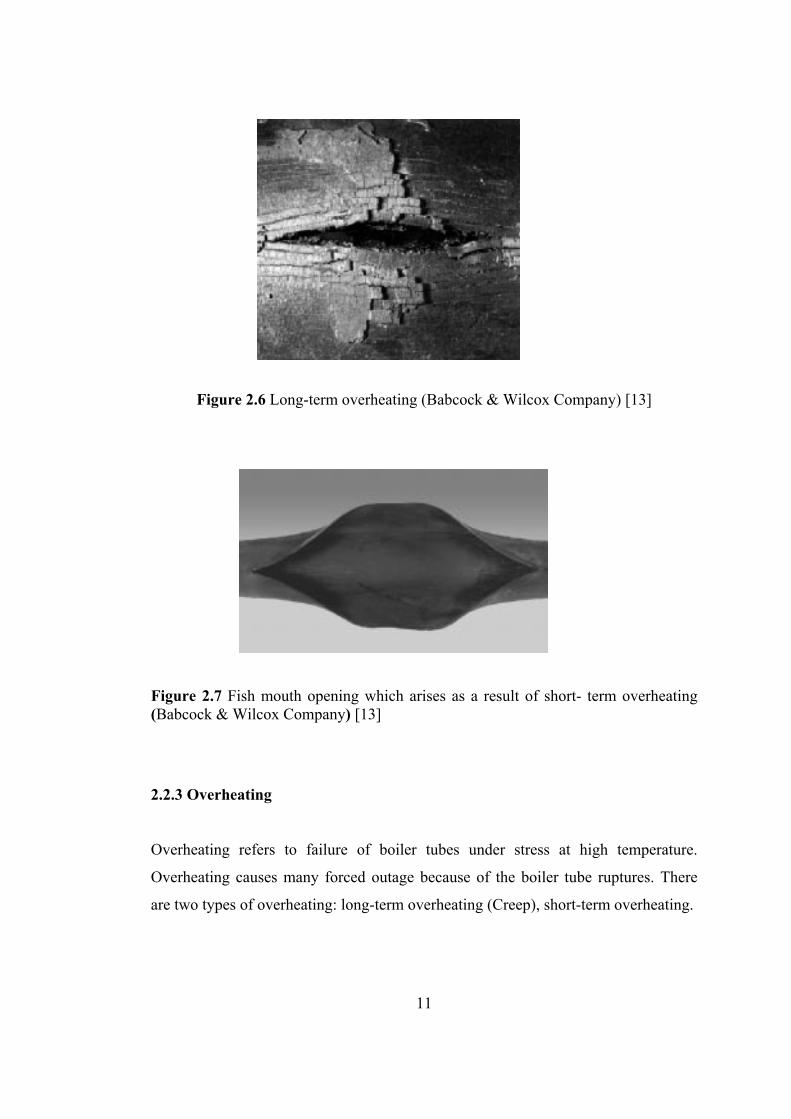
Figure 2.6 Long-term overheating (Babcock & Wilcox Company) [13]
Figure 2.7 Fish mouth opening which arises as a result of short- term overheating (Babcock & Wilcox Company) [13]
2.2.3 Overheating
Overheating refers to failure of boiler tubes under stress at high temperature.
Overheating causes many forced outage because of the boiler tube ruptures. There
are two types of overheating: long-term overheating (Creep), short-term overheating.
11
12
An example of long-term overheating taken from Babcock and Wilcox [12] is given
in Figure 2.6. This failure quite common in superheater and reheater tubes is actually
a high temperature creep. The timing of failure depends on the level of stress and
temperature. The tube may rupture earlier due to high creep rate when the stress and
temperature pass over the design values. Long-term overheating failure can be
observed also in water wall tubes [13]. In this case, due to scale or deposits that forms
at the water-side or due to restricted flow of water/steam, the temperature of the
tubes goes up to very high values and the creep failure takes place.
Short-term overheating is the most common failure during the start-up [13]. It is
observed when the tube temperature reaches extreme values due to insufficient flow
of steam or water. This leads ductile rupture of the tube, the so-called “fish mouth”
opening, Figure 2.7.
2.2.4 Fatigue
Fatigue refers to failure due to a variety of cyclic stresses on the boiler tubes. During
operation of thermal power plants mainly three types of fatigue can be observed:
thermal fatigue, mechanical fatigue and corrosion fatigue.
According to EPRI [4], thermal fatigue occurs as a result of rigorous temperature
decrease of the tube metal due to water quenching. The main cause of thermal fatigue
in economizer tubes is water splashes that occur at the bottom ash hopper and sprays
of condensate from the soot blower system. Also rapid and frequent changes in the
feed water temperature bring about thermal fatigue resulting in the cracks in the inlet
tubes. Cracks propagate through the wall and result in a thick-edged fracture as seen
in Figure 2.8.
Mechanical fatigue arises from the vibration caused by flue gas flow or sootblowers
or due to low frequency high amplitude stresses generated in the boiler. This results

Figure 2.8 Thermal fatigue cracks at the surface of a boiler tube (EPRI Report, 2004) [4]
in thick edged cracks. Corrosion fatigue is combination of thermal fatigue and
corrosion [13].
2.2.5 Erosion
Erosion is the removal of material from the tube surface as a result of impacts of ash
particles. According to EPRI [4] the amount and velocity of ash particles determine
the operating life of boiler tubes since they have serious effect on the amount of
erosion. More precisely “For a given concentration of particulate ash in the flue gas,
the rate of metal loss is proportional to the impact velocity raised to the power of
3.5.” Other parameters controlling the rate of erosion are the angle of impact and the
abrasiveness of the ash particles. The economizers, lower furnace sloping tubes,
areas adjacent to sootblowers, superheaters, reheaters and cyclone burners are the
most common locations where erosion failures are encountered. Erosion of boiler
tubes may involve erosion caused by sootblower, by falling slag or by coal particle
erosion. But fly ash erosion is most common.
13

14
2.3 Fly Ash Erosion Failure
This is the primary erosion failure type encountered in coal fired power plants. It is
caused by high velocity fly ash impacting on the boiler tubes. According to EPRI, the
particle velocity, the amount of ash particle, as well as the constituents that make up
the particles are major factors determining the erosion rate. The velocity of these
particles ranges from 15 m/s to 55 m/s. This failure is most common in the
economizer due to narrower spacing of the tubes, primary superheater and inlet
sections of reheater tubes where the gas flow is non-uniform.
Factors contributing to this failure are several: Blocking of gas passage due to
deposit formation results in smaller passages for flue gas and therefore leads to
higher velocities. In fact, anything that increases the fly ash velocity contributes to
fly ash erosion e.g. misaligned or distorted tubes, or baffles or flow guides which can
be misaligned [4].
According to EPRI [4], the fly ash erosion is quite common in economizer. As
mentioned above, this is due to close spacing of the tubes. Another factor that
contributes to this is the fact that the particles are cooler and more abrasive in this
part of the boiler. Initially, the erosion leads to smooth, polished surface, but later on
the surface deteriorates by the formation of flow traces and the other formations [12].
It then leads to wall thinning and finally to the tube rupture, Figure 2.9.
In order to reduce fly ash erosion, all baffles, collectors; refractories and the like
need to be controlled and made sure that they are working properly. If necessary,
redesign of boiler parts may be required. It is expected that the decreasing the
amount and velocity of fly ash will also lower the damage. Using fuels that would
produce less erosive ash may be desirable. Increased flue gas velocity due to high
load and excess air results in accelerated failure.

Figure 2.9 Fly ash erosion thinning and failure (EPRI Report, 2004) [4]
The boiler tubes that slag may adversely affect the flue gas velocity and may
contribute to the fly ash erosion. Slagging can be diminished by proper fuel additives
or soot blowing [11]. Besides, in order to distribute flue gases (and thus fly ash),
more evenly, baffle is a reasonable choice. On the other hand, carrying out shielding
is impossible where gas flow is horizontal through the tube banks. In this case, slag
fences can be used.
It should be pointed out that the potential areas for erosion may be protected by
abrasion resistant metal spray coatings.
2.4 Fly Ash in Lignite Fired Power Plants
Erosion failure is closely related to the content of fly ash in the flue gas. Therefore, it
is useful to review lignite reserves with respect to their ash content. In Çayırhan
power plant the lignite is extracted from the underground mines of Beypazarı Basin,
and it has a ash content varying between 30% - 45% [14]. As a result, the plant
15
16
Table 2.4 Data for for lignite used in various power plants in Turkey (DEK-TMK) [14]
Power Plant Lignite
Name Power Annual Lignite Consumption
(1000 ton)
Calorific (Design) Values
(kcal/kg)
Ash(%)
Moisture (%)
Particle size(µm)
Seyitömer1,2,3Seyitömer4
3*150 4,000 1,750±200 35 40 0-200
150 1,550 1,650±100 45 40 0-200
Soma A Soma B 1,2,3,4
Soma B 5,6
2*22 270 3500±100 27 22 0-500
4*165 4,600 2400±100 32 21 0-200
2*165 3,300 1550±100 52 19 0-1000
Çayırhan 1,2 Çayırhan 3,4
2*150 1,750 2800±200 30 27.5 0-500
2*150 2,000 2000±200 45 30 0-200
Orhaneli 210 1,580 2560±%10 30 32 0-1000
Tunçbilek A Tunçbilek B
2*32,65 490 3600±100 18 22 0-18
2*150 1,950 2170±100 42 24 0-1000
Çan 2*160 1,800 2600±200 32 22 0-1000
Yeniköy 1,2 2*210 3,750 1750±200 29 33 0-600
Kemerköy 1-3 3*210 5,900 1750±200 29 33 0-600
Yatağan 1-3 3*210 4,845 2100±%10 20 34 0-200
Elbistan A 1-4 Elbistan B 1-4
4*340 18,600 1050±100 17 55 0-1000
4*360 17,000 1150±100 19 52 0-1000
Kangal 1-3 2*150,157 5400 1300±100
consumes 3.75 million tons of lignite and produces 1,350,000 tons of fly ash [15].
The values for other power plants in Turkey can be found in Table 2.4.
Chemical make-up as well as particle size of fly ash are also important as erosion
depends on the properties and the size of fly ash particles. Fly ash composition of
Çayırhan lignite is given in Table 2.5. The size is given in Table 2.6.

Table 2.5 Fly ash compositions of Çayırhan Power Plant (Şahin, 2005) [15]
Oxide Weight%
SiO2 50.38
Al2O3 14.06
Fe2O3 9.90
CaO 13.25
Other Oxides 10.99
Loss on Ignition 0.86
Table 2.6 Fly Ash particle sizes of Çayırhan Power Plants (Şahin,2005) [15]
17
Mesh size(µm) % Passed
1000 100
500 99.37
250 95.64
200 88.73
106 76.20
90 71.68
45 57.96
2.5 Factors Affecting Erosion Rate
Factors affecting the erosion rate are the concentration of ash particles in flue gas,
their impact velocity and impact angle, the properties of the particles themselves and
the temperature.

Figure 2.10 Weight loss against time for 1020 steel at 45 and 91 g/min feed rates, 300µm Al2O3 erodent, 400oC sample temperature, 40 m/s particle velocity, 90o impingement angle (Lindsley et al., 1994) [16]
The concentration of ash particles is one of the important factors affecting the
erosion rate. Lindsley et al. [16] in a special setup have examined the effect of the
ash particle concentration using two feed rates. They found that the weight loss
increases with increasing feed rate of particles, Figure 2.10. The study shows a
linear rise of weight loss with time.
Impact velocity of the ash particles was investigated by Zhang et al. [17] and they
found that the erosion rate increases with increasing velocity. Figure 2.11 is taken
from Zhang et al. which shows that the relationship is not linear. As seen in the
figure, the erosion rate increases more rapidly at higher values of the impact
velocities. Zhang at al. explain this based on the argument that impact energy is
proportional to square of the velocity. The effect of the impact velocity was also
studied by Suckling and Allen [18] who has reported similar results, see Table 2.7.
18

Figure 2.11 Effect of particle velocity on erosion wears (The erosion conditions are c=185.6 g/m3, α=90o) (Zhang et al., 2001) [17]
Table 2.7 Erosion wear rates for three set temperatures, the four velocity value were tested. (Suckling and Allen, 1997) [18]
Zhang et al. in their study also looked at the effect of the impact angle on the erosion.
Working on a ductile tube specimen (AISI 1015), they found that the erosion varied
as a function of impact angle. Using SEM (Scanning Electron Microscope) they
observed that at rubbing and scratching up to 10o of impact angle. At 20o the effect
was in the form of cutting. At 30o, cracking, at 60o extrusion and finally at 90o, they
observed sputtering. The effect on erosion, Figure 2.12, was such that the rate was
highest at impact angle of 20o - 30o.
19

Figure 2.12 Variation of material removal with particle collision angle (The erosion conditions are V=20 m/s, t=52 min.) [21] (Zhang et al., 2001) [17]
Figure 2.13 Erosion thickness loss vs. impact angle for three coatings eroded by bed ash (under V=60 m/s, T=300oC, t=5 hours, 375 g) (DS-200=Cr3C2–NiCr, DS-300=Cr3Cr2/TiC–NiCrMo, DS-400=NiAl–40Al2O3) (Wang and Lee, 1999) [19]
20

Figure 2.14 Effect of particle size on erosion wear at various erosion time (The erosion conditions are V=20 m/s, c=185.6 g/m3, α=90o) [21]
The effect of impact angle depends on material. Wang and Lee [19] have studied the
effect of impact angle on the erosion of NiAl-40Al2O3 (DS400) coating and found
that the erosion increases with increasing impact angle, Figure 2.13.
Effect of particle size on erosion has been studied by Zhang et al. [17]. Figure 2.14
is taken from their study and shows that the erosion increases with increasing particle
size. Desale et al. [20] investigated three different erodent material; quarts, alumina
and silicon carbide. The sample was AISI 304L steel. They examined the effect of
particle shape, defined in terms of a shape factor, on erosion. The properties of the
particle samples used in test are given in Table 2.8. Besides they observed also the
effect of the erodent density on the erosion rate. The study has shown that increasing
shape factor leads to erosion rate decrement and but increasing density affects the
erosion rate positively. This can be derived from the surface roughness comparisons
of the specimens. The surface roughness comparisons of two specimens with
different particles at different angles for shallow and normal angle values are
indicated in Table 2.9.
Suckling and Allen have studied the erosion of 1Cr1/2Mo steel from 20oC to 600oC.
They found that the erosive wear increases with increasing temperature, Figure 2.15.
21

Table 2.8 Physical properties of erodent materials (Desale et al., 2006) [20]
Table 2.9 Worn out specimen surface morphology due to impact of different solid particles (Desale et al., 2006) [20]
Tylczak et al. [21] in a similar study examined the erosion of a number of materials;
T-22 type (2.25 Cr 1 Mo steel), 304SS, 310SS and Incoloy 800 from room
temperature to 800oC. They concluded that the material loss increases at high
temperatures, Table 2.10.
The material properties are also influential in affecting the erosion rate. The material
composition, the heat treatment history and surface hardness are all relevant in the
erosion phenomena. Hayashia et al. [22] investigated the effect of Cr concentration
in steel on erosion resistance. They observed that increasing Cr content of steel
reduces the material loss in erosion. This effect was particularly pronounced in low
concentrations which continued up to 10% Cr.
22
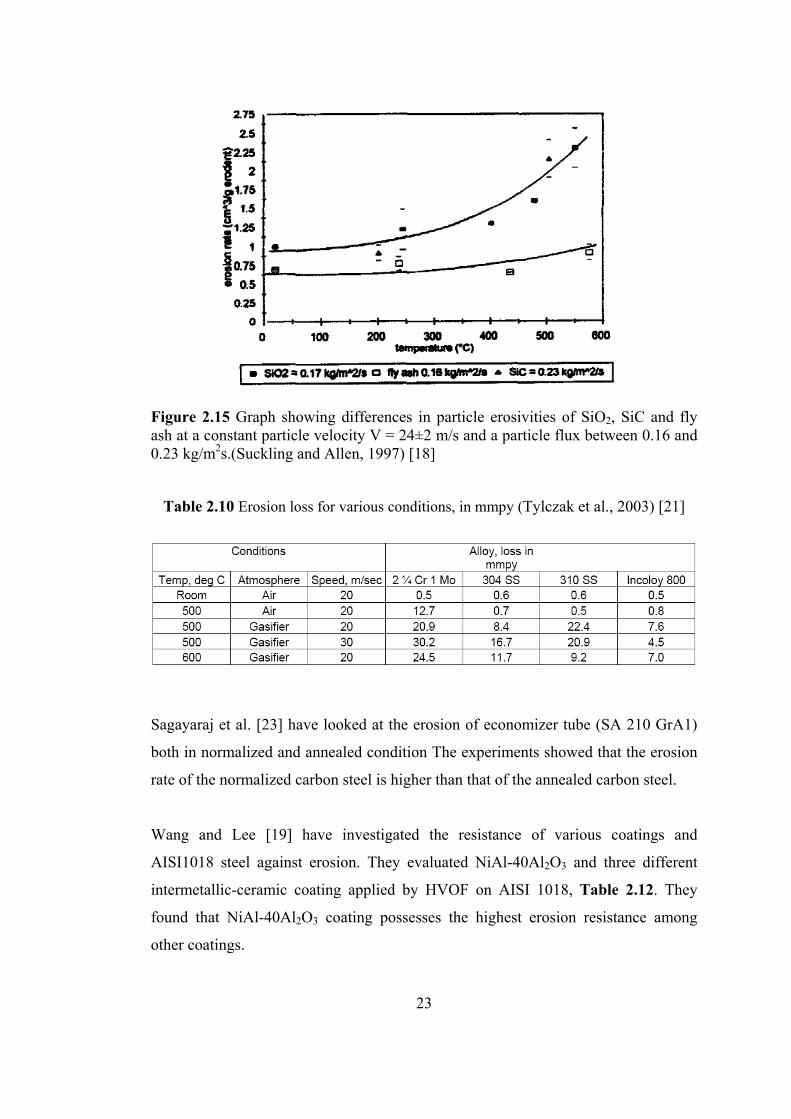
Figure 2.15 Graph showing differences in particle erosivities of SiO2, SiC and fly ash at a constant particle velocity V = 24±2 m/s and a particle flux between 0.16 and 0.23 kg/m2s.(Suckling and Allen, 1997) [18]
Table 2.10 Erosion loss for various conditions, in mmpy (Tylczak et al., 2003) [21]
Sagayaraj et al. [23] have looked at the erosion of economizer tube (SA 210 GrA1)
both in normalized and annealed condition The experiments showed that the erosion
rate of the normalized carbon steel is higher than that of the annealed carbon steel.
Wang and Lee [19] have investigated the resistance of various coatings and
AISI1018 steel against erosion. They evaluated NiAl-40Al2O3 and three different
intermetallic-ceramic coating applied by HVOF on AISI 1018, Table 2.12. They
found that NiAl-40Al2O3 coating possesses the highest erosion resistance among
other coatings.
23

Figure 2.16 Relationship between content of Cr in steels and erosion rate: a) data obtained by the centrifugal apparatus (particle: SiO2 (average diameter: 23 µm), particle impingement angle: 30o, temperature of test piece: 700oC) and b)data obtained by blast type apparatus (Hayashia et al., 2003) [22]
Table 2.11 Target coating Materials (Wang and Lee, 1999) [19]
24

Table 2.12 Thickness loss of target materials tested under condition (T=300oC, V=60m/s, 375g bed ash) (Wang and Lee,1999) [19]
2.6 Test Setups for Erosion of Boiler Tubes
Studies reported above concerning factors affecting the erosion rate have mostly
been carried out in experimental setups that have been developed for the purpose.
One such setup is that of Moumakwa and Marcus [24]. Schematic representation of
this setup is given in Figure 2.17. The setup operates by injecting erodent particles
with a gas stream to impact onto the target specimen placed in an enclosed chamber.
In this system, by changing the pressure of the carrier gas (compressed air) the
velocity of erosive particles can be adjusted. The feed rate of erosive particles is
controlled by the venturi educator which draws the particles from the revolving table
whose rotation speed is controlled by an electric motor. The sample was mounted on
a variable angled block so that the impact angle can be changed at ease. Particles
used in this setup were 125-180 µm silica.
The setup allows the study of effects of various parameters on erosion but the tests
were limited to room temperature.
Zhang et al. [21] have described an erosion apparatus that can be used with tubular
samples. The setup, given in Figure 2.18, allows the flow rates of particles up to 30
m/s by changing the air pressure. Erodent particles were directed by a nozzle to the
surface of specimen, the axis of the nozzle always aligned with the diameter axis of
the tubular sample. The nozzle angle with respect to the longitudinal axis of the tube
25
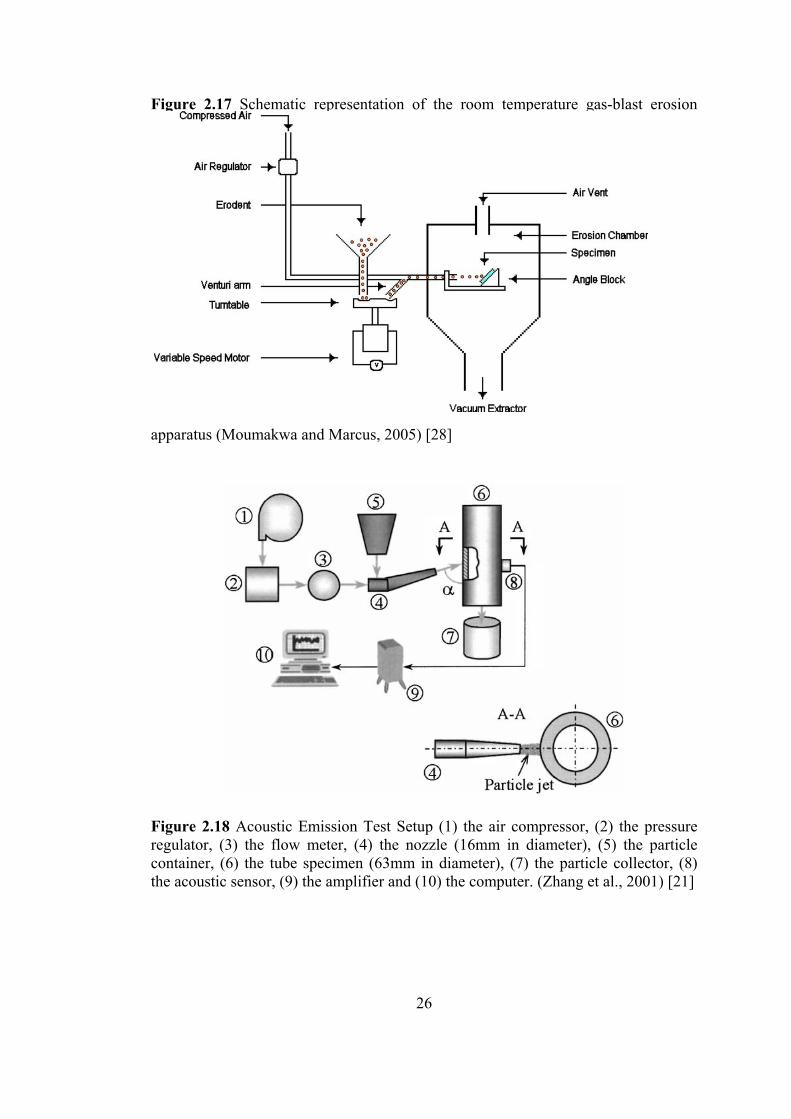
Figure 2.17 Schematic representation of the room temperature gas-blast erosion
apparatus (Moumakwa and Marcus, 2005) [28]
Figure 2.18 Acoustic Emission Test Setup (1) the air compressor, (2) the pressure regulator, (3) the flow meter, (4) the nozzle (16mm in diameter), (5) the particle container, (6) the tube specimen (63mm in diameter), (7) the particle collector, (8) the acoustic sensor, (9) the amplifier and (10) the computer. (Zhang et al., 2001) [21]
26

Figure 2.19 Erosion test rig (Sagayaraj et al., 2008) [23]
was adjustable from 0 to 90o. By this way the impact angle, α, could be controlled.
The erosion severity was measured by observing the material loss.
Sagayaraj et al. [23] have described a setup that allows high temperature testing. The
setup, given in Figure 2.19, composed of a furnace and a particle feeding system
based on compressor.
Suckling and Allen [18] have described an erosion setup that can be used for high
temperature tests. Schematic representation of this setup is given in Figure 2.20.
Heating was achieved by LPG flame. In this system angled block is used as sample
holder.
A more comprehensive setup, is that of Lindsley et al. [16], Figure 2.21. This allows
testing of samples from 25oC to 1000oC. The impact angle can be adjusted from 0o
27

Figure 2.20 Diagram of high temperature erosion apparatus used to simulate the required boiler conditions. (Suckling and Allen, 1997) [18]
and 90o. The velocity of particles (Al2O3) could be increased up to 85 m/s. The feed
rates of particles are adjusted with a screw feeder driven by variable speed motor.
The sample is placed inside a furnace which could be heated up to 1200oC. The air
carrying the particles is preheated before entering the furnace. The particles can be
accelerated in a SiC tube before they hit the surface of the sample. The impact
velocity of the particles are measured with a TSI laser Doppler velocimeter that
provides direct measurement of the particle velocity without disturbing the particle
flow, upon exiting the acceleration tube. The powder and gas mixture which come
28

Figure 2.21 High-temperature erosion apparatus schematic (Lindsley et al., 1994)
ut trough the system are segregated with the help of a cyclone. Besides, SO gas is
t al. [21] designed a test apparatus, named as the Hostile Atmosphere
2
a et al. [21] have described a setup that allows a number of samples to be
[16] o 2
able to be sent to the system to simulate corrosion mechanism in this setup.
Tylzcak e
Erosion Test Apparatus (HEAT Apparatus), that is quite different from the
conventional setups, Figure 2.22. This system is working in a closed furnace,
isolated by heat shields. The sample is inside the furnace connected to a shaft,
inserted vertically through a lid. The shaft and hence the sample is rotating by a
variable speed motor. Erosive particles (SiO ) are fed by a screw feeder into a long
abrasive feed tube which injects the powders onto the sample.
Hayashi
tested at the same time. Schematic representation of this setup is given in Figure
2.23. In this apparatus erosive particles were fed into a central hopper to which a
nozzle is attached. The particles are delivered onto the samples placed at the
periphery with a high speed as a result of a centrifugal force of a rotating hopper. The
29

Figure 2.22 The diagram of the HEAT Apparatus (Tylzcak et al., 2003) [21]
Figure 2.23 Main structure of the centrifugal high temperature erosion apparatus: a) principal of centrifugal erosion apparatus and b) structure of the main part of apparatus (Hayashia et al, 2003) [26]
30

31
test could be conducted at different temperatures. A total of 6 samples could be
tested simultaneously in this setup.

32
CHAPTER 3
EXPERIMENTAL SETUP
Apparatus constructed in this thesis aims primarily for erosion tests of boiler tubes.
In addition, the apparatus can also be used for creep testing as well as for corrosion
testing of boiler tubes. The design of this setup was based on the preliminary study
carried out by a group of 4th year undergraduate students (T7) of Metallurgical and
Materials Department of Middle East Technical University in the year 2007 [25].
Test apparatus was designed to simulate operating conditions in the boiler of thermal
power plants especially in the economizer zone. The setup consists of three
components, Figure 3.1. These are i) a unit for sample loading, ii) a unit for blowing
the abrasive particles, and iii) a heating system to control and monitor the
temperature of testing.
3.1. Sample Loading System
A schematic drawing of a sample loading system is given in Figure 3.2. The system
comprises a tubular mill (1) housed in place with the use of two bearings (2). Further
below, there is an identical mill (3) of a short length fixed axially in place and
centered in a similar bearing (4). Sample (5) is connected axially to these mills via a
pin coupling (6).
The sample is loaded with a spring system. The spring (7) can be compressed with a
help of a gear-nut (8) rotated with a gear connected to a motor placed on a horizontal
plane (not shown). With the sample in its place; when the nut is driven down, it
compresses the spring applying tensile forces to the mill and hence to the sample.

(a)
33
(b)
Figure 3.1 a) Schematic representation of test setup simulating operating condition of the thermal power plant boiler tubes b) Photograph of the test apparatus

Figure 3.2 Sample loading system in the setup, see text for details. 1. Tubular upper connector mill, 2.Axial bearings, 3. Tubular lower connector mill, 4.Axial bearing, 5.Sample, 6.Connecting pins (sample), 7.Helical compression spring, 8.Gear, 9.Motor with a reduction gear, 10. central mill with a connection pin , 11.Heating elements, 12.Tray for powder diversion.
34

35
Table 3.1 Stress values of Çayırhan Thermal Power Plant Boiler Tubes (T7 Report, 2007) [25]
20CrMoV121 14CrMo44 15Mo3 10CrMo910 St35.8
R inner (mm) 15.95 17.25 15.15 15.15 24.7
R outer (mm) 22.25 22.25 22.25 22.25 28.7
Yield strength (MPa) 250
(at550oC) 190
(at480oC) 163
(at460oC) 185
(at500oC) 110
(400oC)
Thickness (mm) 6.3 5 7.1 7.1 4
Pressure (MPa) 16.6 16.6 16.6 16.6 5.6
Longitudinal Stress (MPa) 17.5 25 14.3 14.3 20.09
Hoop Stress (MPa) 41.4 56.8 34.7 34.7 40.2
3.1.1 Selection of Spring
The loading system as described above allows the use of samples in the form of tubes
with a minimum of sample preparation. The sample preparation consists of
machining of the central portion of the tube and drilling of two holes at both ends of
the sample.
In this design, since loading is effected by spring, the selection of the spring is quite
critical. To be able to decide about the characteristics of the spring first it is
necessary to determine the level of stresses generated in the boiler tubes.
Boiler tube data of Çayırhan power plant are given in Table 3.1. Based on this data
stresses generated in the tubes have been calculated and are included in the table. By
looking at these values, it is seen that the hoop stress, which is twice the longitudinal
stress has a maximum value of approx. 57 MPa. This value is nearly 1/3.5 of the
yield stress of the material in question. See Table 3.1. Even though system stress in
the tubes are that of plane stress, the loading system as described above apply uni-
axial stress. Considering that the maximum value was 57 MPa the uni-axial loading
with 100 MPa was considered to be sufficient for the current purposes.

Figure 3.3 Helical spring
To be able to select the spring, it is now necessary to decide about the sample
dimension. As seen in Table 3.1 the tube diameter varies from 44.5 mm to 57.4 mm.
The wall thickness of boiler tubes varies from 4 mm to 7.1 mm. Thus, the cross-
sectional areas of the tubes have a value in between 6.71x10⁻⁴m2-8.34x10⁻⁴m2. To
generate uni-axial stress of 100 MPa it is necessary to apply a force of 67,100 N to
83,400 N. This force is quite large and so as to reduce the level of required force the
cross-section of the sample was reduced by machining the tube down to approx.
2mm wall thickness. With tube diameter of 35 mm and the wall thickness of 2mm
100 MPa stress corresponds to the application of tensile forces of approx. 20,000 N.
Figure 3.3 shows a helical spring. Here d is the diameter of the spring material, and
D is the mean diameter of the coil. Force, F generated axially by the coil is given by
[26]
F=k.Δ (4.1)
Where
k =
Here k is the spring constant, Δ is the deflection, G is the shear modulus of the
material, n is the number of active coils.
36
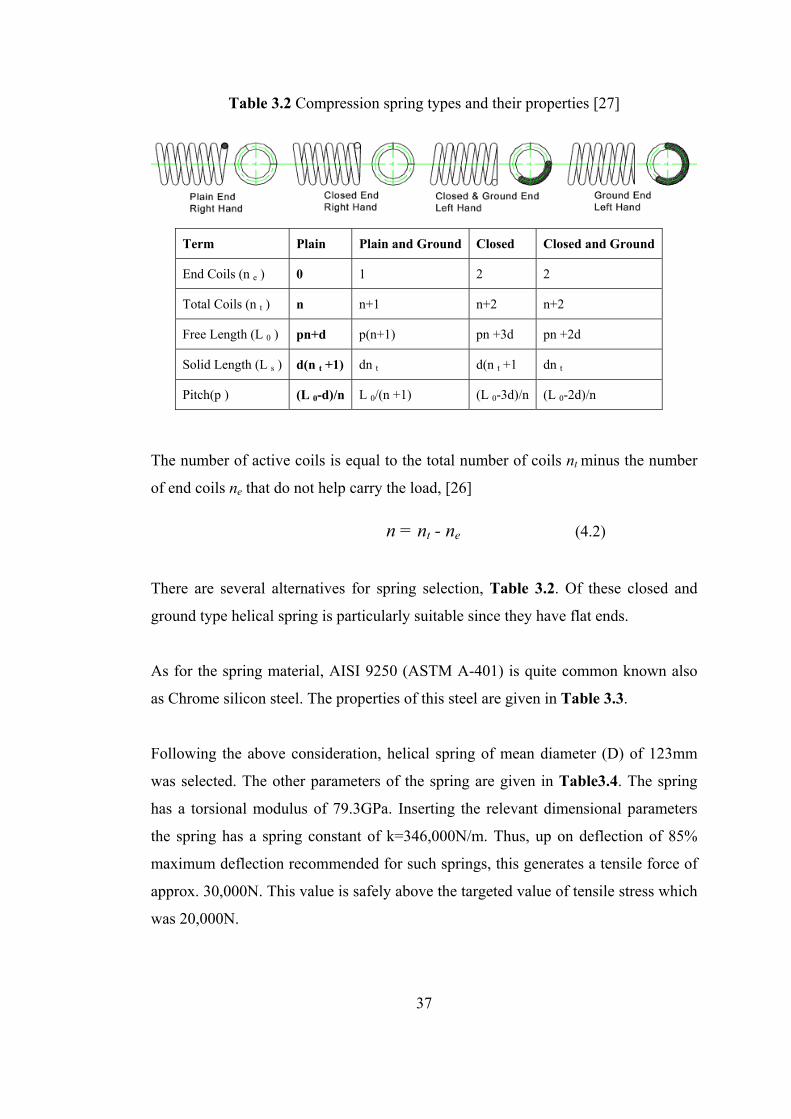
Table 3.2 Compression spring types and their properties [27]
Term Plain Plain and Ground Closed Closed and Ground
End Coils (n e ) 0 1 2 2
Total Coils (n t ) n n+1 n+2 n+2
Free Length (L 0 ) pn+d p(n+1) pn +3d pn +2d
Solid Length (L s ) d(n t +1) dn t d(n t +1 dn t
Pitch(p ) (L 0-d)/n L 0/(n +1) (L 0-3d)/n (L 0-2d)/n
The number of active coils is equal to the total number of coils nt minus the number
of end coils ne that do not help carry the load, [26]
n = nt - ne (4.2)
There are several alternatives for spring selection, Table 3.2. Of these closed and
ground type helical spring is particularly suitable since they have flat ends.
As for the spring material, AISI 9250 (ASTM A-401) is quite common known also
as Chrome silicon steel. The properties of this steel are given in Table 3.3.
Following the above consideration, helical spring of mean diameter (D) of 123mm
was selected. The other parameters of the spring are given in Table3.4. The spring
has a torsional modulus of 79.3GPa. Inserting the relevant dimensional parameters
the spring has a spring constant of k=346,000N/m. Thus, up on deflection of 85%
maximum deflection recommended for such springs, this generates a tensile force of
approx. 30,000N. This value is safely above the targeted value of tensile stress which
was 20,000N.
37
38
Table 3.3 Properties of AISI 9250 (ASTM A-401) steel [28]
Chemical composition C(0.51-0.59%),Cr(0.60-0.80%),Si(1.20-1.60)
Tensile Strength 1600-2050MPa
Elastic Modulus 205Gpa
Torsional Modulus 79.3GPa
Rockwell Hardness (Rc) 48-55
Method of Manufacture Cold drawn and heat treated before fabrication. Used shock loads and moderately elevated temperature
Table 3.4 Dimensions of the helical spring selected for the apparatus
Number of active coils 6
Mean diameter (D) 123 mm
Coil diameter (d) 25 mm
Pitch length 41.3 mm
Space between coils 16.3 mm
Free length 248mm
Table 3.5 The properties of the helical spring
Spring constant (k) 346 N/mm
Max. theoretical deflection ( 85% of
space between coils) Δmax 83.3 mm
Max. force generated by the spring 28,821 N

(b) (a)
Figure 3.4 Test piece used in the setup. a) Section view b) 3-D view
The above calculations were checked by testing the selected spring by compression
loadings. Force versus deflection values are reported in Table 3.5.
3.1.2 Sample Preparation
It is highly desirable to test the samples directly cut from the tubes. However, the
cross-sectional area of the tubes are quite large and to be able to generate a
comparable stresses, a very high forces would be needed. As a result, samples have
been machined to reduce their cross-sectional area. Figure4.5 shows a schematic
39

40
Table 3.6 Deflection tests of the helical spring
Load applied Deflection
500kg 15mm
1000kg 30mm
2000kg 60mm
2250kg 67mm
representation of the sample used for testing. As seen in the figure test piece has two
pin holes which are used for the connectiom of the test piece to main test shaft. Here
the collar seen close to the lower end of the sample is firm fitted to the sample
diverting the abrasive particles away from the pin coupling.
3.1.3 Electric Motors and Auxiliary Units of the Loading system
To load the helical spring, a horizontal reduction gear motor, with a 0.55 kW power
and 1033 Nm torque capacity, is selected. The rotation speed of this unit is 4.7 rpm.
This motor-gear was placed onto a platform supported by a column, shown in Figure
3.5. To generate force, this unit is engaged to spring gear on the tubular mill. The
diameter ratio is such that spring gear has a speed of 7.83 rpm. The spring-gear as a
result moves downward on the tubular mill (1) compressing the spring (see Figure
3.2). Ones the required level of force is reached the motor-gear was disengaged.
Since the tubular mill is free to move vertically on the inner mill, the spring exerts
tensile force on the sample.
Calculations show that to be able to compress the spring to apply force of 20,000 N it
is necessary to apply a torque of approx. 300 Nm on spring gear. Since the reduction
gear motor has a torque of 1033 Nm this is more than sufficient to compress the
spring.

Figure 3.5 Photograph of reduction gear motors and the spring.
The tubular mill was manufactured from specimen AISI 316 stainless steel [29]. The
central mill which rotates the sample together with the tubular mill was again AISI
316 stainless steel.
3.2 Heating System
For heating system a split type furnace is used. This unit was connected to platform
carrying the reduction gear motor. The furnace refractory (Al2O3-SiO2) with
41

Figure 4.5 Furnace refractory elements with embedded Khantal resistors
Figure 3.6 Portion of setup showing the split tube furnace, test piece and the feeder tube. 1. Refractory material, 2.Heating elements, 3.Stainless steel sleeves, 4.Powder tray, 5.Feeder tube
42

Figure 3.7 Split furnace used in the experiments
embedded heating elements are shown in Figure 3.5. The furnace has 750 watt
power capable of reaching 11000C. The temperature control was achieved with a PID
controller. The cross sectional view and the photograph of the vertical furnace were
given in Figure 3.6 and Figure 3.7.
As mentioned above, the furnace could reach to temperatures as high as 1100oC,
though the testing temperature was never more than 500oC in the present study. The
delivery of particles with high velocity air to the sample cools down the chamber
atmosphere. So the use of more powerful furnace was helpful in maintaining the
targeted temperature. Still to be able to maintain the temperature in the furnace, air
must be preheated in the air conditioning unit (see below).
3.3 Particle Blower system
A schematic drawing of the particle blower used in the setup is given in Figure 3.8.
The feeding of particles is based on a Venturi eductor that utilizes the kinetic energy
of the high velocity air to create suction. Here air is fed into the system with a
43
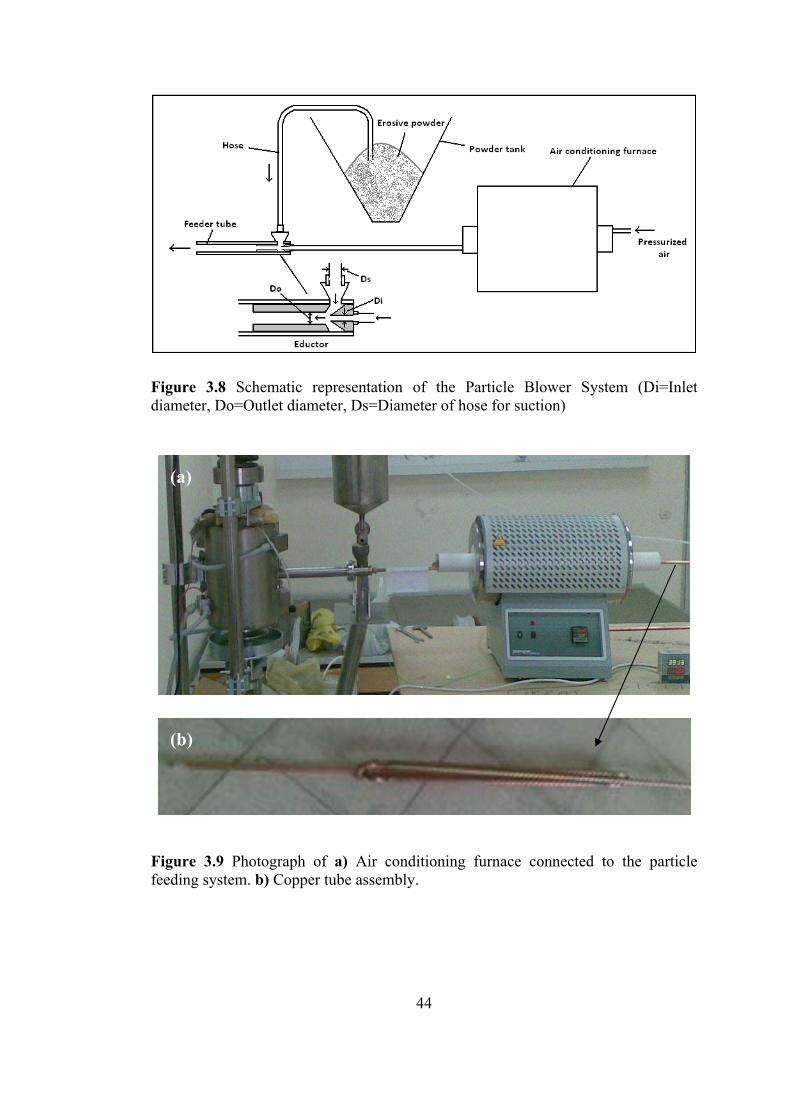
Figure 3.8 Schematic representation of the Particle Blower System (Di=Inlet diameter, Do=Outlet diameter, Ds=Diameter of hose for suction)
(a)
(b)
Figure 3.9 Photograph of a) Air conditioning furnace connected to the particle feeding system. b) Copper tube assembly.
44

45
compressor (0-8 bar) passing though a conditioning furnace. The system allows the
delivery of air with velocity values of up to 50 m/s. The air fed through a thin walled
(1 mm) copper tube (diameter 10 mm) was conditioned by circulating it in a simple
tube furnace, Figure 3.9.
The furnace for air conditioning has a power of 1200 W and can be heated up to
1200oC. The furnace was operated at temperatures less than 600oC due to solder used
in joining the copper tubes in the assembly, Figure 3.9 (b).
The air, heated in the furnace, is fed to the eductor at a 4 mm (Di) diameter nozzle.
The delivery diameter was 6 (Do) mm. The suction side (Ds) was adjustable from
6mm to 12 mm by changing the connecting hose. The feeding amounts in the order
of hose diameter are 0.8g/min, 1.9g/min, 4.5g/min and 7.8g/min. It has been selected
10mm hose diameter. The powder blowing speed is 10±1m/s when the air is at room
temperature.
Nozzle in the feeder tube is subject to intense erosion and as a result it was selected
from B4C. The nozzle needs to be changed after 400 hours of operation due to wear.
The feeder tube is Al2O3 with the diameter of 15mm and the length of 35mm.
Distance between the the tip of the feeder tube and the sample surface is 15mm.
Erosive particles blown on to the sample are diverted by the collar, firm fitted on to
the sample, Figure 4.3. The powders falling from the collar are collected by the
inclined tray (12), see Figure 3.2. This tray has a hole to which a cyclone or a
vacuum system may be attached so as to collect the erosive particles.
Erosive materials used in the experiments are selected from oxides. Al2O3 and SiC
are two possible candidates considered for this purpose. Based on the availability and
the cost the choice was made for Al2O3. Chemical composition of the alumina
powder is given in Table 3.6. As seen in the table, Al2O3 make up 90wt% of the
powder. The other oxides comprise SiO2, TiO2 and Fe2O3.

Table 4.6 Composition of the erosive powder used in the experiments
Materials Weight Conc.%
Al2O3 89.70
SiO2 4.13
CaO 0.87
TiO2 3.63
Fe2O3 1.67
Table 3.7 Erosive powder mesh analysis
Mesh size Particle amount (%)
180 µm 1
250 µm 9
350 µm 34
420 µm 56
The powder has a mean particle size of 300µm. The particles are in the range 180-
420µm (99%), Table 3.7.
3.4 Method of Experiments
Initial experiments with the set-up involved room temperature testing. These were
carried out for the purpose of checking the reproducibility of the erosion taking place
in the samples. Four samples were manufactured from 10CrMo9-10 tubes (EN
10216) [30], outside diameter of which was 38 mm with a wall thickness of 5 mm.
46

47
Duration in the experiments was 20 hours for each specimen. The erosion was
measured by weighing the sample before and after the experiment, i.e. in terms of a
material loss.
Having checked that the set-up produces a reliable result at room temperature,
experiments were carried out at an elevated temperature. Experiment was conducted
for 50 hours at 500oC (±20oC). This temperature was adjusted by considering the
operating temperature of economizer tubes.
As mentioned above, in high temperature experiments furnace atmosphere was
500oC (±20). In order to reach this temperature, furnace should be heated for 1 hour
at 700oC as tube specimen assembled in the system. Then, 5 hour experiment period
the apparatus were closed and furnace atmosphere led to cool down for a while. After
the cooling down, the powders were collected from the collection tray and system
was prepared for following 5 hours experiment period by cleaning. Completing the
50 hour total experiment period the tube sample was ejected from the setup. During
the ejection of the sample from the adaptor the oxide layer, formed during
experiment, was peeled off. Therefore, the material loss comparison cannot be
carried out correctly. Finally, the erosion amounts were compared by examining the
boiler tubes thickness loss. For this reason, 30 mm long specimens were prepared.
This sample preparation technique was explained in chapter 5 more detailed.
48
CHAPTER 4
RESULTS AND DISSCUSSION
Using the setup described in chapter 3, mainly three sets of experiments were carried
out. These were i) reproducibility test carried out i) at room temperature, ii) at
elevated temperature and iii) tests for economizer tubes.
4.1 Room Temperature Testing
Initial experiments with the setup involved room temperature testing. These were
carried out for the purpose of checking the reproducibility of the test result, i.e.
erosion taking place in the samples. Four samples were manufactured from
10CrMo9-10 tubes (EN 10216-2) [11], outside diameter of which, after machining,
was 37 mm with a wall thickness of 5 mm, Table 4.1.
Experiment duration is 20 hours for each specimen. Erosion amount was measured as
material loss. The measured material losses of tube specimens are given in Table
4.2. The values are quite close to each other indicating that the test results are quite
reproducible. The average loss in the samples was 0.05 ± 0.007 g.
4.2 Elevated Temperature Testing
Having checked that the setup produces a reliable result at room temperature,
experiments were carried out at an elevated temperature. For this purpose two
10CrMo910 boiler tube sample were tested.
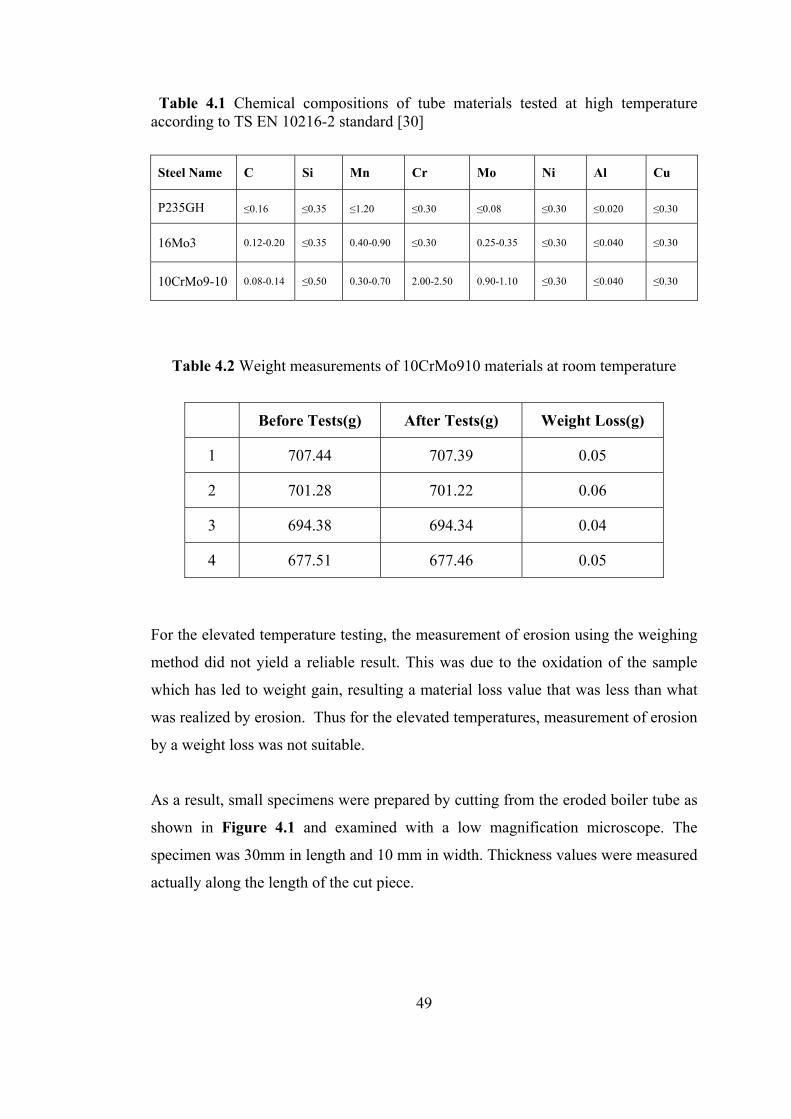
Table 4.1 Chemical compositions of tube materials tested at high temperature according to TS EN 10216-2 standard [30]
Steel Name C Si Mn Cr Mo Ni Al Cu
P235GH ≤0.16 ≤0.35 ≤1.20 ≤0.30 ≤0.08 ≤0.30 ≤0.020 ≤0.30
16Mo3 0.12-0.20 ≤0.35 0.40-0.90 ≤0.30 0.25-0.35 ≤0.30 ≤0.040 ≤0.30
10CrMo9-10 0.08-0.14 ≤0.50 0.30-0.70 2.00-2.50 0.90-1.10 ≤0.30 ≤0.040 ≤0.30
Table 4.2 Weight measurements of 10CrMo910 materials at room temperature
49
Before Tests(g) After Tests(g) Weight Loss(g)
1 707.44 707.39 0.05
2 701.28
701.22 0.06
3 694.38
694.34 0.04
4 677.51 677.46 0.05
For the elevated temperature testing, the measurement of erosion using the weighing
method did not yield a reliable result. This was due to the oxidation of the sample
which has led to weight gain, resulting a material loss value that was less than what
was realized by erosion. Thus for the elevated temperatures, measurement of erosion
by a weight loss was not suitable.
As a result, small specimens were prepared by cutting from the eroded boiler tube as
shown in Figure 4.1 and examined with a low magnification microscope. The
specimen was 30mm in length and 10 mm in width. Thickness values were measured
actually along the length of the cut piece.

Figure 4.1 High temperature test specimens used in experiments (a) Tested tube
Figure 4.2 shows the variation of the wall thickness of the sample in the eroded
his thickness loss value may be used as a measure of material erosion. In fact the
sample (on the right) and zones of prepared specimen (b) Specimen piece prepared for thickness measurements
region. Initially uniform wall thickness reduces as one moves into the eroded region,
reaching a maximum thickness loss value of 0.080 mm at the very center of the
region. The variation of wall thickness is such that thinnest portion of the sample can
be located quite easily. This shows that the maximum value of thickness loss can be
determined at ease.
T
experiment reported above was repeated with a second sample, their test results are
given in Figure 4.3, yielding a thickness loss value of 0.075 mm. The values are
quite close to each other indicating that the thickness loss is nearly as reliable as the
weight loss method used at room temperature.
50

Figure 4.2 Thickness loss values of 1st 10CrMo910 boiler tubes eroded at high temperatures
Figure 4.3 Thickness loss values of 2nd 10CrMo910 boiler tubes eroded at high temperatures
51

Figure 4.4 Thickness loss values of P235GH boiler tubes eroded at high temperatures
Figure 4.5 Thickness loss values of 16Mo3 boiler tubes eroded at high temperatures
52

53
4.3 Testing of Economizer Tubes
Finally we have used this setup to evaluate two economizer materials. These were
P235GH and 16 Mo3 (EN 10216-2) given in Table 4.1 tubes of 37mm diameter
(wall thickness: approx. 2 mm). The erosion amounts were measured by thickness
loss indicated in Figure 4.4 and Figure 4.5. Testing carried out for 50 hours has
yielded thickness loss values of 0.12 and 0.10 mm for P235GH and 16 Mo3 tubes
respectively. This implies that in terms of erosion behavior that 16 Mo3 tubes are
superior to P235GH ones.
According to the tests of economizer tubes 16Mo3 has better erosive durability than
P235GH tubes. It has approximately %20 better erosive durability than P235GH.

54
CHAPTER 5
CONCLUSION
In this thesis, a test setup was developed for testing of boiler tubes used in thermal
power plants. The setup simulates the conditions prevailing in the power plant and
makes it possible the erosion behavior of the tubes to be evaluated on a relative basis.
The setup is composed mainly of three components; i) a unit for sample loading
system, ii) a furnace system to control and monitor the temperature of testing, and iii)
a unit for blowing the abrasive particles.
In the loading system, the sample, simply a portion cut from the tubes, was
connected to a mill with a pin coupling that can be rotated while being loaded with a
spring. The set-up, as designed, is capable of applying tensile force values of up to
30 kN.
Heating system, as designed, would allow testing of boiler tubes up to a temperature
of 650oC. This was made possible with the use of split-tube furnace that houses the
sample. The delivery of abrasive particles with air onto the sample cools down the
chamber so to maintain the temperature, air was preheated in a conditioning unit.
The erosion was achieved by blowing the abrasives onto the rotating sample. This
was made possible by an eductor system that utilizes the kinetic energy of the high
velocity air to create suction onto the powder abrasives. The system allows the
delivery of air with velocity values of up to 50 m/s. Erosive particles used in the
experiments were a mixture of oxides, the greater portion of which was alumina.
The apparatus was tested at room temperatures using four samples from the same
material (10CrMo910). Erosion was quite reproducible since the weight loss values
55
were on average 0.05g with a standard deviation of 0.007g. At elevated temperature,
the measurement of erosion using the weighing method was not possible due to the
oxidation of the sample. It was shown that the erosion in such cases could be
measured by a thickness loss value which was also reproducible. Finally, the set-up
was used for testing of two economizer materials; P235GH and 16Mo3. This has
shown that 16Mo3 had a better performance than P235GH against erosion where the
rate of erosion differed by 20%.
Tubes tested for economizer clearly indicates the usefulness of the setup designed in
the present work. This test could be extended for tubes, which are subject to erosive
wear, in other regions of the boiler. The setup would allow an easy testing of tube
coatings which may be used to minimize erosion.

56
REFERENCES
[1] International Energy Outlook 2010, U.S. Energy Information Administration, July 2010, http://www.eia.doe.gov/oiaf/ieo/pdf/0484(2010).pdf, 2 August 2010. [2] Elektrik Üretim AŞ. 2009 Elektrik Üretim Sektör raporu, http://www.enerji.gov.tr /yayinlar_raporlar/Sektor_Raporu_EUAS_2009.pdf, May 2010. [3] Kömür(Linyit) Sektör Paporu 2009, Türkiye Kömür İşletmeleri Kurumu Genel Müdürlüğü, Ankara 2010, http://www.tki.gov.tr/dosyalar/KömürSektörRaporu2009 .pdf, May 2010. [4] Electric Power Research Institute, Field Guide: Boiler Tubes Failure Report, Theory Section 3-4-5, Appendix A, 2004. [5] Elektrik Üretim AŞ. Gölbaşı Laboratory, Failure Analysis Results (unpublished study), 2008 [6] J.B. Kitto and S.C. Stultz, Steam: its generation and use, Selecter Color Plates, Eddition41, Babcock & Wilcox Company, 2005. [7] Engineering drawing of Çayırhan thermal power plant (taken from the thermal power plant) [8] Angela V. Manolescu and P. Mayer, Structure a8nd Composition of Protective Magnetite on Boiler Tubes, paper No. 174, presented at Corrosion/80 (National Association of Corrosion Engineers), Chicago, Illinois, 3-7 March 1980. [9] H. A. Grabowski and H. A. Klein, Corrosion and Hydrogen Damage in High Pressure Boilers, 2nd Annual Educational Forum on Corrosion, National Association of Corrosion Engineers, September 1964.

57
[10] John P. Hurley, Steven A. Benson, Thomas A. Erickson, Sean E. Allan, Jay Bieber, Project Calcium Topical report, pp1, Energy and Environmetal Research Center, Grand Forks, North Dakota, September,1992. [11] Robert D. Port, Harvey M. Herro, The Nalco Guide to Boiler Failure Analysis, McGraw-Hill Company,1991, pp135, 201-202. [12] R. Viswanathan, Damage Mechanism and Life Assessment of High Temperature Components, ASM International, Third printing, 1995, pp194-195. [13] Boiler Tube Analysis:Reduce Future Boiler Tube Filures E101-3153, The Babcock & Wilcox Company, www.babcock.com [14] Dünya Enerji Konseyi Türk Milli Komitesi (DEK-TMK), Temiz Kömür Teknolojileri Çalışma Grubu, 16 Mart 2010, Ankara. [15] M. Şahin, Effects of Fly Ash and Desulphogypsium on the Strength and Permeability Properties of Çayırhan Soil, December 2005. [16] B. Lindsley, k. Stein and A.R. Marder, The design of a high-temperature erosion apparatus for studying solid particle impact, Energy Research Center, Lehigh University, Bethlehem, USA, 5 December 1994. [17] L. Zhang, V. Sazonov, J. Kent, T. Dixon, V. Novozhilov, Analysis of boiler-tube erosion by the technique of acoustic emission Part I. Mechanical erosion, Wear 250, 2001, pp 762-769 [18] M. Suckling, C. Allen .Critical variables in high temperature erosive wear, Wear 203-204, Cape Town, South Africa, 1997, pp 528-536. [19] Buqian Wang, Seong W. Lee, Erosion–corrosion behaviour of HVOF NiAl–Al2O3 intermetallic-ceramic coating, Wear 239, USA, 1 July 1999, pp83-90. [20] Girish R. Desale, Bhupendra K. Gandhi, S.C. Jain, Effect of erodent properties on erosion wear of ductile type materials, Wear 261, 4 April 2006, pp 914–921.

58
[21] Tylczak, T. Adler, and J. Rawers. Abrasion and Erosion Testing of Materials Used in Power Production From Coal ,J Albany Research Center, USA, 2003 [22] Noriyuki Hayashi, Yoshimi Kagimoto, Akira Notomi, Yasuyuki Takeda, Koji Katoba, Development of new testing method by centrifugal erosion tester at elevated temperature, Wear 258, 22 December 2003, pp 443–457. [23] T.A. Daniel Sagayaraj, S. Suresh, and M. Chandrasekar, Experimental studies on the erosion rate of different heat treated carbon steel economizer tubes of power boilers by fly ash particles, International Journal of Minerals, Metallurgy and Materials Volume 16, Number 5, October 2008, pp 53. [24] D.O. Moumakwa, K. Marcus, Tribology in coal-fired power plants, Tribology International 38, 2005, p 805–811. [25] Mete402 Design Project Report prepared by group T7 4th year studenst of Metallurgical and Materials Engineering Department of Middle East Technical University, 2007 [26] Joseph Edward Shigley, Charles R. Mischke, Mechanical Engneering Design, Fifth addition, McGraw-Hill Book Co., Singapore, 1989, pp332. [27] Compression Spring End Design, http://www.roymech.co.uk/Useful_Tables/ Springs/Springs_helical.html, 2.11.2009. [28] ASTM Sandards, Chrome Silicon - ASTM A 401 Spring Wire Properties [29] Stainless steel AISI 316, http://www.substech.com/dokuwiki/doku.php ?id=stainless_steel_aisi_304 26.06.2008. [30] Institute of Turkish Standards, TS EN 10216-2.Seemless steel tubes for pressure purposes- Technical delivery conditions – Part:2 Non-alloy steel tubes with specified elevated temperature properties, Ankara 2010, in Turkish.