Design of a High Speed High Power Switched Reluctance Motor
206
Design of a High Speed High Power Switched Reluctance Motor Maede Besharati School of Electrical and Electronic Engineering Newcastle University A thesis submitted for the degree of Doctor of Philosophy November 2016
Transcript of Design of a High Speed High Power Switched Reluctance Motor

Design of a High Speed High
Power Switched Reluctance Motor
Maede Besharati
School of Electrical and Electronic Engineering
Newcastle University
A thesis submitted for the degree of
Doctor of Philosophy
November 2016

Abstract
An increase in the price of rare earth materials in 2009 prompted
research into alternative motor technologies without permanent
magnets. The SRMs have become more of an attractive solution as
they are relatively simpler to construct than other machines
technologies hence cost effective. Furthermore, the rugged structure of
the rotor makes it suitable for high speed operation, if appropriately
designed.
This thesis investigates the design, analysis and prototype manufacture
of an SRM, that from electromagnetic point of view, meets the power
output of the PM machine used in the Toyota Prius, although
operating at a higher speed of 50,000 rpm. As a result, the required
torque is considerably less than an equivalent motor with the same
output power running at lower speed, hence this approach allows for
much smaller frame sizes. To achieve the required torque, careful choice
of stator/rotor tooth combination, coil number of turns and number of
phases is needed. Running at high speed, increases the AC copper loss
(consisting of skin effect and proximity effects) and iron loss. These
shortcomings are extensively discussed and investigated.
The mechanical design of this motor requires careful consideration in
order to minimise the high mechanical stresses acting upon the rotor,
which are due to the high radial forces caused by the centripetal force
at high speed. In order to address the mechanical constraints caused by
the hoop stress, a structure common to flywheels is applied to the
rotor. In this approach, the shaft bore is removed and the laminations
are sandwiched together using cheek plates, which are secured using tie
rods. The cheek plates have their extending shafts, which consequently
will transfer the torque to the rest of the system. The proposed model
is analysed for both the electromagnetic and mechanical aspects,
successfully demonstrating a promising rotor topology for the design
speed. A high speed motor design needs to take into account shaft
design, rotor design and bearing design. The high speed operation of
the salient rotor gives dramatic rise to the windage loss. These factors
are carefully considered in this work and the results are presented.

Contents
List of Figures vi
List of Tables x
Nomenclature xi
1 Introduction 1
1.1 Overview . . . . . . . . . . . . . . . . . . . . . . . . . . . . . . . . . . 2
1.2 Publications . . . . . . . . . . . . . . . . . . . . . . . . . . . . . . . . 4
1.3 Contribution to Knowledge . . . . . . . . . . . . . . . . . . . . . . . . 5
2 A Review of Switched Reluctance Motor Technology 6
2.1 Why SRM? . . . . . . . . . . . . . . . . . . . . . . . . . . . . . . . . 8
2.2 SRM Design Methods . . . . . . . . . . . . . . . . . . . . . . . . . . . 9
2.3 SRM Operation . . . . . . . . . . . . . . . . . . . . . . . . . . . . . . 11
2.4 Torque Production . . . . . . . . . . . . . . . . . . . . . . . . . . . . 11
2.5 Control of the SRM for High Speed Operations . . . . . . . . . . . . 15
2.5.1 Advancing The Inverter Commuting Angle . . . . . . . . . . . 15
2.6 SRM Topologies . . . . . . . . . . . . . . . . . . . . . . . . . . . . . . 18
2.6.1 Radial SRMs . . . . . . . . . . . . . . . . . . . . . . . . . . . 18
2.6.2 C-Core Stator SRMs . . . . . . . . . . . . . . . . . . . . . . . 19
2.6.3 Disk Type (Pancake Shaped) SRMs . . . . . . . . . . . . . . . 19
2.6.4 Hybrid SRMs . . . . . . . . . . . . . . . . . . . . . . . . . . . 20
2.7 SRM in Automotive applications . . . . . . . . . . . . . . . . . . . . 21
2.8 Designing an SRM for Toyota Prius, University of Tokyo Experiment 22
2.8.1 Tapered Angles . . . . . . . . . . . . . . . . . . . . . . . . . . 23
2.9 High Speed Motors . . . . . . . . . . . . . . . . . . . . . . . . . . . . 26
2.10 High Speed Switched Reluctance Motors . . . . . . . . . . . . . . . . 31
2.10.1 Benchmark SRM . . . . . . . . . . . . . . . . . . . . . . . . . 35
2.11 Summary . . . . . . . . . . . . . . . . . . . . . . . . . . . . . . . . . 36
ii

CONTENTS
3 Mechanical Design Methodology 38
3.1 Mechanical Stresses . . . . . . . . . . . . . . . . . . . . . . . . . . . . 38
3.1.1 Notch Effect . . . . . . . . . . . . . . . . . . . . . . . . . . . . 39
3.1.2 Tangential (Hoop) Stress . . . . . . . . . . . . . . . . . . . . . 39
3.1.3 Lame Equation for Defining Stresses on a Disk . . . . . . . . . 40
3.1.4 Simulation Assumptions . . . . . . . . . . . . . . . . . . . . . 41
3.2 Rotor Vibrations . . . . . . . . . . . . . . . . . . . . . . . . . . . . . 42
3.2.1 Rotor Slenderness (Aspect Ratio) . . . . . . . . . . . . . . . . 42
3.2.2 Vibration Modes . . . . . . . . . . . . . . . . . . . . . . . . . 43
3.2.3 Predicting the Critical Speeds using Rayleigh’s Method . . . . 45
3.2.4 Predicting Critical Speed Using the FEA Method . . . . . . . 46
3.3 Bearings . . . . . . . . . . . . . . . . . . . . . . . . . . . . . . . . . . 46
3.3.1 Bearing Types . . . . . . . . . . . . . . . . . . . . . . . . . . . 46
3.3.2 Bearing Selection . . . . . . . . . . . . . . . . . . . . . . . . . 47
3.3.3 Bearing Mounting Types . . . . . . . . . . . . . . . . . . . . . 48
3.3.4 Pre-load . . . . . . . . . . . . . . . . . . . . . . . . . . . . . . 49
3.3.5 Bearing Specification . . . . . . . . . . . . . . . . . . . . . . . 50
3.4 Shaft . . . . . . . . . . . . . . . . . . . . . . . . . . . . . . . . . . . . 50
3.4.1 Tip Speed . . . . . . . . . . . . . . . . . . . . . . . . . . . . . 52
3.5 Balancing . . . . . . . . . . . . . . . . . . . . . . . . . . . . . . . . . 52
3.6 Acoustic Noise . . . . . . . . . . . . . . . . . . . . . . . . . . . . . . 52
3.7 Windage Loss . . . . . . . . . . . . . . . . . . . . . . . . . . . . . . . 53
3.8 Conclusion . . . . . . . . . . . . . . . . . . . . . . . . . . . . . . . . . 53
4 Electromagnetic Design Methodology 55
4.1 Introduction to SRMs and their Operation . . . . . . . . . . . . . . . 56
4.1.1 The Aligned Position . . . . . . . . . . . . . . . . . . . . . . . 56
4.1.2 The Unaligned Position . . . . . . . . . . . . . . . . . . . . . 56
4.1.3 SRM Operation Principle . . . . . . . . . . . . . . . . . . . . 56
4.1.4 Equivalent Circuit . . . . . . . . . . . . . . . . . . . . . . . . 58
4.2 Design Investigation . . . . . . . . . . . . . . . . . . . . . . . . . . . 59
4.2.1 Number of Phases . . . . . . . . . . . . . . . . . . . . . . . . . 60
4.2.2 Stator/Rotor Teeth Combination . . . . . . . . . . . . . . . . 60
4.2.3 Analytical Design . . . . . . . . . . . . . . . . . . . . . . . . . 61
4.2.4 Coil Design and Number of Turns . . . . . . . . . . . . . . . . 62
4.2.5 Air Gap . . . . . . . . . . . . . . . . . . . . . . . . . . . . . . 63
4.3 Motor Specification Investigation . . . . . . . . . . . . . . . . . . . . 63
4.4 DC Voltage . . . . . . . . . . . . . . . . . . . . . . . . . . . . . . . . 64
4.5 Conclusion . . . . . . . . . . . . . . . . . . . . . . . . . . . . . . . . . 64
iii

CONTENTS
5 Mechanical Design Investigation 65
5.1 FEA model for Mechanical Analysis . . . . . . . . . . . . . . . . . . . 66
5.1.1 Simulation Assumptions . . . . . . . . . . . . . . . . . . . . . 66
5.2 Design Process . . . . . . . . . . . . . . . . . . . . . . . . . . . . . . 67
5.3 Mechanical Analysis . . . . . . . . . . . . . . . . . . . . . . . . . . . 68
5.3.1 Conventional SRM Rotor Topology . . . . . . . . . . . . . . . 68
5.3.2 Addressing The Notch Effect . . . . . . . . . . . . . . . . . . . 68
5.3.3 Addressing The Tangential Stress . . . . . . . . . . . . . . . . 69
5.3.4 Flywheel Structure . . . . . . . . . . . . . . . . . . . . . . . . 70
5.3.5 Physical Features of the Proposed Model . . . . . . . . . . . . 72
5.4 Vibration Frequencies . . . . . . . . . . . . . . . . . . . . . . . . . . . 78
5.4.1 Bearing Stiffness . . . . . . . . . . . . . . . . . . . . . . . . . 78
5.4.2 Vibration Modes . . . . . . . . . . . . . . . . . . . . . . . . . 79
5.4.3 Spring Pre-Load . . . . . . . . . . . . . . . . . . . . . . . . . 80
5.5 Conclusion . . . . . . . . . . . . . . . . . . . . . . . . . . . . . . . . . 80
6 Further Electromagnetic Design Investigation 82
6.1 Rotor Structure Development . . . . . . . . . . . . . . . . . . . . . . 83
6.1.1 Rotor Tooth Width (tr) . . . . . . . . . . . . . . . . . . . . . 83
6.1.2 Tie Rod Cutting Location (Trr) . . . . . . . . . . . . . . . . . 83
6.1.3 Diameter of the Fillet at the Bottom of Rotor Tooth (hr) . . . 85
6.2 Static Simulation . . . . . . . . . . . . . . . . . . . . . . . . . . . . . 85
6.2.1 Two Dimensional FEA Simulation Results . . . . . . . . . . . 86
6.2.2 Three Dimensional FEA Simulation Results . . . . . . . . . . 88
6.3 Dynamic Simulation . . . . . . . . . . . . . . . . . . . . . . . . . . . 90
6.3.1 Dynamic Simulations at Base Speed . . . . . . . . . . . . . . . 90
6.3.2 Dynamic Simulations at Full Speed . . . . . . . . . . . . . . . 93
6.4 Losses . . . . . . . . . . . . . . . . . . . . . . . . . . . . . . . . . . . 93
6.4.1 DC Winding Loss . . . . . . . . . . . . . . . . . . . . . . . . . 94
6.4.2 AC Winding Loss . . . . . . . . . . . . . . . . . . . . . . . . . 95
6.4.3 Iron Loss . . . . . . . . . . . . . . . . . . . . . . . . . . . . . 100
6.4.4 Eddy Current at Tie Rods . . . . . . . . . . . . . . . . . . . . 101
6.4.5 Windage Loss . . . . . . . . . . . . . . . . . . . . . . . . . . . 101
6.5 Efficiency Map . . . . . . . . . . . . . . . . . . . . . . . . . . . . . . 104
6.6 Conclusion . . . . . . . . . . . . . . . . . . . . . . . . . . . . . . . . . 107
7 Prototype Construction 108
7.1 Static Test Prototype . . . . . . . . . . . . . . . . . . . . . . . . . . . 108
7.1.1 Stator Laminations . . . . . . . . . . . . . . . . . . . . . . . . 108
7.1.2 Slot Insulation . . . . . . . . . . . . . . . . . . . . . . . . . . 111
7.1.3 Coils . . . . . . . . . . . . . . . . . . . . . . . . . . . . . . . . 111
iv

CONTENTS
7.1.4 Rotor Laminations . . . . . . . . . . . . . . . . . . . . . . . . 115
7.1.5 Cheek Plates . . . . . . . . . . . . . . . . . . . . . . . . . . . 116
7.1.6 Tie Rods . . . . . . . . . . . . . . . . . . . . . . . . . . . . . . 117
7.1.7 Rotor Assembly . . . . . . . . . . . . . . . . . . . . . . . . . . 119
7.2 Modified Construction for Spin Testing . . . . . . . . . . . . . . . . . 121
7.2.1 Soft Mounting Bearing . . . . . . . . . . . . . . . . . . . . . . 121
7.2.2 Probes . . . . . . . . . . . . . . . . . . . . . . . . . . . . . . . 122
7.2.3 Balancing . . . . . . . . . . . . . . . . . . . . . . . . . . . . . 123
7.2.4 Spin Test Drive Technique . . . . . . . . . . . . . . . . . . . . 123
7.3 Case and End Caps for Static Test . . . . . . . . . . . . . . . . . . . 125
7.4 Final Assembly . . . . . . . . . . . . . . . . . . . . . . . . . . . . . . 125
7.5 Conclusion . . . . . . . . . . . . . . . . . . . . . . . . . . . . . . . . . 126
8 Testing and Analysis 128
8.1 Electromagnetic Tests . . . . . . . . . . . . . . . . . . . . . . . . . . 128
8.1.1 DC Resistance . . . . . . . . . . . . . . . . . . . . . . . . . . . 130
8.1.2 Flux Linkage . . . . . . . . . . . . . . . . . . . . . . . . . . . 131
8.1.3 Static Torque . . . . . . . . . . . . . . . . . . . . . . . . . . . 134
8.1.4 Thermal Behaviour . . . . . . . . . . . . . . . . . . . . . . . . 137
8.2 Mechanical Tests . . . . . . . . . . . . . . . . . . . . . . . . . . . . . 138
8.2.1 Test Set Up . . . . . . . . . . . . . . . . . . . . . . . . . . . . 139
8.2.2 Spin Test Results . . . . . . . . . . . . . . . . . . . . . . . . . 139
8.3 Conclusion . . . . . . . . . . . . . . . . . . . . . . . . . . . . . . . . . 144
9 Conclusion 146
9.1 Introduction . . . . . . . . . . . . . . . . . . . . . . . . . . . . . . . . 146
9.1.1 Electromagnetic Design Process . . . . . . . . . . . . . . . . . 146
9.1.2 Static Simulation . . . . . . . . . . . . . . . . . . . . . . . . . 147
9.1.3 Dynamic Simulation . . . . . . . . . . . . . . . . . . . . . . . 147
9.2 Mechanical Design Process . . . . . . . . . . . . . . . . . . . . . . . . 148
9.2.1 Mechanical Stresses . . . . . . . . . . . . . . . . . . . . . . . . 148
9.2.2 Rotor Vibration . . . . . . . . . . . . . . . . . . . . . . . . . . 150
9.3 Prototype Construction . . . . . . . . . . . . . . . . . . . . . . . . . . 150
9.4 Motor Testing . . . . . . . . . . . . . . . . . . . . . . . . . . . . . . . 152
9.4.1 Electromagnetic Tests . . . . . . . . . . . . . . . . . . . . . . 152
9.4.2 Mechanical Tests . . . . . . . . . . . . . . . . . . . . . . . . . 153
9.5 Comparison to Motors with Similar Specification . . . . . . . . . . . 153
9.6 Recommendations for Future Research . . . . . . . . . . . . . . . . . 154
A Photographs and Mechanical Drawings 156
References 177
v

List of Figures
2.1 Rare Earth Metal Prices compared with Gold . . . . . . . . . . . . . 7
2.2 Rare Earth Metal Prices . . . . . . . . . . . . . . . . . . . . . . . . . 7
2.3 World Motor Vehicle Annual Production . . . . . . . . . . . . . . . . 8
2.4 SRM Operation . . . . . . . . . . . . . . . . . . . . . . . . . . . . . . 12
2.5 A Sample Magentizattion curve SRM. . . . . . . . . . . . . . . . . . . 13
2.6 Induction and Torque profile . . . . . . . . . . . . . . . . . . . . . . . 14
2.7 Asymmetric Bridge Converter . . . . . . . . . . . . . . . . . . . . . . 15
2.8 Conventional Drive Circuit Modes for an SRM . . . . . . . . . . . . . 16
2.9 Single Pulse Mode to Continuous Current Operation . . . . . . . . . 17
2.10 Simple SRM . . . . . . . . . . . . . . . . . . . . . . . . . . . . . . . . 18
2.11 Schematic of a Multi Layer C-Core SRM . . . . . . . . . . . . . . . . 19
2.12 Pancake Shaped C-Core SRM . . . . . . . . . . . . . . . . . . . . . . 20
2.13 Hybrid SRM . . . . . . . . . . . . . . . . . . . . . . . . . . . . . . . . 21
2.14 Torque Improvement Techniques . . . . . . . . . . . . . . . . . . . . . 24
2.15 Speed vs Power Plot for different machine topologies . . . . . . . . . 28
2.16 Speed vs Power Plot for Different Machine Topology . . . . . . . . . 30
2.17 Plot of Speed vs High Speed Index by for Various Machine Topologies 31
2.18 Rotor Designed for 750,000rpm Rotational Speed with Carbon Fibre
Sleeves . . . . . . . . . . . . . . . . . . . . . . . . . . . . . . . . . . . 33
2.19 Rotor Designed for 50,000rpm Rotational Speed Using Flux Bridges . 33
2.20 Non-uniform Air Gap in a High Speed SRM . . . . . . . . . . . . . . 35
3.1 The Rotor Coordiante System for Stress Analysis . . . . . . . . . . . 39
3.2 Hoop Stress Definition . . . . . . . . . . . . . . . . . . . . . . . . . . 40
3.3 Radial and Tangential Stress Behaviour for a Generic Disk (Left) and
a Generic Disk with a Central Hole (Right). . . . . . . . . . . . . . . 41
3.4 The Bounce, Rock, First and Second Bending Resonant Modes. . . . 43
3.5 Main Parameter for Evaluating Critical Speed . . . . . . . . . . . . . 45
3.6 Single Angular Contact Bearing. . . . . . . . . . . . . . . . . . . . . . 48
3.7 Angular Contact Bearing Connections, Back to Back (Left) and
Tandem (Right) . . . . . . . . . . . . . . . . . . . . . . . . . . . . . . 49
4.1 Coenergy and Stored Field Energy . . . . . . . . . . . . . . . . . . . 57
vi

LIST OF FIGURES
4.2 Equivalent Circuit of a Single Phase . . . . . . . . . . . . . . . . . . . 59
5.1 Stress Analysis of a Conventional SRM . . . . . . . . . . . . . . . . . 69
5.2 Stress Analysis of a Conventional SRM with Added Fillets . . . . . . 70
5.3 Flywheel Simple Schematic . . . . . . . . . . . . . . . . . . . . . . . . 71
5.4 Pullen Patent . . . . . . . . . . . . . . . . . . . . . . . . . . . . . . . 71
5.5 Rotor Simple Schematic with a Flywheel Structure . . . . . . . . . . 72
5.6 Detailed Drawing Dimensions of The Proposed Rotor . . . . . . . . . 73
5.7 Tie Rod Cutting Diameter Vs. Equivalent stress . . . . . . . . . . . . 74
5.8 Tie Rod Location From Centre Vs. Equivalent stress . . . . . . . . . 74
5.9 Rotor Tooth Width Vs Torque . . . . . . . . . . . . . . . . . . . . . . 75
5.10 Stress Analysis of the proposed Rotor . . . . . . . . . . . . . . . . . . 77
5.11 Stress Analysis of the proposed Rotor with a Shaft Hole . . . . . . . 77
5.12 Deflection of a Pre-load spring . . . . . . . . . . . . . . . . . . . . . . 80
6.1 Rotor Tooth Width . . . . . . . . . . . . . . . . . . . . . . . . . . . . 84
6.2 Tie Rod Location . . . . . . . . . . . . . . . . . . . . . . . . . . . . . 84
6.3 Rotor Bottom OD . . . . . . . . . . . . . . . . . . . . . . . . . . . . 85
6.4 Model Used for 2D Static Simulation . . . . . . . . . . . . . . . . . . 86
6.5 Winding Current Direction . . . . . . . . . . . . . . . . . . . . . . . . 87
6.6 Flux Density . . . . . . . . . . . . . . . . . . . . . . . . . . . . . . . 87
6.7 Expanded Magnetisation Curve. . . . . . . . . . . . . . . . . . . . . . 88
6.8 Model Used for 3D Static Simulation . . . . . . . . . . . . . . . . . . 89
6.9 Comparison of Magnetization Curves for a 2D and 3D FE Model . . . 89
6.10 Torque Vs. Rotor Position Using the 3D FEA Model . . . . . . . . . 90
6.11 Square Wave Phase Current Used for Control at Base Speed . . . . . 91
6.12 Advancing the Stator Excitation Angle . . . . . . . . . . . . . . . . . 92
6.13 Transient Torque Vs. Rotor Position at the Base Speed . . . . . . . . 92
6.14 Square Wave Phase Current Used for Control at Full Speed . . . . . . 93
6.15 Transient Torque Vs. Rotor Position at 50,000 rpm . . . . . . . . . . 94
6.16 Skin Effect . . . . . . . . . . . . . . . . . . . . . . . . . . . . . . . . . 95
6.17 An Example of Proximity Effect . . . . . . . . . . . . . . . . . . . . . 96
6.18 Proximity Effect in an Electrical Machine Coil . . . . . . . . . . . . . 97
6.19 Current Density in the Conductors of a Coil Inside the Slot . . . . . . 98
6.20 Comparison of Current Density in A Solid vs Finely Stranded Conductor 99
6.21 Ohmic Loss in the Solid Conductors Inside the Slot . . . . . . . . . . 99
6.22 Ohmic Loss in the Finely Stranded Conductor . . . . . . . . . . . . . 100
6.23 Magnetic Field Solution at Full Speed . . . . . . . . . . . . . . . . . . 101
6.24 Tie Rod Current Density . . . . . . . . . . . . . . . . . . . . . . . . . 102
6.25 Windage Loss Comparison . . . . . . . . . . . . . . . . . . . . . . . . 104
6.26 Efficiency Map Considering a Salient Pole Rotor . . . . . . . . . . . . 106
vii

LIST OF FIGURES
6.27 Efficiency Map Considering a Cylindrical Rotor . . . . . . . . . . . . 106
7.1 One Stator Laminate . . . . . . . . . . . . . . . . . . . . . . . . . . . 109
7.2 Stack of Stator Lamination in the Case . . . . . . . . . . . . . . . . . 110
7.3 Stator Lamination Lock Ring . . . . . . . . . . . . . . . . . . . . . . 110
7.4 Coil Forming Bobbin . . . . . . . . . . . . . . . . . . . . . . . . . . . 112
7.5 Pressed Coil with 5 Turns . . . . . . . . . . . . . . . . . . . . . . . . 113
7.6 Coils, Nomex and Tufnol Insulations . . . . . . . . . . . . . . . . . . 114
7.7 Tying Cords, Heat Shrinks and Thermal Coupling . . . . . . . . . . . 114
7.8 Phase Winding Series Connection . . . . . . . . . . . . . . . . . . . . 115
7.9 One Rotor Laminate of Each Rotor Topology . . . . . . . . . . . . . 116
7.10 Fully Manufactured Cheek Plate . . . . . . . . . . . . . . . . . . . . . 117
7.11 Bearing Locating Ring . . . . . . . . . . . . . . . . . . . . . . . . . . 118
7.12 Rotor Tie Rods . . . . . . . . . . . . . . . . . . . . . . . . . . . . . . 118
7.13 Roughly Made Cheek Plate . . . . . . . . . . . . . . . . . . . . . . . 119
7.14 Static Rotor . . . . . . . . . . . . . . . . . . . . . . . . . . . . . . . . 120
7.15 Bearing Assembled On the Rotor . . . . . . . . . . . . . . . . . . . . 120
7.16 Soft Mounted Bearing System . . . . . . . . . . . . . . . . . . . . . . 121
7.17 Fitted Magnet on the Rotor Shaft, Potted Thermocouple and
Accelerometer Stud . . . . . . . . . . . . . . . . . . . . . . . . . . . . 122
7.18 Fitted O’rings on the Bearing Cups . . . . . . . . . . . . . . . . . . . 123
7.19 Volute of The Compressor Wheel, The Side Tube is Exhaust and the
Middle One is the Inlet. . . . . . . . . . . . . . . . . . . . . . . . . . 124
7.20 Air Redirection Sleeve . . . . . . . . . . . . . . . . . . . . . . . . . . 125
7.21 Static Test Rig . . . . . . . . . . . . . . . . . . . . . . . . . . . . . . 126
8.1 Static Test Set Up . . . . . . . . . . . . . . . . . . . . . . . . . . . . 129
8.2 Rotor Mounted on The Test Rig and The Rotary Table . . . . . . . . 130
8.3 DC Resistance Test Circuit . . . . . . . . . . . . . . . . . . . . . . . 130
8.4 The Voltage and Current Pulses Used to Calculate the ψ − I Curves 132
8.5 The Start and End Points of The Rise and Fall Transients . . . . . . 133
8.6 Generic Flux Linkage vs Current . . . . . . . . . . . . . . . . . . . . 133
8.7 Flux Linkage vs Current . . . . . . . . . . . . . . . . . . . . . . . . . 135
8.8 Effect of Reduced Permeability on the Aligned Curve . . . . . . . . . 135
8.9 Static Torque Result . . . . . . . . . . . . . . . . . . . . . . . . . . . 136
8.10 Static Torque Comparison Between Test and Simulation Results . . . 137
8.11 Thermal Test Result . . . . . . . . . . . . . . . . . . . . . . . . . . . 138
8.12 Mechanical Test Set Up . . . . . . . . . . . . . . . . . . . . . . . . . 140
8.13 Mechanical Test Rig and Set Up . . . . . . . . . . . . . . . . . . . . . 140
8.14 Speed Test Result of Rotor1 . . . . . . . . . . . . . . . . . . . . . . . 141
8.15 Temperature rise of the bearing of Rotor1 . . . . . . . . . . . . . . . 142
viii

LIST OF FIGURES
8.16 Evidence of Damage on the Compressor Wheel . . . . . . . . . . . . . 142
8.17 Speed Test Result of Rotor2 . . . . . . . . . . . . . . . . . . . . . . . 143
8.18 Temperature rise of the bearing of Rotor2 . . . . . . . . . . . . . . . 144
A.1 Wire Erosion Machine . . . . . . . . . . . . . . . . . . . . . . . . . . 157
A.2 Stator and Case . . . . . . . . . . . . . . . . . . . . . . . . . . . . . . 157
A.3 End Windings . . . . . . . . . . . . . . . . . . . . . . . . . . . . . . . 158
ix

List of Tables
2.1 Phase and Pole combination . . . . . . . . . . . . . . . . . . . . . . . 10
2.2 Comparison of the IPMSM in the Second Generation of Toyota Prius
and a Competitive SRM . . . . . . . . . . . . . . . . . . . . . . . . . 25
2.3 Comparison of the IPMSM in the Third Generation of Toyota Prius
and a Competitive SRM . . . . . . . . . . . . . . . . . . . . . . . . . 26
2.4 Comparison of SRM1 and the Designed SRM . . . . . . . . . . . . . 36
3.1 Bearing Specification . . . . . . . . . . . . . . . . . . . . . . . . . . . 50
3.2 Torsion in Shaft Parameters . . . . . . . . . . . . . . . . . . . . . . . 52
4.1 Detailed Specifications of SRM1 . . . . . . . . . . . . . . . . . . . . . 55
4.2 Detailed Specifications of SRM . . . . . . . . . . . . . . . . . . . . . 63
5.1 Detailed Specifications of SRM1 . . . . . . . . . . . . . . . . . . . . . 66
5.2 Materials Used in The Motor Construction . . . . . . . . . . . . . . . 76
5.3 The Optimised Rotor Physical Specifications . . . . . . . . . . . . . . 78
5.4 The Vibration Modes and Their Frequencies . . . . . . . . . . . . . . 79
6.1 Loss Type Contribution at Base Speed and Full Speed with Full Power105
9.1 Specification Comparison of the Toyota Prius, SRM1 and the
Designed SRM . . . . . . . . . . . . . . . . . . . . . . . . . . . . . . 154
x

Nomenclature
Symbol and Description Units
2D 2 Dimensional -
3D 3 Dimensional -
a Disk Radius mm
Ab Bearing Cross Sectional Area mm2
Ac Cross Sectional Area of the Conductor mm2
Aslot Stator Slot Area mm2
b Radius of the Central Hole of Disk mm
Bcu−peak Peak Flux Density within the Conductor T
d Bearing Bore Diameter mm
D Bearing Outside Diameter mm
B Bearing Width mm
BPeak Peak Flux Density T
Bg Air gap Flux Density T
Rbs Radius of the Bottom of the Stator Slot mm
Cd Drag Coefficient -
Da Shaft Diameter mm
dc Conductor Diameter mm
dw Diameter of the Wire mm
E Young’s Modulus Pa
e EMF V
xi

NOMENCLATURE
F Pre-load Force N
f Frequency Hz
Fc Centrifugal Force N
fe Electrical Frequency Hz
ff Fundamental frequency Hz
rr Rotor Radius mm
fn First Natural Frequency Hz
fph Phase Switching Frequency Hz
fs Switching Frequency of Supply Hz
H Rotor Pole Height mm
hr Fillet Radius mm
i Phase Current/Constant Current A
Irms RMS Phase Current A
J Current Density A/mm2
JP Polar Second Moment of Area mm4
K Salient Pole Coefficient -
k Pre-load spring Stiffness N/m
ka Anomalous Eddy Current Loss Coefficient -
ke Eddy Current Loss Coefficient -
kh Hysteresis Loss Coefficient -
Khp Hybrid Ball Bearing Pair Stiffness N/m
Khs Single Hybrid Ball Bearing Stiffness N/m
Ksteel Steel Ball Bearing Stiffness N/m
KTotal Single Bearing Total Three Dimensional Stiffness N/m
L Self Inductance H
l Bearing to Bearing Distance mm
La Aligned Inductance H
xii

NOMENCLATURE
Lc Total Conductor Length mm
Le End Winding Length mm
LF Full Rotor Length mm
LFe Active Rotor Length mm
Lmax Maximum Inductance H
Lmin Minimum Inductance H
Ls Stack Length mm
Lsh Shaft Length mm
Lst Stack Length mm
Lu Unaligned Inductance H
m Mass Kg
MMF Magnetomotive Force A
N Number of Turns -
n Rated Speed rpm
Np Number of Winding Turns -
Nr Number of Rotor Poles -
ns Steinmetz Constant -
Ns Number of Stator Poles -
Nst Number of Strands in One Conductor Turn of a Coil -
P Output Power W
Pa Anomalous Eddy Current Loss W
Pcu Copper Loss W
Pcu−eddy Eddy Copper Loss W
PCu,prox Proximity Loss W
Pe Eddy Current Loss W
PFe Core Loss W
Ph Hysteresis Loss W
xiii

NOMENCLATURE
Pi Input Electrical Power W
Po Output Power W
q Number of Phases -
R Resistance Ω
R Stator Winding Resistance per Phase Ω
r Radial Distance From Centre mm
Rc Single Conductor Turn Resistance Ω
rc Radius of the Rotating System mm
Re Reynolds Number -
ROD Rotor Outer Diameter mm
Rp Total Phase Resistance Ω
Se Equivalent or Von Mises Stress Pa
SOD Stator Outer Diameter mm
t Airgap Length mm
T Torque Nm
tr Rotor Tooth Width mm
TrD Tie Rod Radius mm
Trr Tie Rod Radial Distance From Centre mm
ty Stator Core Back Thickness mm
v Poisson’s Ratio -
Vtip Tip Speed m/s
We Input Electrical Energy W
Wf Field Stored Energy W
W ′ Co-energy W
Vs Supply Voltage V
yr Rotor Yoke Outer Diameter mm
yz Shaft Deflection mm
xiv

NOMENCLATURE
yz0 Maximum Shaft Deflection mm
z Axial Distance on the Shaft mm
α Rotor Active Length to Full Length Ratio -
βr Rotor Pole Arc Deg
βs Stator Pole Arc Deg
δ Deflection mm
θ Rotor Angular Position Deg
λ Rotor Pole Pitch Deg
λmax Maximum Rotor Slenderness -
λs Rotor Slenderness -
µ Viscosity of Air P
η Efficiency %
µ0 Permeability of Free Space H/m
µr Relative Permeability of the Conductive Material H/m
ρ Electric Resistivity Ω m
ρair Density of Air K/m3
ρc Resistivity of conductor Ω m
σ Airgap Shear Stress KNm/m3
σθ Tangential Stress of a Plate Pa
σθh Tangential Stress of a Disk with a Central Hole Pa
σr Radial Stress of a Disk Pa
σrh Radial Stress of a Disk with a Central Hole Pa
τ Sheer Stress Pa
ψ Flux Linkage Wb
ω Angular Velocity rad/s
CNC Computer Numerical Control
xv

NOMENCLATURE
DAQ Data Acquisition
EDM Electrical Discharge Machining
EPSRC Engineering and Physical Sciences Research Council
EV Electric Vehicle
FEA Finite Element Analysis
FF Fill Factor
HEV Hybrid Electric Vehicle
ICE Internal Combustion Engine
IM Induction Motor
IPM Interior Permanent Magnet
IPMSM Interior Permanent Magnet Synchronous Motor
LCM Lowest Common Multiple
NdFeB Neodymium Iron Boron
PMSM Permanent Magnet Synchronous Motor
SRM Switched Reluctance Motor
TENV Totally Enclosed Not Ventilated
VESI Vehicle Electrical System Integration
xvi

Chapter 1
Introduction
This work focuses on developing a magnet free motor designed to meet the
specification of the permanent magnet motor used in the third generation Toyota
Prius. The Toyota Prius is chosen as it was the bestselling hybrid electric vehicle
at the commencement of the thesis study. The volatility in the price of rare earth
magnetic materials has created a demand for magnet free alternatives. Switched
Reluctance Motors (SRM) are a great candidate as the rotor does not have brushes
or any rare earth magnetic materials. In particular, high speed SRMs require less
torque for a given power and hence a smaller size of motor which makes the design
more cost-effective. SRMs are suitable for high speed applications as the rotor is
robust with a simple structure. This thesis aims to push the rotor structural design
to very high speeds relative to its size, which gives rise to significant mechanical
stresses and implementation problems. The mechanical design of the motor is
therefore of great importance. From an electromagnetic point of view, high speed
operation results in an increase in losses particularly soft magnetic and AC
winding loss that need to be mitigated. To achieve this an alternative approach to
rotor design was needed to mitigate the high stresses involved. A novel approach
to the rotor design has been implemented, the shaft has been removed from the
rotor stack, removing an area of very high stress concentration. This includes
removing the shaft bore from the laminations and using cheek plates to sandwich
the laminations. These cheek plates each have their own extending shaft and the
are secured using tie bars. This structure is a common topology used in flywheels.
The implementation of a flywheel type topology to an SRM motor has not been
studied before and therefore presents design challenges that are investigated in this
work. This research resulted in the development and testing of a 50,000 rpm,
60 kW motor with a robust rotor allowing high speed, high power operation.
This thesis work is part of the Vehicle Electrical System Integration (VESI)
Consortium which Newcastle University and London City University are two of the
multiple academic and industrial partners. VESI is funded by The UK Engineering
and Physical Sciences Research Council (EPSRC).
1

Chapter 1. Introduction
1.1 Overview
A review of existing research into SRMs is presented in chapter two. The review
focuses on three major areas; the general operation of SRMs and the suggested
modifications to improve the output, the research dedicated to design of an
alternative SRM of the same specification to match the PM used in the Toyota
Prius, and an overview of high speed electric motor design.
Chapter three provides the mechanical design methodology for a high speed SRM.
The high speed operation of a large motor amplifies the mechanical stresses
imposed upon the motor caused by the centrifugal force, as the stresses are directly
proportional to the square of speed and radius. Furthermore, identifying the
natural frequencies of the rotor is important in ensuring a safe operation as there is
a risk of failure if the operational speed approaches the critical speed of the rotor.
This high speed application necessitates the careful choice of a suitable bearing for
a precise and safe operation. Different bearing types and mounting techniques are
discussed in chapter three with the final choice of the bearings explained.
The operating principle of SRMs is discussed in chapter four, with a focus on the
analytical electromagnetic design method. The methods for selecting the number of
phases, choice of the stator/rotor tooth combination, the coil number of turns and
the length of the air gap are discussed. Using an analytical method, the frame size,
tooth width and core back width are calculated.
During chapter five, the mechanical constraints are investigated, this is carried out
ensuring the rotor outer diameter is pushed to its limits before mechanical failure
occurs, which in turn ensures the maximum possible output torque. A series of
possible approaches to address the high stresses are investigated including the
implementation of a flywheel type topology to the rotor. The choice of materials
for different motor components are explained and the rotor vibration modes and
their respective frequencies are estimated.
In chapter six the electromagnetic behaviour of the proposed motor is investigated.
This for a high speed application must be taken into account in parallel with the
mechanical design to ensure the rotor specifications are pushed to their limits before
failure and to ensure the maximum electromagnetic output. This includes the static
and transient output torque, as well as the calculation of losses such as AC copper
loss and the iron loss. It is important to calculate the windage loss of a high speed
SRM as it is proportional to the angular velocity cubed and the forth power of the
rotor radius. The combination of the calculated losses is used to create an efficiency
map with respect to the torque and the angular velocity.
In chapter seven the construction of the high speed SRM is presented. The process
of building the stator, the rotor and the coils are explained in detail. The more
2

Chapter 1. Introduction
complex construction of the prototype rotors for the spin test is also presented.
Extra stages are added to the spin test rotor manufacturing to ensure mechanical
precision and alignment.
Chapter eight presents a series of tests to investigate the operation of the motor and
to verify the Finite Element Analysis (FEA) results. The tests are performed in
two parts: electromagnetic and mechanical tests. The electromagnetic test results
are used to prove the output torque value obtained from the simulations. The
mechanical tests are carried out by spinning the rotor up to 50,000 rpm whilst
monitoring the vibration frequencies of the rotor and the bearing temperature.
Chapter nine provides a conclusion of this research work and suggests research areas
for further investigation.
3

Chapter 1. Introduction
1.2 Publications
The following peer reviewed conference proceedings and publications are the result
of this research work;
(1) M Besharati, K R Pullen, J D Widmer, G Atkinson, V Pickert.
“Investigation of the Mechanical Constraints on the Design of a
Super-high-speed Switched Reluctance Motor for Automotive Traction” In:
7th IET International Conference on Power Electronics, Machines and Drives
(PEMD) 2014, Manchester, UK, 2014.
Abstract - This paper presents a novel Switched Reluctance Motor (SRM)
for automotive traction applications. The electromagnetic and mechanical
simulation results of the proposed motor are presented for operation at
50,000 rpm. The SRM is designed to withstand the rotor stresses due to the
centrifugal force whilst producing an output power of 60 kW. The simulation
results confirm that the stresses forced on the rotor in the proposed topology
are below the yield strength of the material with a safety factor of 1.2.
Fatigue life may be an issue and will be investigated in the future. The high
speed operation allows for a smaller overall size, which in turn leads to lower
manufacturing costs. This combined with high output power makes this
design a good candidate for use in mass production hybrid electric vehicles.
(2) M Besharati, J D Widmer, G Atkinson, V Pickert, J Washington.
“Super-High-Speed Switched Reluctance Motor for Automotive Traction” In:
2015 IEEE Energy Conversion Congress and Exposition (ECCE), 2015,
Montreal, Canada.
Abstract - This paper presents a Switched Reluctance Motor (SRM) capable
of running up to 50,000 rpm whilst producing an output power of 60 kW.
The high speed operation allows for a smaller overall size, which in turn
leads to lower manufacturing costs. It is demonstrated that, at very high
speeds, merely shrinking the motor is not enough and certain mechanical
considerations should be taken into account. A rotor with a flywheel type
design that uses bolts to secure the laminations rather than feeding them
onto a central shaft is introduced. Electromagnetic and mechanical
simulation results for the motor are presented for key operating points, the
results confirm that the stresses on the rotor in the proposed topology are
below the yield strength of the material with a safety factor of 1.2. This
combined with high output power might make a viable design for use in mass
production hybrid electric vehicles.
4

Chapter 1. Introduction
(3) M Besharati, J D Widmer, G Atkinson, V Pickert, K R Pullen, J Washington.
“Design and Analysis of a High Speed, High Power SMR With a Flywheel
Approach”. To be submitted to: IEEE Transaction on Energy Conversion.
.
1.3 Contribution to Knowledge
This thesis contributes to knowledge in the following areas:
• The mechanical design methodology of high speed, high power SRMs, the
investigation of the mechanical constraints on high speed SRMs, implementing
a flywheel topology to the rotor to address the high hoop stress (Chapters 3
and 5);
• The electromagnetic design methodology of a high speed SRM, including
methods to improve the output torque and decrease the high electromagnetic
losses rising from the high speed operation (Chapters 4 and 6);
• Construction of a high speed SRM including altering the existing techniques
to wind the SRM coils, and manufacturing rotor to ensure maximum rotor
alignment (Chapter 7).
• Development of an SRM to run at 50,000 rpm while producing 60 kW output
power to replace the PM machine used in the Toyota Prius (Chapter 5, 6, 7
and 8);
5

Chapter 2
A Review of Switched Reluctance
Motor Technology
In this chapter a review of existing research on Switched Reluctance Motors (SRMs)
is presented. The review has three major focus areas:
• the general operation of SRMs and the suggested modifications to improve
electromagnetic performance,
• research dedicated to design an alternative SRM to match the PM machine
used in the Toyota Prius, and
• the design requirements of high speed electric motors.
For decades, interior permanent magnet synchronous motors (IPMSM) have been
the favourite topology of choice for manufacturers of electric vehicles (EV) such as
Toyota Prius, Nissan Leaf and GM Volt [1, 2]. Neodymium is the predominant
rare-earth-material used in permanent magnets inserted in this type of motors.
However, in 2009 the price of Neodymium and other rare-earth dopants, i.e.
Dysprosium increased significantly [2, 3]. Fig. 2.2 shows the increase in the price of
Dysprosium and Neodymium compared to that of Gold since 2010. This cost
increase has reduced back to resealable levels in recent years, as shown is Fig. 2.1,
but the resource uncertainty is still a clear issue, particularly when manufactures
are committing to high volume production, as is the case with automotive
applications, with millions of vehicles produced annually in countries with major
automotive industry as shown in Fig. 2.3 [4].
6

Chapter 2. A Review of Switched Reluctance Motor Technology
Figure 2.1: Rare Earth Metal Prices compared with Gold [2]
Figure 2.2: Rare Earth Metal Prices [3]
7

Chapter 2. A Review of Switched Reluctance Motor Technology
Figure 2.3: World Motor Vehicle Annual Production [4]
2.1 Why SRM?
The major factors in selecting electric motors for EVs or hybrid electric vehicles
(HEV) are cost, weight and efficiency. Among the four major electric motor types
(Switched Reluctance, Brushed DC, Induction and Permanent Magnet Machines)
Switched Reluctance Motors (SRMs) are a good candidate to replace PM machines.
Brushed DC machines, despite simple control technique requirements, are large and
expensive for HEV applications. Furthermore, the brushes and commutators used in
the DC machines add to the maintenance cost whilst reducing reliability. Induction
machines, IMs, have higher power density and better efficiency compared to DC
motors whilst being robust and cost effective. However, the heat dissipation in the
rotor windings leads to lower power compared to PM motors.
SRMs have a wide speed range with satisfactory torque at low speeds. SRMs are
usually lighter than IMs and DCs (for the same output power range) and have a
better efficiency due to the reduced rotor losses. The simple structure of SRMs
leads to lower manufacturing costs compared to the alternatives, making it suitable
for mass production. Also, as an AC motor, shoot-through semiconductor failure
8

Chapter 2. A Review of Switched Reluctance Motor Technology
can not happen to SRMs which makes it perfect for applications where reliability is
important [5]. The rugged structure of the rotor makes it of interest for high speed
operation.
SRMs have not been investigated and implemented as vastly as PM machines and
IMs [6]. SRMs are a viable solution as they can take advantage of perating under
high temperature or high rotational speed, and cheaper power electronics as better
technology is now available [7].
On the other hand, the torque density of SRMs is low and they experience high
torque ripple. The salient structure makes SRMs inherently noisy. Also, SRMs
require a non-standard converter compared to the more well-established motors.
The best-selling HEV is the Toyota Prius which employs a PM machine [8].
Therefore, the performance of this machine can be used as a reference for the
design of competing machines based on SRM technology. Furthermore, there are
some issues such as torque density that need addressing. One solution is to run the
motor at a very high speed, which allows for a smaller size.
Increasing the motor speed while maintaining high output power is challenging.
Both the structure of electrical machine and the power electronics should be
compatible with high speed operation. Factors such as rotor strength, cooling,
lubrication and vibrations should be carefully monitored. Overall, both rotor and
stator should be designed for specific high speed application.
Conversely, iron losses increase with frequency. As a result, low iron loss materials
are essential. In addition, it is challenging to remove the heat generated by the
rotor. Thus, cheap and effective cooling is needed.
2.2 SRM Design Methods
Lawrenson [9] has described the fundamental design of SRMs. The number of
phases, stator pole per phase, stator pole arc, rotor pole arc, iron loss and
switching frequency are identified as some of the issues that have to be considered
while designing SRMs.
The minimum number of rotor poles, Nr, and stator poles, Ns, for a given number
of phases, q, can be calculated using Eq. (2.1).
LCM(Ns, Nr) = qNr (2.1)
Where LCM is the lowest common multiple. It should be mentioned the lower values
of Nr , the lower the unaligned inductance.
9

Chapter 2. A Review of Switched Reluctance Motor Technology
Studies have shown that for self-starting reversible machines, the phase/pole
combinations given in Table 2.1 serve perfectly [9]:
Table 2.1: Phase and Pole combination
Number of Phases Ns Nr
3 6 4
4 8 6
5 10 8
The basic requirement for the stator and the rotor pole arcs, βs and βr respectively,
is described using Eq. (2.2);
βs + βr ≤2π
Nr
(2.2)
The switching frequency of the voltage applied to phase, fph, is given by Eq. (2.3):
fph = Nr
ω
2π(2.3)
Where ω is the angular velocity. Consequently for a supply of q phases the supply
switching frequency, fs, can be expressed as Eq. (2.4);
fs = qNr
ω
2π(2.4)
The design methods for SRMs are categorised into three categories; linear, non-linear
and finite element method [10, 11].
In the non-linear method, the parameters are considered to be dependent on
current with saturation effects included in the magnetic circuit. In this method the
minimum and the maximum inductance is calculated using the magnetic
circuit [12–20]. Extensive studies have tried to suggest different design procedures
focusing on different geometrical aspects such as stator number of poles, rotor
number of poles, pole pitch to pole arc ratio and air-gap length [21–25].
Recent advances in FEA software, the finite element analysis (FEA) has become
more attractive for analysing SRMs leading into studies on meshing, boundary
conditions, electromagnetic and control aspects of SRMs [26–28].
Investigating the effect of changing the geometrical parameter, is primarily done for
the purpose of enhancing the output torque and reducing the torque ripple. In other
10

Chapter 2. A Review of Switched Reluctance Motor Technology
words, the machine output torque is considered as a starting point in optimizing
the machine configuration. For instance, according to [29] a ratio between the
rotor radius and stator radius between 0.57-0.63 will enhance the torque. [30] has
demonstrated that an SRM with slightly wider stator poles will show a better torque
characteristic compared to the same size SRM with narrower stator poles. Another
way to decrease the torque ripple is having more than 4 phases. However, each phase
needs two switching devices and two free wheeling diodes which results in the drive
becoming much more expensive than the motor itself, unless alternative techniques
are used to reduce the number of required electric components [31].
2.3 SRM Operation
SRMs have salient stator and rotor poles hence are referred to as doubly salient.
In this type of motor, only stator poles (and not the rotor poles) are given simple
windings around them, therefore saliency plays an important role in torque
production. Also, opposite stator poles share the same phase and are connected in
series via their coils. When a stator pole is excited, the magnetic circuit tends to
have minimum reluctance by forcing the rotor poles to move towards the aligned
position (maximum inductance).In generating mode, the opposite happens. If the
rotor inter-polar axis is located on stator poles, the rotor is said to be unaligned
with the stator. The aligned and unaligned positions are illustrated in Fig. 2.4.
When the rotor pole is exactly at the unaligned or aligned position with a stator
pole, the torque produced is zero. If the position of the rotor is at either side of an
excited stator, a torque will be produced to restore the rotor to the aligned
position. When at the aligned position, as the magnetic reluctance of the flux path
is at its lowest, the phase inductance will be the highest. On the other hand, when
at unaligned position the phase inductance (the slope of magnetization curve) will
be the lowest due to the large air-gap leading to longer flux paths between rotor
and stator. In other words, the produced torque tries to rotate the motor in the
direction that inductance increases. However, this produced torque is independent
from the direction of the current [9].
The torque can be improved by optimizing the physical characteristics of the motor
design such as increasing the rotor pole width and reducing the air gap width as far
as the manufacturing limits allow [32].
2.4 Torque Production
A continuous excitation of the stator phases in the clockwise direction creates a
magnetic field which enables a steady rotation of the rotor in the counter clockwise
11

Chapter 2. A Review of Switched Reluctance Motor Technology
Figure 2.4: SRM Operation. a) Rotor Pole at Aligned Position with the Stator Pole.
b) Rotor Pole at Unaligned Position with the Stator Pole
direction. The torque, T , at any rotor position is described using the co-energy, W ′,as given in Eq. (4.3), because of the magnetic non-linearity in saturation mode [33].
T (θ, i) =δW ′(θ, i)
δθ(2.5)
Where θ is the angular position of the rotor and i is the current flowing in the coil.
The co-energy is directly dependent on the rotor position and the instantaneous
current. The co-energy at all positions equals the area between the magnetization
curves, which are shown in Fig. 2.5. Therefore, the co-energy can be found by taking
the integral over that area as expressed in Eq. (2.6).
W ′ =∫ i
0
Ψdi (2.6)
In the case of having no magnetic saturation in the motor, the magnetic curves will
be straight, hence the co-energy equals the stored energy in the air-gap , Wf , and
is given by Eq. (2.7).
Wf = W ′ =1
2Li2 (2.7)
Here, L is the self inductance at any rotor position θ. Therefore, torque can be
calculated using Eq. (2.8).
12

Chapter 2. A Review of Switched Reluctance Motor Technology
MMF [A]0 100 200 300 400 500 600
Flu
x Li
nkag
e [m
Wb]
0
5
10
15
20
25
30
35
40
45
50
UnalignedAligned
Figure 2.5: A Sample Magnetization Curve SRM
T =1
2i2dL
dθ(2.8)
It should be mentioned that the torque production is in direct relation with
geometrical aspects of the motor, such as air-gap length and pole arc, which are
limited by the frame size of machine. Furthermore, the B-H curve of the iron used
in the lamination should also be considered as it determines when saturation
occurs.
During each excitation cycle, four major inductance regions appear as shown in Fig.
2.6. These regions are;
Region 1: 0− θ1 and θ4 − θ5: In this region, as the stator and rotor are not aligned
(overlapped), the flux path is mainly in air which leads to a constant minimum
inductance. This inductance is called unaligned inductance, Lu. There is no
contribution in torque production in these regions.
Region 2: θ1 − θ2: In this region the stator and the rotor poles start overlapping,
therefore the flux flows through a path over the stator and the rotor laminations.
This leads to an increasing inductance in relation to the rotor position. If at this
moment the coils are excited by current flowing through them, a positive torque will
be produced (i.e. motoring mode). Full alignment of the stator and the rotor poles
ends this region.
13

Chapter 2. A Review of Switched Reluctance Motor Technology
Rotor Position
θ1
θ2
θ3
θ4
θ5
θ1
θ2
θ3
θ4
θ5
Indu
ctan
ce
Lu
La
Rotor Position
θ1
θ2
θ3
θ4
θ5
θ1
θ2
θ3
θ4
θ5
Tor
que
Tneg
0
Tpos
(a)
(b)
Figure 2.6: Excitation Cycle of a Single Phase a)Inductance profile of an SRM vs.
Rotor Position. b)Torque profile of an SRM vs. Rotor Position [34].
Region 3: θ2−θ3: Over this region, the inductance is at a constant maximum (aligned
inductance, La), as the rotor pole position does not affect the complete overlapping.
Like region 1, the constant inductance means there is no torque production in this
region either, despite the presence of current in the coils.
Region 4: θ3 − θ4: This region is similar to region 2 with the difference that the
inductance decreases here as the rotor pole moves away from the overlapping
position. Decreasing inductance means negative torque can be produced in this
region (i.e. generating mode).
In reality this inductance profile is not achievable as the saturation of the motor
would curve the graph near the top. Furthermore, in order to reduce the torque
ripple, every two succeeding phases will be excited in such a way that the inductance
14

Chapter 2. A Review of Switched Reluctance Motor Technology
in the second one starts while the inductance in the first is about to end.
2.5 Control of the SRM for High Speed
Operations
The control of SRMs generally is more complicated than other types of electric
motors. The non-linear inductance, and the rise up time of the excitation current
requires special consideration for the drive. The rise up time of the excitation current
becomes particularly important in high speed regions. The common control practice
at high speed regions is advancing the turn on angle. However, it should be noted
that if advanced too far, the falling current can cause excessive negative torque.
Therefore, optimizing the advancing angle is essential in high speed drives [35].
2.5.1 Advancing The Inverter Commuting Angle
The SRM drive circuit uses an asymmetric bridge, unlike the regular H bridge used
for other electric motors. There are some configurations proposed for the converter
circuit which reduces the number of used devices while giving acceptable output [36].
A conventional drive circuit is shown in Fig. 2.7.
Figure 2.7: Asymmetric Bridge Converter
The flow of the current in each phase depends on one of three circuit operation
modes [37]. The operational modes are illustrated in Fig. 2.8. In mode 1, both of
the switches S1 and S2 are turned on. By applying the DC voltage V the current
i flows in the phase winding. In mode 2, switch S1 is off while switch S2 is on. In
this mode, the phase winding voltage V is zero but there is a decreasing inductance
15

Chapter 2. A Review of Switched Reluctance Motor Technology
current that flows in the free wheeling diode D2. In mode 3, both the switches S1
and S2 are off. Since the current decrease is not instantaneous, the current flows
through the diodes D1 and D2. Applying a reverse source voltage -V reduces the
phase winding current i rapidly. Therefore, this mode is used for rapidly reducing
the current i near the aligned position.
Figure 2.8: Conventional Drive Circuit Modes for an SRM [37]
The requirement for hybrid electric vehicle applications is the capability of producing
a continuous power over a wide speed range. In SR motors, while operating at speeds
below the base speed of the motor, the produced back emf is not large enough to
overcome the current, therefore a simple chopping technique can be used to control
the current. The current and voltage signals of an SRM while operating below the
base speed is shown in Fig. 2.9 a.
After passing the base speed, the back emf increases to a level that can limit the
current, as shown in Fig. 2.9 b. If at this point the phase is excited before its
inductance increases, the current would have enough time to increase to a
favourable level. This can be done by advancing the commuting angle of the
inverter, as mentioned earlier. This technique permits maintaining a constant
power while operating at speeds above the base speed.
The phases in SRMs are excited over the periods of one rotor pole pitch. In order to
avoid excessive losses, the required time to deflux the motor is equal to the fluxing
period. Therefore, advancing angles bigger than half of the rotor pole pitch are
considered to cause motor instability. However, the instability would technically be
dampened by different types of losses (including the copper loss, the resistance and
voltage drop of the drive component).
Under these operating conditions, the total flux linkage during the excitation
period would exceed the total flux linkage over the demagnetisation period.
Therefore, a residual flux is present before the excitation of the phase and would
16

Chapter 2. A Review of Switched Reluctance Motor Technology
increase gradually until it reaches a steady state. Using a voltage control in the
steady state allows an equal magnitude for the negative and positive voltage,
leading to a constant mean flux during successive phase excitations (continuous
current operation). Therefore, using this technique, would change the shape of the
current from a single pulse to continuous current. Continuous current operation is
illustrated in Fig. 2.9 c.
While in motoring operation, the production of a negative torque is unavoidable as
the phase is excited while approaching a decreasing dl/dθ. But the benefits of this
technique in improving the motor output would overcome this insignificant negative
torque [38]. Indicating the rotor position is important as it identifies which pole
winding should be excited first.
Figure 2.9: Single Pulse Mode to Continuous Current Operation. [38]
17

Chapter 2. A Review of Switched Reluctance Motor Technology
2.6 SRM Topologies
Like any other electric motors, many different topologies for SRMs have been
introduced. Each one of these topologies are suggested to address a certain
shortcoming of SRMs such as torque ripple or acoustic noise. However, not all of
the novel topologies are suitable for high speed applications. Some of the more
common topologies are discussed as follows.
2.6.1 Radial SRMs
The most common SRM topology is radial topology. This topology consists of a
cylindrical rotor which is placed inside a cylindrical stator, where the flux linkage
lines from stator poles towards rotor poles are in the radial direction.
This type of SRM is very easy to construct and uses simple rotor structure, which
makes them suitable for high speed applications. Usually when considering the
SRMs, it is accepted that the number of rotor poles should be smaller than that
of stator poles [39]. Higher number of poles results in higher switching frequency
and higher iron loss. Therefore, the conventional rotor and stator pole numbering
is more suitable for this project. A simple drawing of a radial (conventional) SRM
is shown in Fig. 2.10.
Figure 2.10: Cross Section View of a Radial SRM.
Research shows segmenting the stator may cause reduction in the manufacturing cost
of the motor, it has negative effects on the torque due to the additional air gap that
will be produced between the stator core back and teeth due to the manufacturing
shortcomings [40]. Also, the segmental topology is not suitable for operation at
18

Chapter 2. A Review of Switched Reluctance Motor Technology
such high speeds. As a result, a non-segmented stator topology is considered for
this work.
2.6.2 C-Core Stator SRMs
Improving the fill factor and ease of winding the coils calls for alternative stator
topologies. C-Core stators offer more available slot space to accommodate the
winding or permit using thicker wires for windings. Fig. 2.11 illustrates a C-Core
SRM. This topology can improve the the efficiency and by stacking more models
on top of each other, higher power can be achieved [41–43]. However, having a
multilayer rotor effectively doubles the air gap length. This motor is going to have
a significant copper loss as end windings is increased in length compared to the
conventional type. Furthermore, having a long shaft rotated by multiple rotors is
not suitable for high speed applications as long shafts usually do not perform
flawlessly at high speeds due to the stresses and increased vibrations.
Figure 2.11: Schematic of a Multi Layer C-Core SRM. a) Flux Linkage Path. b)
Cross Section View [41].
2.6.3 Disk Type (Pancake Shaped) SRMs
In this motor, the rotor is made of a material with small magnetic permeability in
the shape of a disk, as shown in Fig. 2.12. The rotor poles are made by inserting a
material with high magnetic permeability into the disk. The vibration and acoustic
noise of SRMs are made by the radial component of the electromagnetic force.
In this model that component is non-existent, hence, it leads to eliminating the
19

Chapter 2. A Review of Switched Reluctance Motor Technology
noise whilst having less torque ripple and greater power density [44]. However, the
rotor structure is not suitable for high speed applications. Constructing this motor
needs complicated methods in order to insert the rotor cubes inside the rotor disc.
Furthermore, the sharp corners of the cubes impose stresses inside the rotor disc.
The discrete distribution of the rotor poles around the disc would also add to the
stresses. This rotor is likely to fail while running at high speed due to the severe
rise in stress in between rotor cubes and rotor disc.
Figure 2.12: Pancake Shaped C-Core SRM. a) A Single C-Core. b) Cross Section
View of the C-Core Rotor [44].
2.6.4 Hybrid SRMs
There are some SRMs that are a hybrid between the radial SRM and other motor
types. The hybrid between SRM and permanent magnet is the most popular one. In
this type of motors (especially in motors with small number of poles) just one piece
of a permanent magnet material is used somewhere between two stator poles, which
eliminates the need for a position sensor and helps the rotor poles to stop in that
area. In [45] a new hybrid model is introduced in which at the tip of all the stator
poles one piece of magnet is used, as illustrated in Fig. 2.13. It is suggested that this
model has higher torque and better efficiency compared to a same size conventional
SRM. It has shown good performance under full-load and over-load operation which
makes it fit for electric vehicle applications. However, using magnets leaves less space
for windings. Also, magnets are at the risk of demagnetization and motors which use
magnets cannot operate at elevated temperatures or in harsh environments (which
is an advantage of SRMs). Using rare-earth magnetic materials is not in line with
the purpose of this project due to their increasing cost.
20

Chapter 2. A Review of Switched Reluctance Motor Technology
Figure 2.13: Cross-Section of a Hybrid SRM [45].
2.7 SRM in Automotive applications
The capability of operating wholly in constant power is an essential requirement
of vehicle drive trains. The implementation of internal combustion engines (ICE)
requires multiple gear systems in order to achieve the appropriate torque speed
profile. However, properly designed and controlled electric motors can realize an
extended range for constant power operation.
While designing an electric machine for HEVs the following should be carefully
considered: 1) The constant power operation range, 2) The efficiency of the motor
over this range, 3) The power factor over this range, 4) The over load capacity over
short periods [46].
SRMs have been considered for different automotive applications for their robust
structure, ability of operating at a wide range of speed and high temperature and
their fault tolerant nature [47]. Overcoming the acceleration in a traction drive
requires high torques at low speeds. The heat dissipation is mostly concentrated
at the stator windings which makes cooling straightforward. The salient structure
and large rotor shaft bore result in a lower rotor weight compared to an equivalent
size PM motor. The salient structure of the rotor provides low torque to inertia
ratio allowing fast acceleration (during starting) and deceleration (during emergency
brakes). This characteristic of SRMs becomes important when considering road
21

Chapter 2. A Review of Switched Reluctance Motor Technology
safety. The advantages and disadvantages of SRMs over other electric motors and
suggestions to improve the design method is discussed in [48].
Furthermore, an electric motor will be suitable for vehicle applications if it meets the
short term overload requirements of the vehicle. The advantage of SRMs over e.g.
induction motors is the lack of braking torque. Nevertheless, the overload abilities
of SRMs depend on the amount of current (and how fast) that can be pushed into
the coils against the rising back EMF. However, it should be mentioned that in real
life the over load capability of the motor will be lower than the estimated ones as
an overloaded motor will have a highly saturated core leading to a reduction in the
torque and hence the power [49].
Kachapornkul et al. have suggested a 3-phase 15kW SRM for the propulsion system
of an electric vehicle [50]. As the efficiency of the SRM is lower than that of a PM
motor, efficiency improvement was investigated for this work by the selection of
materials with low iron loss, machines design, increased fill factor and optimization
of the voltage waveform.
2.8 Designing an SRM for Toyota Prius,
University of Tokyo Experiment
The best selling hybrid electric vehicle at the commencement of this work was the
Toyota Prius. The popularity of this model encouraged researchers to find magnet
free alternative electric motors with the same output specifications. The research
team at Tokyo Institute of Technology and University of Tokyo have carried out
multiple projects to propose alternative SRMs to the PM machine used in the
different generations of the Toyota Prius.
Hayashi and Takeno have investigated the efficiency improvement with respect to
the implemented electrical steel for a 50 kW SRM with similar frame size, weight,
rated current and voltage of the PM motor in the 2004 Toyota Prius [51, 52].
Three different electrical steel were studied for this work: 35A300 (Japanese
Industrial Standards Denotion, known as 300 under British Standards) a general
low loss silicon steel, 10JNEX900 or ‘Super Core’ a 6.5% silicon steel, and a
layered block of amorphous alloy. The 35A300, 10JNEX900 and the amrphous
alloy have a thickness of 0.35 mm, 0.1 mm and 0.25 mm, respectively. The
comparison of the B-H characteristics of the three materials showed 35A300 has
the best saturated flux density followed by 10JNEX900 and finally the amorphous
alloy. Conversely, the high frequency iron loss graphs indicate the amorphous alloy
and 10JNEX900 have 17% and 26% of the iron loss of 35A300 at 0.5 T. An SRM
model was simulated for each one of the silicon steels and different efficiency
22

Chapter 2. A Review of Switched Reluctance Motor Technology
improvement techniques such as fill factor improvement and advancing the
excitation angle were carried out. It was concluded that the amorphous alloy
showed the highest efficiency, followed by 10JNEX900 and finally 35A300. This
work also showed that improving the winding fill factor gave only 1% increase to
the efficiency while optimizing the iron core design of the machine resulted in 5%
increase. However, the amorphous alloy comes with a significant down fall of a
high cost (almost 26 times that of 35A300) which makes it unsuitable for mass
production. Therefore, efficiency improvement of a general low loss silicon steel via
design techniques is the preferable solution.
In [51, 52] the authors tried to maintain the specifications of 2010 Toyota Prius.
Therefore, the motors total axial length is kept equal to the length of interior
permanent magnet (IPM) machine. Total axial length consists of the stack length
and end winding lengths. Having more number of stator poles result in shorter end
windings, therefore, the designs with higher number of stator poles end up having
longer stack lengths.
The 2010 Toyota Prius requires a current density of 20 − 26 A/mm2 and a torque
density of 35 − 45 Nm/l for a duration of 18 seconds. Its efficiency at the highest
point is 96% with a constant power operation of up to five times the base speed.
The 2010 model has a torque of 400 Nm [53]. Selecting 10JNEX900 results in higher
efficiency, however, torque improvement will be needed [54, 55] .
2.8.1 Tapered Angles
Several approaches can be taken in order to enhance the output torque of the motor.
Tapering the stator pole was used as a torque improvement technique. Tapering the
stator poles smoothens the flux lines inside stator which results in better conversion
loop energy and consequently higher maximum torque. An example of a stator
tapered pole is illustrated in Fig. 2.14a. However, care must be taken to the extent
of tapering the angle as big angles leave small spaces for winding.
Moreover, making use of a non-uniform air gap, as shown in Fig. 2.14b will result in
eliminating the position sensor while widening the positive torque range [56]. This
model, despite addressing the starting torque issue, would limit the motor to one
directional rotation. Furthermore, the asymmetric air gap results in reduction in
the maximum output torque.
Lower efficiency associated with SRMs, compared to the PM motors, is one of their
biggest shortcoming which hinders their adoption for HEV applications. The second
generation of the Toyota Prius has used a 50 kW IPMSM with a maximum torque
of 400 Nm and an efficiency of 95%. Several approaches were taken to meet the
high efficiency requirement. The choice of the silicon steel was carefully investigated
23

Chapter 2. A Review of Switched Reluctance Motor Technology
(a) (b)
Figure 2.14: Torque Improvement Techniques. a) Tapering Stator Poles. b) Uneven
Air Gap [56].
from the point of view of low iron loss and high torque density. During the material
selection it was noted that the materials with high saturated flux density produced
higher torque while materials with low iron loss result in a higher efficiency and a
compromise was made in final selection. The torque density was improved via design
improvement techniques such as increasing the number of stator poles, increasing
the stack length and optimising the stator taper angle. The efficiency was found
to be high at low torque with a medium to high operational speed [57–60]. The
comparison of the IPMSM and the SRM are given in Table 2.2. However, increasing
the number of poles is not always possible especially in high speed applications.
Furthermore, the stack length is usually limited by the mechanical constraints or
available motor space. Therefore, further techniques are required to improve the
efficiency and torque density.
The research associated with replacing the PM used in the Toyota Prius models
has continued by the release of the third generation of the model in 2009. The PM
motor used in the third generation was more compact with higher rotational speed
and improved output power. [61] has proposed an SRM with the same diameter
and axial length while delivering torque, output power, efficiency and operation
area competitive to that of the Toyota Prius. The torque improvement, like the
previous works, was carried out by material selection and rotor design
enhancement. The torque is directly proportional to the motor axial length, thus
increasing the axial length results in an improved torque. Since the axial length of
the motor is the sum of the stack length and the end winding length, by decreasing
the end winding length the stack length was increased to maintain the constant
axial length. The end winding are inherently shorter for concentrated short-pitch
24

Chapter 2. A Review of Switched Reluctance Motor Technology
Table 2.2: Comparison of the IPMSM in the Second Generation of Toyota Prius
and a Competitive SRM
Parameter Unit IPMSM SRM
Number of Poles 8 18/12
Stator Outer Diameter [mm] 269 269
Stator Inner Diameter [mm] 160.5 180
Winding Type Distributed Concentrated
Axial Length [mm] 156 156
Winding Number of Turns 9 14
Fill Factor [%] 56.7 57.2
Volume [l] 8.92 8.92
Maximum DC Voltage [V] 500 500
Base Speed [rpm] 1200 1200
Full Speed [rpm] 6000 6000
Torque at Base Speed [Nm] 400 403
Torque Density at Base Speed [Nm/l] 45 45
Maximum Power at Base Speed [kW] 50 50
Copper Loss at Base Speed [kW] 10 6.67
Iron Loss at Base Speed [kW] 0.28 1.36
Efficiency at Base Speed [%] 83 86
Current Density at Base Speed [A/mm2] 20 21.7
winding , compared to the distributed one used for the IPMSM. The end winding
length, Le is approximately calculated using Eq. (2.9) [61].
Le =πRbs
2Ns
(2.9)
Where Ns is the number of stator poles and Rbs is the radius of the bottom of the
slot. Therefore, higher number of stator poles results in shorter end winding length.
In order to ease the magnetic saturation, the optimization of the stator yoke width
while maintaining the winding fill factor was also applied to improve the output
torque. This was carried out by decreasing the winding number of turns. Other
motor characteristics such as rotor outer diameter and stator pole taper angle also
were altered to reach the target torque. The specification of the proposed SRM are
compared to that of the third generation Toyota Prius in Table 2.3.
The phase winding number of turns is in inverse proportion with the efficiency,
therefore should be carefully considered for SRM design for HEV applications [62].
Also, continuous current operation leads to efficiency reduction. The fill factor of a
stator slot is calculated using Eq. (2.10).
25

Chapter 2. A Review of Switched Reluctance Motor Technology
Table 2.3: Comparison of the IPMSM in the Third Generation of Toyota Prius and
a Competitive SRM
Parameter Unit IPMSM SRM
Stator Outer Diameter [mm] 264 264
Total Length [mm] 108 108
Total Mass [kg] 22.2 25.2
Fill Factor [%] 54 56
Current Density [A/mm2] 18.8 23.9
Maximum DC Voltage [V] 650 650
Torque at Base Speed [N.m] 207 211
Torque Density at Base Speed [N.m/l] 35 36
Full Speed [rpm] 13900 13900
Maximum Power [kW] 60 61
Maximum Power Density [kW/l] 10.2 10.4
Copper Loss [kW] 6.0 6.3
Iron Loss at Base Speed [kW] 2.7 1.3
Efficiency at Base Speed [%] 88 89
FF =NpNs(dw/2)
2π
Aslot
(2.10)
Where Np is the winding number of turns per pole, Ns the number of strands in
one turn, dw the diameter of the wire and Aslot the stator slot area. It can be seen
that to keep a constant fill factor, Np should be increased whilst decreasing Ns. The
number of turns is increased to achieve a target torque in applications where there
is a current limit. Increasing the number of turns results in an increase in the motor
back EMF which becomes an issue for high operational speeds. The shaft output
power can still be maintained by applying a continuous current operation. Applying
continuous current and increasing the number of turns results in producing negative
torque and increased copper loss (due to higher rms and increased resistance due to
higher number of turns) which leads to reduction in efficiency. Therefore a balance
between the number of turns and the efficiency is required [62].
2.9 High Speed Motors
The market requirement is constantly towards improved efficiency and power
density while reducing the manufacturing costs. The recent development in power
electronics and electrical steel production has allowed researchers to move more
26

Chapter 2. A Review of Switched Reluctance Motor Technology
and more towards higher operational speeds for electric motors. This is especially
of interest for direct drive applications where the need for a mechanical
transmission system is omitted, resulting in lighter, more efficient systems with
improved reliability and reduced maintenance requirements. High speed electric
machines are particularly interesting for traction applications where reduction in
weight and size are difficult to achieve.
Electric motors can operate at a wide speed range using accurate variable speed
control. The interest for high speed electrical motors has increased in recent years.
The high speed operation brings advantages like smaller size (hence reduced cost),
higher power density and higher efficiency. Conversely, issues such as increased
iron loss, requirement for expensive bearings, higher windage loss and increased
mechanical stresses arise with higher speeds.
The operational speed of electrical motors depends on factors such as temperature,
mechanical stress and critical frequencies. The magnetic and electrical loading,
power and size of the machine also govern the mentioned factors. It has been
demonstrated that a solid topology is usually preferred for the rotor of high speed
motors, due to the mechanical robustness of such structure.
High speed motors should be defines as those which push the stress limits of the
rotor components, rather than being defined as an absolute speed value. In this
case, from mechanical design point of view, a high torque rotor with large volume
and low speed can be equally challenging to construct as a high speed low torque
rotor with a smaller volume.
The concept of dynamic speed is introduced by van Millingen at al [63], which is a
numerical parameter described by Eq. (2.11):
n√P (2.11)
Where n is the rotational velocity in rpm and P is peak power is kW. Eq. (2.11)
is a figure of merit for high speed machinery, used as a guide number to assess
possibility of dynamic challenges such as critical speeds, material stress, peripheral
velocity and balance sensitivity [63]. Considering this figure of merit, a machine with
a 1,000,000 n√P is mechanically very difficult to engineer, whilst the manufacturing
of machines with lower values of 500,000− 800,000 is mechanically achievable with
moderate difficulty [64].
A 2 MW 15,000 rpm IM is built using hoop stress relief cuts and and integrated
joint boss, which results in the reduction of stress concentration . However, the
laminations used for the rotor manufacturing are of high-strength aircraft-grade
AISI 4130 alloy. Generally, cobalt iron which is significantly more expensive than
27

Chapter 2. A Review of Switched Reluctance Motor Technology
the common silicon iron, is used for the rotor construction of high speed motors and
a low iron loss alloy such as NO20 for the stator [65]. The purpose of this work is to
design a motor suitable for mass production in automotive applications which does
not allow the use of expensive materials. In Fig. 2.15 the power-speed points are
plotted for numerous high speed motors, where rpm√kW are superimposed. The
proposed SRM of this work is shown on the figure for the comparison purposes.
Figure 2.15: Speed vs Power Plot for different machine topologies by Gerada [65],
with non-linear rpm√kW correlations as proposed by van Milligen [63]
As classifying the electrical motors as ‘high speed’ or ‘high power’ can be misleading.
Using the empirical formula demonstrated in Eq. (2.12), a border line is obtained in
order to distinguish the ‘high speed’ and ‘super high speed’ terms. For instance a
machine with a maximum speed of 60,000 rpm and rated power of 10 kW is classed
as a high speed motor while motors running at faster speeds compared to it would
be classed as super high speed motors [66, 67].
Pn3.3 ≤ 6.2× 10⁶ (2.12)
Where P and n are the peak power in kW and Speed in krpm, respectively.
Fig. 2.16 shows the speed vs power plot for different machine topologies with a linear
correlation. It can be seen from Fig. 2.16 that the proposed SRM of this work falls
above the guide line, making it eligible for the super high speed class of motor.
28

Chapter 2. A Review of Switched Reluctance Motor Technology
However, the maximum permitted speed for each individual motor is defined by its
mechanical stresses and thermal capabilities associated with the increased frequency.
Also, tip speed, the tangential speed of the rotor at its outer surface, is used to
define high speed as the size of the rotor is also taken into account in calculating
this value [68].
Moghaddam introduces a high-speed index, to classify the limitations of electrical
machines in high speed technology, as Eq. (2.14):
ω P (2.13)
By increasing the speed, the limiting factors for high-speed power capability takes
different nature, resulting in changing the high speed index behaviour. Fig. 2.17
summarises the high speed index and rotor tip speed vs rotational speed of some
200 manufactured high speed machines [69]. As it can be seen, most of the machines
fall between the orange and blue lines which are the Competitive Technical Limit
(CTL) and Soft Technical Limit (STL), respectively. Regions, A, B and C are
distinguished by blue, red and green ellipses, respectively, based on the behaviour
of the high-speed index for different values of rotational speed, n. Using empirical
relations, Moghaddam shows that:
P ∝ R2.6OD (2.14)
Where P is the machine output power is kW. While the empirical relations help
deduce limits for existing state of the art, they present little information on how
to achieve power limits. Nor are the relation vs particularly useful for evaluating
power limits on novel machines, as can be deduced from Fig. 2.17 [69]. As it can be
seen, the proposed SRM of this work is classed just above the CTL zone.
Induction machines are used in the majority of high speed applications as a result of
their robustness and low maintenance requirements [70]. However, due to their high
copper loss compared to the other electrical motors, they have a lower efficiency.
Also, in a small size motor, there is limited space for conductors which leads to
a relatively lower power density. The permanent magnet motors have a higher
efficiency compared to induction machines or SRMs. But they have a larger rotor
inertia. This causes extreme bearing load and shortens the bearing life.
29

Chapter 2. A Review of Switched Reluctance Motor Technology
Figure 2.16: Speed vs Power Plot for Different Machine Topology by Rahman [67],
with linear correlations as proposed by Maeda [66]
30

Chapter 2. A Review of Switched Reluctance Motor Technology
Figure 2.17: Plot of Speed vs High Speed Index by Moghadam for Various Machine
Topologies [69].
In order to increase the efficiency in high speed operations, the electromagnetic
losses (iron loss and copper loss) should be limited. For that, using laminations
with low thickness (about 0.2 mm) and electrical steels with low specific loss index
is essential. In addition, use of Litz wire for the winding can reduce the copper loss.
Operation of high speed and super high speed motors require equal consideration
for mechanical problems as electromagnetic ones [70]. The torque capability of the
motor is affected at higher speeds which is dealt with by advancing the excitation
angle. The Analytical design of a 50,000 rpm, 700 kW IM is demonstrated in [71],
where power electronics considerations, use of Litz wire, use of low loss material for
the rotor and the shaft are taken into account.
2.10 High Speed Switched Reluctance Motors
Several work has been carried out to design a suitable drive for high speed SRMs [72].
In [73] a high speed SRM is used for the spindle drive inside a dental drill. Here,
attention was focused on the critical speeds of the rotor in order to avoid mechanical
failures caused by external perturbations. Also, the choice of the bearings which are
one of the main sources of the mechanical loss in very high speed applications is
investigated.
[74] has designed a high-speed high power SRM for an aerospace application with
an stator outer diameter of 6.35 inches and a stack length of 3.3 inches. The base
31
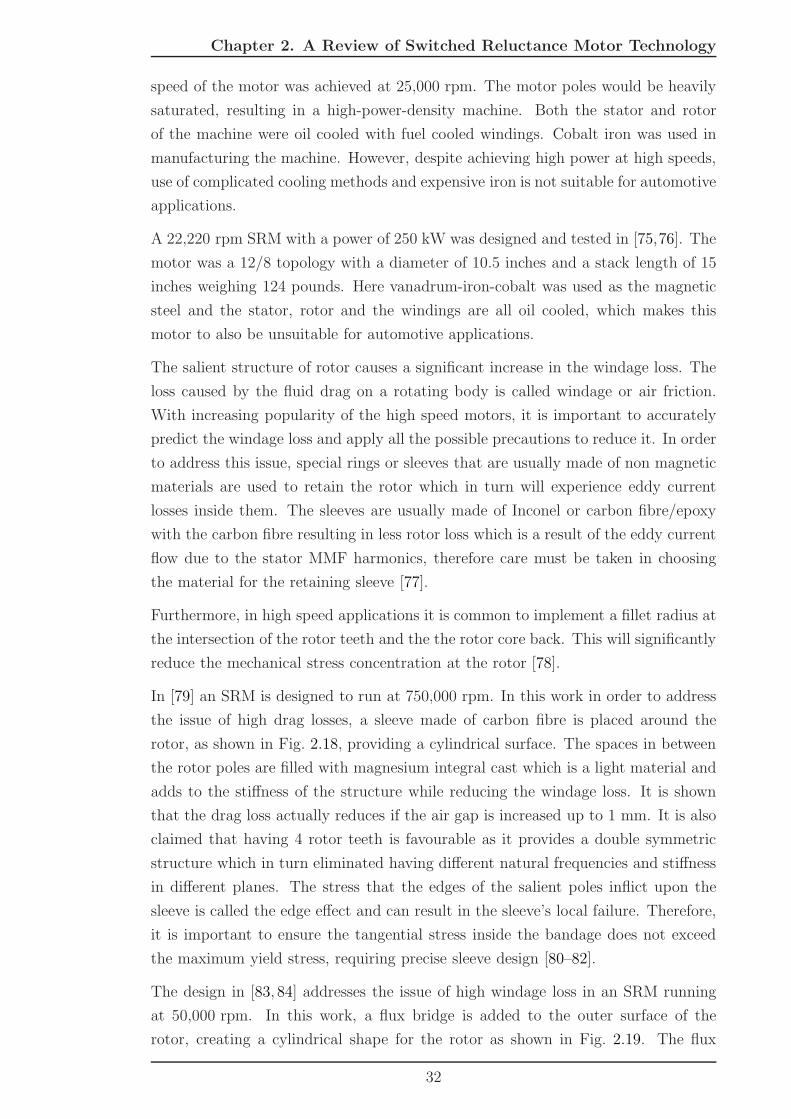
Chapter 2. A Review of Switched Reluctance Motor Technology
speed of the motor was achieved at 25,000 rpm. The motor poles would be heavily
saturated, resulting in a high-power-density machine. Both the stator and rotor
of the machine were oil cooled with fuel cooled windings. Cobalt iron was used in
manufacturing the machine. However, despite achieving high power at high speeds,
use of complicated cooling methods and expensive iron is not suitable for automotive
applications.
A 22,220 rpm SRM with a power of 250 kW was designed and tested in [75,76]. The
motor was a 12/8 topology with a diameter of 10.5 inches and a stack length of 15
inches weighing 124 pounds. Here vanadrum-iron-cobalt was used as the magnetic
steel and the stator, rotor and the windings are all oil cooled, which makes this
motor to also be unsuitable for automotive applications.
The salient structure of rotor causes a significant increase in the windage loss. The
loss caused by the fluid drag on a rotating body is called windage or air friction.
With increasing popularity of the high speed motors, it is important to accurately
predict the windage loss and apply all the possible precautions to reduce it. In order
to address this issue, special rings or sleeves that are usually made of non magnetic
materials are used to retain the rotor which in turn will experience eddy current
losses inside them. The sleeves are usually made of Inconel or carbon fibre/epoxy
with the carbon fibre resulting in less rotor loss which is a result of the eddy current
flow due to the stator MMF harmonics, therefore care must be taken in choosing
the material for the retaining sleeve [77].
Furthermore, in high speed applications it is common to implement a fillet radius at
the intersection of the rotor teeth and the the rotor core back. This will significantly
reduce the mechanical stress concentration at the rotor [78].
In [79] an SRM is designed to run at 750,000 rpm. In this work in order to address
the issue of high drag losses, a sleeve made of carbon fibre is placed around the
rotor, as shown in Fig. 2.18, providing a cylindrical surface. The spaces in between
the rotor poles are filled with magnesium integral cast which is a light material and
adds to the stiffness of the structure while reducing the windage loss. It is shown
that the drag loss actually reduces if the air gap is increased up to 1 mm. It is also
claimed that having 4 rotor teeth is favourable as it provides a double symmetric
structure which in turn eliminated having different natural frequencies and stiffness
in different planes. The stress that the edges of the salient poles inflict upon the
sleeve is called the edge effect and can result in the sleeve’s local failure. Therefore,
it is important to ensure the tangential stress inside the bandage does not exceed
the maximum yield stress, requiring precise sleeve design [80–82].
The design in [83, 84] addresses the issue of high windage loss in an SRM running
at 50,000 rpm. In this work, a flux bridge is added to the outer surface of the
rotor, creating a cylindrical shape for the rotor as shown in Fig. 2.19. The flux
32

Chapter 2. A Review of Switched Reluctance Motor Technology
Figure 2.18: Rotor Designed for 750,000rpm Rotational Speed with Carbon Fibre
Sleeves [77]
bridges in between each two adjacent rotor poles are supported by radial links. It
is claimed that from the mechanical point of view the flux bridges are capable of
with-standing the stresses caused by the centrifugal force whilst being thin enough
to saturate to an extent to effectively act like air. Adding the flux bridge also
results in rotor acoustic noises equal to the electric motors with cylindrical rotor by
creating a cylindrical shaped rotor [85]. This techniques was combined with using
an asymmetric air gap. This air gap would increase the aligned inductance while
decreasing the unaligned inductance which would result in an improved torque for
the same rotor specification.
Figure 2.19: Rotor Designed for 50,000rpm Rotational Speed Using Flux Bridges [85]
33

Chapter 2. A Review of Switched Reluctance Motor Technology
If a high speed application employs hollow rotor, all the techniques used to mount
the rotor on the shaft that include notches and key ways results in excessive stress
concentration on that area. Therefore, glue works as an easy solution to lock the
rotor to the shaft while avoiding a rise in mechanical stresses [81].
In high speed applications, the core loss PFe, which consists of the hysteresis loss,
Ph, the eddy current loss, Pe, and anomalous eddy current loss, Pa, can be as large
as the copper loss and is calculated using the Steinmetz equation as presented in
Eq. (2.16).
PF e = Ph + Pe + Pa (2.15)
= khfBnPeak + ke(fBPeak)
2 + ka(fBPeak)1.5 (2.16)
Where kh, ke and ka are the hysteresis, eddy current loss and anomalous eddy current
loss coefficients, respectively. f is the frequency of the operation, BPeak the peak
flux density and n the Steinmetz constant. It should be noted that the methodology
used in the FEA package is valid for no-sinusoidal waveforms, which is the case in
SRMs [86].
The copper loss in high speed applications includes the DC winding and AC winding
loss. The eddy current loss is mainly caused by the proximity effect caused by the
varying magnetic field. For a wire with circular profile, the eddy current loss portion
of the copper loss, Pcu−eddy, is estimated using Eq. (2.17).
Pcu−eddy =B2
cu−peakω2d2c
32ρ(2.17)
Where Bcu−peak is the peak flux density within the conductor, ω the angular velocity,
dc the conductor diameter and ρ the resistivity of copper [87].
In order to reduce the fundamental switching frequency at high speed applications,
the lowest possible stator/rotor pole combination is often used. However, this causes
issues such as high torque ripple and effects the self starting capability of the rotor.
By applying a 4/2 combination [88] operates at 30,000 rpm while producing 0.2 Nm
torque. A non-uniform air gap was implemented as shown in Fig. 2.20. This has
flattened the torque waveform and widened its range, improving the self starting
capability of the motor. Another advantage of this technique is reducing the acoustic
noise.
In designing a rotor (or shaft) for high speed applications, it is vital to calculate the
vibration frequencies and their shapes. The design speed of the motor should avoid
the natural frequencies of the motor. However, the rotor can be accelerated fast
34

Chapter 2. A Review of Switched Reluctance Motor Technology
Figure 2.20: Non-uniform Air Gap in a High Speed SRM
enough to pass the speed associated with the rigid modes. Therefore, the shaft can
be designed to operate at a speed between the rigid modes (rock and bounce) and
bending mode. The rigid mode is proportional to the bearing stiffness, therefore
reducing the bearing stiffness by techniques such as soft mounting reduces the two
rigid modes of vibration [89, 90].
The noise or the mechanical resonance is created when the magnetic flux of an
excited stator pole produces radial and/or circumferential electromagnetic forces
on the excited pole, causing oval shaped deformation of the stator [91, 92]. It is
important to avoid the modal frequencies of the stator occur simultaneously with
the stator’s natural frequencies, in order to avoid causing resonances which result in
vibration and noise [93,94]. Clearly SRMs still have several areas for improvement.
2.10.1 Benchmark SRM
The purpose of this work is to design an alternative SRM capable of meeting the
specification the third generation Toyota Prius motor. In the previous section, the
summary of the research carried out by University of Tokyo, to design such an SRM,
was presented. However, as high speed, high power SRMs have not been investigated
for hybrid electric applications before, it was decided to design the alternative motor
to run at 50,000 rpm, which would result in a smaller more power dense design.
The design process started by scaling down the frame size of the SRM proposed
by the Japanese research team, which has a maximum speed and output torque
of 13,500 rpm and 207 Nm, respectively. This motor will henceforth be known as
SRM1. The detailed specifications of SRM1 can be found in Table 2.4.
The scaling was carried out according to the relationship between power, torque and
volume using Eq. (2.19), considering a 60 kW output power at 50,000 rpm.
35

Chapter 2. A Review of Switched Reluctance Motor Technology
P = ωT (2.18)
T ∝ R2ODLs (2.19)
It was defined that the motor torque has been scaled down by a ratio of 3.7:1 resulting
in a knee point torque and speed of 55.89 Nm and 10, 247 rpm, respectively. The
rotor frame size had to be scaled down by a ratio of 1.5:1 on each physical measure.
Using the obtained ratio, the stator outer diameter, rotor outer diameter and the
stack length were calculated to be 176 mm, 121 mm and 58 mm. Considering the
conductor requirement, the fill factor is reduced to 45%. Furthermore, the high
switching frequency resulted in selecting the 6/4 combination which is the lowest
possible stator/rotor pole combination.
These values were used as a guide to start the design and further changes were made
to meet the electromagnetic or mechanical requirements which will be discussed in
detail in following chapters.
Table 2.4: Comparison of SRM1 and the Designed SRM
Parameter Symbol Unit SRM1 Designed SRM
Stator Outer Diameter SOD [mm] 264 176
Rotor Outer Diameter ROD [mm] 182 121
Stack Length LS [mm] 87 58
Maximum Power Pmax [kW] 60 60
Maximum Speed nmax [krpm] 13.5 50
Torque T [Nm] 207 55.89
DC Link Voltage VDC [V] 650 600
Fill Factor FF % 54 45
Stator/Rotor Teeth Combination - - 18/12 6/4
2.11 Summary
A review is presented in this chapter with three main focus areas; the operating
principle of SRMs and the design techniques to improve the performance, summary
of the existing SRMs to meet the specifications of the PM machine used in the
Toyota Prius, and the design considerations of high speed SRMs.
SRMs operate based on the tendency of the magnetic circuit to move towards a
position with minimum reluctance by forcing the rotor poles towards the aligned
36

Chapter 2. A Review of Switched Reluctance Motor Technology
position. The drive circuit of SRMs uses an asymmetric bridge unlike the H bridge
used for other electric motors. Advancing the inverter commuting angle is commonly
used particularly for speeds above the base speed.
SRMs have a simple structure, are easy to construct and cost effective. Magnet free
SRMs are an attractive solution to replace the PM machines which are commonly
used in HEV application. However, SRMs have a number of shortcomings such
as high torque ripple, high acoustic noise and lower efficiency and torque density
compared to PM motors.
Numerous techniques are used to address the shortcomings of SRMs. These
techniques primarily focus on the improvement of the geometrical parameters such
as the number of phases, airgap width, number of rotor and stator poles and pole
pitch. Furthermore, many different topologies for SRMs have been used including;
radial, c-core stator, disk type and hybrid SRMs.
The fault tolerant nature, robust structure, and ability to operate at a wide range
of speeds and temperatures make SRMs suitable for automotive applications. The
research team at the University of Tokyo have carried out an extensive research
toward the design of an SRM to meet the specification of the PM machine used
in the Toyota Prius. The research includes the investigation of a suitable low loss
electrical steel, physical improvements including tapering the stator poles and the
use of a non-uniform airgap.
The important aspects of the design of high speed motors are; reducing the
aerodynamic loss, considering the critical speed and mechanical resonance, and
finally diminishing the mechanical stress. It is common to implement a fillet radius
at the intersection of the rotor teeth and core back to reduce the mechanical
stresses. Moreover, to address the high windage drag, a sleeve is placed around the
rotor to provide a cylindrical surface.
The frame size of the SRM designed by the University of Tokyo was scaled down
according to the relationship between power, torque and volume. The scaled down
dimensions are 176 mm, 121 mm and 58 mm for stator outer diameter, rotor outer
diameter and stack length, respectively. These values were used as an initial guide
to start the design. Further changes were made based on the electromagnetic or
mechanical requirements which will be explained in following chapters.
37

Chapter 3
Mechanical Design Methodology
The aim of this project is to design a high speed high power SRM. Mechanical
stresses imposed on a rotor are in direct proportion to the square of speed and radius.
Consequently, running a relatively large rotor at high speeds amplifies the stress and
overcoming the mechanical limits is arguably the biggest challenge in the design
process. Furthermore, failure of the rotor will occur if the rotor natural frequencies
coincide with the rotational speed. Therefore, designing a resilient, failure free rotor
has the highest priority for high speed applications.
There are several factors limiting the maximum speed of all types of rotating bodies.
The mechanical properties of the rotor material limit the speed, the maximum speed
being the point as which the mechanical stress in the material is equal to its yield
strength (with a relevant safety margin included). The critical speed is determined
by the system rotordynamic properties, the aspect ratio of the rotor (ratio of radius
to axial length), and the stiffness of the system that is dependent on the bearings
and their positioning. Vibrations both resonant and self excited are very important
in ensuring a safe operation. The purpose of mechanical design and the bearing
design is to address the issue of the rotor vibrations by choosing the operational
speed of the motor below the instability threshold whilst avoiding of the critical
speeds.
Furthermore, choice of a suitable bearing is fatal to the precise and safe operation of
the high speed motors as bearings are crucial components in high speed applications.
3.1 Mechanical Stresses
The majority of the stresses imposed upon a rotor are caused by the centripetal force.
The centrifugal force is an inertial force in the radial direction which is caused by
rotation. The directions of the coordinate system for stress analysis are illustrated
38

Chapter 3. Mechanical Design Methodology
Figure 3.1: The Rotor Coordiante System for Stress Analysis
in Fig. 3.1. The centrifugal force is also used to describe the force reacting to the
centripetal force. The value of this force, Fc, is calculated using Eq. (3.1).
Fc = mω2rc (3.1)
where m, ω and rc are mass, angular velocity and radius of the rotating system,
respectively. For any rotating system which has a simple structure and is not
constrained, Eq. (3.1) can estimate the total force induced on the system radially.
The major stresses contributing to the total rotor stress are: Notch Effect and
Tangential (Hoop) Stress.
3.1.1 Notch Effect
Objects that contain any form of indents, cracks, sharp angles. experience a rise
in the stresses in that area despite their estimated average stress being below their
yield strength. This is known as notch effect.
3.1.2 Tangential (Hoop) Stress
Any rotating plane sheet with a hole in the middle will experience a stress referred
to as ‘hoop stress’ which is caused by the centrifugal force. Hoop stress is a tensile
stress which is tangential to the circumference of the hole in order to repel the
strain that would force the lamination (the ring) to lift off the shaft [95]. The
highest concentration in a shape such as this will be on the hole in the middle. The
hoop stress direction on the rotor of an SRM is illustrated in Fig. 3.2 where the
central arrows indicate the direction of centrifugal forces. The geometrical design
of the rotor should ensure that the generated hoop stress does not exceed the yield
strength of the steel used in the rotor or the rotor will fail.
39

Chapter 3. Mechanical Design Methodology
Hoop stress is directly proportional to the rotor radius squared and the angular
velocity squared. Therefore, hoop stress act as a limiting factor for the maximum
rotor radius.
Figure 3.2: Hoop Stress Definition
3.1.3 Lame Equation for Defining Stresses on a Disk
Since the rotor consists of a stack of laminations, each lamination can be assumed
to be a rotating disk. Therefore, Lame’s equations for predicting the stresses on
a rotating disk and thick walled pressure vessel can be applied to them [96]. This
analysis will find the magnitude of the stress induced in different components of the
rotor.
Lame’s stress equations for any point at a radial distance from the centre, r, within
a solid disk are described in Eq. (3.2) for radial stress, σr, and Eq. (3.3) for the
tangential stress, σθ.
σr =3 + v
8ρω2a2(1−
r2
a2) (3.2)
σθ =3 + v
8ρω2a2(1−
1 + 3v
3 + v
r2
a2) (3.3)
where v is Poisson’s ratio while ρ, ω and a are the material density, angular speed
and the disk radius, respectively.
40

Chapter 3. Mechanical Design Methodology
For disks with a central hole, Eq. (3.4) and Eq. (3.5) apply where b, σrh and σθh are
the radius of the hole, the radial stress and the tangential stress, respectively.
σrh =3 + v
8ρω2(a2 + b2 −
a2b2
r2− r2) (3.4)
σθh =3 + v
8ρω2(a2 + b2 +
a2b2
r2−
1 + 3v
3vr2) (3.5)
Fig. 3.3 demonstrates the gradual change in tangential and radial stresses starting
from the centre and moving towards the circumference. The values of σr, σθ, σrh
and σθh at the boundaries including centre, a and b are illustrated on Fig. 3.3.
Figure 3.3: Radial and Tangential Stress Behaviour for a Generic Disk (Left) and a
Generic Disk with a Central Hole (Right).
3.1.4 Simulation Assumptions
The aim of the analysis in this section is to estimate the magnitude of the stresses
induced upon the rotor laminates. The main concern is regarding the size of the outer
diameter of the rotor, whether it will withstand operating at the suggested speed,
and finally if the proposed topology will be safe. For simplicity, some assumptions
are applied to the model. It is assumed that all the contacting surfaces of the
different rotor components are frictionless, allowing other external sources to be
ignored. Since the rotor consists of a stack of laminations that are held together
by glue, which has an insignificant axial stress, a single lamination needs only be
considered in the analysis. This single lamination obeys the equations for a rotating
disk as it is considerably larger in diameter than in thickness.
The stress value at any point of an elastic body should be maintained below the yield
strength of the material in order to avoid failures or cracks. Von Mises, a theory on
41

Chapter 3. Mechanical Design Methodology
material failure specifies a reference stress that acts as a basis for failure in elastic
bodies. The resulting reference stress must be kept below the yield strength of the
material at all points of the body over the whole range of speed.
It is essential to include the overspeed conditions to the mechanical analysis of the
motor to avoid the mechanical failure of the rotor. As a result, the rotational speed
used for the stress analysis has to be defined higher than the rated operational speed
of the motor. Usually, a safety factor of 1.2 is applied for overspeed considerations
which will be the case in this work. For the mechanical design and analysis of the
rotor the overspeed will be used, and the rated operational speed will be used for
stress analysis during the tests.
3.2 Rotor Vibrations
Vibrations occur in any rotating system and are caused when the centre of the
system mass is not positioned at the rotational axis, i.e. when the system is not
balanced. It is impossible to completely avoid imbalance because of the finite
tolerances during manufacture, resulting from the limitations of the construction
machines and techniques. Once rotating, this unbalanced mass experiences
centripetal forces which in turn generate vibrations in the system, this is also
known as whirling. The vibrations cause rotor deflection, which can reach
dangerous levels, particularly if the rotor speed approaches critical/resonant
frequencies. If the operation at resonant frequencies does not cause immediate
failure by the rotor contacting the stator, then prolonged operation at this point
will significantly reduce the lifetime of the system.
3.2.1 Rotor Slenderness (Aspect Ratio)
Addressing the rotor vibration issue is complicated and includes careful mechanical
design of the rotor and bearing. The various resonant frequencies of the motor are
estimated using numerical, analytical and finite element methods, with numerical
and finite element methods having a higher precision compared to the analytical.
As a result, analytical methods often tend to be used in early stages of design to
predict the resonant frequencies, while the FEA methods are used at later stages to
identify them precisely and optimise the design further.
In order to ensure stable operation at the maximum design speed [97], the maximum
rotor slenderness, λmax, can be calculated using Eq. (3.6). The slenderness ratio is
used as a measure of stiffness and is the ratio of the length over diameter of the
rotor.
42

Chapter 3. Mechanical Design Methodology
λmax > λs =LF
ROD
=LFe
α2rr(3.6)
where λs, LF and ROD are the rotor slenderness, the full rotor length and the rotor
outer diameter. α is the ratio of the active length, LFe, and the rotor length, L, as
expressed in Eq. (3.7).
α =LFe
L(3.7)
3.2.2 Vibration Modes
For systems consisting of bearings and a shaft, the vibration modes should be
carefully investigated [64] which are shown in Fig. 3.4:
Figure 3.4: The Bounce, Rock, First and Second Bending Resonant Modes.
The first modes of vibration are either bouncing of the system parallel to the
rotational axis or rocking of it between the bearings, which are caused by the
spring like behaviour of the bearings.
43

Chapter 3. Mechanical Design Methodology
The second vibration mode is the bending of the system in response to the transverse
load force caused by the unbalanced mass. This deformation, which is also known as
the bending mode, increases significantly as the transverse load oscillation proceeds
towards a natural frequency of the system. The natural frequency of the system is
an intrinsic property of the system based on its structure and stiffness. The natural
frequency associated with the first bending mode is also known as the critical speed
of the system, whose bending mode looks like half a sine wave [98].
The mentioned vibration modes also occur for the rotor system of the high speed
electrical machines. The rotor design ideally avoids the vibration frequencies over
its operating speed range. Constructing the most balanced system possible, or
choosing a design speed below the resonant frequencies will do so. However,
operating at speeds above the vibration frequencies is possible if the system
deflection is maintained at its minimum. One way to do so is soft mounting the
bearings. This will reduce the effective stiffness of the bearings which in turn
significantly reduces the frequencies where rocking and bouncing modes occur
defining a minimum threshold for the motor operating speed. Furthermore, if the
system is accelerated rapidly throughout the resonant speeds, the system
deflection can be limited allowing operation at higher speed ranges than the
resonant frequencies.
The vibrations of the rotor are of two distinct types; resonant and self excited.
An oscillating force, which is often the mass imbalance of the rotor, can cause
the resonant vibrations if its frequency occurs at one of the natural frequencies of
the rotating system. Additionally, self excited vibrations do not need any external
force to occur, but they appear once the speed of the rotating system has passed
a certain threshold which is identified by the intrinsic properties of the rotating
system. Operating at self excited vibrations is practically impossible as they make
the system unstable. On the other hand, if the rotor is capable of storing enough
energy in the external dampers, the critical frequencies of the resonant vibrations
can be passed with no failure. For this, soft mounting techniques are used which
allow the speed to pass through the first two resonant modes.
The first critical frequency of the rotor is in direct relation with the shaft diameter
and in inverse relation with the stack length and the rotor weight as these will
increase the rotor lateral stiffness [99].
Finally, the gyroscopic moment can give rise to critical frequencies of the rotor. This
effect is called the gyroscopic stiffening and appears due to an additional mass on
the rotating object. If the rotor is not symmetrical, the centre of gravity does not
meet at the centre of the shaft, resulting in gyroscopic stiffening.
Torque is proportional to the volume of the rotor. The outer diameter of the rotor is
designed to be as small as possible in order to decrease the centripetal forces acting
44

Chapter 3. Mechanical Design Methodology
on the rotor caused by the peripheral rotational speed. The axial length of the rotor
can be increased in order to achieve a larger torque. However, the critical speeds
should be carefully considered as they can cause mechanical failures.
In order to estimate the first critical speed, it is assumed the shaft is a clamped
beam. The critical speeds (in revolution per minute) of the rotor correspond to its
natural frequencies. The first natural frequency, fn, can be obtained using Eq. (3.8).
fn =60
2π
√
48EπD4a
64l3m(3.8)
where E is material’s Young Modulus, Da and l are the shaft diameter and the
distance between the midpoint of the bearings, respectively, m is the mass of the
shaft, and all are demonstrated in Fig. 3.5. Although here the presence of the rotor
lamination is ignored, it is believed that the rotor lamination would increase the
first natural frequency by having a larger structural stiffness [73].
Figure 3.5: Main Parameter for Evaluating Critical Speed
3.2.3 Predicting the Critical Speeds using Rayleigh’s
Method
The simple structure of the rotor of an SRM means the rotor can be assumed to be
a single rigid body of material,
Using Eq. (3.9) the shape function of the nth resonant mode of a uniform beam with
clamped ends can be predicted, where
yz = y0 sinnπz
Lsh
n = 1, 2, 3... (3.9)
where yz is the deflection at a point at an axial distance of z on the shaft, Lsh is
the shaft length and y0 is the maximum shaft deflection. The laminated part of the
45

Chapter 3. Mechanical Design Methodology
rotor has a larger radius and is much stiffer compared to the section of the shaft
that the bearing is mounted on, causing the second moment of area to vary along
the length of the rotor from maximum for the thicker radius to minimum for the
thinner one. This affects the shape function, resulting in flattening along the active
part of the rotor [64].
This method can provide a quick prediction for the critical speed of the rotor. The
information included in the shape function consists of the shape information and the
deflection magnitude and only the later is relevant for the purpose of this analysis.
This shape form is highly dependent on the aspect ratio of the rotating system which
is the ratio of the length over radius of the active part of the rotor. Therefore, a
simple beam having a high aspect ratio would result in a sine wave form for the
shape function. On the other hand, a disk having a low aspect ratio would have a
trapezoidal form to it.
3.2.4 Predicting Critical Speed Using the FEA Method
The FEA method provides an accurate analysis of the critical speeds. This method
allows the inclusion of bearings stiffness which helps in accurately predicting the
resonant modes and the critical speeds. In this work only the results of the FE
model are used.
3.3 Bearings
Any rotating system requires a set of bearings in order to maintain the rotational
axis. Bearings may rotate or slide, or do both.
3.3.1 Bearing Types
Commercially available bearings are extremely restricted by the demands of the
market in terms of their speed capabilities. However, growing interest in high
speed applications for electric motors is expected to drive the market for higher
speed bearings. Different combinations of bearings may also demonstrate different
capabilities in dealing with the orientation of the load (axial or radial).
There is a vast range of types and configurations to choose from for the electrical
machine applications. There are three major types of commercially available
bearings:
• Magnetic bearings
46

Chapter 3. Mechanical Design Methodology
• Air Bearings
• Rolling element (balls or cylinders) bearings
Using magnetic bearings can overcome the problems of limited shaft diameter and
the need for lubricating the bearing by using magnetic forces, however their
significant cost is their biggest downfall. Furthermore, active magnetic bearings
involve a complex system including sensors actuators and control, resulting in a
larger volume.
Air bearings use a thin layer of compressed air between the load and the bearing and
are used mainly in applications where high speed or precision is required. The main
disadvantage of this type of bearing is the requirement for compressed air, unlike
the mechanical bearings, which leads to need for power consumption [100].
Ball Bearings are the most popular type which use rolling balls in a lubricated race
way to bear rotating shafts with minimum friction. The frictional heat generation
at the rolling element is related to its tip speed, therefore bearings suitable for high
speed applications require a smaller diameter compared to lower speed bearings.
Constant lubrication of the rolling part of the bearing, by for example using an oil
pump, can remove the generated heat and reduce the wear by decreasing the contact
area between the rolling and stationary parts of the bearing. This will increase the
life time and service speed of the bearings.
3.3.2 Bearing Selection
In the process of bearing selection, different factors such as the lubricating method
and the maximum nominal service speed for the lubricating method must be
assessed. This narrows down the suitable bearing types and once the bearing is
selected, its inner race diameter will be determined by the shaft’s diameter.
The bearing size is based on the shaft diameter. Bearings with large inner diameters
have a lower life as the rotational speed is increased. As a result, the shaft diameter
should be as small as possible to permit a longer bearing life. However, the shaft
diameter is determined by the output torque. As the temperature of the bearings
rises it might be necessary to cool the bearings by pumping lubricant into them in
order to reduce the temperature difference between the inner and outer rings of the
bearing. The viscosity of grease and oil, which are the major lubricating materials
used in bearings, limits the maximum operating speed of the bearing. For high speed
applications grease and for super high speed applications, oil is the best lubricant.
In high speed applications, special attention should be given to the bearing choice
because they are the only components in contact with the rotor. High speed bearings
47

Chapter 3. Mechanical Design Methodology
need to operate reliably at high speeds and high temperatures with minimum noise
whilst having acceptable stiffness. Therefore, in high speed applications hybrid
rolling bearings are used. This type of bearings has one inner and one outer ring
in between which balls made of high stiffness and low density ceramic (e.g. Si3N4
silicon nitride) are placed.
The bearings used in this work are of angular contact type. A simple schematic of
them is shown in Fig. 3.6. D is the bearing outer radius, d is the bearing inner
radius and B is the bearing width. In this case a pre-load washer is used to apply
axial pre-load. However, this type of bearing comes with a higher mechanical loss
compared to magnetic or air bearings. This mechanical loss is in direct relation to
the rotational speed and the frictional torque.
Figure 3.6: Single Angular Contact Bearing.
3.3.3 Bearing Mounting Types
The next critical step after choosing the bearing is mounting it on the shaft and in
the housing. The tolerance of the shaft and housing along with the dimensions for
mating shoulders are specified by the manufacturers and should be adhered to.
Using the correct amount of lubrication is crucial in achieving the full life of the
bearings. Excessive lubrication results in overheating, on the other hand,
inadequate lubrication leads to excessive wear and eventual failure. Different
applications require different types of lubrications; however, pre-lubricated, sealed
bearings are available.
If the bearings have higher stiffness compared to the rotor, they are called hard
mounted and conversely if they have lower stiffness they are called soft mounted.
48

Chapter 3. Mechanical Design Methodology
Hard mounting is used for applications where precise position is required. On the
other hand, for applications which precise location for the rotational axis is not
necessary and larger displacements can be tolerated, soft mounting is used. Soft
mounting allows easy passage over the natural frequencies of the system.
Although, in hard mounted cases the bearings can be assumed stiff and their
compliance ignored, in soft mounted cases the bearing compliance needs to be
included [101].
Angular contact bearings can bear loads in the axial and radial direction. In
applications where a high global stiffness along with high axial and radial loads are
needed, a back to back connection is preferable. In applications where high axial
loads are needed the tandem connection is preferred. For a back to back
connection, the side of the bearings where the outer race has a wider surface are
arranged to face each other. If the wider side of the bearing outer race is facing the
shorter side of the next bearing, it is a tandem connection. Back to back and
tandem connections are illustrated in Fig. 3.7.
Figure 3.7: Angular Contact Bearing Connections, Back to Back (Left) and Tandem
(Right)
For prototype manufacturing for this work a single bearing was deemed sufficient.
Care needs to be taken in mounting a single bearing on the rotor as the balls will be
pushed out of their place or ‘de-raced’ if mounted the wrong way. The side faces of
the outer race of the angular contact bearings have different lengths. Each bearing
is mounted on either side of the rotor with the shorter side of the outer race facing
the rotor. In this way, the movement of the rotor only presses the balls toward the
longer side, avoiding de-racing and bearing failure.
3.3.4 Pre-load
Preload is applied in applications where high precision is required. The pre-load
increases the rigidity of the rotor which in turn decreases the unwanted bearing
49

Chapter 3. Mechanical Design Methodology
displacement. This can be achieved by implementing a pre-load spring. Pre-load
springs come in conical or waved washer shapes. The pre-load spring selection is
based on the design applied pre-load force which will be explained later.
3.3.5 Bearing Specification
After carefully considering all the aspects involved in the bearing selection, an
angular contact ball bearing is employed for this work. This is due to greater
robustness and general smaller size of ball bearing coupled with their independence
of any auxiliary equipment. This particular type of bearing has ground surfaces
making it suitable for any given mounting configuration. The full specification of
the selected bearing is presented in Table 3.1.
Table 3.1: Bearing Specification
Specification Type Symbol Unit
Manufacturer SKF - -
Type High Precision Angular Contact - -
Ball Ceramic Coated Hybrid Ball - -
Row Number Single Row - -
Lubricant Grease - -
Rated Speed 68,000 n [rpm]
Bore Diameter 20 d [mm]
Outside Diameter 37 D [mm]
Width 9 B [mm]
3.4 Shaft
The shaft is a rotating part of the electrical machines that transfers the mechanical
power generated to the load. The process of shaft design should consider avoiding
operation at, or near the natural frequencies. The shaft design process includes
determining the rotational velocity, the torque, the position and dimensions of the
other components attached to the shaft specially the location of the bearing, the
forces posed on the shaft, and finally selecting the right material.
Designing the shaft as short as possible helps in reducing the deflection and bending
moments while increasing the critical speed. The stress raisers should be placed
as far as possible from high-stress points of the shaft. Hollow shafts are used in
50

Chapter 3. Mechanical Design Methodology
applications where better stiffness to mass ratio and higher natural frequencies are
required.
Power can be transmitted from one shaft to another via a coupling. These can
be rigid or flexible. Rigid couplings allow no relative motion between the shafts.
Despite the high risk of stresses in this type, they can be useful in applications
where accurate alignment is essential. On the other hand, flexible couplings allow
axial, regular and angular misalignment to some extent.
The cross sectional area of the shaft is proportional to the torque being transferred.
When designing a motor to run at high rotational speeds, the outer diameter of
the rotor must be as small as possible in order to decrease the centripetal forces
acting on the rotor. Consequently, the axial length of the rotor tends to increase
in order to achieve the required output torque. However, when increasing the rotor
axial length, the critical speeds need careful consideration. The shaft of high speed
machines should be made of a magnetic steel with a high yield strength.
The minimum shaft diameter, can be estimated using Eq. (3.10) where T , J and
τ are torque, polar second moment of area and shear stress, respectively. r is the
radial distance from centre. This expresses the torsion in a beam.
T
JP=τ
r(3.10)
For a beam with a solid circular profile, JP is calculated using as Eq. (3.11).
Jp =π
2r4 (3.11)
Combining Eq. (3.10) and Eq. (3.11) the minimum allowable radius for the shaft is
obtained using Eq. (3.13) the result of which is presented in Table 3.2
2T
πr4=τ
r(3.12)
r =3
√
2T
πτ(3.13)
However, given the mechanical stresses imposed on the shaft, a 20% increase was
considered for the shaft diameter to ensure extra robustness. Finally, taking into
account the measurements of commercially available bearings and the coupling
requirements, a shaft radius of 10 mm is considered for the design.
51

Chapter 3. Mechanical Design Methodology
Table 3.2: Torsion in Shaft Parameters
Parameter Symbol Unit Value
Torque T Nm 56
Shear Stress τ MPa 20
Minimum Allowable Shaft Radius r mm 5.6
3.4.1 Tip Speed
As no retaining sleeve will be used, a maximum rotor tip speed of 250 m/s is applied
to determine the upper limit of the operational speed [102,103]. Eq. (3.14) expresses
the tip speed as, Vtip, a function of angular speed, ω, and rotor radius, rr.
Vtip = ωrr (3.14)
For the operation speed of 5236 rad/s (50,000 rpm) and a radius of 45.5 mm, the
tip speed is equal to 238.2 m/s, indicating a feasible set of dimensions for future
investigation.
3.5 Balancing
Although the manufacturing process is carried out to a tight tolerance, an imbalance
is unavoidable. This creates a whirling force that is defined in Section 3.2.
The imbalance can be significantly reduced using a balancing machine. The motor
application will define the balance quality grade. The permissible centre of gravity
displacement for the operational speed can be identified using a look up table and
material removed to re-balance.
3.6 Acoustic Noise
In some applications reducing acoustic noise is very important. The same
technique for dealing with the critical frequencies applies for the acoustic noise.
The stator should be designed to achieve the maximum possible natural frequency
and minimum possible harmonic components caused by the magnetic radial force
for the stator. The target is to achieve a dominant mode frequency above the
audible frequency range. Higher mode frequencies can be achieved by making a
thicker stator back iron. However, a thicker back iron will result in a lower power
52

Chapter 3. Mechanical Design Methodology
density because of the reduced iron utilisation. Also, in cases where there is
limited space for the motor, increased stator back yoke results in a smaller
available area for the coils leading to a higher current density and also higher
thermal diffusion distance from the coils to the ambient.
3.7 Windage Loss
In high speed SRMs, a high viscous drag appears in the air gap, Pdrag which causes
power loss that can be estimated using Eq. (3.15), where K is the roughness
coefficient of the rotor surface, Cd is the rotor drag coefficient, ρair is the air
density, ω is the rotor angular velocity, rr is the rotor radius and Ls is the stack
length [79, 104].
Pdrag = KCdρairπω3r4rLs (3.15)
The detailed investigation into the windage loss of the motor will be presented in
Chapter 6.
3.8 Conclusion
In this chapter, the mechanical design methodology of an SRM has been discussed.
High operational speeds impose mechanical constraints on the rotor. Therefore,
the biggest challenge of the design process is addressing the mechanical constraints.
The mechanical constraints, which are in direct proportion to the square of speed
and radius, limit the outer diameter (by means of stress concentration) and the
length of the rotor (by means of vibration frequencies and the first bending mode
in particular).
In rotating systems, due to manufacturing constraints, it is impossible to precisely
match the centre of the mass to the centre of rotation. The increasing rotational
velocity, which acts at the centre of mass, results in bowing of the shaft caused by
centrifugal force. The increase in the shaft bow exaggerates the eccentricity which
in turn further increases the centrifugal force. This can be diminished by balancing
the system and optimization of the geometrical parameters of the system.
One way to deal with the vibration issue is to accelerate the shaft fast enough to
pass through and beyond the first natural frequency before the amplitude of the
vibrations become significant, passed this point, the shaft can be operated at a
speed larger than the natural frequency.
53

Chapter 3. Mechanical Design Methodology
The choice of bearing is particularly important for this work due to the high
operational speed and consequently the required precision. Different bearing types
were discussed. High precision angular contact hybrid bearings were selected for
this work, whose specification were provided.
The rotor tip speed has been used to determine an upper limit for the operational
speed. For the operation speed of 5236 rad/s (50,000 rpm) and a radius of 45.5 mm,
the tip speed is equal to 238.2 m/s. This result falls well below 250 m/s which is
used as a rule of thumb to ensure a safe design speed.
The minimum shaft diameter needed to transfer the required torque is calculated.
Adding 20% to the radius to increase the robustness and considering the
commercially available bearings and the coupling requirementh, a 10 mm radius is
considered for the shaft.
54

Chapter 4
Electromagnetic Design
Methodology
This work focuses on designing an alternative SRM to replace the third generation
Toyota Prius motor. This is done by scaling down the frame size of an existing SRM,
with the same specification as the PM, denoted as SRM1, the process of which was
provided in Section 2.10.1. The detailed specifications of SRM1 can be found in
Table 4.1.
Table 4.1: Detailed Specifications of SRM1
Parameter Symbol Unit Value
Stator Outer Diameter SOD [mm] 264
Rotor Outer Diameter ROD [mm] 182
Stack Length LS [mm] 87
Maximum Power Pmax [kW] 60
Maximum Speed nmax [rpm] 13,500
Torque T [Nm] 207
DC Link Voltage VDC [V] 650
Fill Factor FF - 0.54
Stator/rotor teeth combination - - 18/12
Weight W [kg] 25.2
Iron Loss PFe [kW] 1.3
Copper Loss PCu [kW] 6.3
Efficiency µ [%] 89
The general principle of SRM operation is presented in this chapter. The methods
for selecting the number of phases, choice of the stator/rotor teeth combination, the
coil turns and the length of the air gap is discussed. Using the analytical method, the
rotor outer diameter, rotor pole pitch, tooth width and core back width is calculated.
55

Chapter 4. Electromagnetic Design Methodology
4.1 Introduction to SRMs and their Operation
Reluctance machines produce torque by the tendency of their rotor to move
towards a position to maximise inductance of the excited windings. If the phase is
excited while its inductance is increasing, it is in motoring operation mode. On the
other hand, exciting the phase with a decreasing inductance results in a generating
operation mode.
4.1.1 The Aligned Position
The arrangement where the central axes of a pair of rotor poles are exactly aligned
with the central axes of the stator poles of one phase is called the aligned position.
In this position the magnetic reluctance of the flux path is at its minimum, or
conversely inductance is maximised. It is in the aligned position that the stator and
rotor teeth are most likely to become saturated. If a phase in the aligned position
is excited, no torque will be produced as the inductance is already at its maximum.
However, if the rotor is positioned either side of the aligned position, the rotor
will move towards the maximum inductance position and in doing so will generate
torque.
4.1.2 The Unaligned Position
The arrangement where the rotor interpolar axes are exactly aligned with the central
axes of the stator poles of one phase is called the unaligned position. If the phase in
the unaligned position is excited, no torque will be produced. If the rotor is placed at
either side of the unaligned position, a torque is produced which will rotate the rotor
towards the next aligned position. Since the flux leakage is larger at the unaligned
position, compared to the aligned position, the saturation is significantly smaller.
4.1.3 SRM Operation Principle
The direction of the rotor movement and hence the torque is independent from the
direction of the current or the flux linkage, but instead on the sign of the rate of
change of inductance with position. The torque acts in a direction towards the
nearest aligned position. As a result, to produce a positive torque in motoring
operation mode, the rotor needs to be positioned in the forward direction between
an unaligned position and the next aligned position. In other words, to operate in
motoring operation mode, the phase should be excited while rotor is in the unaligned
position and unexcited while in the aligned position. The flux then needs to be
56

Chapter 4. Electromagnetic Design Methodology
reduced to zero before the rotor pole has completely left the stator one, otherwise
a negative torque (braking torque) is produced. To achieve a full rotor revolution,
each phase needs to be excited a number of times equal to the rotor pole number.
Instantaneous Torque
The torque production process of an SRM is explained in detail in [33,34]. Current
passing through a coil sets up a magnetic flux around the coil. It is not possible for
all of this flux to pass through intended magnetic path, a portion of the magnetic
flux not used for any work is called flux leakage. During the phase excitation period
(on time) part of the energy input from the supply is stored in the magnetic circuit
of the coil (stored field energy, Wf) and part of it is converted to mechanical work
(co-energy, W ′). The input electrical energy, We, is shown as the shaded area in
Fig. 4.1 and can be expressed as per Eq. (4.1).
We =Wf +W ′ (4.1)
The coenergy, W′, is the area between the magnetisation curve at any position and
that of the unaligned position which can be expressed as Eq. (4.2), and is visualised
in Fig. 4.1.
Figure 4.1: Coenergy and Stored Field Energy
The energy acquired from the supply before the turn off, that is not converted to
mechanical work, Wf , is stored in the magnetic field at aligned position and sent
back to the supply at turn off.
57

Chapter 4. Electromagnetic Design Methodology
W ′ =
∫ i
0
ψdi (4.2)
If a phase is excited using a constant current, i, over a short rotation angle, the
produced mechanical work is equal to the rate of change of co-energy with respect
to the rotation angle.
The torque produced by exciting one phase at any given rotor position is described
in Eq. (4.3).
T =
[
δW ′
δθ
]
i=const.
(4.3)
In the case of a constant current with an inductance that varies linearly with rotor
position, the electromagnetic torque of an SRM can be rewritten as Eq. (4.4)
where i is the excitation current and L(θ, i) is the inductance which is dependent
on saturation and position [105].
T =1
2
dL(θ, i)
dθi2 (4.4)
This equation can only be used to express the torque before the motor enters
saturation. It can be seen that the torque is proportional to the square of current,
allowing any direction of current to produce a unidirectional torque.
4.1.4 Equivalent Circuit
In order to create a basic equivalent circuit for an SRM, the mutual inductance
between phases is ignored as it is negligible. The supply voltage is expressed in
Eq. (4.5) as the sum of the resistive voltage drop and the rate of change of flux
linkage with time.
Vs = Rpi+dψ(θ, i)
dt(4.5)
where Rp is the phase resistance and ψ is the phase flux linkage and is defined as a
function of current and inductance in Eq. (4.6).
ψ = L(θ, i)i (4.6)
58

Chapter 4. Electromagnetic Design Methodology
Substituting Eq. (4.5) in Eq. (4.6) gives the supply voltage, Vs, as the sum of resistive
voltage drop, inductive voltage drop and the induced emf as shown in Eq. (4.7). The
basic equivalent circuit is visualised in Fig. 4.2 [34].
Vs = Rpi+ L(θ, i)di
dt+dL(θ, i)
dθωi (4.7)
Therefore, the induced emf is given as Eq. (4.8).
e =dL(θ, i)
dθωi (4.8)
Figure 4.2: Equivalent Circuit of a Single Phase
4.2 Design Investigation
When designing electromagnetic motors, numerical methods, analytical methods
and finite element analysis (FEA) methods are commonly used. Compared to
numerical and analytical methods, FEA is generally more accurate and, with
developments in computer technology, is the dominant method. However, the
other methods are still used in the early stages of the design process, as they can
reduce development time. In this work, some of the physical features of the motor
were calculated using numerical methods in the early stage of the design. The
FEA method was then used to precisely calculate the electromagnetic aspects and
optimise the physical specifications.
The losses in high speed electric motors are a major concern. Due to the high
frequency nature of the high speed operation, losses associated with frequency such
as iron loss and skin effect will rise. Using thin laminated material reduces the iron
loss. Also, using interwoven Litz wire can reduce the skin effect and proximity loss
(AC loss) issues. The major factor that influences the copper loss is the current
59

Chapter 4. Electromagnetic Design Methodology
density, regardless of the number of turns. Although increasing the stator pole
height allows more area for the winding and hence reduces the copper loss, it comes
with increased magnetic core loss.
4.2.1 Number of Phases
The preferred number of phases depends on the application. Numerous factors
are involved in the choice of number of phases. Starting capability and directional
capability improves for number of phases above one. Higher number of phases
increase the reliability of the motor as becomes tolerant of a single phase failure. A
three phase machine has higher power density compared to a two phase machine.
However, higher number of phases also means a requirement for a greater number
of power electric components, which inherently increases the total cost and reduces
reliability. Furthermore, in high speed applications, the efficiency is improved by
reducing the core loss which can be done by reducing the fundamental frequency
and ultimately the number of phases. In applications where high speed SRMs are
used, such as aerospace, a three phase system is favoured over a four phase one as
it reduces the size and the losses while maintaining thermal robustness.
If the number of phases increases the mean torque will increase by increasing the
number of strokes per revolution resulting in a decrease in torque ripple. It is
important that the choice of number of phases guarantees sufficient starting torque.
It is known that in the case of a three phase motor (or more) the rotor and stator
tooth width can be designed in a way that at any given position there is at least
one phase which produces torque [106]. Also, a higher number of rotor poles causes
the saliency ratio, which is the ratio between minimum and maximum inductance,
to decrease which in turn results in lower output torque. For this work 3 phases are
considered.
4.2.2 Stator/Rotor Teeth Combination
It is necessary to determine the stator/rotor tooth number at the beginning of the
design process. Typically for the design of high speed SRMs the stator/rotor tooth
number combination is chosen to be as small as possible in order to reduce the
fundamental switching frequency to its lowest possible value. This frequency can be
obtained using Eq. (4.9) where Nr and n are the rotor pole number and the rated
speed in rpm, respectively.
fe =Nrn
60(4.9)
60

Chapter 4. Electromagnetic Design Methodology
A low stator/rotor tooth combination has a negative effect on the electromagnetic
design especially on the output torque. The reduction in the torque is compensated
by increasing the rotor size.
As shown in Table 4.1, the stator/rotor tooth combination of SRM1 is 18/12. For
this work, a 6/4 combination is selected as it is the lowest possible for a three phase
motor. However, this results in a reduction in output torque. As a result, the scaled
down dimensions were modified to achieve the required output.
4.2.3 Analytical Design
The design ratios of radial SRMs are well established. These describe the different
geometrical aspects of the motor and are chosen to consider various characteristics
of the motor e.g. torque, acoustic noise, torque ripple, unaligned inductance, etc.
In [33,34] Krishnan and Miller have provided the detailed analytical design process of
the SRMs which is used to create a guide for some of the major physical specifications
of the motor, as follows.
The rotor outer diameter, ROD, should be about 60% of the stator outer diameter,
SOD, as is expressed in Eq. (4.10).
ROD = 0.6SOD (4.10)
Equation Eq. (4.11) expresses the rotor pole pitch, λ, as the ratio of circumference
to number of rotor teeth.
λ =πROD
Nr
(4.11)
The ratio of the rotor tooth width to the pole pitch is very important in the design
of SRMs. Having the rotor pole pitch, the rotor tooth width, tr, can be calculated
from Eq. (4.12).
tr = (0.3 ∼ 0.4)λ (4.12)
As only about half of the flux in each tooth passes through the stator yoke in each
direction, the stator yoke, ty, does not need to be wider than 60% of tooth width as
per Eq. (4.13).
61

Chapter 4. Electromagnetic Design Methodology
ty = 0.6tr (4.13)
There is no need to calculate the stator tooth width and core back width as the rotor
and stator can have equal tooth widths and core back thickness. The calculated
values for the geometrical dimensions of the motor are presented in Table 4.2.
4.2.4 Coil Design and Number of Turns
The diameter of each conductor of a coil of winding is chosen based on the fill factor
and the slot area. The permitted current density can be defined by the choice of the
cooling method. Typical current density values in respect to different motor cooling
methods include; 4.7 − 5.4 A/mm2, 14.0 − 15.5 A/mm2 and 23.3 − 31.0 A/mm2
for totally enclosed not ventilated (TENV) motors, external blower through cooled
motors and liquid-cooled motors, respectively [107]. The stator outer diameter can
be increased to allow more slot area to reduce current density, if there are no size
limitations [20].
Beyond the base speed, which is the minimum speed that can produce the maximum
power, the back emf rises to a level that limits the current, torque and therefore
reduces the power. In order to reduce the back emf and implement conventional
discontinuous current operation at higher operational speeds, a lower number of
turns is considered resulting in a boost in the output power. However, this would
come with a torque reduction at lower operational speeds which in turn results in
an increase in the rating of the inverter’s silicon and the drive cost.
The high speed operation of motor requires a high electrical switching frequency.
High switching frequencies cause high levels of AC losses in the conductor. In order
to address this issue, Litz wire is used. This type of wire takes its name from
Litzendraht the German word for braided. Litz wire consists of several strands of
woven thin insulated conductor and offers lower proximity loss and skin effect, when
compared to a solid conductor.
Litz wire selection considered the calculated skin depth at 3.3 kHz (which will be
explained in following chapters), a simple winding process and the commercially
available Lits wires. A Class F, 155C rated, red heavy polyurethane-nylon
(MW80-C) wire was selected which consists of 5× 3× 33 (or 30) strands of wire.
Given the 50% fill factor, the available copper area of a slot is equal to 25.04 mm2.
This meets the copper area provided by the Litz wire which is 25.08 mm2
nominally. The finished coils do not use the supplier’s maximum recommended
current density of 0.25 mm2/amp for windings which necessitates the cooling of the
62

Chapter 4. Electromagnetic Design Methodology
litz construction in some manner. Finally, the wire design requires a voltage rating
of 600 V. This requirement was met by means of using appropriate thickness for
the slot isolation. A voltage rating is usually included to the Litz construction by
using a tape layer or an extruded layer, which was not required for this work.
4.2.5 Air Gap
In high speed SRMs the core loss and the windage loss are higher. The air gap width
substantially affects this. A large air gap would require high MMFs to achieve the
same flux, hence large copper loss. On the other hand, a narrow air gap requires a
level of precision that makes manufacturing difficult, and viscous drag is larger [79].
For high speed SRMs it is common to use an air gap of 0.2−0.3 mm. For this work,
an air gap of 0.3 mm was chosen to ease the manufacturing of the prototype.
4.3 Motor Specification Investigation
The rotor dimensions; for tooth height, tooth width and core back thickness are
similar to the stator. The rotor outer diameter is finalised using stress analysis
which will be presented in chapter 5. This suggests the initial SRM design which is
shown in Table 4.2.
Table 4.2: Detailed Specifications of SRM
Parameter Symbol Unit Value
Stator Outer Diameter SOD [mm] 176
Stator Core Back Thickness ty [mm] 15
Rotor Tooth Width tr - 25
Air gap Width t [mm] 0.3
Rotor Outer Diameter ROD [mm] 105
Stack Length Ls [mm] 58
Maximum Power Pmax [kW] 60
Maximum Speed ωmax [krpm] 50
Torque T [Nm] 56
DC Link Voltage VDC [V] 600
Fill Factor FF - 0.5
Stator/rotor teeth combination Ns/Nr - 6/4
Number of Turns N - 8
Number of Phases q - 3
63

Chapter 4. Electromagnetic Design Methodology
4.4 DC Voltage
The phase voltage in SRMs is proportional to the number of turns of each winding
and the magnetic flux per tooth. Keeping the motor dimensions and air gap width
fixed, the magnetic flux per pole is proportional to the voltage that is applied across
that winding and inversely proportional to the number of turn of each coil.
It is therefore the case that output torque of an SRM can be controlled by adjusting
the voltage to number of turns ratio. For instance, after finding a suitable number
of turns for the required fill factor, the voltage can be varied to reach the desired
torque [79].
4.5 Conclusion
The electromagnetic design methodology and operating principles of a high speed
SRM were discussed in this chapter.
The design process began with scaling down the geometrical parameters of an
existing SRM, which has same specifications as the PM machine used in the
Toyota Prius, with a ratio of 1.5:1. This was obtained considering a maximum
speed of 50,000 rpm whilst maintaining an output power of 60 kW.
Next, the resulting values were processed using analytical methods to indicate the
values for the other major geometrical parameters. The rotor outer diameter, the
stator core back thickness and the rotor tooth width were calculated in this way to
be 105 mm, 15 mm and 25 mm, respectively.
The high speed operation imposes a number of requirements on the electromagnetic
aspects of the design process. An airgap width of 0.3 mm was considered for this
work, which is common for high speed SRMs. The high speed operation also results
in a high switching frequency, therefore 6/4, which is the lowest stator/rotor pole
combination for a 3 phase machine, was selected.
For a high speed application, the back emf rises to a level that limits the current and
consequently the torque, a trade off between the supply voltage and the number of
turns on the coil, as they are inversely proportional. Using a lower number of turns
for the coil reduces the back emf, resulting in an increase in the output power. As a
result, 8 turns of conductor for each coil windings were selected. In order to address
the high AC copper loss which is caused by the high seed application, Litz wire is
implemented in this work.
64

Chapter 5
Mechanical Design Investigation
When designing high speed machines, the mechanical constraints (the stresses and
the natural frequencies) have higher priority when compared to the thermal or
electromagnetic ones. In order to develop as much torque as possible, the physical
dimensions of the rotor, especially the outer diameter, are chosen to be as close to
the mechanical limit as possible. As a result, it is vital to investigate the rotor
reaction as precisely as possible. Ensuring the robustness of the rotor for the
design speed is the main challenge of this work.
Various approaches to address the mechanical constraints for different types of
electrical machine have been taken. The process usually consists of predicting the
stresses using an analytical model, then confirming this using Finite Element
Analysis (FEA). In this work, the the analysis is carried out using only the FEA
method.
In this chapter, the mechanical constraints will be investigated for the rotor of a
radial (conventional) SRM. This motor is designed to replace an existing SRM,
SRM1, that has the same output specifications, outer diameter and stack length as
the PM machines used in the Toyota Prius. Some of the specifications of SRM1 is
given in Table 5.1.
The mechanical stresses imposed on the rotor are simulated here. The notch effect
and hoop stress are the major causes of the mechanical stresses. Suitable approaches
to address each one of these are suggested and simulated. This leads to a new rotor
topology for an SRM which applies a flywheel topology to the rotor. The proposed
topology will be analysed for high speed operation with different rotor specifications
investigated.
Decisions over the choice of materials are explained. This along side the estimate
of the rotor stiffness is used to calculate the vibration frequencies and determining
the vibration modes.
65

Chapter 5. Mechanical Design Investigation
Table 5.1: Detailed Specifications of SRM1
Parameter Symbol Unit Value
Stator Outer Diameter SOD [mm] 264
Rotor Outer Diameter ROD [mm] 182
Stack Length LS [mm] 87
Maximum Power Pmax [kW] 60
Maximum Speed nmax [rpm] 13,500
Torque T [Nm] 207
Stator/rotor teeth combination - - 18/12
Weight W [kg] 25.2
5.1 FEA model for Mechanical Analysis
It is common for high speed permanent magnet rotors to be contained within a
prestressed sleeve which prevents the surface mounted magnets from lifting off the
rotor. In high speed SRMs, this technique is also used despite the lack of magnets, it
reduces the large windage loss of SRMs by providing a smooth airgap surface. This
can also be achieved by using a flux bridge [79,83]. However, adding this sleeve does
increase the magnetic air gap resulting in a reduced electromagnetic performance.
5.1.1 Simulation Assumptions
ANSYSTM software was used to study the rotor mechanical stresses. The physical
properties of the electrical steel including material density and isotropic elasticity
(Young’s Modulus and Poisson’s ratio) were required input for the FEA model.
These data were found on the material data sheet. The contact area between
different rotor components are assumed to be frictionless. However, this
assumption should be made with the effects of Poisson’s ratio in mind. Poisson’s
ratio is a measure that defines the expansion of a material under a compressive
force, in the directions that are perpendicular to the axes of the compressive force.
It is known that Poisson’s ratio effects can lead to significant strains in the axial
direction in high speed motors. Assuming a frictionless contact results in
unconstrained rotor components in the model, which in turn will not undergo any
stress in the axial direction. However, as the Poisson ratios of the different rotor
components are the same and they are under the same stress magnitude, the
assumption of frictionless contact is possible [64].
An elastic body subjected to different loads in three directions would require a three
dimensional stress system. Each single point inside the rotating body is undergoing
66

Chapter 5. Mechanical Design Investigation
stresses in different directions with changing stress magnitude from point to point
within the object. It is possible the combined stress at each point exceeds the
material’s yield strength, despite the principal stresses acting on the object in the
x, y and z directions being below the yield strength. The Von Mises criteria is the
equivalent stress of the three principal stresses, which is described as Eq. (5.1)
(S1 − S2)2 + (S2 − S3)
2 + (S3 − S1)2 = 2S2
e (5.1)
where Se is the equivalent or Von Mises stress with S1, S2 and S3 being the principal
stresses in different directions. Therefore, Von Mises stress is merely a criterion to
determine the equivalent stress at each point, not a real stress. The stress analyses
from here-forth will only consider the Von Mises stress.
5.2 Design Process
It was explained in Section 2.10.1 how the motor was scaled down. The physical
measurements of the motor were then calculated using an analytical method. During
this process, the stator/rotor tooth number was reduced from 18/12 to 6/4 to avoid
a high switching frequency and resulting iron core loss. As a result, the initial
electromagnetic analysis showed the scaled down motor could not meet the specified
torque requirement of the project. This can be compensated by increasing the rotor
active length from 58 mm to 95 mm.
The rotor topology and material need to be investigated closely for the rotor stress
which in turn can limit the permissible size of the rotor and its electromagnetic
capability.
In this chapter the stress concentration on the rotor is studied and improved. This
is carried out while ensuring the final design will meet both the electromagnetic
output of the motor and rotor safety factor. From an electromagnetic point of
view, the output torque is the subject of the investigation, while the maximum
stress and the resonant frequencies are the investigated mechanical constraints.
The electromagnetic and mechanical improvements are carried out using the FEA
methods. The rotor component materials and the maximum speed are the given
conditions for the mechanical analysis, which define the maximum allowable radius
for the rotor. These findings go hand in hand with the torque requirement of the
design. Having made the required improvements on the length of the rotor to
achieve the target torque, the design is analysed for the resonant vibrations to
identify the critical speed. The more detailed electromagnetic analysis is to follow
in the next chapter.
67

Chapter 5. Mechanical Design Investigation
5.3 Mechanical Analysis
Determining the stresses induced by the centripetal force on the rotating parts is
crucial, as if yield strength is exceeded, failure or permanent deformation will
occur. The maximum stress tolerated by the material before failure is called its
yield strength, which is a property of the material stated by the material
manufacturer. Usually during the design process the total maximum stress due to
rotation is maintained below the yield strength. This can be done either by
designating a safety factor or by fatigue analysis. The latter requires knowledge of
the duty cycle, and as this information was not provided by the supplier due to
customer confidentiality, the former was adopted for this test.
Two aspects of the rotor’s mechanical behaviour are investigated; the mechanical
stresses and the resonant frequencies.
5.3.1 Conventional SRM Rotor Topology
The electrical steel used for a high speed rotor needs to have high yield strength
to be able to tolerate the high mechanical stresses associated with the high speed
operation. Therefore, after consulting the manufacturer (Cogent Steel) M250-35HS
electrical steel was chosen for this work. This material is suitable for high speed
applications and has a guaranteed yield strength of 400 MPa and a typical yield
strength of 450 MPa [108].
The mechanical analysis started by running the stress analysis on an SRM rotor
with a conventional topology. For this model, only one rotor lamination was
considered in the simulation as there is no shear stress present (apart from the
possible shear caused by the glue that is very small and negligible). As the rotor is
not using a retaining sleeve, any need for adding compressive forces is eliminated.
The simulations solved for the equivalent stress and the total deformation.
However, the maximum principle stress was also observed for all the simulations.
The stress map is illustrated in Fig. 5.1 which showed a maximum equivalent
stress of 1210 MPa concentrated at the sharp corners at the bottom of the rotor
teeth (caused by the notch effect) followed by stress concentration around the
shaft bore (caused by the hoop stress).
5.3.2 Addressing The Notch Effect
The maximum equivalent stress is concentrated around sharp corners at the bottom
of the rotor teeth, as a result of the notch effect. The common practice to address
this issue is to add fillets to the sharp corners, however, the analysis showed adding
68

Chapter 5. Mechanical Design Investigation
Figure 5.1: Stress Analysis of a Conventional SRM Rotor
two fillets to the bottom of each slot on either side increases the number of sharp
angles in each slot (the start and end point of each fillet), and hence does not help
the stress.
To combat this issue, a tangential curve was used to connect every two adjacent
teeth, providing a smooth path whilst removing any sharp corners. The stress
analysis showed a maximum equivalent stress of 511 MPa, which can be seen in Fig.
5.2. The stress magnitude was still higher than the allowable 450MPa. This stress
is concentrated around the shaft bore and is caused by the hoop stress. Therefore,
other topologies for the rotor were required.
5.3.3 Addressing The Tangential Stress
It can be seen from Fig. 5.2 that the maximum stress was concentrated around the
shaft bore. This excessive stress was caused by the hoop stress. In order to reduce
the hoop stress, a fly wheel topology is applied to the rotor.
69

Chapter 5. Mechanical Design Investigation
Figure 5.2: Stress Analysis of a Conventional SRM Lamination with Added Fillets
5.3.4 Flywheel Structure
The idea to use a flywheel structure to the rotor is taken from a patent by Prof.
Keith Pullen [109]. A simple schematic a flyweel is shown in Fig. 5.3. This method
completely removes the shaft bore where the hoop stress is concentrated and uses
cheek plates and tie rods to sandwich the laminations.
However, the shape of the tie rod cuttings has a direct impact on the equivalent stress
on the laminations. The Pullen patent suggests a number of overlapping circles for
the tie rod cuttings. These circles are distributed on a tangential direction, as shown
in Fig. 5.4, and are claimed to significantly reduce the equivalent stress. However,
the proposed cutting shape for the tie rods were found not to be suitable for the SRM
rotor topology since, compared to a cylindrical flywheel, an unbalance is introduced
to the rotor structure due to the presence of the rotor poles. Therefore, a simple
circular cutting shape was found to be sufficient for the tie rod cuttings.
70

Chapter 5. Mechanical Design Investigation
Figure 5.3: Flywheel Simple Schematic
Figure 5.4: Comparison of the the a) Circular Tie Rod Cutting and b) The Over
Lapping Circle Cutting Shape as Proposed by Pullen
71

Chapter 5. Mechanical Design Investigation
A simple schematic of the proposed topology is presented in Fig. 5.5. In the proposed
topology, the laminations do not have a shaft bore. Instead, they are sandwiched
between two cheek plates which are bolted together using tie bars. Each one of the
cheek plates has its own external shaft extending along the rotating axis that is used
to transfer the torque to the load.
Figure 5.5: Rotor Simple Schematic with a Flywheel Structure
5.3.5 Physical Features of the Proposed Model
Next, the physical dimensions of the proposed rotor design were investigated closely
for their effect on the mechanical stresses. A final design which ensures the lowest
possible stresses in the rotor can then be achieved. The parameters subject to
investigation are illustrated in Fig. 5.6.
Tie Rod Cutting Diameter and Location (TrD and Trr)
To keep the cheek plates and laminations together tie rods are used. In order to feed
through the laminations, a cut needs to be made. The rods themselves also have to
be thick enough to sustain the forces applied to them by the rotating laminations.
The location and shape of the tie rods therefore has been investigated. If placed
closer to the rotor outer diameter, they will be close to the varying magnetic field
and susceptible to eddy current induction, which will give rise to heating and loss.
On the other hand, moving them closer to the center of the rotor will lead to
increased mechanical stresses on the laminations. The shape of the holes also affects
the hoop stress. Simulations showed circular cuttings would have the lowest stress
concentrated around them. The number of the cuttings has been chosen to be equal
72

Chapter 5. Mechanical Design Investigation
Figure 5.6: Detailed Drawing Dimensions of The Proposed Rotor
to the rotor teeth number to ensure symmetry, hence lower stresses. If the rods are
too small in diameter, they will not withstand the applied forces. Without any tie
rod holes, an equivalent stress of 239 Mpa is obtained via simulation on a lamination
with no shaft bore. Adding the holes increases the stresses, however, Fig. 5.7 shows
the stresses seem to vary little with increases in hole diameter. Considering the yield
strength of the tie rod material, a 6 mm diameter is selected. The location of the
tie rod cutting is investigated and shown in Fig. 5.8, for a given diameter of 6 mm.
It is decided to locate the tie rod holes 26 mm radially from the rotor centre as they
will be safely away from the rotor teeth and the changing field whilst maintaining
the equivalent stress below the yield strength of the laminations. This ensures the
minimum possible equivalent stress.
Fillet Radius(hr)
The radius of the tangential curves added to the base of the rotor teeth has been
also investigated. It was expected that smaller radii would experience lower stresses
however, this reduces the rotor tooth height, leading to higher flux leakage. The
optimum value of the fillet size is given in Table 5.3. It should be mentioned that
the centre of the radius is assumed to be fixed in the space and only the value of
the radius is changed.
73

Chapter 5. Mechanical Design Investigation
Tie Rod Cutting diameter [mm]1 2 3 4 5 6 7 8
Equ
ival
ent S
tres
s [M
Pa]
365
370
375
380
385
390
Figure 5.7: Tie Rod Cutting Diameter Vs. Equivalent stress
Tie Rod Hole Location From Centre [mm]22 23 24 25 26 27 28 29 30
Equ
ival
ent S
tres
s [M
Pa]
340
350
360
370
380
390
400
410
Figure 5.8: Tie Rod Location From Centre Vs. Equivalent stress
74

Chapter 5. Mechanical Design Investigation
Rotor Pole Arc (βr)
The rotor pole arc is another physical feature of the rotor to be investigated. Changes
to rotor pole arc will have the largest effect on the electromagnetic behaviour of the
machine. Therefore, the optimization process considered both the mechanical stress
and the output torque simultaneously. As shown in Fig. 5.9 increasing the rotor pole
arc up to 34C increases the torque. However, any increase beyond this point results
in a reduction in the output torque as the rotor tooth comes in close proximity to
the stator tooth of the next phase.
Rotor Tooth Width [mm]23 24 25 26 27 28
Tor
que
[N.m
]
50
51
52
53
54
55
56
Figure 5.9: Rotor Tooth Width Vs Torque
Rotor Outer Diameter
It is important to identify the maximum allowed diameter for the rotor. The
motor output torque is in direct proportion with the square of the rotor diameter.
However, increases in the diameter also dramatically increase the stresses.
Therefore, it is favourable to increase that parameter to its limits. After
identifying the optimum values for various physical features of the rotor, the
maximum rotor diameter, considering the safety factor, was identified. The
optimised values are presented in Table 5.3.
75

Chapter 5. Mechanical Design Investigation
Rotor Component Materials
The choice of the materials for the analysis and manufacturing was an important
step of the design process. The proposed motor consists of several components
whose material was carefully chosen as their yield strength was critical for the
requirement of the high speed application. The cost, availability and
manufacturing requirements were other factors to consider for selection process.
The selected materials for different rotor components and their respective yield
strength are presented in Table 5.2. The detailed description of the materials used
in the design will be presented in Chapter 7.
Table 5.2: Materials Used in The Motor Construction
Part Material Yield Strength
Rotor Lams M250-35HS 450
Tie Rods A286 580
Cheek Plates Nitronic 50 690
FEA Simulation Results of Proposed Model
The proposed design was analysed for the mechanical stresses, while ensuring the
optimised rotor could deliver the required output torque. As it can be seen from
Fig. 5.10 the maximum stress of 382.5 MPa was at the cuttings, which was below
the yield strength leaving a safety factor of 1.2.
Proposed Model 2
A design with no shaft in the rotor caused concern over satisfying alignment for all
the rotor components. Therefore, a second design was required for the mere purpose
of alignment comparison. For this, a small shaft with 10 mm diameter was added
to the design. As alignment was the only purpose of the added shaft, it would only
extend 15 mm into the cheek plates on either side. The mechanical analysis showed
a maximum stress of 433.7 MPa concentrated around the shaft bore, as it is shown
in Fig. 5.11.
76

Chapter 5. Mechanical Design Investigation
Figure 5.10: Stress Analysis of the Proposed Rotor
Figure 5.11: Stress Analysis of the Proposed Rotor with a Shaft Hole
77

Chapter 5. Mechanical Design Investigation
The final values for various physical features of the proposed rotor can be find in
Table 5.3 .
Table 5.3: The Optimised Rotor Physical Specifications
Parameter Denoted Symbol Unit Value
Rotor Outer Diameter ROD [mm] 91
Rotor Yoke Outer Diameter yr [mm] 32
Rotor Pole Height H [mm] 13.5
Tangential Curve Radius hr [mm] 26.5
Tie Rod Diameter TrD [mm] 6
Tie Rod Distance From Centre Trr [mm] 26
Rotor Pole Arc βr [Deg] 34
5.4 Vibration Frequencies
It is important to ensure the design speed of the motor remains below the critical
speed. The modelling of the rotor assumes it is a solid lump of steel. The stiffness
of the bearings needed to be adjusted. This is an important factor in determining
the vibration modes and their respective frequencies.
5.4.1 Bearing Stiffness
The bearing stiffness is a criteria determining the deflection or deformation
magnitude in a bearing under load. It is defined as the ratio of load to deflection
and can vary by the type, size, design, material, contact angle and pre-load class of
the bearing.
A high precision angular contact hybrid ball bearing is selected for this work. The
typical stiffness of the chosen bearing type obtained from the manufacturer is
18.6 N/µm for a pair of steel bearings. However as they are hybrid bearings with
ceramic balls, the stiffness has been adjusted. The calculation process is as follows;
Khp = Ksteel × Ceramic Ball Coefficient (5.2)
= 18.6× 1.1 = 19.98 N/µm = 19980 N/mm (5.3)
Khs =Khp
2(5.4)
=19980
2= 9990 N/mm (5.5)
78

Chapter 5. Mechanical Design Investigation
where Khp, Ksteel and Khs are the stiffness of a pair of hybrid bearings, the stiffness
of a steel bearing of this size and the stiffness of a single hybrid bearing.
The total stiffness of the bearing considers all three dimensions and is inversely
proportional to the cross section area of the bearing. The selected bearing has a
diameter of 37 mm and is 9 mm wide. The total three dimensional stiffness of the
bearing is shown in Eq. (5.7) which was used as the input data for ANSYSTM, where
KTotal is the total three dimensional stiffness of the bearing and Ab is the bearing
cross sectional area..
KTotal =Khs
Ab
(5.6)
=9990
37× 9= 30 N/mm3 (5.7)
5.4.2 Vibration Modes
After adjusting the stiffness, the modal analysis was carried out for a fully assembled
motor. Modal analysis is used during the design process to identify the vibrations
characteristics of the motor including the natural frequencies and the vibration mode
shapes. Table 5.4 summarises the first ten vibration modes and their respective
frequencies.
Table 5.4: The Vibration Modes and Their Frequencies
Order Type Frequency[Hz]
1. Rock 1.3811e-002
2. Bounce 85.634
3. Bounce 85.634
4. Bounce 127.72
5. Rock 177.62
6. Rock 178.68
7. Bend 3747.4
8. Bend 3748.2
9. Torsion 10331
10. Bend 11750
The critical speed would be the first bending mode that occurs at 3747.4 Hz, which is
significantly above the design speed of 50,000 rpm (833 kHz) , it should not therefore
be a problem. The first rock and bounce modes can be overcome if the motor speeds
up fast enough without spending a significant period of time around that region.
79

Chapter 5. Mechanical Design Investigation
Also, soft mounting technique will be applied to the bearings which reduces the first
rock and bounce modes significantly, allowing the machine to speed up and pass
over them quickly.
5.4.3 Spring Pre-Load
The rigidity of the bearing can be altered by applying a pre-load. The magnitude
of the force for light, medium and heavy pre-load were provided by the bearing
manufacturer. The selected bearings are an angular contact type with a light
pre-load. The stiffness of the pre-load spring, k, was calculated to be 30 N/mm,
using its data sheet [110] and Hook’s law.
The bearing manufacturer’s suggestion for a light pre-load is 26 N. Eq. (5.9) shows
the calculated deflection for a light pre-load.
δ =F
k(5.8)
=26
30= 0.86 mm (5.9)
In practice, the required pre-load was applied to the pre-load spring by taking off
the magnitude of deflection from the designated space for the spring washer as
illustrated in Fig. 5.12. this can be done during the design of the housing by only
allocating the width of the pressed spring washer.
Figure 5.12: Deflection of a Pre-load spring
5.5 Conclusion
The mechanical design process started with the results of analytical calculations for
the initial frame size of a high speed SRM to replace the PM motor in the Toyota
Prius. This was carried out by scaling down the frame size of an existing SRM which
was proposed to replace the PM machine whilst having the exact same specification.
Next, a radial SRM was designed based on the calculated frame size. The output
torque of this design was analysed using FEA and the further optimised to meet
the required torque, the results of which will be presented in the next chapter. In
80

Chapter 5. Mechanical Design Investigation
the next stage, the rotor design was analysed for mechanical stresses which are very
important in high speed rotors. A Combination of the notch effect and the hoop
stress caused the maximum stress of the rotor to exceed the yield strength of the
rotor lamination material, therefore a different approach was required for the rotor.
A topology common to flywheels has been applied to the rotor. The central shaft,
which was deemed to be the main source of the hoop stress, has been completely
removed and instead a set of tie rods and end plates used to support the laminations.
The materials for the stator and the rotor lamination are selected from the low iron
loss range whilst having high yield strength so M250-35HS, A286, and Nitronic 50
were chosen for the rotor, the bolts and the cheek plates, respectively.
The mechanical analysis was carried out for various rotor features of the new
design such as the location and size of the cutting holes for the tie rods and the
rotor pole pitch. The maximum rotor radius considering the safety factor was
identified as 91 mm. The final values of the different rotor geometrical features,
which ensured a maximum stress below the yield strength for the rotor, were also
presented considering a safety factor of 1.15. Applying a smaller radius and
number of poles compared to the scaled down model, resulted in torque reduction.
The rotor length was increased from 58 mm to 95 mm in order to meet the torque
requirement of the machine.
The electromagnetic design and analysis of the motors will be discussed in detail
in the next chapter. In conclusion, a design suitable for an operational speed of
50,000 rpm which can produce 56 Nm was proposed in this chapter.
81

Chapter 6
Further Electromagnetic Design
Investigation
This chapter focuses on the electromagnetic design methodology which, for a high
speed application must be taken into account in parallel with the mechanical design
described in Chapter 5. Using analytical methods, the main physical features of
the motor, such as frame size, number of phases, number of poles, etc. have been
defined and presented in Chapter 4.
The design of the rotor in particular has been presented in the mechanical design
chapter, where it has been ensured that the rotor is pushed to its limits before failure.
This has been checked against electromagnetic simulations to see if the performance
of the machine has been compromised by these changes.
The electromagnetic specification of the proposed motor will now be investigated in
more detail for the instantaneous and transient output torque with the help of FE
models. Operating at high speeds increases the AC copper loss and the iron loss.
The increase in the AC copper loss is due to the skin effect and the proximity loss,
these effects are investigated and suitable solutions are applied to reduce them.
Windage loss also increases with speed as is proportional to the angular velocity
cubed. The toothed structure of the rotor adds further to the windage loss which
makes windage an important component of the total loss for this application, this
will be calculated using analytical methods.
Finally, the calculated losses are used to estimate the efficiency of the motor at a
range of loading points and presented as an efficiency map.
82

Chapter 6. Further Electromagnetic Design Investigation
6.1 Rotor Structure Development
Before presenting the electromagnetic analysis of the proposed motor, it is important
to electromagnetically optimise the value of the physical features of the motor.
The development process of the rotor topology, from the mechanical point of view,
was described in 5.3.5 , where the impact of varying various rotor features on the
equivalent stress of the laminations was studied.
It is also essential to investigate the implications of the proposed flywheel structure
on the motor output from the electromagnetic point of view. The major rotor
features, that will have a direct impact on the motor output, are the rotor tooth
width tr, the radius and location of the tie rod cutting TrD and Trr, and the radius
of the tangential line at he bottom of the rotor teeth, hr . The value of the tie rod
diameter will not have a significant influence on the electromagnetic performance of
the motor, therefore it was sufficient to find the optimum value only through the
mechanical analysis.
6.1.1 Rotor Tooth Width (tr)
Changes to rotor tooth width will have the largest effect on the electromagnetic
behaviour of the machine. The optimization process has to consider both the
electromagnetic and mechanical impact of varying the tooth width. As shown in
Fig. 6.1 increasing the rotor tooth width up to 27 mm increases the torque.
However, any increase beyond this point results in a reduction in the output torque
as the rotor tooth comes in close proximity to the stator tooth of the next phase.
6.1.2 Tie Rod Cutting Location (Trr)
If the tie rods are placed too close to the rotor outer periphery, they will be close
to the varying magnetic field and susceptible to eddy current induction, which will
in turn give rise to the iron loss and heating. On the other hand, placed close
to the centre of the rotor will result in increased mechanical stresses on the rotor
laminations. The location of the tie rod is investigated against the maximum output
torque and the results are shown in Fig. 6.2 for a fixed tie rod diameter of 6 mm. As
it can be seen, varying the location of the cuttings from 20 mm to 29 mm away from
the rotor centre has a small impact (0.1 Nm) on the output torque. This is likely
to be caused by disturbing the path of the magnetic flux and creating saturation
around the area of the tie rod cutting. Finally, the tie rods are located at 27 mm
relative to the centre of the rotor.
83

Chapter 6. Further Electromagnetic Design Investigation
Rotor Tooth Width [mm]23 24 25 26 27 28
Tor
que
[N.m
]
50
51
52
53
54
55
56
Figure 6.1: Rotor Tooth Width Vs Torque
Tie Rod Location from Centre [mm]20 21 22 23 24 25 26 27 28 29
Tor
que
[Nm
]
49.5
49.6
49.7
49.8
49.9
50
50.1
50.2
50.3
50.4
50.5
Figure 6.2: Investigation of the Optimum Value for the Tie Rod Location
84

Chapter 6. Further Electromagnetic Design Investigation
6.1.3 Diameter of the Fillet at the Bottom of Rotor Tooth
(hr)
The study of the fillet at the bottom of the rotor teeth were carries out assuming
the center of the fillets were fixed points in the space and the diameter would vary
relative to these centres. The analysis shows increasing the diameter from 72 mm
to 81 mm would result in a reduction in the output torque, as presented in Fig. 6.3
. This is caused by reduction of the available rotor back iron which in turn leads to
the expansion of the saturated areas. A diameter of 72 mm was deemed sufficient
as a smaller diameter would be susceptible to flux leakage.
Rotor Bottom OD [mm]72 73 74 75 76 77 78 79 80 81
Tor
que
[Nm
]
50
50.1
50.2
50.3
50.4
50.5
50.6
50.7
50.8
50.9
51
Figure 6.3: Investigation of the Optimum Value for the Rotor Bottom Outer
Diameter
6.2 Static Simulation
In order to fully analyse the performance of a motor, a dynamic (transient)
simulation is required, however a good way to foresee the dynamic operation is to
analyse the static operation of the motor. This technique is particularly beneficial
as static simulations require significantly shorter computation time. The static
characteristics of the motor can be obtained using the magnetisation curves and
torque vs angle profile [25].
85

Chapter 6. Further Electromagnetic Design Investigation
6.2.1 Two Dimensional FEA Simulation Results
An FE model has been designed using Infolytica Magnet to simulate the motor in
two dimensions (2D) from an electromagnetic point of view. 2D analysis allows
short simulation run times even for models with a fine mesh ensuring more precise
results. 2D analysis was used during the mechanical design stage whilst physical
features of the rotor were being examined for the lowest operational stresses . The
model is shown in Fig. 6.4.
Figure 6.4: Model Used for 2D Static Simulationn
In order to avoid producing negative torque, at any given time only one phase is
excited. Only when the current starts to decrease in that phase, will the current
increase in the following phase. This is done to avoid the rotor approaching a
position with decreasing inductance. The direction of the current in the windings is
illustrated in Fig. 6.5.
The magnetic field solution of the motor at aligned position is plotted in Fig. 6.6.
The black lines show the flux path from stator pole to rotor pole, through the rotor
back iron and the opposite rotor pole, and back to the opposite stator pole. It can
be seen that the saturated areas are the bottom of the stator teeth and around the
tie rod cuttings. Also, it can be seen that the tie rods of the rotor poles that are not
in the aligned position will be effected by the varying but smaller magnetic field.
86

Chapter 6. Further Electromagnetic Design Investigation
Figure 6.5: Winding Current Direction
Figure 6.6: Flux Density of the Motor and the Flux Path in Aligned Position
87
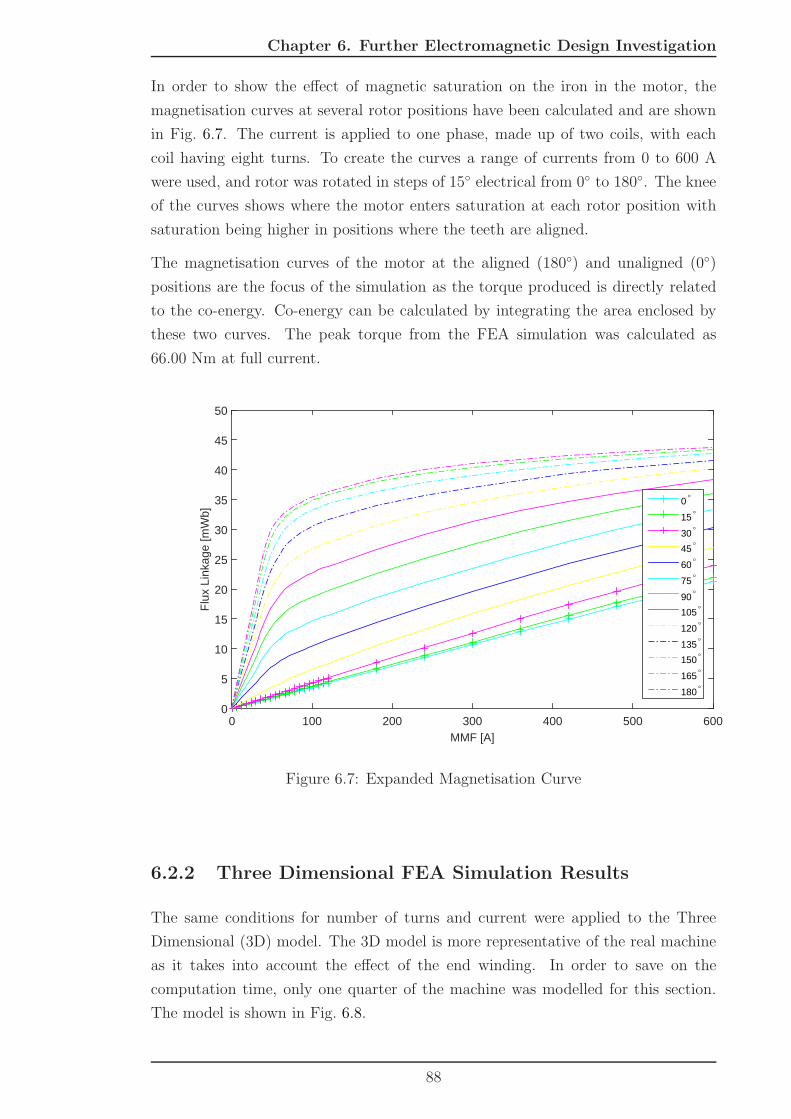
Chapter 6. Further Electromagnetic Design Investigation
In order to show the effect of magnetic saturation on the iron in the motor, the
magnetisation curves at several rotor positions have been calculated and are shown
in Fig. 6.7. The current is applied to one phase, made up of two coils, with each
coil having eight turns. To create the curves a range of currents from 0 to 600 A
were used, and rotor was rotated in steps of 15 electrical from 0 to 180. The knee
of the curves shows where the motor enters saturation at each rotor position with
saturation being higher in positions where the teeth are aligned.
The magnetisation curves of the motor at the aligned (180) and unaligned (0)
positions are the focus of the simulation as the torque produced is directly related
to the co-energy. Co-energy can be calculated by integrating the area enclosed by
these two curves. The peak torque from the FEA simulation was calculated as
66.00 Nm at full current.
MMF [A]0 100 200 300 400 500 600
Flu
x Li
nkag
e [m
Wb]
0
5
10
15
20
25
30
35
40
45
50
0°
15°
30°
45°
60°
75°
90°
105°
120°
135°
150°
165°
180°
Figure 6.7: Expanded Magnetisation Curve
6.2.2 Three Dimensional FEA Simulation Results
The same conditions for number of turns and current were applied to the Three
Dimensional (3D) model. The 3D model is more representative of the real machine
as it takes into account the effect of the end winding. In order to save on the
computation time, only one quarter of the machine was modelled for this section.
The model is shown in Fig. 6.8.
88

Chapter 6. Further Electromagnetic Design Investigation
Figure 6.8: Model Used for 3D Static Simulationn
Fig. 6.9 shows the magnetisation curves from the 3D model and compares them
with those obtained from the 2D model. Using the co-enerrgy, the peak torque
from FEA analysis was calculated to be 63.77 Nm at full current. There is 3.3%
difference between the 2D and 3D simulation which can be attributed to the end
winding effect. However, it also shows that end effect for a machine of this aspect
ratio is limited. The difference can also be caused by calculation errors rising from
different meshing methods used in the 2D and 3D models.
MMF [A]0 100 200 300 400 500 600
Flu
x Li
nkag
e [m
Wb]
0
5
10
15
20
25
30
35
40
45
50
Unaligned,2DAligned,2DUnaligned,3DAligned,3D
Figure 6.9: Comparison of Magnetization Curves for a 2D and 3D FE Model
The same model was used to create the torque vs angle profile of the motor which
89

Chapter 6. Further Electromagnetic Design Investigation
is shown in Fig. 6.10. Each curve represents the torque at a certain magnitude of
MMF for a range of rotor positions. Current was applied in steps of 60 A from 0 A
to 600 A (equal to an MMF of 0 to 4800 A) and the rotor rotated in steps of 5
electrical to create the profile. The curves at higher currents become skewed due to
significant saturation.
Rotor Position [Electrical Degree]0 20 40 60 80 100 120 140 160 180
Tor
que
[Nm
]
0
10
20
30
40
50
60
70
i=60Ai=120Ai=180Ai=240Ai=300Ai=360Ai=420Ai=480Ai=540Ai=600A
Figure 6.10: Torque Vs. Rotor Position Using the 3D FEA Model
6.3 Dynamic Simulation
The dynamic (transient) simulations are of interest as they predict the behaviour
of the motor more accurately, taking into account losses and current shape. The
majority of losses such as the iron loss and the ohmic loss can be calculated using
the dynamic simulations. The dynamic simulations were run at the base speed and
the full speed of the motor.
6.3.1 Dynamic Simulations at Base Speed
Like other electrical motors, the speed where the back EMF rises enough to be equal
to the bus voltage is called the base speed. At this point the rated power of the
motor is also realized if the rated current is applied. Base speed is also the maximum
speed that the motor can provide the maximum torque. Therefore, torque analysis
90

Chapter 6. Further Electromagnetic Design Investigation
at this speed shows the maximum torque output of the motor under given voltage
constraints.
The base speed was calculated by scaling the SRM1 model to be 10,250 rpm. It was
rounded to 10,000 rpm giving the rotor a ratio of 5:1 final speed to base speed. At
low speed it is the current that needs to be limited and hence current control is used
at low speeds and square wave current waveform was applied to this model. As it
can be seen from Fig. 6.11 a maximum phase current of 600 A is used in order to
provide an MMF of 4800 A.
Rotor Angle [Electrical Degree](Times [ms])0 90 180 (1.5) 270 360 (3)
Pha
se C
urre
nt [A
]
0
100
200
300
400
500
600
700
Iph1
Iph2
Iph3
Figure 6.11: Square Wave Phase Current Used for Control at Base Speed
Advancing the switching angle was also used to further increase the torque. A range
of angles have been evaluated from 0 to 90electrical degrees as shown in Fig. 6.12,
it was found that an advance angle of 20 at base speed maximised the torque
output. Fig. 6.13 shows the torque waveform, at base speed with full current, over
the period of one electric cycle, where an average torque of 55.60 Nm is achieved.
91
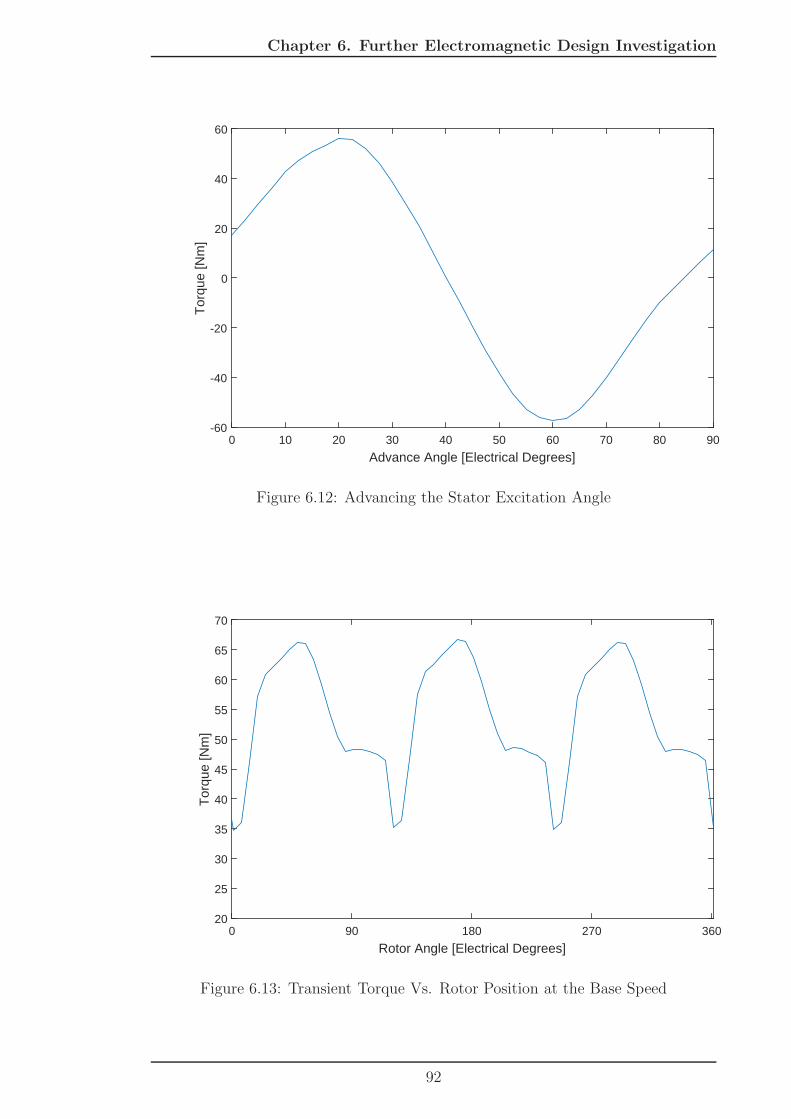
Chapter 6. Further Electromagnetic Design Investigation
Advance Angle [Electrical Degrees]0 10 20 30 40 50 60 70 80 90
Tor
que
[Nm
]
-60
-40
-20
0
20
40
60
Figure 6.12: Advancing the Stator Excitation Angle
Rotor Angle [Electrical Degrees]0 90 180 270 360
Tor
que
[Nm
]
20
25
30
35
40
45
50
55
60
65
70
Figure 6.13: Transient Torque Vs. Rotor Position at the Base Speed
92

Chapter 6. Further Electromagnetic Design Investigation
6.3.2 Dynamic Simulations at Full Speed
During the scaling down process it was calculated that a torque of 11.45 Nm is
required to maintain an output power of 60 kW whilst running at the full speed of
50,000 rpm. Simulations show an MMF of 1200 A is enough to generate the required
torque at full operational speed. A square wave current was used in stator phases
to obtain this MMF, which is shown in Fig. 6.14 .To improve the torque, a range
of angles have again been evaluated. It was found that an advance angle of 30 at
the maximum operational speed maximised the torque output. Fig. 6.15 shows the
torque waveform at full speed from which the average torque is calculated to be
11.44 Nm.
It has been shown that from the electromagnetic aspects, the motor meets the torque
requirements.
Rotor Angle [Electrical Degree](Time [ms])0 90 180 (0.3) 270 360 (0.6)
Pha
se C
urre
nt [A
]
0
20
40
60
80
100
120
140
160
180
200
Iph1
Iph2
Iph3
Figure 6.14: Square Wave Phase Current Used for Control at Full Speed
6.4 Losses
Heat dissipation is a very important factor in design of electric motors. Various losses
contribute to the machine total loss from electromagnetic point of view including
DC winding loss, AC winding loss and core loss. The mechanical components of loss
are the windage loss and the bearing friction loss.
93

Chapter 6. Further Electromagnetic Design Investigation
Rotor Angle [Electrical Degrees]0 90 180 270 360
Tor
que
[Nm
]
0
2
4
6
8
10
12
14
16
18
20
Figure 6.15: Transient Torque Vs. Rotor Position at Full Speed 50,000 rpm
6.4.1 DC Winding Loss
The copper loss, Pcu is usually the main source of loss in the motor and can be
expressed as Eq. (6.1) where q is the phase number. Irms, the rms phase current and
Rp, the stator winding resistance per phase.
Pcu = qI2rmsRp (6.1)
These are calculated using Eq. (6.2) and Eq. (6.3), respectively.
Irms =i√q
(6.2)
Rp = ρLc
Ac
(6.3)
Where Lc is the total conductor length an Ac is the cross sectional area of the
conductor.
94

Chapter 6. Further Electromagnetic Design Investigation
6.4.2 AC Winding Loss
At low speeds, the winding loss can be assumed to be equal to the DC loss that
would be present with a DC current. As the fundamental frequency increases with
an increase in the operational speed a significant AC loss can exist. Two major
factors contribute to the AC loss in the windings;
• The skin effect.
• The proximity copper loss.
Skin Effect
As Faraday’s law explains, a current flowing within a conductor creates external
and internal magnetic field. If the current alternates over time, the magnetic fields
also alternate. In this case, the internal magnetic field induces eddy currents within
the conductor. The flow path of this current is located toward the centre of the
conductor and in the opposite direction to the source current. However, its return
path is located towards the circumference of the conductor and in the same direction
as the main current as illustrated in Fig. 6.16.
Figure 6.16: Skin Effect
As a result of this, the main current is redistributed over the area from the outer
surface of the conductor and as deep as the conductor’s skin depth,δsd, towards its
centre, this depth can be calculated using Eq. (6.4) where ρc is the resistivity of the
conductive material, f the fundamental frequency, µr the relative permeability of
the conductive material and µ0 the permeability of free space.
95

Chapter 6. Further Electromagnetic Design Investigation
δsd =
√
2ρcffµrµ0
(6.4)
If the diameter of the conductor is significantly larger than its skin depth, all other
parts of the conductor except that within the skin depth remain unused which wastes
the copper area and copper itself. The skin effect therefore causes the operating cross
section of the conductor to diminish, increasing the effective resistance which in turn
increases the copper loss. For an operational speed of 50,000 rpm the skin depth of
1.14 mm is calculated.
Proximity Effect
The alternating magnetic field produced by a conductor carrying an alternating
current is affected by adjacent alternating current carrying conductors. Eddy
currents are induced within each conductor that oppose the alternating magnetic
field generated by the other. The flow direction of the induced eddy current will
add to the main current on the furthest side of each conductor and subtract from
it on the nearest. The net current is illustrated in Fig. 6.17 for two conductors in
close proximity. This phenomenon increases the resistance and thus the ohmic loss
in the external conductors and is known as proximity effect [111].
Figure 6.17: An Example of Proximity Effect
When there are more conductors, as in a normal slot in a motor this effect worsens
as the alternating magnetic field of each conductor influences every single conductor.
Conductors in the centre of the slot are least affected, as the proximity effect caused
by the conductors either side of them cancel. However, conductors towards the
outside of the coil are influenced as they have more conductors to one side than
96

Chapter 6. Further Electromagnetic Design Investigation
Figure 6.18: Proximity Effect in an Electrical Machine Coil
the other, which means there is an overall proximity effect in the conductor. An
example of this current redistribution is shown in Fig. 6.18.
The proximity loss, PCu,prox can roughly be estimated using Eq. (6.5).
PCu,prox ∼ J2f 2f r
3r (6.5)
where J is the current density, rr is the rotor radius and ff is the fundamental
frequency.
An FE model was used to investigate the proximity loss on the conductors inside
the machine slot, when the appropriate current was applied at full speed. The
repositioning of the current within the conductors of the winding, when the rotor
is approaching the aligned position, is illustrated in Fig. 6.19 . Here, it can be seen
that the current redistribution occurred more for the conductors near the opening
of the slot (conductor 8) compared to those near the yoke (conductors 1,2 and 3).
This is due to the stray fluxes and the higher magnitude of magnetic flux near the
tip of the stator teeth compared to that near the yoke.
97

Chapter 6. Further Electromagnetic Design Investigation
Figure 6.19: Current Density in the Conductors of a Coil Inside the Slot
Effect of Litz Wire on AC Winding Loss
The use of Litz wire can reduce the copper loss due to the skin effect, allowing it to
be ignored as the conductor diameter is small in comparison to the skin depth [97].
In this case the diameter of the conductors is 0.2 mm compared to the skin depth
of 01.14 mm. Therefore, copper loss due to skin effect can be ignored, therefore
the total winding loss can be assumed to be equal to the DC winding loss. The
use of Litz wire has one major disadvantage which is reduced utilisation of the slot
area due to the woven structure, however in high frequency applications Litz is a
requirement [112].
The current density in conductor 8 for a square wave of applied current has been
plotted in Fig. 6.20. Results are shown assuming both a solid and stranded
conductor. Conductor 8 has been chosen as it is closest to the airgap and
influenced most by the proximity effect. It can be seen that in the case of a solid
conductor, the proximity effect redistributed the current to a peak density of
470 A/mm2. The peak occurs immediately after exciting the coil but settles down
immediately. The same model considering a finely stranded Litz wire shows an
even current density distribution equal to 16 A/mm2 over the whole period of
excitation.
The copper loss resulting from the proximity effect in each conductor is shown in Fig.
6.21. As expected, conductor 8 experiences the highest loss at 5.7 kW. However,
using finely stranded Litz wire reduced the loss significantly. The ohmic loss is
plotted in Fig. 6.22, showing each conductor has a uniform loss.
98

Chapter 6. Further Electromagnetic Design Investigation
Rotor Angle [Electrical Degree]90 180 270 360
Cur
rent
Den
sity
[A/m
m2]
-100
0
100
200
300
400
500Solid ConductorStranded Conductor
Figure 6.20: Comparison of Current Density in A Solid vs Finely Stranded
Conductor
Rotor Angle [Electrical Degrees]90 180 270 360
Ohm
ic L
oss
[kW
]
0
1
2
3
4
5
6
Conductor 1Conductor 2Conductor 3Conductor 4Conductor 5Conductor 6Conductor 7Conductor 8
Figure 6.21: Ohmic Loss in the Solid Conductor
99

Chapter 6. Further Electromagnetic Design Investigation
Rotor Angle [Electrical Degrees]90 180 270 360
Ohm
ic L
oss
[kW
]
0
0.005
0.01
0.015
0.02
0.025
0.03
Conductor 1Conductor 2Conductor 3Conductor 4Conductor 5Conductor 6Conductor 7Conductor 8
Figure 6.22: Ohmic Loss in the Finely Stranded Conductor
6.4.3 Iron Loss
The iron loss in machines, PFe with high rated switching frequencies is proportional
to the square of peak flux density, BPeak and the square of the fundamental frequency,
f , as shown in Eq. (6.6).
PFe ∝ f 2B2Peak (6.6)
Hysteresis and eddy current losses are the main sources of iron loss in SRMs. For
a given flux density the hysteresis losses increase linearly with frequency, whilst
the eddy current losses increase with the square of the frequency. Traditionally,
in order to address these losses laminated silicon-iron stator and rotors are used.
The frequency of the machine is defined by the number of rotor poles, as a result
fewer number of rotor poles will result in lower iron loss. The minimum rotor
pole number for a three phase SRM (four poles) was considered for this work to
reduce the fundamental frequency. Also, the electrical steel used for the rotor and
stator were chosen from a low iron loss range. Hargreaves et al. in [113] say “more
manufacturing processes equals more iron loss”, therefore, an increase in the iron
loss due to the manufacturing process is inevitable.
100

Chapter 6. Further Electromagnetic Design Investigation
6.4.4 Eddy Current at Tie Rods
From the electromagnetic aspect, saturation of the rotor lams around the tie rod
cuttings and creation of eddy currents at the tie rods are some of the concerns of
implementation of the flywheel structure. Fig. 6.23 demonstrates the magnetic field
solution at full design speed. As it can be seen, the area of the tie rod cuttings
that are in the flux path have started to saturate. However, when the rotor was
completely at aligned position, the flux density did not exceed 1.7 T.
Figure 6.23: The Magnetic Field Solution at Full speed
Furthermore, despite using stainless steel for manufacturing the tie rods, which is
a non-magnetic material, the conductive nature of the rods will still create possible
paths for the eddy currents to flow. Fig. 6.24 presents the current density at the
tie rods for one electric cycle. It can be seen that a maximum current density
of 7.21 A/mm2 was created. This underlines the necessity to use non conductive
materials for tie rod manufacturing, such as high yield strength plastic or carbon
fibre, to avoid excessive loss at the tie rods.
6.4.5 Windage Loss
SRMs also experience mechanical losses (bearing and windage loss) in addition to
electromagnetic losses (iron and copper loss). In high speed SRMs the high viscous
drag that appears in the air gap causes power loss, also known as windage loss.
The rotor saliency in SRMs leads to a windage loss higher than that normally found
in other electric motors. Several approaches have been suggested to deal with this
101

Chapter 6. Further Electromagnetic Design Investigation
Rotor Angle [Electrical Degrees]0 90 180 270 360
Cur
rent
Den
sity
at T
ie R
ods
[A/m
m2]
-2
0
2
4
6
8
10
Figure 6.24: The Current Density Caused by the Eddy Current at Tie Rods
issue. Adding moulded epoxy in between the rotor poles is a possible approach.
Although the performance of the motor even at high speeds is not compromised in
this way, this approach adds a few more steps to the simple manufacturing process
of a conventional SRM and hence increases the cost. Another approach is to add
a rib in between adjacent rotor poles [114]. From aerodynamic point of view, this
rotor resembles a cylindrical rotor hence the windage loss is dramatically reduced.
However, this approach results in torque reduction especially if the ribs do not
saturate fully, it also adds to the mechanical constraints.
The Reynolds number, Re, is used to describe the drag coefficient at the surface of
the rotor and can be expressed as Eq. (6.7). Where rr is rotor radius, t is the air
gap length and ω is the angular velocity, µ is the viscosity of air which is equal to
18 µPa, ρair is the density of air and is equal to 1.2 kg/m3 at the room temperature
and pressure [115].
Re =rrtω
µ
ρair
(6.7)
The drag coefficient , Cd, is given in Eq. (6.8) [115].
1√Cd
= 2.04 + 1.768 ln(
Re
√
Cd
)
(6.8)
102

Chapter 6. Further Electromagnetic Design Investigation
The Reynolds number increases in proportion to the angular velocity whilst the drag
coefficient reduces. These two equations are important in determining the windage
loss of a rotor. The windage loss for a cylindrically shaped rotor, Pw, is expressed
by Eq. (6.9) [115].
Pw = πCdρairr4rω
3Lst (6.9)
Where Lst is the stack length and ρair is the air density. Since the rotor of an
SRM is not cylindrical an additional coefficient is required. Eq. (6.10) estimates the
additional windage loss due to the pole saliency.
Pwp =(
K − 1)
πCdρairr4rω
3Lst (6.10)
Where K is the salient pole coefficient given as a function of the rotor pole depth,
H , and the rotor radius, rr, in Eq. (6.11).
K = 8.5(H
rr
)
+ 2.2 ≈ 4.72 (6.11)
According to the equations presented the saliency in this particular rotor, for the
given rotor radius and rotor pole height, produces 3.72 times more windage loss
compared to a cylindrical rotor with the same rotor radius [115]. The windage loss
of the proposed rotor is presented in Fig. 6.25 where it is compared against the
windage loss of the same outer radius cylindrical rotor. The calculations show a
windage loss of 64.54 W and 5.214 kW (8.7% of output power) for the salient rotor,
at the base speed of 10,000 rpm and full speed of 50,000 rpm, respectively. At full
speed a cylindrical rotor would only produce 1.4 kW of windage loss (2.3% of output
power), which shows the importance of applying windage reducing techniques and
their effect on efficiency improvement.
In order to measure the mechanical loss (combination of the bearing and windage
loss) of the SRM, without exciting the SRM coils, the shaft is rotated and the torque
is measured using a torque transducer. The product of this measured shaft torque
and the rotational velocity of the rotor gives the mechanical loss. Only the windage
loss estimate obtained from the FEA method was considered for this work as the
test set up was not suitable for this purpose.
103

Chapter 6. Further Electromagnetic Design Investigation
Rotational Speed [rpm] ×104
0 0.5 1 1.5 2 2.5 3 3.5 4 4.5 5
Win
dage
Los
s [W
]
0
500
1000
1500
2000
2500
3000
3500
4000
4500
5000 Cylindrical RotorSalient Pole Rotor
Figure 6.25: Windage Loss Comparison of a Cylindrical and Salient Pole Rotor
6.5 Efficiency Map
The efficiency, η, using the shaft output power, Po, and the input electrical power,
Pi, can be expressed as Eq. (6.12).
η =Po
Pi
(6.12)
The resistance of a single turn of conductor, Rc, is calculated as 0.0464 mΩ. The
total resistance of a single phase, Rp, is given by Eq. (6.15) where N is the number
of turns of a coil of windings.
Rp = Rc × (N)2 × No. Coil per Phase (6.13)
= 0.0464× 10−3 × 82 × 2 (6.14)
= 5.939 mΩ (6.15)
For the copper loss component, only the DC copper loss is included in the efficiency
calculation as the AC copper loss is considered negligible by using the Litz wire.
Having the phase resistance, the DC winding loss is calculated using Eq. (6.1).
The iron loss, made up of eddy current loss and hysteresis loss for both the stator
104

Chapter 6. Further Electromagnetic Design Investigation
and rotor was obtained for every current and operational speed point using the
FE model. At base speed, the rotor’s total contribution to iron loss was 563.55
W, while the stator’s total contribution was 1233.45 W. On the other hand at full
speed, the rotor’s and stator’s total contribution to iron loss were 2170.56 W and
4220.52 W, respectively. As the majority of this loss is concentrated at the stator,
use of a suitable liquid cooling system, preferably oil, can address the temperature
rise caused by the iron loss at the stator. The liquid cooling can not be used on the
rotor as it will give rise to the windage drag. Nevertheless the dissipated heat at the
rotor can flow through the shaft . This makes implementation of a cooling system
for the bearings even more necessary. The magnitude of the three major losses for
base speed and full speed are given in Table 6.1.
Table 6.1: Loss Type Contribution at Base Speed and Full Speed with Full Power
Loss type Symbol Unit Base Speed Full Speed
DC Winding Loss Pcu kW 3.33 0.22
Iron Loss at Rotor PrFe kW 563.54 2170.56
Iron Loss at Stator PsFe kW 1233.45 4220.52
Total Iron Loss PFe kW 1.79 6.39
Windage Loss Pwp kW 0.06 5.21
Phase Current Iph A 600 150
At base speed, the DC winding loss, the iron loss and the windage loss make up
64.2%, 34.5% and 1.3% of the total loss, making the DC copper loss the major
contributor. At full speed, the DC winding loss, the iron loss and the windage
loss make 1.8%, 54.1% and 44.1% of the total loss, making the iron loss the major
contributor followed by the windage loss.
The calculated losses were used to calculate the efficiency map of the proposed
machine which is presented in Fig. 6.26. The peak efficiency of the machine is
93.7% at 15,000 rpm, 60 kW with a torque of 36.6 Nm.
Fig. 6.27 shows how the efficiency map would look if windage loss reducing techniques
were applied. The peak efficiency is increased to 94.0% at 17,500 rpm, 60 kWwith
a torque of 32.7 Nm. The areas with high efficiency have been increased, with the
losses at high speed being reduced significantly.
105

Chapter 6. Further Electromagnetic Design Investigation
Speed [krpm]5 10 15 20 25 30 35 40 45 50
Tor
que
[Nm
]
5
10
15
20
25
30
35
40
45
50
55
50 %
55 %
60 %
65 %
70 %
75 %
80 %
85 %
90 %
95 %
Figure 6.26: Efficiency Map Considering a Salient Pole Rotor
Speed [krpm]5 10 15 20 25 30 35 40 45 50
Tor
que
[Nm
]
5
10
15
20
25
30
35
40
45
50
55
50 %
55 %
60 %
65 %
70 %
75 %
80 %
85 %
90 %
95 %
Figure 6.27: Efficiency Map Considering a Cylindrical Rotor
106

Chapter 6. Further Electromagnetic Design Investigation
6.6 Conclusion
The electromagnetic behaviour of the motor has been analysed for various aspects
of the motor. Peak torques of 66.00 Nm and 63.77 Nm were calculated from the
2D and 3D FEA of static models, respectively. The 3.3% difference being due to
inherent calculations errors of FEA rising from different meshing methods as well
as the end winding erect. Static models are very useful at the early stages of the
design process as they save computation time whilst providing reliable results. 2D
FEA was used to study all the other electromagnetic aspects. An average torque of
55.6 Nm is achieved from the 2D dynamic simulation.
Simulations were used to analyse the major electromagnetic aspects of the operation
such as the ohmic loss, the AC winding loss, the skin effect and the proximity effect.
The DC winding loss for the full rated current was calculated to be 3.3 kW for the
winding design using Litz wire.
AC winding loss increases significantly with frequency operation, due to the skin
effect and the proximity loss. The skin depth of the copper is 1.14 mm at 50,000 rpm
(833.33 Hz). By choosing a finely stranded Litz wire, with a strand radius of 0.2 mm,
the waste of copper due to skin effect is prevented. Further analysis was carried out
to identify the iron losses of the motor, showing a loss of 1.79 kW and 6.39 kW at
the base speed and full speed, respectively.
The windage loss in a toothed rotor is higher than other purely cylindrical electric
motors and dramatically increases with speed as it is in proportion to the speed
cubed. Analytical calculations show a windage loss of 5.21 kW at the full speed
of 50,000 rpm, which could be reduced, by for example filling the rotor gaps with
epoxy, to 1.79 kW.
The calculated losses were used to create an efficiency map for the motor which
shows a peak efficiency of 93.7% at 15,000 rpm, 60 kW with a torque of 36.6 Nm.
In conclusion, an SRM was presented in this work which can produce 56 Nm while
being capable of running up to 50,000 rpm, resulting in an output power of 60 kW.
107

Chapter 7
Prototype Construction
In this chapter the construction of the high speed SRM is presented. First the
process of building the stator is discussed. Whilst, a common technique is used to
construct the stator laminates, an alternative technique was required to shape the
coils and mount them on the stator teeth. This technique provided a satisfactory
fill factor with the potential for an increased fill factor.
Secondly, the more complex construction of the prototype rotors for the static and
spin test are then presented; one with an aligning central shaft and one without. Due
to their high operational speed, special attention is given to mechanical precision
required.
7.1 Static Test Prototype
It is possible to ascertain most of the machine performance from static test. The
university has no suitable test chamber available to test the motor at 50,000 rpm.
There was also the lack of a suitable drive for a dynamic test for this machine.
Despite the simple SRM rotor structure, new construction techniques were developed
to meet the requirements of high speed operation. The detailed construction process
follows.
7.1.1 Stator Laminations
The lamination stack was created using electrical discharge machining (EDM)
otherwise known as wire erosion. The stator lamination material is grade NO20, a
non-oriented, fully processed electrical steel with a 1 µm coating of Suralac7000
insulating coating on each side. The material is supplied in 2 m × 1 m sheets,
which were cut to 240 mm square in order to fit in the wire erosion machine. As
the thickness of each sheet is 0.2 mm, to construct a 95 mm long stack, 475 sheets
108
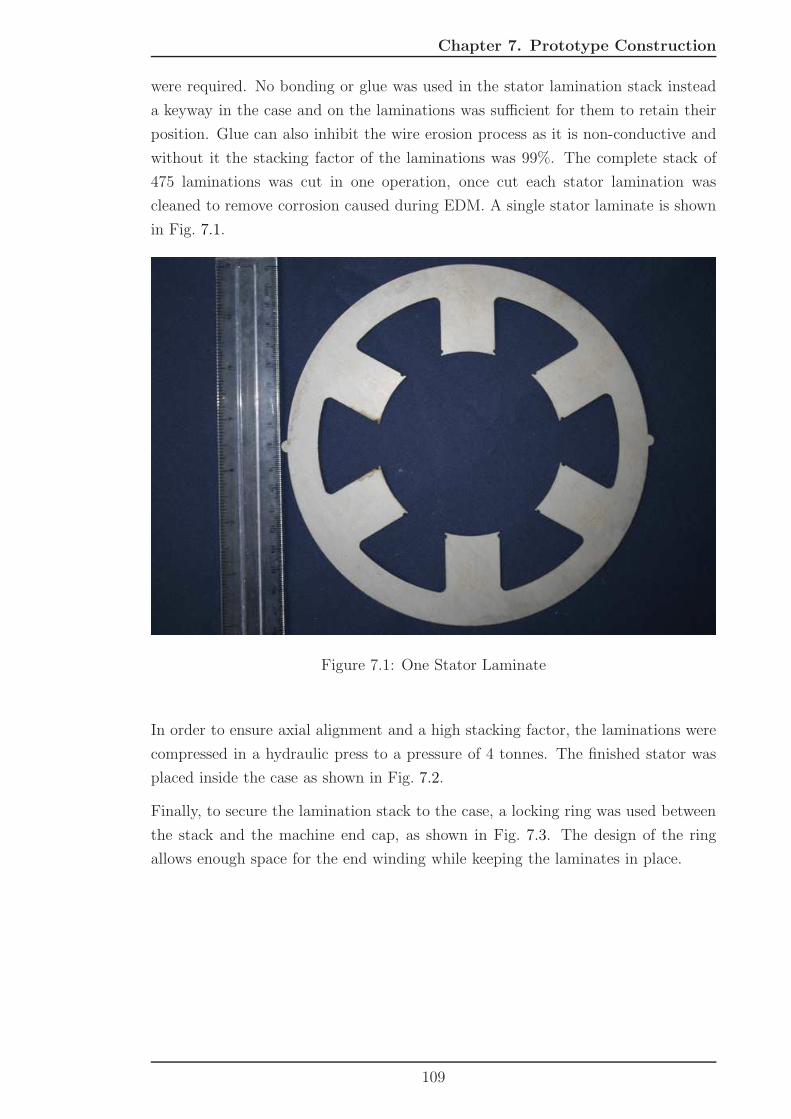
Chapter 7. Prototype Construction
were required. No bonding or glue was used in the stator lamination stack instead
a keyway in the case and on the laminations was sufficient for them to retain their
position. Glue can also inhibit the wire erosion process as it is non-conductive and
without it the stacking factor of the laminations was 99%. The complete stack of
475 laminations was cut in one operation, once cut each stator lamination was
cleaned to remove corrosion caused during EDM. A single stator laminate is shown
in Fig. 7.1.
Figure 7.1: One Stator Laminate
In order to ensure axial alignment and a high stacking factor, the laminations were
compressed in a hydraulic press to a pressure of 4 tonnes. The finished stator was
placed inside the case as shown in Fig. 7.2.
Finally, to secure the lamination stack to the case, a locking ring was used between
the stack and the machine end cap, as shown in Fig. 7.3. The design of the ring
allows enough space for the end winding while keeping the laminates in place.
109

Chapter 7. Prototype Construction
Figure 7.2: Stack of Stator Lamination in the Case
Figure 7.3: Stator Lamination Lock Ring
110

Chapter 7. Prototype Construction
7.1.2 Slot Insulation
Sheets of Nomex aramid thermal insulation paper with a thickness of 0.25 mm
and a maximum operating temperature of 300C were placed inside the slot before
inserting the coils. The sheets were cut to leave enough over hang to wrap completely
around the coil in the slot, and into the gap between adjacent coils sharing the same
slot. Plastic slot wedges (Tufnol) were slid into the stator tooth opening to provide
a barrier between the coils and the air gap.
7.1.3 Coils
In Section 4.2.4 the design of the Litz wire was explained in detail. Manufacturing
the coils using this wire proved to be more difficult than expected. The issue was
down to the thickness of the wire and the small slot area and small slot opening
demanding an alternative technique to simple hand winding to achieve the required
fill factor.
It is common when making prototypes to manufacture the windings by feeding them
through the slots and around the stator teeth by hand. This technique was ruled
out for several reasons. First, the slot area and the available space inside the stator
bore was too small for the technician’s or author’s hand to fit in and move freely
whilst holding the wire. Second, the thickness of the Litz wire caused it to create
large bows when bent around the corners, creating long end windings. These bows
would extend inside the slot wasting the slot space.
Finally, pressing the finished coil turned out to be a vital stage of manufacturing the
coil by removing the air within the strands and ensuring the goal fill factor, which
can not be achieved by mere hand winding.
As a result, it was decided to press and then hand wind the coils in order to achieve
the best possible fill factor. A set of bobbin jigs were made with a rectangular profile.
The longest side of the rectangle was equal to the slot depth and the shortest side
was equal to the half of the slot opening ensuring that two coils made using this jig
would pass through the slot opening. The parts of the bobbin jig are shown in Fig.
7.4. The rectangular profile area of the jig was large enough to fit 5 of the required
8 turns in.
The inside of the bobbin was covered with mould release in order to ensure easy
release of the cured coils. The structure was then secured in place in a lathe. The
coil could then be wound by rotating the bobbin around its centre whilst one end
of the wire was held tight over it with the other end being fed through the system,
which also made it easy to count the turn numbers. Each row of wire was covered
with a two part epoxy resin, consisting of Araldite LY 5052 epoxy and Aradur 5052
111

Chapter 7. Prototype Construction
Figure 7.4: Coil Forming Bobbin
hardener. The low viscosity of the resin allowed it to reach all the surfaces inside
the Litz wire giving a solid finish.
Next, the whole coil was wrapped inside several layers of electric tape in order to
keep the wires in place until the glue set. The jig was completed with two parts
either side of the coil which were pushed in place and secured using clamps, applying
a compressive force to the coils. Afterwards, the assembled bobbin was placed under
4 tonnes of pressure in a hydraulic press overnight whilst the resin set, the pressure
removed a significant amount of air within the Litz wire strands.
Finally, the electric tape and the bobbin jigs were manually removed from the coil
before mounting the coil on the stator tooth. Using this technique resulted in block
form coils that could be slipped onto the stator teeth over the insulation. The
resulting coil is shown in Fig. 7.5.
Once all 6 coils were pressed, they were checked visually for any sign of damage to
the wire or the enamel, if no faults were detected then it could be mounted on the
stator. Once all coils were mounted slot wedges were inserted into the stator tooth
grooves in order to hold the coils in place. These strips were cut from glass fibre
laminated plastic (Tufnol) with a thickness of 1.5 mm. Once all 6 coils were secured
in place, the remaining 3 turns were added to each coil by hand by feeding the end
of the cable through the space in between each two coils. This process was repeated
three times, filling the triangular space in between the coils until the goal of 8 turns
was reached.
As it was essential to monitor the thermal behaviour of the coils, 3 thermocouples
were added in order to monitor the temperature inside the coils. These
112

Chapter 7. Prototype Construction
Figure 7.5: Pressed Coil with 5 Turns
thermocouples are PTFE insulated with an exposed welded tip suitable between.
One of the thermocouples was inserted inside the coil during the pressing stage
to monitor the temperature inside the coil, one was placed in between two coils
occupying one slot in order to monitor the temperature rise in the middle of the slot
and the last was placed on the over hanging wire to monitor the thermal behaviour
of the end winding.
The goal fill factor of 40% was ensured using this process. It is believed with more
practice and improved design of the bobbins or by pressing 5.5 turns it would be
possible to achieve 9 turns (a fill factor of 45%). Fig. 7.6 shows the finished coils
mounted on the stator coils, the Nomex in between the coils and Tufnol slot wedges
can be seen.
In the next stage, in order to stop the end winding from falling into the rotor bore,
each was individually secured using tying cords. The ends of the coils were placed
in heat shrink cable sleeving tubes to protect the enamel from any damage caused
by handling. As can be seen in Fig. 7.7 all the terminations of the coils came out
from one end in order to keep the manufacturing of the end caps and the set-up of
the test rig simple.
Whilst on the static test rig the coils of diametrically opposed stator poles were
connected in series, as illustrated in Fig. 7.8, which in turn would allow one complete
phase to be excited for the purpose of the static test.
113

Chapter 7. Prototype Construction
Figure 7.6: Coils, Nomex and Tufnol Insulations
Figure 7.7: Tying Cords, Heat Shrinks and Thermal Coupling
114

Chapter 7. Prototype Construction
Figure 7.8: Phase Winding Series Connection
7.1.4 Rotor Laminations
A stack of M250-35HS non-oriented, fully processed lamination electrical steel sheets
was used for manufacturing the rotor. This grade of electrical steel is particularly
suited for high speed applications, having a high yield strength. As with the stator
laminations, each side is coated with a 1 µm layer of Suralac7000 insulation.
In order to build a 95 mm stack, 68 sheets of this 0.35 mm thick lamination were
required with four rotor segments cut from each of the sheets and stacked together
to produce the final rotor axial length. A smaller stack height was used as in this
case the stacks were glued. This is included in order to ensure flatness of the rotor
as will now be discussed, but makes it more difficult to wire erode such a large stack.
Laminations are not perfectly smooth and cannot be guaranteed to be even in
thickness, neither will the coatings be of uniform thickness. This non-uniformity
can accumulate, resulting in a lamination stack that is not flat. To address this
issue, half of the rectangular sheets were cut in one orientation with the rest
rotated by 90 degrees. The final stack could then be made by stacking these
alternately in order to randomise non-uniformity.
115

Chapter 7. Prototype Construction
Gluing of the stacks using Ultimeg 2002 epoxy resin was used as a second measure
to ensure rotor flatness. The stack of 68 laminations was clamped in between two
aluminium plates with four spacers of 22.75 mm length to set the height of the stack.
The stack was placed in the oven at 300 C for three hours for the glue to cure. From
resulting block four rotor biscuits were cut using EDM, these could then be stacked
together to produce the final rotor lamination stack. The rotor laminations were cut
with a radius 1 mm larger than required for the finished machine. The extra material
could then be skimmed later to ensure the concentricity of the rotor. This process
was carried out once for the rotor without the central shaft, and a second time with
a 10 mm diameter shaft hole. One cut laminate of each rotor is presented in Fig.
7.9a and Fig. 7.9b for the rotor with and without the central shaft, respectively.
(a) Rotor Laminate without the Shaft Hole (b) Rotor Laminate with a Shaft Hole
Figure 7.9: One rotor Laminate of Each Rotor Topology
7.1.5 Cheek Plates
The cheek plates were made from a 76.20 mm diameter cylinder of austenitic,
nitrogen strengthened nickel alloyed stainless steel bar (grade Nitronic 50 annealed
ASTM A276/ASTM A479). This is material with high mechanical strength and
reasonable machinability. A CNC milling machine and EDM were used to
manufacture the cheek plates. The sharp corner where the shaft of the cheek plate
meets the end plate itself was carefully machined with a large fillet radius in order
to reduce stress in this area. The mechanical analysis indicates a negligible effect
of applying corner radii. A cheek plate can be seen in Fig. 7.10, the four holes for
the tie rods can be seen along with space for the nuts to sit such that they do not
protrude out from the cheek plates.
116

Chapter 7. Prototype Construction
Figure 7.10: Fully Manufactured Cheek Plate
Bearing Locating Ring
The addition of a fillet on the base of the shaft on the cheek plate required the
addition of a flat surface for the bearing to accurately locate. A 5 mm thick ring
was manufactured with a 5 mm radius on one side, equal to the size of the cheek
plate fillet. The outer diameter of the part of this ring that touches the bearing was
equal to the outer diameter of the bearing inner ring to avoid any friction between
the balls and the ring. As can be seen from Fig. 7.11 this is achieved by making a
step on the flat side of the ring leaving an outer diameter of 24 mm on that side.
7.1.6 Tie Rods
The tie rods, which are shown in Fig. 7.12, and the small aligning shaft were
manufactured from grade A286 solution annealed aged ground steel. The tie rods
were manufactured from a 600 mm long bar of diameter 8.19 mm. The required
6 mm diameter was obtained using a centre-less grinding technique, the tie rods
were then cut to as length of 150 mm. Using the CNC machine, an M6 thread
with 1 mm pitch and 0.6 mm depth was added to the either end of the tie rods.
The locating shaft was made from a 200 mm long bar of diameter 11.36 mm, which
was ground to 10 mm.
117

Chapter 7. Prototype Construction
Figure 7.11: Bearing Locating Ring on the Rotor
Figure 7.12: Rotor Tie Rods
118

Chapter 7. Prototype Construction
7.1.7 Rotor Assembly
The rotor components were assembled and the structure placed in a lathe to add the
final touches to the rotor components. However, at this point the shafts of the cheek
plates could not be made to align and each shaft was nearly 1 mm off centre. This
was caused by the construction process and due to the strain that was put on the
tie rods during the assembly process. Therefore, manufacturing the rotor required
further refinement as described in the following section.
In order to address the alignment issue, it was decided not to fully finish the
construction of the rotor components before assembling them.
Cheek Plates Manufacturing Ensuring Rotor Alignment
In the second attempt, the cheek plates were made using the CNC and the lathe,
however, the extending shaft was not machined to the exact diameter, instead having
a 1mm larger diameter. The front and back view of this cheek plate is presented in
Fig. 7.13a and Fig. 7.13b, respectively.
(a) Front View (b) Back View
Figure 7.13: Roughly Made Cheek Plate
In the next stage, the laminations and cheek plates were mounted on the tie rods.
The threads were added in a way to allow them to extend 2 mm inside the cheek
plate. This will give a margin for the nut to fasten tight enough and press the cheek
plates along with the laminates, which in turn leads to a robust structure for the
rotor. The rotor was placed in lathe and turned to remove the excess 1 mm from
the lamination diameter to bring it to the correct size. The cheek plate’s shaft was
then turned down to 20 mm diameter. Following this technique allowed the rotor to
turn true to the centre and facilitated the alignment of all of the rotor components.
119

Chapter 7. Prototype Construction
Bearing System Assembly
The bearing locating rings were then mounted on the shaft. Fig. 7.14a and Fig.
7.14b show the side view and the top view of the final result, respectively.
(a) Assembled Bearing Placing Ring (b) Rotor Side View
Figure 7.14: Static Rotor
In the next stage, the bearing was mounted on with a transition fit. This structure,
as shown in Fig. 7.15, was ready to be mounted into the end caps in the case.
Figure 7.15: Bearing Assembled On the Rotor
120

Chapter 7. Prototype Construction
7.2 Modified Construction for Spin Testing
At this stage two rotors were manufactured in order to compare the alignment of
the cheek plates and the rotor lamination stack. The first had a 10 mm diameter
central locating shaft and the second no shaft at all, with all other features being
identical.
For the spin tests the load side of the rotor shafts had to be turned to 5 mm diameter
and 15mm long. This was to allow mounting the compressor wheel which will be
explained later. An aluminium housing was made for the rotor to sit in, combined
with two end plates which together act as a dummy stator.
7.2.1 Soft Mounting Bearing
As explained in the previous chapters, if the rotor is accelerated fast enough, it can
pass over the first rock and bounce vibration modes. Research shows soft mounting
the bearings can drastically reduce the frequencies of the rock and bounce vibration
modes, facilitating quick transition over them.
The soft mounting was implemented by adding an O’ring around the bearing. A
Vition 75-compound O’ring with an outer diameter of 61 mm, inner diameter of
55.25 mm and a cross section area of 2.3 mm was obtained.
Two bearing housings were manufactured for each bearing, each of the bearings sits
in the centre of the housing with two O’rings wrapped around the outside of each
housing. As can be seen in Fig. 7.16, the O’rings were placed inside two groves on
the outer surface of the housing. The O’rings were compressed between the housing
and the end caps to 75% of their cross section in order to adjust the stiffness of the
bearing system.
Figure 7.16: Soft Mounted Bearing System
121

Chapter 7. Prototype Construction
7.2.2 Probes
Three different types of probes were to be used during the spin test; a magnetic
encoder, a thermocouple and an accelerometer. The magnet used by the encoder
was mounted on a hole drilled into the non-load side of the rotor shaft. The encoder
was bolted on the case end cap observing the required distance from magnet advised
by the manufacturer.
It is necessary to monitor the bearing temperature as high temperatures lead to
bearing failure. A thermocouple probe was potted in to the side of bearing cups so
it was in contact with the outer race of the bearing.
Finally, to measure the vibrational frequencies of the rotation, an accelerometer has
been placed as close as possible to the bearing. A long stud was manufactured that
was screwed into a threaded hole on one of the bearing housing parts. One end of
the stud sits directly on the outer race of the bearing with the accelerometer probe
screwed to the other end. Fig. 7.17 and Fig. 7.18 show the final assembly of the
high speed prototype rotor from different angles.
Figure 7.17: Fitted Magnet on the Rotor Shaft, Potted Thermocouple and
Accelerometer Stud
122

Chapter 7. Prototype Construction
Figure 7.18: Fitted O’rings on the Bearing Cups
7.2.3 Balancing
The high speed of the machine demands professional balancing of the rotor. First,
the balance quality grade was determined by using a lookup table. The balance
quality grades are classed based on the motor application. After consulting with
the balancing company and considering the weight and size of the rotor a G1.0
grade was selected. Next, using a second look up table, the maximum permissible
residual unbalance (from ISO 1940/1) was determined for the possible over speed of
60,000 rpm. A 0.2 µm centre of gravity displacement was identified for design speed
of the rotor. This information was used to balance the rotor which was carried
out by a professional balancing company. Material was removed from the cheek
plates of the motor to provide the balance, the resulting rotors showed minimal
sign of alteration, validating the manufacturing techniques that were implemented
to ensure alignment for rotor components.
7.2.4 Spin Test Drive Technique
London City University agreed to carry out the spin test using their high speed test
chamber. The test rig uses compressed air as the prime mover for the high speed
test. In this way, the rotor can spin up without requiring an electric load. As a
123

Chapter 7. Prototype Construction
result, there is no need for the stator, instead a cylindrical tube was built to act
as a dummy stator to maintain the air gap size and provide protection in case of a
failure.
An air compressor drives the machine. Compressed air can be controlled to allow
limited pressure over a limited period of time, providing a controlled drive for the
spin test. If the mounted compressor runs in reverse, it will act as an air turbine.
For this, the compressed air is fed from the exhaust and let out from the inlet tube.
Fig. 7.19 shows the compressor volute.
Figure 7.19: Volute of The Compressor Wheel, The Side Tube is Exhaust and the
Middle One is the Inlet.
The compressor wheel has an outer diameter of 41 mm and a 4 mm diameter shaft,
it is capable of running at 250,000 rpm. However, mounting the compressor wheel
required extra attention.
As the compressor wheel has a low mass, it has been mounted directly to the rotor
shaft, and overhung from the bearings without causing any rotor dynamic problems.
A 5 mm diameter hole was drilled at the center of the wheel. The nose of the wheel
was ‘faced off’ to make it shorter and allow more material for a connecting nut. The
wheel was then locked to the shaft with a right hand threaded nut and glued using
Loctite.
The turbine volute was mounted directly onto the end caps of the dummy stator.
Fig. 7.20 shows an air redirection sleeve that was placed between the bearing and the
124

Chapter 7. Prototype Construction
compressor wheel. The sleeve serves two purposes; first the curved surface guides
the compressed air out to the atmosphere providing extra protection for the bearing,
and second the cylindrical part locks the bearing in place stopping it from wobbling.
The assembled system was used for the spin test at the City University.
Figure 7.20: Air Redirection Sleeve
7.3 Case and End Caps for Static Test
The case and the end caps are machined from grade AW6082-T6 Aluminium alloy
using a lathe and a CNC milling machine. The end caps were covered with slot
lining paper in order to provide insulation from the end winding.
7.4 Final Assembly
With one end cap bolted to the stator the pre-load washer was inserted into the
cavity for the bearing. The complete rotor assembly including bearings was then
mounted into the case, with the second end cap placed on the case. The second
end cap was manufactured in such a way as to allow the coil terminations to come
out of the case on one side. A disk was manufactured from black nylon in order to
provide a platform for the coil terminations to connect to the power supply to. The
125

Chapter 7. Prototype Construction
coil terminations were clamped using M6 bolts and screwed to the inner side of the
plate. Finally, the plate was mounted on the end cap and the end cap is screwed to
the case.
The motor was mounted on the test rig as can be seen Fig. 7.21, where the torque
transducer and the rotary table can be seen connected to the motor.
Figure 7.21: Static Test Rig
7.5 Conclusion
The manufacture of the two high speed rotors using the flywheel type technology has
been presented, the rotors are similar, apart from the addition of a 10 mm central
shaft.
The high operational speed required careful manufacture of the rotor. In order
to achieve a uniform thickness on the rotor lamination stack, the laminates were
stacked in alternating directions and then glued to a specified height.
It was found that fully manufacturing the rotor components separately and then
assembling did not give a satisfactory result, due to mis-alignment of the cheek
plates. As a result, the laminates were cut with an extra millimetre on their
126

Chapter 7. Prototype Construction
diameter, the cheek plates were partially made, and all of the rotor components
were assembled on the lathe. The rotor was then finished on the lathe, resulting in
an assembly with good alignment.
Manufacturing the stator proved to be more simple, with no glue and the whole
stator was cut in a single operation from a stack of NO20 using EDM.
Having a non-segmented stator, however, made the winding process more difficult.
A completely pre-made and pressed coil was not suitable due to the small slot
opening. Furthermore, the use of Litz wire made it difficult to hand wind the coils
whilst achieving an acceptable fill. As a compromise 5 turns were wound around a
bobbin and pressed using a hydraulic press. The resulting coils were then mounted
on the insulated stator teeth. The remaining 3 turns were then hand wound and
a fill factor of 40% was achieved. However, it is believed that further development
and more accurate pressed coils can increase the fill factor to 45%.
127

Chapter 8
Testing and Analysis
In previous chapters the design methodology of a high speed, high power SRM was
presented. The electromagnetic behaviour of the proposed motor was simulated
focusing on the output torque and the increased losses that are caused by running
at high speeds.
The mechanical constraints imposed on a high speed rotor, caused by the centripetal
force, were investigated and the maximum mechanical stress imposed on the rotor
and the vibration frequencies calculated.
In this chapter a series of tests are presented which were designed to investigate the
operation of the motor and verify the results of the FEA. The tests are divided into
two sections: electromagnetic and mechanical tests.
To test torque production a static test rig was set up at Newcastle University. The
static test results are used to prove the output torque value obtained from the
simulations, by creating a torque vs rotor position profile. Flux linkage vs current
curves have also been created to be compared to the simulation data from design
verification. The thermal performance of the motor was tested to ascertain the
thermal torque limit.
A flywheel topology is used for the rotor which leads to reduction of the mechanical
stresses and particularly the hoop stress. The mechanical test is used to investigate
the feasibility of the novel approach to the rotor topology. The mechanical part of
the tests was run at the high speed test chamber of London City University as part
of the VESI project.
8.1 Electromagnetic Tests
To verify the torque and thermal properties of the machine a series of static tests
were carried out:
128

Chapter 8. Testing and Analysis
• Measurement of DC resistance.
• Flux linkage with respect to rotor position and current.
• Static torque with respect to current and rotor position.
• Temperature rise in various points of windings with respect to time.
The results of these tests have been used to verify the design process and to provide
confidence in any future research following this work.
In order to test the torque of the motor a static torque test rig was required. The test
rig consisted of a rotary table dividing head, coupled to a 100 Nm Magtrol torque
transducer, which was then connected to the shaft of the machine. The rotary
table allows fine position adjustment of the rotor position. The torque transducer
is accurate to within 0.01% of its rated value and therefore can provide a very
accurate torque measurement at the rated torque of 56 Nm. The output of the
torque transducer is a 0-5 V signal, which was fed into a data acquisition unit, along
with the current measured via a current clamp. The torque and current are logged
by the acquisition unit at every test point. All the required equipment was connected
considering the safety measures suggested by the manufacturers and required by the
university. The full set up schematic can be seen in Fig. 8.1 while Fig. 8.2 shows the
rotor mounted on the base plate, whilst coupled to the rotary table via the torque
transducer. The procedure and results of each test are as follows.
Figure 8.1: Static Test Set Up
129

Chapter 8. Testing and Analysis
Figure 8.2: Rotor Mounted on The Test Rig and The Rotary Table
8.1.1 DC Resistance
The DC resistance of the windings was calculated using Ohm’s law. Since the
temperature affects the winding resistance, the voltage was applied for short
periods of time, which maintained the winding temperature at or around the room
temperature.
A low voltage was applied to the winding and the resulting current measured, the
resistance was measured as 5.83 mΩ per phase. This result is within 1.5% of the
calculated phase resistance of 5.93 mΩ. The test circuit is shown in Fig. 8.3.
Figure 8.3: DC Resistance Test Test Circuit
130

Chapter 8. Testing and Analysis
8.1.2 Flux Linkage
Using the static test rig, voltage pulses were applied to the motor and the rise and
fall time of the voltage transients were recorded and the data processed using a
MATLAB script to create the flux linkage vs current for all rotor position.
The script works based on locating the initial rise and fall of the transient and also
calculates the resistance during the steady state period of the pulse. The measured
voltage can be expressed as Eq. (8.1).
V = iR +dψ
dt(8.1)
The flux linkage vs current for the rising and falling was calculated by integrating the
corresponding voltage over the period of rising or falling as expressed in Eq. (8.2).
∫
V − iR = iL = ψ (8.2)
Data Processing
A test circuit was set up using a 60 V, 600 A Regetron power supply. Calculating
the required voltage using the SRMs equivalent circuit showed no more than 5 V was
required. Setting the voltage for any larger voltage magnitude left a significantly
large overhead for the voltage resulting in a faster rise for the voltage and failure of
the power supply. A function for a current pulse was written for the power supply,
which applied enough voltage for 600 A over a period of 100 ms.
A digital oscilloscope was used to read the data from the voltage and current probes
whose data sample rate was carefully set with respect to the length of one voltage
pulse. The sample rate and resolution of the oscilloscope are inversely related,
although a high sample rate gives a better resolution for the measured data, it will
require a significantly longer computation time. For this experiment, it was decided
to use a sample rate 250 kS/s for 0.4 s, giving 100 k data points.
Noise Filtering
There is a significant overshoot on the rising part of the voltage signal, which existed
for all phases and in every rotor position. After the overshoot the signal settles down
at 3.5 V. This signal was filtered to remove noise for use in the rest of the process.
The measured voltage and current pulses are displayed in Fig. 8.4. Fig. 8.4a shows
a single voltage pulse. Fig. 8.4b displays a single current signal corresponding to the
input voltage signal shown. The current signal was also filtered to remove noise.
131

Chapter 8. Testing and Analysis
Time (s)0 0.05 0.1 0.15 0.2 0.25
Vol
tage
(V
)
-2
-1
0
1
2
3
4
5
MeasuredFiltered
(a) A single Voltage Pulse
Time (s)0 0.05 0.1 0.15 0.2 0.25
Cur
rent
(A
)
-100
0
100
200
300
400
500
600
700
800
MeasuredFiltered
(b) A Single Current Pulse
Figure 8.4: The Voltage and Current Pulses Used to Calculate the ψ − I Curves
Identifying the Start and End Points of the Transient
The start and the end point of the transition period for the rising and falling periods,
as shown in Fig. 8.5, were identified. This determines the start and the end of the
time interval over which the rate of change of the voltage is calculated (shown as blue
lines). The green line indicates the steady state interval over which the resistance of
the phase was calculated. Identifying the intervals is the most important part of the
data processing, as inaccurate values for the start and end points result in incorrect
flux linkage curves or inaccurate minimum values for the flux linkage.
Compiling the Flux Linkage Curves
Using the calculated data for the start and end point of the intervals, and inputting
the data contained within these points into Eq. (8.2), the ψ − I curves for the rising
and falling transients were created which are shown in Fig. 8.6. The rising and falling
curves are slightly different . It is believed that the slight difference was caused by
the different levels of noise present during each transient. The filtering and the
process of identifying the start and end point of each transient have also affected
the final result. It is also possible that the shaft deflects a small amount during
excitation causing the values to be measured at slightly different rotor positions.
This influences when the current reaches the steady state, which in turn affects the
ψ − I calculations, the tests however were repeated with the same result so it is the
case that this is the best accuracy that will be achieved using this particular test
set up.
132

Chapter 8. Testing and Analysis
Time (s)0 0.05 0.1 0.15 0.2 0.25
Cur
rent
(A)
-100
0
100
200
300
400
500
600
700
Steady StateRisingSteady StateFallingSteady State
Figure 8.5: The Start and End Points of The Rise and Fall Transients
Current (A)-100 0 100 200 300 400 500 600 700
ψ (m
Wb)
0
10
20
30
40
50
60
RisingFalling
Figure 8.6: Generic Flux Linkage vs Current
133

Chapter 8. Testing and Analysis
The aligned and unaligned positions were determined by applying a constant current
and finding the positions where zero torque was produced. Since the torque is
produced as a result of movement of the rotor between these positions the flux
linkage vs current curves at the aligned and unaligned positions are of interest.
Fig. 8.7 shows the ψ − I curves created using the measured data and compares
it with those created using FEA which are not significantly different for all three
phases. However, a small discrepancy between the test and FEA curves can be seen.
For the aligned curves, the test motor has entered saturation at a lower magnitude
of flux linkage. This could have been caused by the small overshoot in the signal
however, changing the magnitude of voltage overhead or the rise and fall time of the
pulse did not remove the overshoot. The permeability of the electrical steel could
be affected by the manufacturing process, or simply not as good as was modelled
in the first place. The laminations used for the prototype were cut using the wire
erosion machine which has a very long manufacturing time. This could result in a
reduction in the quality of the electrical steel. Furthermore, all the produced batches
of electrical steel do not have the exact specifications of the product that are provided
in the data sheet and used in the simulations. This has been investigated by lowering
the permeability of the lamination in the simulation by 5%, the difference in the
ψ−I curve can be seen in Fig. 8.8. With the new material properties, the simulated
machine reached saturation at the same point as that measured from the prototype.
Also, the measurement errors, the inaccuracy in identifying the rise and fall points
and the sensitivity of the filtering process can all result in the difference between the
simulation and test results. Therefore, the discrepancy between the ψ − I curves is
not considered an issue.
8.1.3 Static Torque
In order to measure the static torque, a rotary table, which locks the rotor at a
precise angular location, and a 100 Nm torque transducer were used for an expected
peak torque of 56 Nm from the simulations. The torque was measured every 3
mechanical and the torque and current logged by the acquisition unit at every point.
The 600 A 60 V Regetron power supply was again used for this experiment. The
power supply was set in current control mode to give a maximum of 600 A. Voltage
and current are measured more accurately using the a data acquisition unit, coupled
to the machine through a differential voltage probe and current clamp. Since the
prototype motor is a 6/4 SRM, a 90 mechanical rotation of the rotor is equivalent
to a full electrical cycle. Therefore, regardless of the position of the rotor, a 90
rotation on the rotary table is enough to study the torque data of any given excited
stator phase.
134

Chapter 8. Testing and Analysis
Current (A)-100 0 100 200 300 400 500 600
Flu
x Li
nkag
e (m
Wb)
0
5
10
15
20
25
30
35
40
45
50UnalignedAligned
Figure 8.7: Flux Linkage vs Current
Current (A)-100 0 100 200 300 400 500 600
Flu
x Li
nkag
e (m
Wb)
0
5
10
15
20
25
30
35
40
45
50Aligned 0.95BAligned
Figure 8.8: Effect of Reduced Permeability on the Aligned Curve
135

Chapter 8. Testing and Analysis
A pulse function code was created for the current starting from 0 up to 600 A in steps
of 60 A. This function sets the current to zero between the measurement intervals,
which eliminated the need for a switch. Fig. 8.9 presents the torque waveform over
a full electrical rotation for varying values of current. It can be seen that the peak
torque at full rated current is 58.06 Nm. This is 8.9% less than the 63.77 Nm peak
torque estimate obtained from the FEA.
There were thought to be a number of possible causes for this discrepancy such as
the air gap being slightly larger than expected. However, analysis showed that even
a 10% increase in air gap width would reduce the torque by less than 1% so this
was certainly not the case. The same sensitivity analysis used for the flux linkage
measurement was applied to the torque. A 5% reduction in the permeability of the
rotor lamination results in an 8% reduction in the output torque.
At this point the rotor stacking factor of 99% was taken into account, this leads to
a 1% reduction in output torque.
Electrical Angle [Degree]0 30 60 90 120 150 180 210 240 270 300 330 360
Tor
que
[Nm
]
-60
-40
-20
0
20
40
60
Minimum = -58.0344
Maximum = 58.0674
0A60A120A180A240A300A360A420A480A540A600A
Figure 8.9: Static Torque Result
The torque was simulated considering a 5% reduction in the quality of the lamination
and the stacking factor of the laminations. The results are compared to that of the
test which are shown in Fig. 8.10. A very good agreement can be seen which validates
the simulation results. This adds more confidence to the idea that the differences
in the flux linkage characteristic are more dependent on the measurement accuracy
and data processing.
136

Chapter 8. Testing and Analysis
After identifying the aligned and unaligned positions for one stator phase, this test
was repeated for the other two phases which were found to have the same
performance.
Electrical Angle [Degree]0 30 60 90 120 150 180
Tor
que
[Nm
]
0
10
20
30
40
50
60
70
TestSimulation
Figure 8.10: Static Torque Comparison Between Test and Simulation Results taking
into account reduced lamination quality.
8.1.4 Thermal Behaviour
The primary limiting factor in design of electric machines is the thermal capability of
the machine. The machines temperature limit is directly related to the losses which
are in turn proportional to the magnetic loading, electric loading and operational
speed.
For this test, the same circuit as the two previous tests was used. As all three phases
experience the same rms current and hence should heat up by the same amount all
six windings were connected together in series with the terminations connected to
the power supply. Due to the lack of an implemented cooling system, full rated
current could not be used for this experiment. Instead, 150 A was used which is
equivalent to a square wave with a peak of 212 A.
The increase in temperature was observed in three points on the windings: inside a
coil, in between two coils and inside one of the end windings whilst also observing
the ambient temperature [116]. The temperature was recorded every 2.5 s for three
hours until the steady state was reached. The results are shown in Fig. 8.11.
137

Chapter 8. Testing and Analysis
Time (s)0 1000 2000 3000 4000 5000 6000 7000 8000 9000 10000
Tem
pera
ture
(° C)
0
10
20
30
40
50
60
70
80
90
100
T1T2T3Ambient
Figure 8.11: Thermal Test Result
The maximum design temperature of the motor is 155. The maximum recorded
temperature was 98.9, as the power loss in the windings is related to the square
of the current the motor could take another√1.57 times the current. Therefore,
without using a cooling system, a maximum rms current of 188 A (equal to the
peak current value of 266 A) could have been used before exceeding the design
temperature. This would result in a current density of 7.63 A/mm2, which is a
suitable value for air cooling. The heat dissipation caused by the iron loss is not
included here and would lead to a lower current loading than calculated in this case.
8.2 Mechanical Tests
The spin test was carried out at London City University. Due to the high energy
present at high speed operation, the test was carried out in a high speed chamber
with concrete reinforced walls. Sand bags were also added to absorb the impact
during possible failure.
An air compressor was used as the primary drive for the spin test. The stator
was replaced with a cylindrical tube of identical size to provide support and mimic
the drag effect of the real stator. The compressor wheel was directly mounted on
the rotor shaft and secured using a right hand threaded nut. The volute of the
138

Chapter 8. Testing and Analysis
compressor then was fitted in place on the load end cap. The compressed air is
applied in reverse, causing the system to work as an air turbine.
8.2.1 Test Set Up
For this test, an accelerometer, an encoder, a type K thermocouple and an NI
USB data acquisition box (DAQ) were used. The encoder was an RM44AC TM
magnetic encoder suitable for a maximum speed of 60,000 rpm. The magnet part
of the encoder was glued on the shaft, allowing the measurement of the rotational
speed. The accelerometer is an MTN/1130 series Monitran accelerometer with a
frequency response of 2 Hz to 15 kHz. A stud was manufactured and screwed on
the bearing housing cup to make sure shortest distance between the bearing and the
accelerometer and to prevent any possible movement.
In order to read and log the data measured by the probes, a LABVIEW program
was created to interface the probes and data acquisition box. The accuracy and
validity of the logged data was inspected before installing the probes on the rotor.
A signal generator was used to apply sinusoidal signals with an amplitude of 2.2 V
and 20 V to the encoder and the accelerometer inputs of the DAQ, respectively while
they were connected to the data box. After verifying the accuracy of the LABVIEW
code, the probes were installed on the rotor. Next, a small volume of compressed
air was used to run the compressor wheel at low speed to study the performance of
the probes and the LABVIEW file in situation.
The motor was then transferred to London City University for mechanical testing.
Fig. 8.12 shows the probe set up and the contribution of London City University
in providing equipment for the test rig. Fig. 8.13 shows the test set up in the test
rig of London City University. The motor was clamped to the test table using G
clamps and sand bags were used to provide extra stability to the table.
The set up was rotated using a small volume of air to ensure the probes and rotor
operate correctly.
8.2.2 Spin Test Results
The capability of the motor to maintain mechanical integrity was verified by running
the motor up to 50,000 rpm. Two rotors were manufactured for the spin test; Rotor
1, has a central locating shaft of 10 mm diameter, Rotor 2, has no shaft.
139

Chapter 8. Testing and Analysis
Figure 8.12: Mechanical Test Set Up
Figure 8.13: Mechanical Test Rig and Set Up
140

Chapter 8. Testing and Analysis
Rotor1
With a central shaft, Rotor 1 was deemed to have the more robust structure of the
two prototype rotors, however during the balancing operation no differences between
the two were observed.
Fig. 8.14 shows the rotor speed against time. The rotor was successfully spun up to
53,000 rpm after which the air flow was cut to allow the rotor to decelerate under
its own losses. There were no signs of mechanical failure, however, the test duration
was not long enough. Longer test times will require the implementation of complex
bearings and cooling systems.
Time [min]0 1 2 3 4 5 6 7 8 9 10 11
Rot
atio
nal S
peed
[krp
m]
0
10
20
30
40
50
60
Figure 8.14: Speed Test Result of Rotor1
However, due to the mechanical losses of windage and bearing friction, the
temperature at the bearings increases by 26 C, as shown in Fig. 8.15. This
underlines the need for a suitable cooling system for the bearings.
The vibration frequencies of the rotor were monitored during the spin test. To
ensure the rotor vibration frequencies remained below the critical speeds and to allow
immediate termination of the test if excessive vibration occurred. The vibration
measurements are affected by the air flow, the compressor wheel operation and
the test bed. Using the current test rig results in having too many components
contributing to the resonant frequencies, therefore it would be difficult to identify
the resonant frequencies of this operation. As a result, the vibration measurements
of the rotor are not included in this work.
141

Chapter 8. Testing and Analysis
Time [min]0 1 2 3 4 5 6 7 8 9 10 11
Tem
pera
ture
Ris
e [° C
]
-5
0
5
10
15
20
25
30
Figure 8.15: Temperature rise of the bearing of Rotor1
The test was repeated multiple times and the full operation speed was maintained
for a duration to ensure the structural feasibility of the rotor. However, during
one of the initial tests, a piece of debris hit the compressor wheel, leaving a minor
damage as shown in Fig. 8.16. The debris could have been some of the glue used
on the volume modifications. This damage still allowed the rotor to be spun up
however, the resonant vibrations while maintaining at full speed were increased.
Figure 8.16: Evidence of Damage on the Compressor Wheel
142

Chapter 8. Testing and Analysis
Rotor2
Due to the damage to the compressor wheel, the rotor was only spun up to full
speed briefly. Fig. 8.17 shows the motor at 51,000 rpm before the air flow was cut
off. Again, no sign of mechanical failure was observed for this rotor.
Time [min]0 1 2 3 4 5 6 7 8
Rot
atio
nal S
peed
[krp
m]
0
10
20
30
40
50
60
Figure 8.17: Speed Test Result of Rotor2
The temperature at the bearings experienced an increase of 33 C as shown in Fig.
8.18.
In order to obtain the magnitude of the windage drag and the bearing friction
loss, it could be possible to add a clutch between the compressor and the rotor
and disengage the clutch once the full speed is achieved. This allows the rotor to
decelerate independently. The bearing friction and the windage drag losses can be
calculated from the deceleration speed as they are in proportion to the speed and
the square of speed, respectively. This was not considered during this project but is
an interesting area for future study.
143

Chapter 8. Testing and Analysis
Time [min]0 1 2 3 4 5 6 7 8
Tem
pera
ture
Ris
e [° C
]
0
5
10
15
20
25
30
35
40
Figure 8.18: Temperature rise of the bearing of Rotor2
8.3 Conclusion
The practical tests results were presented in this chapter. The tests were carried
out in two groups: the electromagnetic tests and the mechanical tests.
The electromagnetic performance of the motor was investigated using a series of
tests at Newcastle University. Various test set ups were designed to carry out each
of the tests.
A test circuit was designed and implemented on the test rig to measure the DC
resistance of the motor. The results also helped in identifying the maximum required
voltage for the next static tests.
The next SRM characteristic to identify was the flux linkage vs current profile.
The concept of this test was to use the SRM voltage equation to create the flux
linkage curves. A short current pulse of full rated current was applied at the
aligned and unaligned positions. By integrating the rate of change of voltage
during the transition period the flux linkage vs current curves were created. The
results were compared to the flux linkage curves obtained from the FEA. It was
found that by reducing the permeability of the laminations by 5% in the
simulation a better agreement, especially in the saturation flux was found. Other
differences in the characteristic were attributed to measurement errors and
144

Chapter 8. Testing and Analysis
limitations in the script used for the calculation, this was confirmed by the good
match found between simulation and results of the next test.
The test rig was then adjusted to perform a full current test aimed at creating the
torque vs rotor position profile. The torque vs rotor position profile was created
for a full electrical cycle for a range of currents starting form 0 A to 600 A in steps
of 60 A. The peak torque at full current was identified as 58.06 Nm. The aligned
and unaligned positions were also identified using this type of test as they are the
positions where zero torque is produced. The test technique and the implemented
equipment were explained. Again a simulation between measured results and a
simulation with 5% reduced permeability for the lamination materials was
conducted. The results of this simulation showed very good correlation with the
results of the measured prototype.
The thermal behaviour of the machine was then measured. Due to the lack of an
implemented cooling system, a constant current of 150 A was used instead of the
full rated current. This test was carried out over a period of three hours and the
results verified the design thermal capability of the motor.
The mechanical tests were carried out using the high speed test chamber at London
City University. A compressed air system was used as the primary drive for the
test. Therefore, a no load test setup was designed and built. The operational
speed of the motor was monitored using a magnetic encoder. Both of the prototype
rotors were successfully spun over the design speed of 50,000 rpm. During the
test the vibration frequencies of the bearings and the bearing temperature were
monitored to avoid possible failure. No signs of mechanical failure were seen during
the spin tests. Although this proves the feasibility of the applied topology for this
application, further tests with longer duration are required to fully assure the rotor
can maintain its structural integrity over log periods of operation. The longer steady
state operation of the motor will require the implementation of complex bearings
with cooling systems.
145

Chapter 9
Conclusion
9.1 Introduction
The simple structure of SRMs makes them robust, and their magnet free nature
consequently makes them cost effective. The rotor of an SRM is free from any
winding or permanent magnet material which makes the technology a good
candidate to replace PM motors, while achieving an acceptable power density.
Furthermore, the rugged structure of the rotor makes them suitable for high speed
applications.
The main focus of this thesis has been to design a high speed, high power SRM
to meet the specifications of the PM motor used in the Toyota Prius. In order to
push the limits of power density, a 50,000 rpm, 60 kW SR motor has been designed,
manufactured and tested.
Due to the high operating speed of this motor, whilst still having a sizeable diameter,
it was necessary to take into account both the mechanical and electromagnetic design
simultaneously. For simplicity the design methodology for each constraint will be
presented here separately.
9.1.1 Electromagnetic Design Process
Prior to the work presented in this thesis a design investigation into an SRM to
replace the PM machine found in the Toyota Prius was conducted by a research
team at the university of Tokyo. The work of this research team involved the design
of a 13,500 rpm SRM (SRM1) that produced 207 Nm of torque, this machine was
summarised in Chapter 2. In this work it was proposed to increase the speed of the
machine whilst producing the same 60 kW output power as the Prius PM machine
and the Tokyo SRM machine (SRM1).
To achieve a guideline for the motor frame size, the design process began by
scaling down the machine according to the sizes of Tokyo SR machine, SRM1. The
146

Chapter 9. Conclusion
required geometrical properties of the motor, such as the stator outer diameter,
the rotor outer diameter and the stack length were calculated using analytical
methods to be 176 mm, 105 mm and 58 mm, respectively. A stator/rotor tooth
combination of 6/4 was selected in order to reduce the electrical frequency, keep
the iron loss of the machine low and reduce the power electronic converter PWM
switching frequency requirements. The initial dimensions of the motor generated
using analytical methods were then implemented in FEA models to more
accurately identify the electromagnetic output of the motor.
9.1.2 Static Simulation
Initial FEA investigation of the machine dimensions obtained by analytical
calculation showed that to produce the required torque, the length and diameter of
the rotor needed to be altered to 95 mm and 91 mm, respectively. The resulting
FE model, when solved for static torque showed that the motor produced a peak
torque of 66.09 Nm when simulated in 2D and 63.77 Nm in 3D. The 3.3%
difference between the two simulations being due to the end effects, which are not
considered in the 2D simulation and the difference in mesh quality between a 2D
and 3D simulation.
Static simulations are very useful in the early stages of the design process because
they produce reliable results in a short time frame. However simulating a more
realistic performance of the machine required transient simulations. When supplied
with a square wave current under dynamic conditions the motor was simulated to
produce an average torque of 55.6 N.m at the corner speed of 10,000 rpm whilst
keeping within the specified voltage limit of 600 V.
9.1.3 Dynamic Simulation
Dynamic Simulations also allow calculation of the electromagnetic losses in the
machine which are categorised as DC copper loss, AC copper loss and Iron loss.
The DC copper loss of the machine at full rated current of 600 A was calculated to
be 3.3 kW. The AC loss required more investigation into the design of the winding,
a short study on the influence of skin effect and proximity loss on the winding was
conducted. The conclusion was that, unsurprisingly a coil of 8 turns of a solid
copper conductor would produce significant losses nearly fourteen times that of the
DC copper loss. A stranded conductor therefore needed to be used of radius less
than the 1.14 mm skin depth of copper at 833.33 Hz. A simulation using stranded
conductor showed that the loss in the conductors was reduced to the extent that
the loss in the coils was equal to the DC copper loss in the windings . For the final
147

Chapter 9. Conclusion
design 8 turns of litz wire were chosen. The litz wire contains 750 strands with a
diameter of 0.2 mm, each much smaller than the skin depth of the copper.
Iron loss was calculated by the FEA software using manufacturer’s data applied to
the Steinmetz equation on a per harmonic basis.
Windage loss in a toothed structure such as an SRM is a concern, particularly
as windage loss is proportional to the cube of the speed. The windage loss was
calculated using a previously developed model, and was found to be 5.21 kW at
50,000 rpm. Compared to a smooth cylindrical rotor this loss was 3.72 times higher.
Measures can be taken to reduce the windage loss by, for example, filling the gaps
between teeth with an epoxy material to give a smooth surface. It is also thought
that by increasing the end plates of the rotor to the same diameter as the outer
diameter of the rotor teeth then the windage loss will reduced although this is a
subject for further investigation.
Using the data calculated for copper loss, iron loss and windage loss an efficiency
map of the motor was created. The peak efficiency of the motor was 93.73% at
15, 000 rpm and 60 kW, which could be increased to 94% at 17, 500 rpm, 60 kW by
using a cylindrical rotor, which pushes the overall high efficiency points to higher
speeds. The main benefits of a cylindrical rotor were found at the highest speeds
where the windage and iron losses are dominant, in these areas the efficiency can
be increased. The cylindrical rotor for an SRM can be imitated by filling the inner
pole gaps with epoxy or the use of flux bridges between the rotor tips.
9.2 Mechanical Design Process
9.2.1 Mechanical Stresses
The majority of the stresses imposed on a high speed rotor are caused by centrifugal
force, which is an inertial force in the radial direction and is directly proportional
to the square of the angular velocity of the rotor.
A tip speed of 250 m/s was used as a rule of thumb, based on the output power and
design speed of the motor, to determine an upper limit for the operational speed.
The rotor tip speed at 5236 rad/s (50,000 rpm) with a radius of 45.5 mm was
calculated to be 238.2 m/s. This falls below the guide upper limit, which indicated
the possibility of safe operation.
Considering a conventional SRM rotor there were found to be two main causes of
stress on the laminations of the rotor;
• Notch Effect: The rise in the stresses around any indents, cracks, and sharp
angles of a rotating body.
148

Chapter 9. Conclusion
• Tangential (Hoop) Stress: The stress concentration around the central hole of
a rotating disk. The hoop stress limits the maximum operational speed and
the maximum rotor outer diameter.
The notch effect was relatively simple to alleviate, through the removal of sharp
angles by the use of fillets. In the case of this machine these fillets needed quite a
large radius so that the teeth of the machine joined the fillet at a tangent, removing
any possible sharp edge. Having a too small a radius results in reduction in the
rotor pole height and hence a decrease in output torque. Removing the influence of
the notch effect reduced the rotor peak stress of 1208 MPa, located near the corner
of one of the tooth bodies, to 511 MPa located at the inner diameter of the rotor.
This was still too high considering the typical lamination yield strength of 450 MPa.
Hoop stress was the cause of the peak stress at the inner diameter of the rotor with
fillets. The hole at the inner diameter of the rotor has a minimum possible size when
a shaft is fed through it, that size is the diameter of the shaft required to transfer
55 Nm. The minimum shaft diameter was calculated using the torsion in a beam
equation to be 11.2 mm. As a safety factor and to provide more robustness 20% extra
was added to the diameter. When the shaft is being designed , bearing availability
also needs to be taken into account. The closest diameter among commercially
available bearings is 15 mm. However, the shaft needs to be designed slightly larger
to accommodate for a chamfer against which the bearing is pressed. Therefore, a
17 mm diameter would be the smallest possible. For this work the size of available
couplings was also considered, which meant that the shaft size would be 20 mm
rather than the 17 mm shaft that would be chosen in reality.
A rotor lamination with a 17 mm diameter hole for a shaft was simulated. It
showed that the maximum stress was 470.1 MPa at the inner diameter of the
lamination, this was above the guaranteed yield strength of the stator lamination,
of 400 MPa. Therefore, it was not possible to have a shaft through the centre of
the rotor to transfer torque. An alternative approach to the configuration of the
rotor was considered.
One way to completely remove the hoop stress on the inner diameter of the rotor
lamination is to have no hole at all. This means that with no through shaft
another method of holding the rotor laminations together was required. A
topology commonly applied to flywheels was applied to this rotor. This involved
adding bolts and tie rods through the rotor, and connecting them to cheek plates
at the ends to sandwich the laminations together. The cheek plates then have an
extending shaft used to transfer the torque to the load.
The new design required extra investigation from both a mechanical and
electromagnetic point of view. The number, size and position of the holes for the
149

Chapter 9. Conclusion
tie rods was analysed for the minimum stress yet maximised torque. It was found
that aside from the addition of the rod holes in the first place, there was little
difference in the motor performance based on the size and position of the holes.
Therefore a symmetrical set of four holes was chosen such that they can lay under
each of the teeth of the rotor. At this point other minor design specifications such
as the rotor tooth arc and rotor tooth height were investigated both mechanically
and electromagnetically to achieve an optimized design.
The final design, including the tie rod hole cuttings with a diameter of 6 mm
located at a radial distance of 26 mm from the centre, showed a maximum stress of
382.5 MPa at an over speed of 60,000 rpm, which is below the guaranteed yield
strength of the material (400 MPa). This is a safety factor of 1.15 against the yield
strength of the laminations, and a safety factor of 1.7 for operating at 50,000 rpm,
ensuring a safe rotor design to operate at 50,000 rpm.
9.2.2 Rotor Vibration
Vibrations cause deflection in the rotor, and if spun at natural frequencies, the rotor
deflections can reach dangerous levels. The rotor design ideally avoids the vibration
frequencies over the full operating speed range.
Furthermore, soft mounting of the bearings reduces the effective stiffness, allowing
operation beyond vibration frequencies. If the rotor is accelerated rapidly through
speeds associated with the rock and bounce mode, the system deflection can be
limited allowing operation beyond those resonant frequencies.
The frequencies of the rotor were calculated using modal analysis on the complete
rotor including tie rods, cheek plates and taking into account bearing stiffness.
9.3 Prototype Construction
The stator of the machine was produced out of a stack of NO20 grade silicon iron
laminations, a typically low iron loss material. The laminations were wire eroded
in a stack without being glued together, and then stacked in the case and located
by means of the keyway in the lamination and stator housing. The absence of glue
gave a higher stacking factor that would have been achieved for a glued stack.
It would have been possible to manufacture the stator teeth in segments, allowing
the coils to be wound individually on to the teeth of the machine and then slotted
together on the stator, as has been the subject of other machines constructed [117].
However this was not considered for this work as the main aim was to produce a
high speed rotor. Furthermore, segmenting the stator teeth risks adding a small
150

Chapter 9. Conclusion
air gap in between the segments. As a result, obtaining a high stator fill factor
with small slot openings and litz wire was a challenge. Like wise, using segmented
rotor poles, in which the pole modules are inserted in a rotor back iron with low
permeability [118,119], is not an option for high speed motors where the robustness
of the rotor structure has the highest priority.
To make the coils, 5 turns were initially wound around a bobbin and pressed using
a hydraulic press. The resulting coils were then mounted on the insulated stator
teeth. The remaining three turns were then hand wound, achieving a slot fill factor
of 40%.
The high operational speed required careful manufacture of the rotor. The rotor
laminations were of grade M250-35HS which is suitable for high speed applications
due to its typical yield strength of 450 MPa. When stacking the laminations it
was the case that they were not of uniform thickness. In an attempt to achieve a
uniform rotor length the laminations were stacked in alternating directions, glued
and cured in the oven using clamps and spacers. The laminations were wire eroded
with a millimetre larger diameter than the finished rotor. The cheek plates were
machined to an almost finished state then assembled along with the tie rods and
the laminations. The rotor machining was finished on the assembled rotor in order
to ensure the components were concentric.
Due to possible difficulties in the alignment of the rotor cheek plates using only the
tie rods through the laminations, a second rotor was constructed. The second rotor
had a small locating shaft of 10 mm diameter running through the centre of the
laminations. This shaft diameter is small enough to avoid significant hoop stress,
yet allows more certainty in the alignment of the rotor components. The shaft is
not however capable of transmitting full load torque, and simply located in holes
cut out in the cheek plates.
Bearing selection is a crucial part of the design process of a high speed motor. There
are three major types of commercially available bearings: magnetic bearings, air
bearings and rolling element (balls or cylinders) bearings. Ball bearings were used
here as they eliminate the auxiliary equipment needed for control and operation of
magnetic and air bearings. For a 20 mm shaft diameter and 50,000 rpm there was a
limitation on the available bearings. A set of high precision angular contact bearings
were chosen for the project. The bearings are ceramic coated hybrid ball bearing
type with a rated speed of 68,000 rpm with a grease lubricant.
The spin test of the rotor was performed at London City University using a
compressed air system to drive. It was required to build a separate housing for the
motor consisting of a cylinder with two end plates to hold the bearings. The rotor
was suspended inside the housing and a compressor wheel attached to the end of
the shaft. It was with the compressor wheel attached that both rotors were
151

Chapter 9. Conclusion
balanced by removing a small amount of material from the cheek plates. Although
a shaft was added to one rotor to aid alignment, no practical differences were
noticed in the balancing of the two rotors.
Also included in the test setup was an accelerometer to measure the vibrations of
the rotor, an encoder to measure the speed and a thermocouple to measure the
temperature of the bearings.
9.4 Motor Testing
The motor tests were carried out in two groups: the electromagnetic tests and
the mechanical tests. The electromagnetic performance of the motor was verified
at Newcastle University, using various test set ups. The mechanical tests were
performed at London City University.
9.4.1 Electromagnetic Tests
The required facilities of a 50,000 rpm 60 kW high speed test chamber were not
available at Newcastle University. However, assessment of electromagnetic
performance was carried out via a series of static tests.
The flux linkage versus current characteristic of the motor was created by applying
short current pulses in the aligned and unaligned positions. By integrating the
SRM voltage equation, the flux linkage could be calculated. The results showed a
good match with the FEA simulation, with the deferences attributed to poorer than
expected material characteristics and limitations in the measurement method.
The static torque versus rotor position was measured on a static test rig for a full
electrical cycle and currents between 60 A and 600 A, in steps of 60 A. The peak
torque at full current was measured to be 58.06 Nm. The measured torque was
lower than that expected from FEA simulations by 8.9%. An investigation into the
possible causes of the lower torque was carried out. Although there is the possibility
that the airgap is larger than expected this was ruled out as a possible cause of
the lower torque as it would require double the airgap size to reduce the torque by
only 5%. Instead it is more likely that lower than expected lamination performance
is to blame, with only a 5% reduction in material properties in the simulations
leading to the same drop in torque. This is a more than possible reduction in
material properties due to manufacturing or simply a worse than normal batch of
laminations. This is before taking into account that the simulation of the motor will
not be without inaccuracies in the calculations. A simulation with reduced material
properties was conducted and the results matched very well with the measurements
of the prototype machine.
152

Chapter 9. Conclusion
The thermal behaviour of the machine was tested over a period of three hours and
the results verified the design thermal capability of the motor. However, due to the
lack of an implemented cooling system, a constant current of 150 A (equivalent to
a square wave of peak of 212 A) was used instead of the full rated current. An
RMS phase current of 424 A would be required to produce full rated torque, less
than three times the current density used in the static test with no cooling method
applied. It is possible to greatly increase the cooling capability with either water
or oil cooling it is expected that if they were applied the full rated current could be
realised.
9.4.2 Mechanical Tests
The mechanical tests were carried out using the high speed test chamber at London
City University. A compressed air system was used as the primary drive for the test.
Therefore, a no load test set up was designed and built.
A LabVIEW program was written that took in the outputs of the accelerometer,
magnetic encoder and temperature sensors. The program analysed the inputs and
displayed the results in real time so that the speed of the rotor could be seen as well
as if the vibrations of the rotor were becoming too high.
Both rotors were successfully spun up to over the design speed of 50,000 rpm. During
the test the vibration frequencies of the bearings were monitored. The temperature
of the bearings was also monitored to avoid excessive temperature rise and failure.
No sign of mechanical failure was observed. However, the duration of this test was
not long enough to ensure no failure would occur after long periods of operation.
A longer test duration will require more detailed bearing design, implementation of
complex bearings and use of some type of a cooling system for the bearings.
9.5 Comparison to Motors with Similar
Specification
The culmination of this research has been the successful design, construction and
testing of a high speed, high power SRM capable of 60 kW at 50,000 rpm, using
a flywheel topology approach for the rotor. Although, the tests have verified the
design and indicated the possibility of full-load, full-speed operation, it should be
noted that the spin test was carried out for a short period of time and under specific
conditions. Table 9.1 provides a comparison with the design SRM1 produced by
Tokyo university, and the third generation of Toyota Prius. The high speed machine
is smaller, whilst providing the same power, the weight of the machine has reduced
153

Chapter 9. Conclusion
from 25.2 kg to 18 kg. The result is a higher efficiency machine with a power to
weight ratio 1.39 times that of the original machine.
It should be mentioned that compared to the other state of the art motors that
were mentioned in Chapter 2, the proposed motor of this work does not implement
the expensive iron-cobalt lamination, but uses the lower cost NO20 and M250-35HS
for manufacturing the stator and the rotor. The bearings used for the prototype
of this work were from angular contact ball bearing type, which are from a lower
cost range compared to the magnetic or air bearings used in high speed motors.
No exotic material or expensive manufacturing technique was used for the design or
construction of the prototype. The results of this work give confidences in design
and manufacture of a high speed high power SRM and provide the grounds toward
further study regarding different aspects of such motors.
Table 9.1: Specification Comparison of the Toyota Prius, SRM1 and the DesignedSRM
Parameter Symbol Unit Toyota Prius SRM1 SRM
Stator Outer Diameter SOD [mm] 264 264 185Rotor Outer Diameter ROD [mm] - 182 91Stack Length LS [mm] 50 87 95Maximum Power Pmax [kW] 60 61 60Maximum Speed nmax [krpm] 13.9 13.9 50Torque T [Nm] 207 211 56DC Link Voltage VDC [V] 650 650 600Fill Factor FF - 0.54 0.56 0.4Stator/rotor teeth ratio Nr/Ns - - 18/12 6/4Max Torque Density TD [Nm/l] 35 36 22Max Power Density PD [kW/l] 10.2 10.4 23.5Specific Power P −W [kW/kg] 2.7 2.4 3.33Specific Torque T −W [Nm/kg] 9.3 8.4 3.11Mass W [kg] 22.2 25.2 18Iron Loss PFe [kW] 2.7 1.3 1.79Copper Loss PCu [kW] 6.0 6.3 3.3Efficiency η [%] 88 89 91.36*Airgap Shear Stress σ [kNm/m3] - 45.73 44.99*The mechanical losses are not included in the calculation of the efficiency.
9.6 Recommendations for Future Research
The work described in this thesis is one step toward the implementation of an
operational high speed high power SRM. The following recommendations for further
research are put forward:
154
Chapter 9. Conclusion
1. Research on “ The Control of High Speed, High Power SRMs for Automotive
Applications ” culminating in the design, construction and testing of a 60 kW
SRM drive and controller.
2. Research on “ The Windage Loss Investigation of High Speed, High Power
SRMs with a Large Cheek Plate Approach ” culminating in the calculation
and measurement of the windage loss of the SRM rotors with and without a
cheek plate size of that of the rotor. Use of a clutch to disengage the compressor
wheel from the rotor and investigating the bearing friction loss.
3. Detailed design of the bearing system, including alternative bearing types
suitable for high speed applications and a choice of cooling system for the
bearings.
4. Further mechanical tests focusing on the spin test, including increasing the
total test duration, increasing the duration of operating at full speed and use
of X-ray scans for the detailed study of the rotor for structural failures.
5. Measuring the vibration frequencies of the rotor over the full range of the
operational speed.
6. Research and development of a full load, full speed dynamometer test rig.
7. Performance measurements up to full load and full speed.
8. Design and construction of a cooling system suitable for the respective current
density.
155

Appendix A
Photographs and MechanicalDrawings
Mechanical drawings, note scale on drawings no longer accurate due to thesis page
formatting.
156

Appendix A. Photographs and Mechanical Drawings
Figure A.1: Wire Erosion Machine
Figure A.2: Stator Inside the Case
157

Appendix A. Photographs and Mechanical Drawings
Figure A.3: End Windings
158

Appendix
A.Photo
gra
phsand
Mech
anicalDrawings
1
1
2
2
3
3
4
4
5
5
6
6
A A
B B
C C
D D
M250-35HS
Rotor
Maede Besharati 06/10/2014
Designed by Checked by Approved by Date
1 / 1Edition Sheet
Date
10,00
6,00 0,05
52,00 0,05
90,00
95,00- 0,000,35+
58,500,10
45,00
272 laminations of 0.35mm
27,00
R
0,10
34,00
91,00
91,00
159

Appendix
A.Photo
gra
phsand
Mech
anicalDrawings
A ( 3 : 1 )B ( 2 : 1 )
A
B
1
1
2
2
3
3
4
4
5
5
6
6
A A
B B
C C
D D
NO20
Stator.0002
Maede Besharati 15/10/2014
Designed by Checked by Approved by Date
1 / 1Edition Sheet
Date
180, 00
150, 00
91,60- 0,000,05+
95,00
27,00
R1,00
1,04
R3,00
R3,00
180, 00
453 sheets (95mm/0.21mm, 0.2mmthickness of each sheets + 0.01 thickness
of the glue)
160

Appendix
A.Photo
gra
phsand
Mech
anicalDrawings
1
1
2
2
3
3
4
4
5
5
6
6
A A
B B
C C
D D
Bearing Placing Ring
b0914287 24/02/2016
Designed by Checked by Approved by Date
1 / 1Edition Sheet
Date
36,00
34,00
24,00
20,00
1,50 2,00 1,50 3,00
R3,00
R1,00
R5,00
20,00
Nitronic 50
Maede Besharati
161

Appendix
A.Photo
gra
phsand
Mech
anicalDrawings
1
1
2
2
3
3
4
4
5
5
6
6
A A
B B
C C
D D
Bearing Placing T u be
b0914287 18/02/2016
Designed by Checked by Approved by Date
1 / 1Edition Sheet
Date
20,00
24,00
48,00
16,00
2,00
5,00 11,60
R5,00
Maede Besharati
Air Redirection sleeve
Aluminum
162

Appendix
A.Photo
gra
phsand
Mech
anicalDrawings
1
1
2
2
3
3
4
4
5
5
6
6
A A
B B
C C
D D
Dummy Stator1
b0914287 27/01/2016
Designed by Checked by Approved by Date
1 / 1Edition Sheet
Date
101,00
140,00
120,50
60,00
M5 0 865,00
15,00 DEEP
151,00
140,00
Cylindrical be
15,0015,00
D o
M rati
Aluminum
163

Appendix
A.Photo
gra
phsand
Mech
anicalDrawings
1
1
2
2
3
3
4
4
5
5
6
6
A A
B B
C C
D D
L End C a Spin est
b0914287 04/02/2016
Designed by Checked by Approved by Date
1 / 1Edition Sheet
Date
74,60
71,28
38,00
101, 00
3,00 6,00 4,94 4,56
5,00 H R U
5 08 6
Maede Besharati
Aluminum
164

Appendix
A.Photo
gra
phsand
Mech
anicalDrawings
1
1
2
2
3
3
4
4
5
5
6
6
A A
B B
C C
D D
O Ring Cup
b0914287 18/02/2016
Designed by Checked by Approved by Date
1 / 1Edition Sheet
Date
33,00
37,00
57,10
60,10
2,76
2,62
2,00
2,62
2,00
3,00 9,00
Maede Besharati
S ! " " #
165

Appendix
A.Photo
gra
phsand
Mech
anicalDrawings
1
1
2
2
3
3
4
4
5
5
6
6
A A
B B
C C
D D
O Ring Cup Encoder End
25/05/2016
Designed by Checked by Approved by Date
1 / 1Edition Sheet
Date
59,49
56,49
37,00
33,00
1,87 2,62 9,00 2,62 1,89
1,50
9,00 9,00
Maede Besharati
$ % & & '
166

Appendix
A.Photo
gra
phsand
Mech
anicalDrawings
1
1
2
2
3
3
4
4
5
5
6
6
A A
B B
C C
D D
Resolver End Cap - Spin ( est
b0914287 04/02/2016
Designed by Checked by Approved by Date
1 / 1Edition Sheet
Date
101, 00
69,82
60,50
40,00
72,37
15,00 3,505,00
20,50
60,50
5,00 ( ) R *
5 0 8 6
3,00
Aluminum
Maede Besharati
167

Appendix A. Photographs and Mechanical Drawings
168

Appendix A. Photographs and Mechanical Drawings
169

Appendix A. Photographs and Mechanical Drawings
170

Appendix A. Photographs and Mechanical Drawings
171

Appendix A. Photographs and Mechanical Drawings
172

Appendix A. Photographs and Mechanical Drawings
173

Appendix A. Photographs and Mechanical Drawings
174

Appendix A. Photographs and Mechanical Drawings
175

Appendix A. Photographs and Mechanical Drawings
176

References
[1] R. Yang, N. Schofield, and A. Emadi, “Comparative study between interior
and surface permanent magnet traction machine designs,” in 2016 IEEE
Transportation Electrification Conference and Expo (ITEC), June 2016, pp.
1–6. [Cited on p. 6].
[2] “Rare metal price,” http : / /www.bbc . co . uk/news/magazine-26687605,
accessed: 12-01-2017. [Cited on pp. 6, 7].
[3] “Rare metal price,” http : / / www . magnetsource . com / Solutions
Pages/NEOproperts, accessed: 12-01-2017. [Cited on pp. 6, 7].
[4] “World motor vehicle annual production,”
https://en.wikipedia.org/wiki/Automotive industry, accessed: 12-01-2017.
[Cited on pp. 6, 8].
[5] H. Kuss, T. Wichert, and B. Szymanski, “Design of a high speed switched
reluctance motor for spindle drive,” in Compatibility in Power Electronics,
2007. CPE ’07, May 2007, pp. 1–5. [Cited on p. 9].
[6] J. West, “DC, induction, reluctance and PM motors for electric vehicles,” in
Motors and Drives for Battery Powered Propulsion, IEE Colloquium on, Apr
1993, pp. 1/1–111. [Cited on p. 9].
[7] V. Petrus, A. C. Pop, C. S. Martis, J. Gyselinck, and V. Iancu, “Design and
comparison of different switched reluctance machine topologies for electric
vehicle propulsion,” in Electrical Machines (ICEM), 2010 XIX International
Conference on, Sept 2010, pp. 1–6. [Cited on p. 9].
[8] “Toyota prius electric motor,” http://magneticsmagazine.com/main/articles/
simulating-the-toyota-prius-electric-motor/, accessed: 07-04-2017. [Cited on
p. 9].
[9] P. Lawrenson, J. Stephenson, P. Blenkinsop, J. Corda, and N. Futon,
“Variable-speed switched reluctance motors,” Electric Power Applications,
IEE Proceedings B, vol. 127, no. 4, pp. 253–265, July 1980. [Cited on pp.
9, 10, 11].
177

REFERENCES
[10] M. Feyzi, S. Aghdam, and Y. Ebrahimi, “A comprehensive review on the
performance improvement in switched reluctance motor design,” in Electrical
and Computer Engineering (CCECE), 2011 24th Canadian Conference on,
May 2011, pp. 000 348–000 353. [Cited on p. 10].
[11] K. Vijayakumar, R. Karthikeyan, S. Paramasivam, R. Arumugam, and
K. Srinivas, “Switched reluctance motor modeling, design, simulation, and
analysis: A comprehensive review,” Magnetics, IEEE Transactions on, vol. 44,
no. 12, pp. 4605–4617, Dec 2008. [Cited on p. 10].
[12] R. Wallace and D. Taylor, “Low-torque-ripple switched reluctance motors
for direct-drive robotics,” Robotics and Automation, IEEE Transactions on,
vol. 7, no. 6, pp. 733–742, Dec 1991. [Cited on p. 10].
[13] J. Finch, J. Faiz, and H. Metwally, “Design study of switched reluctance
motor performance,” in Industry Applications Society Annual Meeting, 1992.,
Conference Record of the 1992 IEEE, Oct 1992, pp. 242–248 vol.1. [Cited on
p. 10].
[14] I. Chabu, S. Nabeta, and J. Cardoso, “Design aspects of 4:2 pole-2
phase switched reluctance motors,” in Electric Machines and Drives, 1999.
International Conference IEMD ’99, May 1999, pp. 63–65. [Cited on p. 10].
[15] N. Sheth and K. Rajagopal, “Torque profiles of a switched reluctance motor
having special pole face shapes and asymmetric stator poles,” Magnetics,
IEEE Transactions on, vol. 40, no. 4, pp. 2035–2037, July 2004. [Cited on
p. 10].
[16] E. Hall M, S. Ramamurthy, and J. Balda, “An enhanced simple method
for designing switched reluctance motors under multi-phase excitation,”
in Electric Machines and Drives Conference, 2001. IEMDC 2001. IEEE
International, 2001, pp. 715–720. [Cited on p. 10].
[17] M. Anwar, I. Hussain, and A. Radun, “A comprehensive design methodology
for switched reluctance machines,” in Industry Applications Conference, 2000.
Conference Record of the 2000 IEEE, vol. 1, 2000, pp. 63–70 vol.1. [Cited on
p. 10].
[18] M. Moallem, C.-M. Ong, and L. Unnewehr, “Effect of rotor profiles on
the torque of a switched-reluctance motor,” Industry Applications, IEEE
Transactions on, vol. 28, no. 2, pp. 364–369, Mar 1992. [Cited on p. 10].
[19] R. Arumugam, J. Lindsay, and R. Krishnan, “Sensitivity of pole arc/pole pitch
ratio on switched reluctance motor performance,” in Industry Applications
178

REFERENCES
Society Annual Meeting, 1988., Conference Record of the 1988 IEEE, Oct
1988, pp. 50–54 vol.1. [Cited on p. 10].
[20] R. Krishnan, R. Arumugan, and J. Lindsay, “Design procedure for
switched-reluctance motors,” Industry Applications, IEEE Transactions on,
vol. 24, no. 3, pp. 456–461, May 1988. [Cited on pp. 10, 62].
[21] M. Ravichandran, V. Achari, C. Joseph, and R. Devasahayam, “A simplified
design methodology for switched reluctance motor using analytical and finite
element method,” in Power Electronics, Drives and Energy Systems, 2006.
PEDES ’06. International Conference on, Dec 2006, pp. 1–4. [Cited on p. 10].
[22] J. Finch, “Design method for torque estimation in stepping and switched
reluctance motors,” in Stepper Motors and Their Control, IEE Colloquium
on, Jan 1994, pp. 3/1–3/3. [Cited on p. 10].
[23] A. Radun, “Design considerations for the switched reluctance motor,” Industry
Applications, IEEE Transactions on, vol. 31, no. 5, pp. 1079–1087, Sep 1995.
[Cited on p. 10].
[24] A. Miles, “Design of a 5 mw, 9000 v switched reluctance motor,” Energy
Conversion, IEEE Transactions on, vol. 6, no. 3, pp. 484–491, Sep 1991. [Cited
on p. 10].
[25] B. Fahimi, G. Suresh, and M. Ehsani, “Large switched reluctance machines:
a 1 mw case study,” in Electric Machines and Drives, 1999. International
Conference IEMD ’99, May 1999, pp. 84–86. [Cited on pp. 10, 85].
[26] A. Jack, J. Finch, and J. Wright, “Adaptive mesh generation applied to
switched reluctance motor design,” in Industry Applications Society Annual
Meeting, 1990., Conference Record of the 1990 IEEE, Oct 1990, pp. 230–233
vol.1. [Cited on p. 10].
[27] I. Chabu, S. Nabeta, and J. Cardoso, “Design aspects of 4:2 pole-2
phase switched reluctance motors,” in Electric Machines and Drives, 1999.
International Conference IEMD ’99, May 1999, pp. 63–65. [Cited on p. 10].
[28] Y. Tang, “Characterization, numerical analysis, and design of switched
reluctance motors,” Industry Applications, IEEE Transactions on, vol. 33,
no. 6, pp. 1544–1552, Nov 1997. [Cited on p. 10].
[29] J. Faiz and J. Finch, “Aspects of design optimisation for switched reluctance
motors,” Energy Conversion, IEEE Transactions on, vol. 8, no. 4, pp. 704–713,
Dec 1993. [Cited on p. 11].
179

REFERENCES
[30] K. Koibuchi, T. Ohno, and K. Sawa, “A basic study for optimal design
of switched reluctance motor by finite element method,” Magnetics, IEEE
Transactions on, vol. 33, no. 2, pp. 2077–2080, Mar 1997. [Cited on p. 11].
[31] J. L. Beniwal and R. K. Tripathi, “Speed control of srm drives using a
new power converter configuration in electric vehicles,” in 2014 Australasian
Universities Power Engineering Conference (AUPEC), Sept 2014, pp. 1–6.
[Cited on p. 11].
[32] M. Moallem, C. M. Ong, and L. E. Unnewehr, “Effect of rotor profiles on
the torque of a switched-reluctance motor,” IEEE Transactions on Industry
Applications, vol. 28, no. 2, pp. 364–369, Mar 1992. [Cited on p. 11].
[33] T. Miller, Switched Reluctance Motors and Their Control. OUP Oxford, 1993.
[Cited on pp. 12, 57, 61].
[34] R. Krishnan, Switched Reluctance motor Drives. CRC, 2001. [Cited on pp.
14, 57, 59, 61].
[35] T. Genda and H. Dohmeki, “Characteristics of 4/2 switched reluctance motor
for a high speed drive by the excitation angle,” in Electrical Machines and
Systems, 2009. ICEMS 2009. International Conference on, Nov 2009, pp. 1–6.
[Cited on p. 15].
[36] T. Green, M. Khater, B. Williams, E. El-Shanawany, and A. Hassanein, “A
five-phase switched reluctance motor: design and performance,” in Stepper
Motors and Their Control, IEE Colloquium on, Jan 1994, pp. 7/1–7/4. [Cited
on p. 15].
[37] Y. Kido, N. Hoshi, A. Chiba, S. Ogasawara, and M. Takemoto, “Novel
switched reluctance motor drive circuit with voltage boost function without
additional reactor,” in Power Electronics and Applications (EPE 2011),
Proceedings of the 2011-14th European Conference on, Aug 2011, pp. 1–10.
[Cited on pp. 15, 16].
[38] N. Schofield, S. Long, D. Howe, and M. McClelland, “Design of a switched
reluctance machine for extended speed operation,” Industry Applications,
IEEE Transactions on, vol. 45, no. 1, pp. 116–122, Jan 2009. [Cited on p.
17].
[39] B. Bilgin, A. Emadi, and M. Krishnamurthy, “Comparative evaluation of
6/8 and 6/10 switched reluctance machines for traction application in plug-in
hybrid electric vehicles,” in 2011 IEEE International Electric Machines Drives
Conference (IEMDC), May 2011, pp. 1300–1305. [Cited on p. 18].
180

REFERENCES
[40] Z. Zhu, Z. Azar, and G. Ombach, “Influence of additional air gaps between
stator segments on cogging torque of permanent-magnet machines having
modular stators,” Magnetics, IEEE Transactions on, vol. 48, no. 6, pp.
2049–2055, June 2012. [Cited on p. 18].
[41] S.-H. Mao and M.-C. Tsai, “A novel switched reluctance motor with c-core
stators,” IEEE Transactions on Magnetics, vol. 41, no. 12, pp. 4413–4420, Dec
2005. [Cited on p. 19].
[42] E. S. Afjei and H. A. Toliyat, “A novel multilayer switched reluctance motor,”
IEEE Transactions on Energy Conversion, vol. 17, no. 2, pp. 217–221, Jun
2002. [Cited on p. 19].
[43] Y. Hu and W. Ding, “Torque ripple minimization of a novel modular stator
switched reluctance motor based on direct instantaneous torque control,” in
2016 Eleventh International Conference on Ecological Vehicles and Renewable
Energies (EVER), April 2016, pp. 1–7. [Cited on p. 19].
[44] A. Labak and N. C. Kar, “Designing and prototyping a novel five-phase
pancake-shaped axial-flux srm for electric vehicle application through dynamic
fea incorporating flux-tube modeling,” IEEE Transactions on Industry
Applications, vol. 49, no. 3, pp. 1276–1288, May 2013. [Cited on p. 20].
[45] K. Nakamura, K. Murota, and O. Ichinokura, “Characteristics of a novel
switched reluctance motor having permanent magnets between the stator
pole-tips,” in Power Electronics and Applications, 2007 European Conference
on, Sept 2007, pp. 1–5. [Cited on pp. 20, 21].
[46] M. Ehsani, K. M. Rahman, and H. A. Toliyat, “Propulsion system design of
electric and hybrid vehicles,” IEEE Transactions on Industrial Electronics,
vol. 44, no. 1, pp. 19–27, Feb 1997. [Cited on p. 21].
[47] M. Ruba and D. Fodorean, “Design, analysis and torque control of low voltage
high current srm for small automotive applications,” in EUROCON, 2013
IEEE, July 2013, pp. 1498–1503. [Cited on p. 21].
[48] J. Miller, A. Gale, P. McCleer, F. Leonardi, and J. H. Lang, “Starter-alternator
for hybrid electric vehicle: comparison of induction and variable reluctance
machines and drives,” in Industry Applications Conference, 1998. Thirty-Third
IAS Annual Meeting. The 1998 IEEE, vol. 1, Oct 1998, pp. 513–523 vol.1.
[Cited on p. 22].
[49] K. Rahman, B. Fahimi, G. Suresh, A. Rajarathnam, and M. Ehsani,
“Advantages of switched reluctance motor applications to ev and hev: design
181
REFERENCES
and control issues,” Industry Applications, IEEE Transactions on, vol. 36,
no. 1, pp. 111–121, Jan 2000. [Cited on p. 22].
[50] S. Kachapornkul, P. Jitkreeyarn, P. Somsiri, K. Tungpimolrut, A. Chiba,
and T. Fukao, “A design of 15 kw switched reluctance motor for electric
vehicle applications,” in Electrical Machines and Systems, 2007. ICEMS.
International Conference on, Oct 2007, pp. 1690–1693. [Cited on p. 22].
[51] H. Hayashi, K. Nakamura, A. Chiba, T. Fukao, K. Tungpimolrut, and
D. G. Dorrell, “Efficiency improvements of switched reluctance motors with
high-quality iron steel and enhanced conductor slot fill,” IEEE Transactions
on Energy Conversion, vol. 24, no. 4, pp. 819–825, Dec 2009. [Cited on pp.
22, 23].
[52] M. Takeno, Y. Takano, A. Chiba, N. Hoshi, M. Takemoto, and S. Ogasawara,
“A test result of a 50kw switched reluctance motor designed for a hybrid
electric vehicle,” in 2011 IEEE Power and Energy Society General Meeting,
July 2011, pp. 1–2. [Cited on pp. 22, 23].
[53] T. A. .Burress, S. L. Campbell, C. L. Coomer, C. W. Ayers, A. A. Wereszczak,
J. P. Cunningham, L. E. Seiber, and H. T. Lin, EVALUATION OF THE
2010 TOYOTA PRIUS HYBRID SYNERGY DRIVE SYSTEM, March 2011.
[Cited on p. 23].
[54] Y. Takano, M. Takeno, N. Hoshi, A. Chiba, M. Takemoto, S. Ogasawara,
and M. A. Rahman, “Design and analysis of a switched reluctance motor for
next generation hybrid vehicle without pm materials,” in Power Electronics
Conference (IPEC), 2010 International, June 2010, pp. 1801–1806. [Cited on
p. 23].
[55] T. Imakawa, K. Chimata, N. Hoshi, A. Chiba, M. Takemoto, and
S. Ogasawara, “Characteristic measurements of switched reluctance motor on
prototype electric vehicle,” in Electric Vehicle Conference (IEVC), 2012 IEEE
International, March 2012, pp. 1–8. [Cited on p. 23].
[56] M. Tanujaya, D. H. Lee, Y. J. An, and J. W. Ahn, “Design and analysis
of a novel 4/5 two-phase switched reluctance motor,” in Electrical Machines
and Systems (ICEMS), 2011 International Conference on, Aug 2011, pp. 1–6.
[Cited on pp. 23, 24].
[57] A. Chiba, Y. Takano, M. Takeno, T. Imakawa, N. Hoshi, M. Takemoto, and
S. Ogasawara, “Torque density and efficiency improvements of a switched
reluctance motor without rare-earth material for hybrid vehicles,” IEEE
Transactions on Industry Applications, vol. 47, no. 3, pp. 1240–1246, May
2011. [Cited on p. 24].
182

REFERENCES
[58] M. Takeno, S. Ogasawara, A. Chiba, M. Takemoto, and N. Hoshi,
“Power and efficiency measurements and design improvement of a 50kw
switched reluctance motor for hybrid electric vehicles,” in 2011 IEEE Energy
Conversion Congress and Exposition, Sept 2011, pp. 1495–1501. [Cited on p.
24].
[59] Y. Takano, T. Maeda, M. Takeno, A. Chiba, N. Hoshi, M. Takemoto,
S. Ogasawara, and T. Fukao, “Operating area of a switched reluctance motor
with continuous current operation,” in IEEE PES General Meeting, July 2010,
pp. 1–4. [Cited on p. 24].
[60] M. Takeno, A. Chiba, N. Hoshi, S. Ogasawara, M. Takemoto, and M. A.
Rahman, “Test results and torque improvement of the 50-kw switched
reluctance motor designed for hybrid electric vehicles,” IEEE Transactions
on Industry Applications, vol. 48, no. 4, pp. 1327–1334, July 2012. [Cited on
p. 24].
[61] K. Kiyota and A. Chiba, “Design of switched reluctance motor competitive to
60-kw ipmsm in third-generation hybrid electric vehicle,” IEEE Transactions
on Industry Applications, vol. 48, no. 6, pp. 2303–2309, Nov 2012. [Cited on
pp. 24, 25].
[62] A. Chiba, M. Takeno, N. Hoshi, M. Takemoto, S. Ogasawara, and M. A.
Rahman, “Consideration of number of series turns in switched-reluctance
traction motor competitive to hev ipmsm,” IEEE Transactions on Industry
Applications, vol. 48, no. 6, pp. 2333–2340, Nov 2012. [Cited on pp. 25, 26].
[63] R. D. van Millingen and J. D. van Millingen, “Phase shift torquemeters
for gas turbine development and monitoring,” IEEE Transactions on
Industrial Electronics, vol. 5, no. 6, pp. 2946–2959, 1991. [Online]. Available:
http://dx.doi.org/10.1115/91-GT-189 [Cited on pp. 27, 28].
[64] D. J. B. Smith, “High speed high power electrical machines,” Ph.D.
dissertation, Newcastle University, 2014. [Cited on pp. 27, 43, 46, 66].
[65] D. Gerada, A. Mebarki, N. L. Brown, C. Gerada, A. Cavagnino, and
A. Boglietti, “High-speed electrical machines: Technologies, trends, and
developments,” IEEE Transactions on Industrial Electronics, vol. 61, no. 6,
pp. 2946–2959, June 2014. [Cited on p. 28].
[66] A. Maeda and H. Tommita, “Power and speed limitation in high
speed electrical machines,” in International Power electronics Conference,
Yokohama, Japan,, Apr 1995, pp. 1321–1326. [Cited on pp. 28, 30].
183

REFERENCES
[67] M. Rahman, A. Chiba, and T. Fukao, “Super high speed electrical machines -
summary,” in Power Engineering Society General Meeting, 2004. IEEE, June
2004, pp. 1272–1275 Vol.2. [Cited on pp. 28, 30].
[68] A. Binder and T. Schneider, “High-speed inverter-fed ac drives,” in Electrical
Machines and Power Electronics, 2007. ACEMP ’07. International Aegean
Conference on, Sept 2007, pp. 9–16. [Cited on p. 29].
[69] R. R. Moghaddam, “High speed operation of electrical machines, a review
on technology, benefits and challenges,” in 2014 IEEE Energy Conversion
Congress and Exposition (ECCE), Sept 2014, pp. 5539–5546. [Cited on pp.
29, 31].
[70] A. Boglietti, A. Cavagnino, A. Tenconi, and S. Vaschetto, “Key design aspects
of electrical machines for high-speed spindle applications,” in IECON 2010 -
36th Annual Conference on IEEE Industrial Electronics Society, Nov 2010,
pp. 1735–1740. [Cited on pp. 29, 31].
[71] H. C. Lahne, O. Moros, and D. Gerling, “Design considerations when
developing a 50000 rpm high-speed high-power machine,” in 2015 17th
European Conference on Power Electronics and Applications (EPE’15
ECCE-Europe), Sept 2015, pp. 1–10. [Cited on p. 31].
[72] S. Kozuka, N. Tanabe, J. Asama, and A. Chiba, “Basic characteristics of
150,000r/min switched reluctance motor drive,” in Power and Energy Society
General Meeting - Conversion and Delivery of Electrical Energy in the 21st
Century, 2008 IEEE, July 2008, pp. 1–4. [Cited on p. 31].
[73] A. Boglietti, A. Cavagnino, A. Tenconi, and S. Vaschetto, “Key design aspects
of electrical machines for high-speed spindle applications,” in IECON 2010 -
36th Annual Conference on IEEE Industrial Electronics Society, Nov 2010,
pp. 1735–1740. [Cited on pp. 31, 45].
[74] A. V. Radun, “High power density switched reluctance motor drive
for aerospace applications,” in Conference Record of the IEEE Industry
Applications Society Annual Meeting,, Oct 1989, pp. 568–573 vol.1. [Cited
on p. 31].
[75] E. Richter and C. Ferreira, “Performance evaluation of a 250 kw switched
reluctance starter generator,” in Industry Applications Conference, 1995.
Thirtieth IAS Annual Meeting, IAS ’95., Conference Record of the 1995 IEEE,
vol. 1, Oct 1995, pp. 434–440 vol.1. [Cited on p. 32].
184

REFERENCES
[76] E. Richter, J. Lyons, C. Ferreira, A. V. Radun, and E. Ruckstadter,
“Initial testing of a 250 kw starter/generator for aircraft applications,” in
SAE Technical Paper. SAE International, 04 1994. [Online]. Available:
http://dx.doi.org/10.4271/941160 [Cited on p. 32].
[77] H. Cho and S. Jang, “A design approach to reduce rotor losses in high-speed
permanent magnet machine for turbo-compressor,” in INTERMAG 2006 -
IEEE International Magnetics Conference, May 2006, pp. 209–209. [Cited on
pp. 32, 33].
[78] S. D. Calverley, G. W. Jewell, and R. J. Saunders, “Aerodynamic losses in
switched reluctance machines,” IEE Proceedings - Electric Power Applications,
vol. 147, no. 6, pp. 443–448, Nov 2000. [Cited on p. 32].
[79] J. Kunz, S. Cheng, Y. Duan, J. Mayor, R. Harley, and T. Habetler, “Design
of a 750,000 rpm switched reluctance motor for micro machining,” in Energy
Conversion Congress and Exposition (ECCE), 2010 IEEE, Sept 2010, pp.
3986–3992. [Cited on pp. 32, 53, 63, 64, 66].
[80] A. Binder, T. Schneider, and M. Klohr, “Fixation of buried and
surface-mounted magnets in high-speed permanent-magnet synchronous
machines,” IEEE Transactions on Industry Applications, vol. 42, no. 4, pp.
1031–1037, July 2006. [Cited on p. 32].
[81] N. Bianchi, S. Bolognani, and F. Luise, “Analysis and design of a pm brushless
motor for high-speed operations,” IEEE Transactions on Energy Conversion,
vol. 20, no. 3, pp. 629–637, Sept 2005. [Cited on pp. 32, 34].
[82] ——, “Potentials and limits of high-speed pm motors,” IEEE Transactions on
Industry Applications, vol. 40, no. 6, pp. 1570–1578, Nov 2004. [Cited on p.
32].
[83] J. Dang, S. Haghbin, Y. Du, C. Bednar, H. Liles, J. Restrepo, J. Mayor,
R. Harley, and T. Habetler, “Electromagnetic design considerations for a
50,000 rpm 1kw switched reluctance machine using a flux bridge,” in Electric
Machines Drives Conference (IEMDC), 2013 IEEE International, May 2013,
pp. 325–331. [Cited on pp. 32, 66].
[84] J. Dang, J. R. Mayor, S. A. Semidey, R. G. Harley, T. G. Habetler, and
J. A. Restrepo, “Practical considerations for the design and construction of
a high-speed srm with a flux-bridge rotor,” IEEE Transactions on Industry
Applications, vol. 51, no. 6, pp. 4515–4520, Nov 2015. [Cited on p. 32].
185

REFERENCES
[85] K. Kiyota, T. Kakishima, A. Chiba, and M. A. Rahman, “Cylindrical rotor
design for acoustic noise and windage loss reduction in switched reluctance
motor for hev applications,” IEEE Transactions on Industry Applications,
vol. 52, no. 1, pp. 154–162, Jan 2016. [Cited on p. 33].
[86] M. Lafoz, P. Moreno-Torres, J. Torres, M. Blanco, and G. Navarro, “Design
methodology of a high speed switched reluctance generator drive for aircrafts,”
in 2016 18th European Conference on Power Electronics and Applications
(EPE’16 ECCE Europe), Sept 2016, pp. 1–9. [Cited on p. 34].
[87] S. M. Jang, H. W. Cho, and S. K. Choi, “Design and analysis of a
high-speed brushless dc motor for centrifugal compressor,” IEEE Transactions
on Magnetics, vol. 43, no. 6, pp. 2573–2575, June 2007. [Cited on p. 34].
[88] J.-W. Ahn, H. K. M. Khoi, and D.-H. Lee, “Design and analysis of high
speed 4/2 srms for an air-blower,” in 2010 IEEE International Symposium on
Industrial Electronics, July 2010, pp. 1242–1246. [Cited on p. 34].
[89] S. Lin, T. X. Wu, L. Zhou, F. Moslehy, J. Kapat, and L. Chow, “Modeling and
design of super high speed permanent magnet synchronous motor (pmsm),”
in 2008 IEEE National Aerospace and Electronics Conference, July 2008, pp.
41–44. [Cited on p. 35].
[90] C. Zwyssig and J. W. Kolar, “Design considerations and experimental results
of a 100 w, 500?000 rpm electrical generator,” Journal of Micromechanics
and Microengineering, vol. 16, no. 9, p. S297, 2006. [Online]. Available:
http://stacks.iop.org/0960-1317/16/i=9/a=S18 [Cited on p. 35].
[91] S. A. Long, Z. Q. Zhu, and D. Howe, “Vibration behaviour of stators of
switched reluctance motors,” IEE Proceedings - Electric Power Applications,
vol. 148, no. 3, pp. 257–264, May 2001. [Cited on p. 35].
[92] Z. Q. Zhu, S. Long, D. Howe, M. C. Tsai, M. F. Hsieh, and T. C. Chen,
“Significance of vibration modes in noise and vibration generation of switched
reluctance motors,” in Electrical Machines and Systems, 2003. ICEMS 2003.
Sixth International Conference on, vol. 2, Nov 2003, pp. 672–675 vol.2. [Cited
on p. 35].
[93] K. N. Srinivas and R. Arumugam, “Analysis and characterization of switched
reluctance motors: Part ii. flow, thermal, and vibration analyses,” IEEE
Transactions on Magnetics, vol. 41, no. 4, pp. 1321–1332, April 2005. [Cited
on p. 35].
186

REFERENCES
[94] C. Y. Wu and C. Pollock, “Analysis and reduction of vibration and acoustic
noise in the switched reluctance drive,” IEEE Transactions on Industry
Applications, vol. 31, no. 1, pp. 91–98, January 1995. [Cited on p. 35].
[95] M. N. Anwar, I. Husain, and A. V. Radun, “A comprehensive design
methodology for switched reluctance machines,” IEEE Transactions on
Industry Applications, vol. 37, no. 6, pp. 1684–1692, Nov 2001. [Cited on
p. 39].
[96] W. C. Young, R. G. Budynas, and R. J. Roark, Roark’s formulas for stress
and strain. London : McGraw-Hill, 2000. [Cited on p. 40].
[97] A. Borisavljevic, H. Polinder, and J. A. Ferreira, “On the speed limits of
permanent-magnet machines,” IEEE Transactions on Industrial Electronics,
vol. 57, no. 1, pp. 220–227, Jan 2010. [Cited on pp. 42, 98].
[98] Z. Huang and J. Fang, “Multiphysics design and optimization of high-speed
permanent-magnet electrical machines for air blower applications,” IEEE
Transactions on Industrial Electronics, vol. 63, no. 5, pp. 2766–2774, May
2016. [Cited on p. 44].
[99] J. D. Ede, Z. Q. Zhu, and D. Howe, “Rotor resonances of high-speed
permanent-magnet brushless machines,” IEEE Transactions on Industry
Applications, vol. 38, no. 6, pp. 1542–1548, Nov 2002. [Cited on p. 44].
[100] C. Zwyssig, S. D. Round, and J. W. Kolar, “An ultrahigh-speed, low power
electrical drive system,” IEEE Transactions on Industrial Electronics, vol. 55,
no. 2, pp. 577–585, Feb 2008. [Cited on p. 47].
[101] G. Genta, Dynamics of Rotating Systems. London : Springer, 2005. [Cited
on p. 49].
[102] A. Arkkio, T. Jokinen, and E. Lantto, “Induction and permanent-magnet
synchronous machines for high-speed applications,” in 2005 International
Conference on Electrical Machines and Systems, vol. 2, Sept 2005, pp. 871–876
Vol. 2. [Cited on p. 52].
[103] C. Bailey, D. M. Saban, and P. Guedes-Pinto, “Design of high-speed
direct-connected permanent-magnet motors and generators for the
petrochemical industry,” IEEE Transactions on Industry Applications,
vol. 45, no. 3, pp. 1159–1165, May 2009. [Cited on p. 52].
[104] C. Zwyssig, S. D. Round, and J. W. Kolar, “Analytical and experimental
investigation of a low torque, ultra-high speed drive system,” in Conference
Record of the 2006 IEEE Industry Applications Conference Forty-First IAS
Annual Meeting, vol. 3, Oct 2006, pp. 1507–1513. [Cited on p. 53].
187

REFERENCES
[105] T. J. E. Miller, Switched Reluctance Motors and their Control. Magna Physics
Publishing, 2011. [Cited on p. 58].
[106] N. Fulton and P. Webster, “The development and application of 2-phase
switched reluctance drives,” in Electrical Machines and Drives, 1997 Eighth
International Conference on (Conf. Publ. No. 444), Sept 1997, pp. 366–370.
[Cited on p. 60].
[107] T. J. E. M. J. R. Hendeshot Jr, Design of Brushless Permanent Magnet
Motors. Magna Physics Publishing and Clarendon Press, 2011. [Cited on p.
62].
[108] “M250 35hs data sheet,” https://www.cogent-power.com/cms-data/downloads,
accessed: 10-11-2016. [Cited on p. 68].
[109] K. Pullen, “Flywheel assembly,” Jul. 24 2014,
wO Patent App. PCT/EP2012/068,340. [Online]. Available:
https://www.google.com/patents/WO2013038027A3?cl=zh [Cited on p.
70].
[110] “Spring master wave spring washer data sheet,”
https://www.springmasters.com/sp/wave-spring-washers-3.html, accessed:
04-10-2016. [Cited on p. 80].
[111] D. J. B. Atkinson, “High power fault tolerant motors for aerospace
applications,” Ph.D. dissertation, Newcastle University, 2007. [Cited on p.
96].
[112] M. Popescu and D. G. Dorrell, “Proximity losses in the windings of high speed
brushless permanent magnet ac motors with single tooth windings and parallel
paths,” IEEE Transactions on Magnetics, vol. 49, no. 7, pp. 3913–3916, July
2013. [Cited on p. 98].
[113] P. A. Hargreaves, B. C. Mecrow, and R. Hall, “Calculation of iron loss in
electrical generators using finite-element analysis,” IEEE Transactions on
Industry Applications, vol. 48, no. 5, pp. 1460–1466, Sept 2012. [Cited on
p. 100].
[114] S. H. Won, J. Choi, and J. Lee, “Windage loss reduction of high-speed srm
using rotor magnetic saturation,” Magnetics, IEEE Transactions on, vol. 44,
no. 11, pp. 4147–4150, Nov 2008. [Cited on p. 102].
[115] K. Kiyota, T. Kakishima, and A. Chiba, “Estimation and comparison of the
windage loss of a 60 kw switched reluctance motor for hybrid electric vehicles,”
in Power Electronics Conference (IPEC-Hiroshima 2014 - ECCE-ASIA), 2014
International, May 2014, pp. 3513–3518. [Cited on pp. 102, 103].
188

REFERENCES
[116] M. F. Momen and I. Husain, “Design and performance analysis of a switched
reluctance motor for low duty cycle operation,” IEEE Transactions on
Industry Applications, vol. 41, no. 6, pp. 1612–1618, Nov 2005. [Cited on
p. 137].
[117] C. M. Spargo, B. C. Mecrow, J. D. Widmer, C. Morton, and N. J. Baker,
“Design and validation of a synchronous reluctance motor with single tooth
windings,” IEEE Transactions on Energy Conversion, vol. 30, no. 2, pp.
795–805, June 2015. [Cited on p. 150].
[118] J. D. Widmer and B. C. Mecrow, “Optimized segmental rotor switched
reluctance machines with a greater number of rotor segments than stator
slots,” IEEE Transactions on Industry Applications, vol. 49, no. 4, pp.
1491–1498, July 2013. [Cited on p. 151].
[119] J. D. Widmer, R. Martin, and B. C. Mecrow, “Optimisation of an 80kw
segmental rotor switched reluctance machine for automotive traction,” in
Electric Machines Drives Conference (IEMDC), 2013 IEEE International,
May 2013, pp. 427–433. [Cited on p. 151].
189