DESIGN OF 10 GHz NEGATIVE RESISTANCE DIELECTRIC …eprints.usm.my/30343/1/SYAZANA.pdfDESIGN OF 10...
45
DESIGN OF 10 GHz NEGATIVE RESISTANCE DIELECTRIC RESONATOR OSCILLATOR SYAZANA BASYIRAH BINTI MOHAMMAD ZAKI UNIVERSITI SAINS MALAYSIA 2015
Transcript of DESIGN OF 10 GHz NEGATIVE RESISTANCE DIELECTRIC …eprints.usm.my/30343/1/SYAZANA.pdfDESIGN OF 10...
DESIGN OF 10 GHz NEGATIVE RESISTANCE DIELECTRIC RESONATOR OSCILLATOR
SYAZANA BASYIRAH BINTI MOHAMMAD ZAKI
UNIVERSITI SAINS MALAYSIA 2015

DESIGN OF 10 GHz NEGATIVE RESISTANCE DIELECTRIC
RESONATOR OSCILLATOR
by
SYAZANA BASYIRAH BINTI MOHAMMAD ZAKI
Thesis submitted in fulfillment of the requirements
for the degree of
Master of Science
January 2015

ii
ACKNOWLEDGEMENT
In the name of ALLAH, Most Generous and Most Merciful
It is with the deepest sense of gratitude of the Almighty ALLAH who gives strength
and ability to complete this project. All good aspirations, devotions and prayers are due to
His blessing.
First and foremost, I wish to express my sincere gratitude to my supportive
supervisor,Associate Professor Dr. Mohd. Fadzil bin Ain who was instrumental in providing
guidance and supervision throughout conducting this project. His willingness to assist in my
comprehension and application of oscillator concepts is invaluable and will not be forgotten.
The completion of this dissertation would not also be the possible without a help from Mr.
Zulhaimi whom provided me with the guidance and much-needed assistance on the design
and measurement of this project every single step of the way.
This dissertation is also dedicated to all staffs at PPKEE‟s Laboratory, for giving me
chances to use test and measurement equipment at the laboratory. Not forgetting, Mr. Latip,
Mdm. Zamira, Mr.Elias and also Mr. Zubir who had offered me continuous guidance and
cooperation during the course of this project.
Special appreciations are dedicated to all lecturers at PPKEE especially Dr.
Aftanasar bin Md. Shaharas my internal examiner for giving guidanceduring my viva. I
would also like to thank Universiti Sains Malaysia for Research University (RU) grant
number RUT 854004, which supported this project. A lot of thanks to my husband,
Muhamad Akmal Rasheeq and family members especially my beloved father and mother for
their lovesand supports. Finally,a lot of appreciationsto my friend, Khairul Anuar and for
those who had been involved in this project directly and indirectly.

iii
TABLE OF CONTENTS
ACKNOWLEDGEMENT ........................................................................................................... ii
TABLE OF CONTENTS ........................................................................................................... iii
LIST OF FIGURES .................................................................................................................. viii
LIST OF TABLES ..................................................................................................................... xii
LIST OF ABBREVIATIONS .................................................................................................. xiii
LIST OF SYMBOLS ..................................................................................................................xv
ABSTRAK ................................................................................................................................ xvii
ABSTRACT ............................................................................................................................... xix
CHAPTER 1: INTRODUCTION
1.2 Problem Statement .............................................................................................................2
1.3 Objectives ..........................................................................................................................3
1.4 Scope of Research ..............................................................................................................3
1.5 Dissertation Organization ..................................................................................................5
CHAPTER 2: THEORETICAL BACKGROUND AND LITERATURE REVIEW
2.1 Overview ............................................................................................................................7
2.2 Theoretical Background .....................................................................................................7
2.2.1 Microwave Oscillator ...................................................................................................7
2.2.2 Characteristics of an Oscillator .....................................................................................8
2.2.3 High Frequency Oscillator Design .............................................................................11
2.2.3.1 Negative Resistance Oscillator ............................................................................16
2.2.4 Requirement for Oscillator Design .............................................................................19
2.3 Dielectric Resonator ........................................................................................................20
2.3.1 Types of Resonator .....................................................................................................20
iv
2.3.2 Theory of Dielectric Resonator ..................................................................................22
2.3.2.1 Electric and Magnetic Field Patterns ...................................................................24
2.3.2.2 Resonant Frequency .............................................................................................24
2.3.2.3 Mode of Operation ...............................................................................................25
2.3.2.4 Coupling Method .................................................................................................25
2.3.2.5 Coupling Coefficient ...........................................................................................26
2.3.2.6 Quality Factor ......................................................................................................28
2.3.2.7 Tuning Method ....................................................................................................29
2.3.3 Configurations of Dielectric Resonator ......................................................................30
2.4 Dielectric Resonator Oscillator ........................................................................................34
2.4.1 Characteristics of Dielectric Resonator Oscillator .....................................................35
2.4.2 Configuration of Dielectric Resonator Oscillator .......................................................36
2.4.3 Limitations of Dielectric Resonator Oscillator ...........................................................38
2.4.3.1 Phase Noise ..........................................................................................................38
2.4.3.2 Other Sources of Phase Noise ..............................................................................40
2.4.4 Design Consideration of a Low Phase Noise DRO ....................................................41
2.4.5 Choice of Active Device.............................................................................................42
2.4.6 Characteristic of Dielectric Material for Dielectric Resonator ...................................43
2.5 Theoretical Background of Series Feedback DRO ..........................................................44
2.6 Literature Review of Series Feedback DRO ....................................................................44
2.6.1 Design of a 5.305 GHz DRO with Simulation and Optimization ..............................44
2.6.2 The Design of the Ku band DRO ...............................................................................46
2.6.3 Design of 5.8 GHz DRO Applied in Electronic Toll Collection ................................47
2.6.4 DRO Design and Realization at 4.25 GHz .................................................................50
2.7 Theoretical Background of Push-Push Oscillator ............................................................53
2.8 Literature Review of Push-Push DRO .............................................................................53
2.8.1 K-Band Push-Push Oscillator Using DR ....................................................................54
2.8.2 Design of a K-Band Push-Push DRO .........................................................................56

v
2.8.3 17.4 GHz Push-Push DRO .........................................................................................57
2.8.4 K-Band Harmonic DRO Using Parallel Feedback Structure .....................................59
2.8.5 Push-Push DRO Substrate Integrated Waveguide Power Combiner ..........................61
2.9 The Differences between Dual Transistors Negative Resistance and Push-Push DRO ..63
CHAPTER 3: DESIGN METHODOLOGY
3.1 Overview ..........................................................................................................................65
3.2 Flow Chart .......................................................................................................................65
3.3 Negative Resistance DRO Design ...................................................................................67
3.4 Simulation and Result ......................................................................................................67
3.5 Modeling of Dielectric Resonator Oscillator Circuit .......................................................71
3.5.1 Resonators ..................................................................................................................72
3.5.2 Active Devices ............................................................................................................73
3.5.3 Designing an Oscillator ..............................................................................................75
3.5.4 Simulator ....................................................................................................................76
3.6 Modeling of Dielectric Resonator ....................................................................................78
3.6.1 Parameter of Dielectric Resonator ..............................................................................78
3.6.2 Modeling of the Dielectric Resonator in ADS ...........................................................82
3.6.3 Modeling Dielectric Resonator in CST ......................................................................84
3.7 Modeling of Dielectric Resonator Oscillator ..................................................................86
3.7.1 Radio Frequency Choke Network ..............................................................................86
3.7.2 Determination of Output Matching ............................................................................91
3.7.3 Power Supply Biasing ................................................................................................99
3.7.4 Basic Design Schematic of Negative Resistance DRO ............................................101
3.8 Fabrication, Testing and Measurement ..........................................................................103
3.8.1 Metal Casing .............................................................................................................104
3.8.2 Oscillation Frequency, Output Power and Phase Noise Measurement ....................107
vi
CHAPTER 4: RESULTS AND DISCUSSION
4.1 Introduction ....................................................................................................................109
4.2 CST MWS and ADS Simulation Results ......................................................................109
4.2.1 Simulation Results of Dielectric Resonator Model in CST MWS ...........................110
4.2.2 Simulation Results of Dielectric Resonator Model in ADS .....................................111
4.3 Dielectric Resonator Measurement ................................................................................111
4.3.1 Dielectric Resonator Measurement Result ...............................................................111
4.4 Analysis of the Single and Dual Transistors Negative Resistance DRO .......................113
4.5 Simulation Result of Single Transistor Negative Resistance DRO ...............................117
4.6 Simulation Result of Dual Transistors Negative Resistance DRO ................................120
4.7 Measurement Results .....................................................................................................121
4.7.1 Measurement Result of Single Transistor Negative Resistance DRO ......................121
4.7.2 Measurement Result of Dual Transistors Negative Resistance DRO .......................123
4.8 Discussion ......................................................................................................................125
CHAPTER 5:CONCLUSION AND RECOMMENDATION
5.1 Conclusion .....................................................................................................................130
5.2 Contribution ...................................................................................................................133
5.3 Recommendations for Future Work ..............................................................................134
REFERENCES..........................................................................................................................137
LIST OF PUBLICATION ........................................................................................................140
APPENDIX A:DATASHEET OF E2000 SERIES DIELECTRIC RESONATOR
APPENDIX B: DATASHEET OF ATF-36077
APPENDIX C: ALUMINIUM METAL CASING TECHNICAL DRAWING
APPENDIX D: SMA CONNECTOR, RFI SUPPRESSION FILTER AND SMA
CONNECTOR TECHNICAL DATASHEET
APPENDIX E:DATASHEET OF RO4000 SEREIS LAMINATES

vii
APPENDIX F: LAYOUT OF SINGLE AND DUAL TRANSISTORS NEGATIVE
RESISTANCE DRO
APPENDIX G: STEP OF PHASE NOISE MEASUREMENT
APPENDIX H: WILKINSON POWER DIVIDER
APPENDIX I: STEPS OF MODELING DIELECTRIC RESONATOR OSCILLATOR
APPENDIX J: GAP ANALYSIS
APPENDIX K: MEASUREMENT OF FREQUENCY PULLING
APPENDIX L: CALCULATION OF RLC VALUE IN DIELECTRIC RESONATOR
viii
LIST OF FIGURES
Figure 2.1: Circuit for a two-port transistor oscillator ..................................................................13
Figure 2.2: General oscillator circuit ............................................................................................18
Figure 2.3: Geometry of a DR coupled to a microstrip line and the equivalent circuit ...............26
Figure 2.4: Graph of coupling coefficient against distance from the center of the puck to the
center of the microstrip line .....................................................................................28
Figure 2.5: Equivalent circuit of the DR .......................................................................................29
Figure 2.6: A mechanical tuning arrangement for DROs .............................................................30
Figure 2.7: Parallel configuration (bandpass) of DR. ...................................................................31
Figure 2.8: Series configuration (bandstop) of DR. ......................................................................31
Figure 2.9: Graph of S21 (dB) against frequency (Ain, 2006). ......................................................33
Figure 2.10: Series feedback DR oscillator. .................................................................................37
Figure 2.11: Parallel feedback DR oscillator. ...............................................................................37
Figure 2.12: Signal and noise spectrum of an oscillator ...............................................................40
Figure 2.13: Nonlinear model for the DRO (Wan, 2008). ............................................................45
Figure 2.14: (a) Design of the DRO, (b) 3D model of DR coupling in CST (Guoguang,
2008). ........................................................................................................................46
Figure 2.15: DRO model in ADS (Guoguang, 2008). ..................................................................47
Figure 2.16: Magnitude of S11 (upper), magnitude of S22 (middle) and .......................................48
stability factor (lower) of Agilent-ATF13786 with 145°open stub line (Bing et al., 2009). ........48
Figure 2.18: Nonlinear simulation results. (a) Output spectrum (15.7dB at harmonic index1),
(b) phase noise (-98.7dBc/Hz @100kHz offset ) (Bing et al., 2009). .......................50
Figure 2.19: Magnitudes of S11 an S21 (Ugurlu, 2011)..................................................................51
Figure 2.20: Angles of S11 an S21 (Ugurlu, 2011). ........................................................................52
Figure 2.21: Basic concept of push-push oscillator (Tanaka and Aikawa, 2009). ........................53
Figure 2.22: Schematic circuit of the push-push oscillator using DR (Tanaka and Aikawa,
2009). ........................................................................................................................55

ix
Figure 2.23: Combined circuit (Han-li et al., 2012). ....................................................................56
Figure 2.24: Circuit configuration of a single series feedback DRO (Qing et al., 2010). ............57
Figure 2.25: Block diagram of a push-push DRO configuration (Qing et al., 2010). ..................58
Figure 2.26: Simulation schematic of push-push DRO (Qing et al., 2010). .................................59
Figure 2.27: The coupling structure of DR and two microstrip lines. (a) Coupling circuit, (b)
equivalent circuit (Du et al., 2012). ..........................................................................59
Figure 2.28: Simplified structure of the harmonic frequency oscillator. (a) Simplified
structure, (b) circuit used lump model (Du et al., 2012). ..........................................60
Figure 2.29: The configuration of push-push DRO (Su et al., 2012). ..........................................62
Figure 2.30: The configuration of SIW T-junction power combiner (Su et al., 2012). ................62
Figure 3.1: Flow Chart. .................................................................................................................66
Figure 3.2: Electrical model of DR. ..............................................................................................67
Figure 3.3: Series feedback type of DR. .......................................................................................68
Figure 3.4: Simulation result of DR series feedback type. ...........................................................68
Figure 3.5: A block diagram of negative resistance DRO. ...........................................................76
Figure 3.6: Front page menus of (a) ADS and (b) CST Microwave Studio. ................................77
Figure 3.7: A diagram of 3-dimensional microstrip line of DR. ...................................................77
Figure 3.8: DR coupled to a microstrip line and the equivalent circuit. .......................................78
Figure 3.9: (a) Parameters in DR calculator software, Temex Ceramics, (b) the generated
value of the RLC components. ..................................................................................80
Figure 3.10: A diagram of DR coupled model. (a) Parallel coupled, (b) series coupled. .............82
Figure 3.11: The modeling of DR in ADS. (a) Parallel coupled, (b) series coupled. ...................83
Figure 3.12: The view of DR design in CST MWS. (a) Front view, (b) cross-sectional view. ....85
Figure 3.13: A 3-dimensional structure of DR design in CST MWS (CST, 2013). .....................85
Figure 3.14: Parallel feedback DR in CST MWS with two ports and via holes. ..........................86
Figure 3.15: Typical microwave oscillator circuit (Ain, 2003). ...................................................87
Figure 3.16: RF choke network model (Mahyuddin and Latif, 2013). .........................................88
Figure 3.17: Dimension of radial stub. .........................................................................................89

x
Figure 3.18: Schematic of RF choke network with quarter wavelength in ADS. .........................89
Figure 3.19: The stub in DRO schematic designed in ADS. ........................................................91
Figure 3.20: The stability circle of ATF-36077 at 10 GHz. .........................................................94
Figure 3.21: The input and output matching network. ..................................................................94
Figure 3.22: Selecting Гin from the Smith Chart. ..........................................................................96
Figure 3.23: Output matching of negative resistance DRO on the Smith Chart. ..........................98
Figure 3.24: Single-supply source biasing for pHEMT (Ain and Hassan, 2011). ......................100
Figure 3.25: A schematic diagram of a single transistor 10 GHz negative resistance DRO
using stub output matching with DR data file imported into ADS from CST
MWS. .....................................................................................................................102
Figure 3.26: Simulation result of a single transistor 10 GHz negative resistance DRO. ............103
Figure 3.27: The fabricated single transistor negative resistance DRO for testing and
measurement process. ............................................................................................104
Figure 3.28: The E4405B ESA-E Series Spectrum Analyzer (Agilent). ....................................106
Figure 3.29: A measurement construction setup and the image of the hardware during the
measurement process. ............................................................................................107
Figure 3.30: Oscillation frequency, output power and phase noise measurement. (a)
Oscillator spectrum, (b) single-sideband phase noise log plot. .............................108
Figure 4.1: S-parameters simulation result for 2-ports DR model in CST MWS. ......................110
Figure 4.2: 2-ports S-parameters DR model simulation result in ADS. .....................................111
Figure 4.3: The image of 2-ports DR measured by using the network analyzer. .......................112
Figure 4.4: 2-ports S-parameter measurement result of DR model in ADS. ..............................112
Figure 4.5: The single transistor schematic design of negative resistance DRO in ADS. ..........115
Figure 4.6: The simulation result of single transistor negative resistance DRO. ........................116
Figure 4.7: The phase noise simulation result of single transistor negative resistance DRO. ....116
Figure 4.8: The dual transistors schematic design of negative resistance DRO in ADS. ...........118
Figure 4.9: The simulation result of dual transistors negative resistance DRO. .........................119
Figure 4.10: The phase noise simulation result of dual transistors negative resistance DRO. ...119

xi
Figure 4.11: Spectrum analyzer image of single transistor negative resistance DRO; (a)
Oscillation frequency and output power, (b) phase noise. ...................................122
Figure 4.12: Single transistor negative resistance DRO comparison between simulation and
measurement. .........................................................................................................123
Figure 4.13: Spectrum analyzer image of dual transistors negative resistance DRO;
(a) Oscillation frequency and output power, (b) phase noise. ...............................124
Figure 4.14: Dual transistors negative resistance DRO comparison between simulation and
measurement. .........................................................................................................125

xii
LIST OF TABLES
Table 3.1: S-parameter of ATF-26884 with VDS of 3 V and IDS of 10 mA at frequency of 10
GHz. ............................................................................................................................73
Table 3.2: S-parameter of ATF-26884 with VDS of 3 V and IDS of 30 mA at frequency of 10
GHz. ............................................................................................................................74
Table 3.3: S-parameter of ATF-36077 with of VDS 1.5 V and IDS of 10 mA at frequency of 10
GHz. ............................................................................................................................74
Table 3.4: Parameters of Duroid substrate (Rogers RO4003C) in CST MWS. ............................77
Table 3.5: The parameter of DR model at 10 GHz. ......................................................................81
Table 4.1: The comparison of 2-ports DR between simulation results in CST MWS and
ADS, and measurement. ..........................................................................................113

xiii
LIST OF ABBREVIATIONS
2D Two dimensional
3D Three dimensional
AC Alternating current
ADS Advanced Design System
Af Loop gain
AGC Automatic gain control
BNC Bayonet Neill Concelman
CST MWS Computer Simulation Technology Microwave Studio
DBS Direct broadcast satellite
DC Direct current
DR Dielectric resonator
DRO Dielectric resonator oscillator
DRs Dielectric resonators
EM Electromagnetic
F Noise factor
FET Field effect transistor
FM Frequency modulation
GaAs Gallium Arsenide
HBT Heterojunction bipolar transistor
HE Hybrid electric
HEMT High electron mobility transistor
HF High frequency
HM Hybrid magnetic
IL Insertion loss

xiv
IMPATT Impact avalanche and transit time
LC Lumped component
MESFET Metal semiconductor field effect transistor
MIC Microwave integrated circuit
MOSFET Metal oxide semiconductor field effect transistor
PCB Printed circuit board
PHEMT Pseudomorphic high electron mobility transistor
PIN Positive Intrinsic Negative
Q Quality factor
QL Loaded quality factor
Qu Unloaded quality factor
RF Radio frequency
RFC Radio frequency choke
RFI Radio frequency interference
RLC Resistor inductor capacitor
S/N Signal to Noise ratio
SiGe Silicon germanium
SMA Sub-Miniature version A
SWR Standing wave ratio
TE Transverse electric
TEM Transverse electric and magnetic mode
TM Transverse magnetic
VSWR Voltage standing wave ratio
WPD Wilkinson power divider

xv
LIST OF SYMBOLS
0Z Characteristic impedance
Conductivity
eff Effective dielectric constant
outX Imaginary part of output impedance
in Input reflection coefficient
L Load reflection coefficient
out Output reflection coefficient
Permeability
outR Real part of output impedance
TZ Terminating impedance
T Terminating reflection coefficient
Wavelength
g Wavelength in waveguide
∂ Delta
°C Degree celcius
µm Micrometer
Al2 O3 Aluminium oxide
c Speed of light
dB Decibel
dBc/Hz Decibels below the carrier level in a specified bandwidth of 1
Hz

xvi
dBm Decibel with power reference to 1 mW
f Frequency
F Farad
GHz Gigahertz
K Stability factor
kHz Kilohertz
mA Miliampere
MHz Megahertz
MHz/volt Megahert per Volt
mm Millimeter
nH Nanohenry
pF Picofarad
ppm/°C Temperature coefficient
V Volt
Zr Sn Ti O Zirconium tin titanium oxide
β Coupling coefficient
Ω Ohm
xvii
REKABENTUK PENGAYUN PENYALUN DIELEKTRIK RINTANGAN NEGATIF 10
GHz
ABSTRAK
Pasaran komunikasi wayarles telah mengalami pertumbuhan yang luar biasa dan
memandangkan bilangan pengguna wayarles dan jumlah gangguan RF terus meningkat,
piawaian komunikasi moden memerlukan hingar fasa berprestasi unggul daripada pengayun
tempatan dalam pemancar dan penerima. Hingar adalah salah satu perkara utama dalam
pengayun kerana walaupun sedikit, hingar fasa di dalam pengayun membawa kepada perubahan
dramatik dalam spektrum frekuensi dan ciri-ciri masanya. Secara umumnya, hingar fasa sesuatu
pengayun ini menentukan keupayaan sistem komunikasi secara menyeluruh. Reka bentuk
pengayun berhingar fasa rendah menghadapi banyak kekangan pada frekuensi gelombang mikro
dan gelombang milimeter. Faktor utama yang membatasi reka bentuk pengayun berhingar fasa
rendah pada frekuensi ini adalah penyalun yang faktor kualitinya rendah disebabkan oleh
konduktor tinggi dan kehilangan dielektrik. Oleh itu, pada masa kini, DROs digunakan secara
meluas di dalam sistem gelombang mikro dan gelombang milimeter. Disertasi ini memberi
penekanan kepada kesan menggunakan dwi transistor ke atas frekuensi, kuasa keluaran dan
hingar fasa dalam reka bentuk DRO rintangan negatif pada 10 GHz. DRO terdiri daripada siri
E2000 bahan jenis penyalun cakera berdiameter 5.1 mm dari Temex Ceramics, GaAs ATF-
36077 PHEMT dari Agilent dan Rogers RO4003C PCB dengan pemalar dielektrik sebanyak
3.38 dan ketebalan sebanyak 0.813 mm. Keunikan hasil kerja ini berbanding dengan yang lain
adalah transistor dwi rintangan negatif DRO telah direka menggunakan ADS dengan bantuan
teknik WPD untuk membahagi dan menggabungkan dua sub-pengayun bagi mencapai kuasa
keluaran yang tinggi dan hingar fasa yang rendah. Hasil simulasi DR menggunakan CST MWS
telah menghasilkan frekuensi salunan sebanyak 11.255GHz dan menjana kerugian kemasukan
sebanyak 1.1918 dB. Hasil simulasi bagi litar skematik transistor dwi rintangan negatif DRO
dalam ADS telah menghasilkan frekuensi ayunan sebanyak 10.61 GHz pada kuasa keluaran

xviii
sebanyak -58.698 dBm dan hingar fasa sebanyak -103.440 dBc/Hz. Hasil pengukuran
mempamerkan frekuensi ayunan sebanyak 11.79805 GHz pada kuasa keluaran sebanyak -1.8
dBm dan hingar fasa sebanyak -81.03 dBc/Hz. Pelaksanaan transistor dwi rintangan negatif
DRO telah dibuktikan dalam meningkatkan kuasa keluaran dan mengurangkan hingar fasa
berbanding dengan satu transistor rintangan negative DRO. Sebuah bekas logam telah digunakan
bagi mengurangkan kemungkinan mana-mana sumber hingar. Oleh itu, sebuah perkakas
transistor dwi rintangan negatif DRO telah berjaya dihasilkan dengan hingar fasa rendah dan
kuasa keluaran lebih tinggi pada frekuensi ayunan kira-kira, 10 GHz.

xix
DESIGN OF 10 GHz NEGATIVE RESISTANCE DIELECTRIC RESONATOR
OSCILLATOR
ABSTRACT
The wireless communication market has been experiencing tremendous growth and
since the number of wireless subscribers and the amount of RF interference continue to increase,
modern communication standards demand excellent phase noise performance from local
oscillators in transceivers. Noise is one of major concern in oscillators because even a small
amount of noise in an oscillator leads to dramatic changes in its frequency spectrum and timing
properties. In general, an oscillator‟s phase noise determines the overall communication
system‟s capability. The design of low phase noise oscillators faces many challenges at
microwave and millimeter-wave frequencies. The main limiting factor in designing low phase
noise oscillators at these frequencies is the low quality factor of resonators due to high conductor
and dielectric losses. Therefore, in current microwave and millimeter-wave systems, DROs are
widely employed. This dissertation emphasized on the effect of using dual transistors towards
the oscillation frequency, output power and phase noise in the design of negative resistance
DRO at 10 GHz. The DRO consists of E2000 series material disc type resonator with a diameter
of 5.1 mm from Temex Ceramics, ATF-36077 GaAs pHEMT from Agilent and the Rogers
RO4003C PCB with dielectric constant of 3.38 and 0.813 mm thickness. The uniqueness of this
work compared to others was the dual transistors negative resistance DRO was designed in ADS
with the help of WPD techniqueto divide and combine two sub-oscillators in order to achieve
higher output power and low phase noise. Since a phase noise exhibited by a 10 GHz DRO in
the current market is between -110 dBc/Hz and -120 dBc/Hz, a metal housing was implemented
to reduce any possible of noises by preventing the output power from being lost in the radiated
fields. The DR simulation result by using CST MWS produced a resonant frequency of 11.255
GHz and generating an insertion loss of 1.1918 dB. The simulation result for dual transistors
negative resistance DRO schematic circuit in ADS produced an oscillation frequency of

xx
10.61GHz at output power of-58.698 dBm and a phase noise of-103.440 dBc/Hz. The
measurement result exhibited an oscillation frequency of 11.79805 GHz at output power of -1.8
dBm and a phase noise of-81.03 dBc/Hz. The implementation of dual transistors negative
resistance DRO was provento enhance the output power and lower the phase noise compared to
single transistor negative resistance DRO. Therefore, the dual transistors negative resistance
DRO hardware was successfully produced with lower phase noise and higher output power at an
oscillation frequency approximately 10 GHz.

1
CHAPTER 1
INTRODUCTION
1.1 Overview
For the last few decades, a revolution in the wireless communication had been grown
where there is a need for several of wireless solutions to take over the common wired systems.
The needs of these systems in our daily lives have forced system designers to come up with
products which can deliver higher performance at lower costs. Lower power consumption and
reduced size are other design goals being aggressively pursued because of the demand to reduce
the cost and power consumption by 30% every year (Razavi, 1996).
Oscillator is a basic fundamental system block in every wireless or wired product which
represents microwave energy source for most of all microwave systems including radars,
communications, navigation or electronic warfare. A typical microwave oscillator consists of an
active device (a diode or a transistor) and a passive frequency-determining resonant element.
With the rapid advancement of technology, there has been an increasing need for better
performance. The emphasize has been done on low noise, small size, low cost, high efficiency,
high temperature stability and reliability. Another important parameter that has been investigated
in oscillator design is the phase noise, apart from the cost, size and power consumption.
The dielectric resonator oscillator (DRO) presents an interesting solution for fixed-
frequency or narrowband tunable applications. A transistor DRO has become the most desirable
choice in a vast number of fixed-frequency microwave signal source applications. It can be
realized using either silicon Bipolar Junction Transistor (BJT) or Gallium Arsenide Field Effect
Transistor (GaAs FET) devices.Asilicon BJT is generally selected for lower phase noise
characteristics, while the GaAs FET is required for higher frequencies (GED, 2013). For
thesilicon BJT DRO, the maximum oscillation frequency can be reached 20 GHz while for a

2
GaAs FET DRO can be reached up to 100 GHz. But, in terms of phase noise, the silicon BJT
DRO offers lower phase noise (6 to 10 dB less FM noise, very close to the carrier) rather than a
GaAs FET DRO which capable of operation at 10 GHz and beyond producing an output power
in excess of +10 dBm.
A variety of microwave components which employs dielectric resonators (DRs) have
been developed during the past few years, due to the availability of low-cost, temperature-stable
and high permittivity materials. Due to their excellent integrability in MIC circuits, DRs can be
used directly as the frequency-determining element for realizing a stable microwave frequency
source. The primary characteristics of the ceramic material for the DRs are the quality factor,
temperature coefficient of the resonant frequency, and dielectric constant. Hence, they become a
preferable choice in many fixed-frequency receiver/transmitter local oscillator applications.
1.2 Problem Statement
The design of a negative resistance DRO is emphasized on lower noise, smaller size,
lower cost, higher efficiency, higher temperature stability, and improved reliability in order to
achieve better performance. A mechanically tuned of a negative resistance DRO which oscillates
close to desired oscillation frequency10 GHz was proposed.
A negative resistance DRO configuration design is the relative ease of coupling to a
single line, compared to the parallel feedback DRO‟s configuration design which is double line
coupling. However, the single line must have higher gain because of the coupling from the
resonator to the microstrip line is not so strong, which includes that the source cannot be
connected directly to the ground potential.A negative resistance DRO must have higher gain in
order to allow significant coupling from the resonator to the microstrip line, which then resulting
in a higher loaded Q factor, lower phase noise and exhibit excellent performance. The
configuration of negative resistance DRO with a single microstrip line can be easily

3
implemented, but typically does not have a tuning range as wide as that obtained with parallel
feedback.
Critical to the performance of the negative resistance DROcircuit is the placement of the
DR on the gate port, where it is isolated from the output circuitsby the very low drain to gate
capacitance inherent in the device. The isolation minimizes interaction between the output and
input ports, which allows the resonator to be lightly coupled to the gate, resulting in a very high
loaded Q, and therefore minimum phase noise. This limitation can be improved by adding
another microstrip line into the design of the negative resistance DRO which will look like a
parallel feedback DRO. A high Q resonator is placed between two parallel microstrip lines
which is connected between the drain and gate terminals of FET.
Phase noise also contributes as one of the limiting factor in DRO performance which is
dependent upon the amount of output power delivered to the load. In other words, phase noise
can be lowered by enhancing the output power. Two identical circuits of negative resistance
DRO are combined using single DR to improve the RF output power.
1.3 Objectives
Main objectives of this research are stated as follows:
1. To designand develop single anddual negative resistance DROsthat uses a single DR.
2. To fabricate, test, measure and compare the performance of single and dual negative
resistance DROs in terms of oscillation frequency, output power and phase noise.
1.4 Scope of Research
Since DROs cover wide fields, the scope range will be narrowed and focused on specific
aim. The scope of this dissertation will cover all objectives, focusing on designing a negative
resistance DRO which oscillates at 10 GHz and exhibits excellent performance (low phase

4
noiseand high output power).Therefore, parallel feedback DRO topic will not be discussed in
this dissertation.
Negative resistance DRO suffers limitations in the frequency range for accurate
measurements. The coupling reaches its peak value at higher frequencies for a given microstrip
line resulting in excessive loading to the resonator and thus lowered the value of Q. In this
frequency range, the measurement of the dielectric properties loses its accuracy because the
lowered Q values means inaccuracies in determining the resonant frequencies.
Frequency stability of negative resistance DRO is much better compared to the other
free running oscillators but still not as good as the frequency stability of phase-locked
oscillators. However, the DRO is more suitable to be applied in this research because of its
characteristics such as small size and low cost although it contains a slightly lesser stability
specification, but still acceptable.
Another factor that limits the DRO from obtaining the accurate measurement is
mechanical tuning bandwidth. The bandwidth is typically tuned to 0.2% of the center frequency
but for DRO, it can only be increased up to 3% of center frequency for special applications.
Phase noise also contributes as one of the limiting factor of DRO performance but can be
improved by implementing the theory analyzed by (Everard, 2001).
A 3D EM model of DR was implemented in the CST MWS to undergo the simulation
process. The model was exported to the schematic design of single and dual negative resistance
DROs in ADS and simulated to obtain expected result. The simulation and measurement result
which contain the result of oscillation frequency (GHz), output power (dBm) and phase noise
(dBc/Hz) were then compared between single and dual negative resistance DRO design. The
dual negative resistance DRO design was chosen to be the final design as it was assumed to
produce good performance rather than single negative resistance DRO.

5
In the measurement process, the oscillation frequency, output power and phase noise of
the oscillator circuit will be measured by a spectrum analyzer, observed, and recorded.
Environmental effects might be the major factor that limits the accurate measurement which can
be reduced with the help of metal casing since it can block the excessive noise.
The effect of frequency pulling also was not discussed as there was no significant
change in output frequency that could justify the effect of frequency pulling.The effects of
implementing single transistor and dual transistors towards oscillation frequency, output power
and phase noise have been discussed further in the discussion.
1.5 Dissertation Organization
This dissertation was organized into five main chapters. Chapter 1 began with the
general overview of an oscillator and proceeded with a DR and a DRO, problem statement,
objectives, scope of research and dissertation organization.
Chapter 2 covers the literature review, which is related mostly to the DRO design. In
this chapter, theoretical background of microwave oscillator, negative resistance oscillator,
feedback oscillator, DR, DRO and WPD are presented. There are also reviews about the
coupling of DR and previous published works on the negative resistance DRO are presented.
Chapter 3 discusses the methodology of this research, which has been employed in order
to complete the negative resistance DRO design. The DR is modeled in Computer Simulation
Technology Microwave Studio (CST MWS) and also the modeling of a DRO circuit is
presented. The modeling of other parts of the negative resistance DRO such as DC bias circuit,
RF choke network and the integration of all related parts into a complete negative resistance
DRO is presented. The fabrication and measurement process is also discussed in this chapter.
6
Chapter 4 focuses on the results, which have been obtained from the simulation and
measurement results of a dual transistors negative resistance DRO. The simulation results
obtained are compared with the measurement results in order to analyze factors that affected the
results differences. Brief analysis based on the comparisons is discussed in this chapter.
Finally, Chapter 5 contains conclusion based on the experimental results. The
contributions of this research are clearly highlighted. Some recommendations for future works
are suggested at the end of this chapter in order to improve the oscillator design for future
innovations.

7
CHAPTER 2
THEORETICAL BACKGROUND AND LITERATURE REVIEW
2.1 Overview
This chapter evolves towards the overview of the research for designing a negative
resistance DROat 10 GHz. Here, the theoretical background has been divided into several
sections which include topics and subtopics in detail. In order to achieve objectivesin this
dissertation, the theoretical background part is focused mainly on microwave oscillator, negative
resistance oscillator, dielectric resonator (DR), and dielectric resonator oscillator (DRO) where
the theories and concepts such as characteristics, principle of operation, various oscillators‟
configuration, and performance have been studied. Furthermore, the related parameters such as
the quality factor, coupling coefficient and phase noise also have been discussed in the subtopics
while in literature review part, published research that related or similar to this dissertation will
be reviewed and summarized.Some ideas and understanding on the design of negative resistance
DRO at 10 GHz can be realized in terms of its operation, performance, limitations and
suggestion to improve those designs.
2.2 Theoretical Background
2.2.1 Microwave Oscillator
Oscillator is an essential and fundamental system block in every wireless or wired
product(Butt et al., 2009). Hence, it becomes a logical choice for many fixed-frequency
receiver/transmitter local oscillator applications (Pavio and Smith, 1985). It functions as a signal
generator in a transmitter while the local oscillator in a receiver is used together with a mixer to
convert the received RF signal to an IF signal. The oscillator can be modulated by a low
frequency analog or digital signal, where its signal serves as a carrier and the modulating low
frequency signal is the information to be transmitted (Mahyuddin, 2006).

8
When designing an oscillator, characteristics such as good power output, high dc to RF
efficiency, low noise, good stability and good frequency tenability are indispensable
(Mahyuddin, 2006). The design goals have a significant impact on development of oscillator
technology. Apart from the cost, size and power consumption, another important parameter that
have been actively investigated in oscillator design is the phase noise. Oscillator phase noise can
be effectively reduced by incorporating high-Q resonators (Butt et al., 2009).
Oscillators represent the basic microwave energy source for all microwave systems such
as radars, communications, navigation, electronic warfare missile(Wan, 2008). A typical
microwave oscillator consists of an active device (a diode or a transistor) and a passive
frequency-determining resonant element.
All microwave oscillators are designed by adding resonating elements (L, C, or R) in
various configurations to different ports of a transistor. These elements generate a negative
resistance at a certain resonant frequency and set the device into oscillation. In the case of a
DRO, the resonating element is the DR, which can be modeled electrically as an L, C, R network
(MITEQ, 2013).
2.2.2 Characteristics of an Oscillator
Recently, wireless communication services have been developed rapidly. Microwave
oscillators are very important components in these high frequency systems where the higher
frequency signals are required to carry the information and to transmit huge amount of
information (Tanaka and Aikawa, 2009, Han-li et al., 2012).
There are several parameters or characteristics which are essential in part of an
oscillator. The major aspects that have to be analyzed are the output power, operating frequency
and tuning range, efficiency, stability, noise, phase noise, harmonic suppression, frequency

9
stability, quality factor, frequency jumping, pushing and pulling, and spurious outputs. One of
the characteristics of an oscillator is the output power which is defined as continuous power
generated by an oscillator in watts or milliwatts for continuous wave operation and the peak
power or average power generated by an oscillator for pulse operation.
Operating frequency and tuning range are a fixed output frequency or a tunable output
frequency range which is used either mechanically or electronically tunable oscillator. The
frequency range is determined by the architecture of the oscillator. Tuning for an oscillator can
be divided into several categories, which are post-tuning drift, tuning linearity, tuning sensitivity,
tuning performance and tuning speed.Stability is the ability of an oscillator to return to the
original operating point after experiencing a slight electrical or mechanical disturbance which
refers to both short term and long term stability. The oscillator should be clean in the sense that
it does not pick up unwanted signals and noise in the circuit (Mahyuddin, 2006).
Another important characteristic of an oscillator is its noise comprised of amplitude
modulation noise or amplitude variations of the output signal, FM noise, unwanted frequency
variations and phase noise or phase variations. Various noise sources contribute to oscillator
noise including the loss of the resonator, the noise sources inside the transistor; noise modulated
on the power supply and the noise contributions from the tuning diodes. FM noise is usually
measured at about 100 kHz from the carrier in unit of dBc, which means decibels below the
carrier level, in a specified bandwidth of 1 Hz. The various noise sources in and outside of the
transistor modulate the oscillator, resulting the energy or spectral distribution on both sides of
the carrier. Another type of noise that describes an oscillator is a harmonic suppression. The
oscillator has a typical harmonic suppression of more than 15 dB. For high performance
applications, a low pass filter at the output will reduce the harmonic contents to a desired level
(Rohde et al., 2005a).

10
Phase noise, related to short-term frequency stability, is characterized by variations in
the output frequency which appears, in the frequency domain, as FM energy around the carrier
frequency. It is specified in dBc/Hz and measured at specified offsets from the carrier frequency
which is typically 10 kHz and 100 kHz. The phase noise (or FM noise) is produced by thermal
noise, shot noise, and flicker noise.
Frequency stability or phase stability refers to the ability of the oscillator to maintain
constant frequency of oscillation. In achieving frequency stability, series or parallel resonant
circuits are generally used in the terminating network, such as lumped elements, cavities and
DRs. A requirement for all resonators is to acquire high Q factor or low loss. By appending a
high Q tuning network to the oscillator, this will result in the enhancement of the oscillator
stability (Mahyuddin et al., 2006).
As well known, an amplifier and a tuned circuit that arebuilt in an oscillator are
functioned to transform the dc energy into RF energy at the desired frequency and acceptable
power added efficiency. By depending on the frequencies and configurations, the efficiency of a
low noise oscillator varies between the range of 10% to 70%(Rohde et al., 2005b). According to
Rohde, the main objective of the amplifier and tuned circuit that is built in an oscillator is to gain
a frequency output signal which is stable with low phase noise and free of spurious signals at
sufficient level.
The unloaded quality factor is the parameter of the DR which influences the oscillator‟s
phase noise. It can be defined as a ratio of the stored energy within the puck to the amount of
energy which is dissipated by the resonator and serves as a figure of merit for the device.
Unloaded quality factors of 20,000 are now possible to 10 GHz. However, the loaded quality
factor will determine the oscillator‟s phase noise response. The loaded quality factor can be
defined as a ratio of the energy stored within the puck per cycle to that delivered to the load per
11
cycle. The oscillator phase noise is described by Leeson‟s equation, which demonstrates that the
reduction in the loaded Q, resulting from the inclusion of voltage variable frequency control, in
the traditional manner, results in a degradation of the oscillator phase noise performance
(Warburton, 2005).
The effects of the output frequency of an oscillator can be classified into three categories
known as jumping, pushing and pulling frequency. Jumping frequency is a term to describe a
discontinuous change in oscillator frequency due to nonlinearities in the device impedance.
Meanwhile, frequency pushing is a measure of the sensitivity of the oscillator output frequency
to the supply voltage (MHz/volt) which is tested by varying the dc supply voltage of an
oscillator with its tuning voltage held constant, where it is typically around ±1V. In other words,
frequency pushing characterizes the degree to which an oscillator‟s frequency is affected by its
supply voltage(Rohde et al., 2005a). On the other hand, frequency pulling is a measure of the
change in frequency to a non-ideal load (load mismatch over 360° of phase noise variation).
Frequency pulling is also the change of frequency resulting from partially reactive loads, which
is an important oscillator characteristic (MINICIRCUIT, 2013, Mahyuddin, 2006).
Spurious outputs are signals found around the carrier of an oscillator which are not
harmonically related. A good, clean oscillator needs to have a spurious free range of 90 dB, but
this requirement makes it expensive. Typically, an oscillator have no spurious frequencies other
than possibly 60 Hz and 120 Hz pickup (Rohde et al., 2005a).
2.2.3 High Frequency Oscillator Design
Both negative resistance and feedback DROs design in this dissertation contain the
implementation of a transistor oscillator which concern with nonlinear analysis of high
frequency FET and bipolar oscillators. The method of designing a transistor oscillator involves
small and large signal which provide all the information needed to design an oscillator. The
12
design of transistor oscillator has similarity to the design of transistor amplifier, especially dc
bias circuits and S-parameters, with the exception of the transistor oscillator is designed to be
unstable. There are some requirements have to be taken into considerations concerning
generating an oscillation for transistor amplifier and transistor oscillator design. As for transistor
amplifier, S11 and S22 must be less than unity while for transistor oscillator to be unstable, S11
and S22 must be greater than unity.
Bipolar, MOSFET, MESFET, HEMT and HBT are examples of transistors which can be
implemented into the oscillator design method based on the S-parameters datasheet of the
transistor correspondingly. Normally, common source or common gate FET configurations are
frequently used since it meets the condition of implementing a high degree of unstable device in
an oscillator.
By referring to the previous section, resonators play a major part in an oscillator which
has been implemented into the oscillator design towards accomplishes a low noise and high
frequency stability. They are made of lumped element, a distributed transmission line, a cavity
or a dielectric disc.
The approach of S-parameters in small and large signal designs which has been
implemented into the oscillator design as a requirement for oscillation to start up. Figure 2.1
shows a two-port transistor oscillator where ZL is the load impedance and ZT is the terminating
impedance seen by the transistor. The condition for oscillation to start is by the used of
terminating network in order provide the |Гout| > 1. The frequency of oscillation and power
delivery to the load are determined by the load network(Maas, 2003, Mahyuddin, 2006).

13
Figure 2.1: Circuit for a two-port transistor oscillator(Maas, 2003, Mahyuddin, 2006).
0 0,out LR V f R f (2.1)
0 0, 0out LX V f X f (2.2)
Where;
Rout = real part of output resistance
Xout = imaginary part of load resistance
RL = real part of load resistance
XL = imaginary part of load impedance
V = voltage across the output resistance (V)
f0 = carrier centre frequency (Hz)
The above conditions need to be satisfied to make sure that the oscillation occurs at the
desired frequency. It is stated that Rout is negative. Equation 2.1 ensures that |Гout| > 1 and the
Equation 2.2 determines the oscillation frequency. The network has the potential for oscillation
as long as the first equation is satisfied. As an elaboration, the oscillations start to build from the
noise level when the power supply voltages of an oscillator are turned on. As a result, the output
amplitude will continue to grow until the saturation effects of the device limit it. Decisively, the
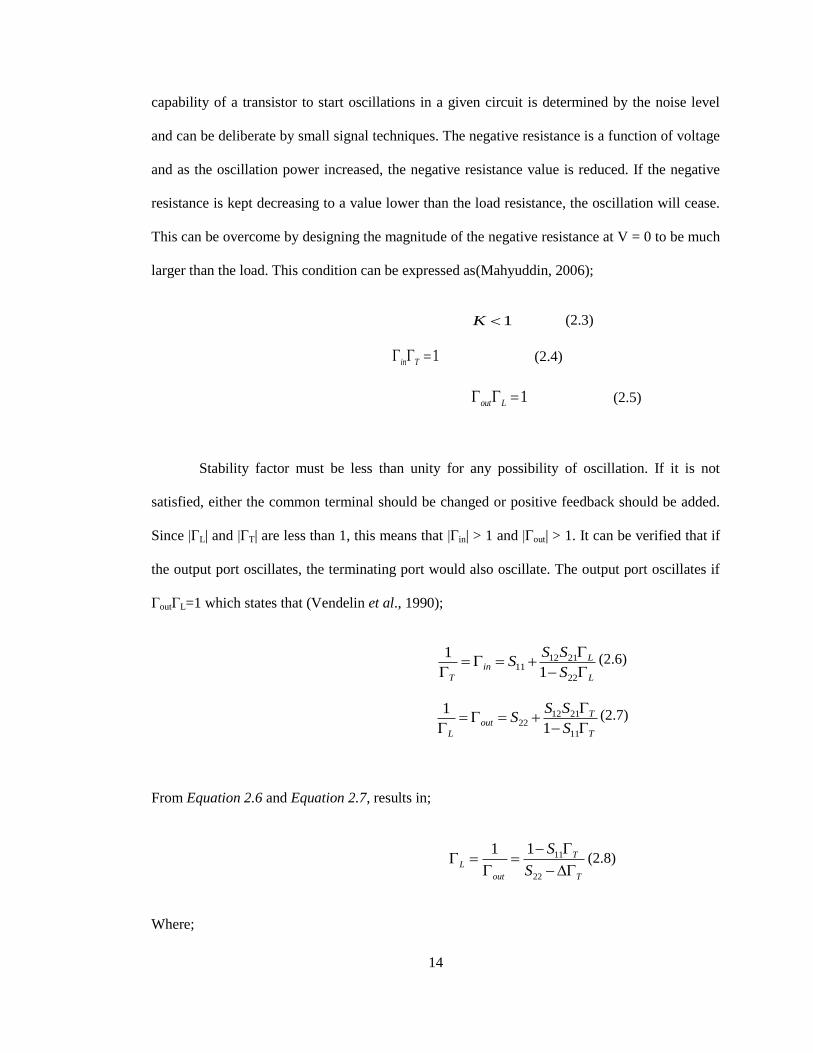
14
capability of a transistor to start oscillations in a given circuit is determined by the noise level
and can be deliberate by small signal techniques. The negative resistance is a function of voltage
and as the oscillation power increased, the negative resistance value is reduced. If the negative
resistance is kept decreasing to a value lower than the load resistance, the oscillation will cease.
This can be overcome by designing the magnitude of the negative resistance at V = 0 to be much
larger than the load. This condition can be expressed as(Mahyuddin, 2006);
1K (2.3)
1in T (2.4)
1out L (2.5)
Stability factor must be less than unity for any possibility of oscillation. If it is not
satisfied, either the common terminal should be changed or positive feedback should be added.
Since |ГL| and |ГT| are less than 1, this means that |Гin| > 1 and |Гout| > 1. It can be verified that if
the output port oscillates, the terminating port would also oscillate. The output port oscillates if
ГoutГL=1 which states that (Vendelin et al., 1990);
12 2111
22
1
1L
in
T L
S SS
S
(2.6)
12 2122
11
1
1T
out
L T
S SS
S
(2.7)
From Equation 2.6 and Equation 2.7, results in;
11
22
11 TL
out T
S
S
(2.8)
Where;

15
11 22 12 21S S S S
Equation 2.8 can be arranged to give:
22
11
1 LT
L
S
S
(2.9)
Equation 2.6 can be written as:
11
221
LT
L
S
S
(2.10)
Multiplying Equation 2.9 by Equation 2.10 results in:
1in T (2.11)
Therefore, this proves that the terminating port is also oscillating.
The first step to design a transistor oscillator is by selecting a potentially unstable
transistor at the frequency of oscillation. If it is found to be stable and not meet the requirement,
it can be overcome by incorporating the feedback elements to make it unstable.
The second step to design a transistor oscillator is by designing the terminating network,
to achieve |Гout| > 1 by choosing ГT and ZT in the unstable zone of the stability circle. When ZT
and the transistor small signal S-parameter have been considered, Гoutis calculated and the
condition of |Гout| > 1 must be followed. The load is then chosen according to the oscillation
conditions as follows:

16
0 0outLX f X f (2.12)
0 0
10,
3L outR f R f (2.13)
As to make an oscillator working, ZLvalue must be chosen correctly. It is found that the
measured oscillation frequency will be shifted from the design value since Xout (f0) used in
determining f0, is assumed to be independent of the amplitude, V. Finally, the last step of
designing a transistor oscillator is to design the load matching network to transform a 50 Ω load
to ZL.There is similarity between the large and small signal design approach except for the main
difference between them which is the determining of large signal S-parameters device. The large
signal S-parameters can be determined either by measurements or by using a large signal device
model.
2.2.3.1 Negative Resistance Oscillator
Several solid-state devices exhibit negative resistance under a certain dc biases due to
the device physics. These include the Gunn device, impact ionization avalanche transit time
(IMPATT) devices, resonant tunneling diodes (RTDs) and transistors (Chang, 1994). In
microwave and millimeter wave frequencies it inhibits Gunn and IMPATT, which are two
terminal devices. From low RF frequencies to microwave and millimeter wave are two different
variations of frequencies that have been used for a transistor.
The most common transistors that have been used in RF frequencies are silicon metal
oxide semiconductor field effect transistors (MOSFETs). However, in microwave frequencies,
the most common transistors that have been used are bipolar transistors, metal semiconductor
field effect transistors (MESFETs), high electron mobility transistors (HEMTs) and
heterojunction bipolar transistors (HBTs).

17
In order to produce a sinusoidal steady state RF signal, a solid-state oscillator such as
diode and transistor has been used in conjunction with a passive circuit. After an oscillator is
properly designed with a stable oscillation state, an oscillation for a startup is triggered with the
existence of transient and noise. Thus, a nonlinear active device is essential to overcome this
matter and since the device is producing RF power, negative resistance is relevant in the
nonlinear active device. The complete analysis of oscillation operation is proven to be difficult
due to the active and nonlinear element.
An oscillator can be classified into three individual parts which are; a low loss resonant
circuit, a negative resistance device or an active two-port with its S-parameters description, and a
coupling circuit which contains a passive lossy load. The resonant circuit functions as energy
storage and at the same time controls the frequency while the negative resistance device
functions to generate the power to be transferred to the load (Mahyuddin, 2006).
On the basis of negative resistance theory, the DRO is designed to make the resistance
generated by the feedback element negative enough to compensate the loss generated by the
resonator. As a rule of thumb, at least 1.2 times of the load resistance is required by the negative
resistance in series circuit in order to satisfy the start-up condition for the oscillator (Wan, 2008).
For oscillation to occur; the Barkhausen criteria must be met which are; the open loop gain must
exceed unity and the phase shift around the loop must be equal to an integral multiple of 2π and
as such, the phase shifter will operate to keep the output frequency of the oscillator fixed. As the
oscillator signal builds up from noise, gain is compressed to unity and steady state oscillation
occurs (Warburton, 2005).
The common method in designing an oscillator is by resonating the input port with a
passive high Q circuit at the desired frequency of resonance. The transistor will oscillate at both
ports and is thus delivering power to the load port by connecting a load to the output port.

18
Typically, since a high Q resonance is desirable for minimizing oscillator noise, only parasitic
resistance is present at the resonating port. Since the oscillator is oscillating at both ports
simultaneously, it is possible to have loads at both the input and output ports if such an
application occurs.
Figure 2.2 shows a general circuit of an oscillator, where ZD is the device impedance
andZL is the transformed load impedance which seen by the device. ZD is the output impedance
of a terminated transistor, in the case of a transistor oscillator. A terminated three-port transistor
transforms into a two-port circuit. Zo is the output line characteristic impedance, which is 50 Ω
for microstrip or coaxial line and several hundreds of ohms for waveguides. The transformer
network includes the device package and embedding circuits.
Figure 2.2: General oscillator circuit(Chang, 1994).
The oscillation frequency can be determined by the resonant frequency of the overall
circuit. The total amount of reactance or resistance is zero at a resonance when the net resistance
or conductance of the circuit is negative which by referring to the negative resistance condition
which is common for all two terminal solid-state active devices. As a result, there will be a
voltage drop across a positive resistance to be positive and a power will be dissipated in the
resistance. In an addition, a voltage drop across a negative resistance is negative which creating
power generated in the resistance (Mahyuddin, 2006).

19
2.2.4 Requirement for Oscillator Design
Oscillator design is very similar to amplifier design. The same transistor, dc bias levels,
and the same set of device S-parameters used in amplifier design are used to design the
oscillator. The typical oscillator design consists of three parts, the input resonant impedance
matching circuit, the active device, and the output impedance matching network. The feedback
circuit is usually included in the active device block while the negative resistance is not
available.
The oscillator circuits implement steady state operation only when a transistor has been
driven into nonlinear operation that its gain averaged over each output cycle drops to a small
fraction of the nominal small signal value. Information of transistor parameters in the data sheet
only defines the initial conditions of the oscillator circuit, where the transitional and final values
are usually unknown. Equivalent circuits and analytical tools of circuit analysis are based upon
linearity; state-operating conditions of an oscillator in general cannot be predicted accurately by
simple mathematical techniques.
In order to start the oscillation, the output of an amplifying device must be fed back to
the input with gain greater than unity and with a phase shift of 0° or some multiple of 360°. This
can only occur at one frequency, which will be the frequency of oscillation. If the phase shift
through the feedback network and transistor is independent of the transistor operating
conditions, the frequency of oscillation will be the same at steady state as it was when
oscillations began and it may be predicted accurately by small signal analysis of the initial
circuit. There is possibility in predicting the minimum transistor gain that will initiate oscillation
but the operating frequency is all about that small signal analysis can yield.
Frequency dependence of passive component values is another complicating factor. It is
stated that capacitors larger than a few hundred Pico farads tend to look inductive above about
20
10 MHz and stray capacitance between turns may cause inductors to become capacitive. In
conventional circuit theory, these effects are difficult to design and they may allow a circuit to
satisfy the conditions for oscillation at frequencies that are not predicted by circuit analysis.
Practically, the results that have been analyzed mathematically do not assured that the circuit
will oscillate simultaneously at the intended frequency but instead it may oscillate at a low
frequency or even at one or more high frequencies. These can be encountered by employing high
quality inductors and by connecting small capacitors in parallel with all bypasses and coupling
capacitors(Mahyuddin, 2006).
2.3 Dielectric Resonator
The general concept of an oscillator had been discussed in previous section. The
discussion covers the design theory, characterization and requirement for an effective oscillator.
The knowledge about DR is essential to be understood before proceeding with the related topic,
DRO in order to have knowledge more on the DR‟s background. Furthermore, the reasons of
choosing the suitable DR as the resonator in the condition of high quality factor and to achieve
low loss oscillator have been deeply explored. The overall concept of DR design, coupling
method, unloaded and loaded quality factor, and insertion loss also have been studied and
understood.
2.3.1 Types of Resonator
A better performance of an oscillator will have a stable output frequency which
functioned as to lower the frequency modulation (FM) and phase noise. By terminating network
with series and parallel circuits, frequency stability can be achieved. The reflection coefficient
for a high Q resonator is outer boundary of the Smith Chart upon the phase depending on the
transmission line length between resonator and the active device.

21
There are several examples of resonator that can resonate at the desired frequency
depends on their own features. Most commonly resonators are; a DR, LC circuit, ceramic
piezoelectric devices and YIG-based device. After implemented into an oscillator design, these
resonators can be mechanically tuned at a desired fixed frequency. The resonator part is a critical
part in oscillator design since it coupled inadequately to the circuit, thus contributing to high loss
and so the Q. Supposedly, the resonator is the dominant in oscillator frequency setting rather
than the transistor because of the high Q, low noise characteristic and thermally more stable
(Chang et al., 2002). The higher loss in the resonator, the more difficult to satisfy the gain
conditionwhich is |S21| >1.
Distributed or lumped resonators and integrated resonators are the types of microstrip
resonators. Distributed or lumped have the same parallel tuned circuit as the LC resonators. The
lumped resonators can be generated by using a printed transmission line instead of the lumped
inductor, and still maintaining the capacitance. The transmission line tends to suffer from losses
due to the material been used where the typical value of Q is around 240. With suitable layout
and material been used, the value of Q is possible until up to 300 (Rohde et al., 2005a). In
contrast with the integrated resonators, it can be generated not only using PCB material but in
GaAs or in Silicon. Usually, a high resonator consists of two coupled inductors has been used
since the elements themselves are not resonant and are much shorter than quarterwave length
and merely appropriate for two or more coupled transmission lines. The rate of change of phase
against frequency in the configuration will be faster with a higher Q which can be as much as ten
times as the Q of a single tuned circuit.
It was first presented by R. D. Richtymer that cylindrical dielectric structure would act
like a resonator. Many years after that discovery, such circuits containing DRs are realized
(Ugurlu, 2011). The shape of the DR is usually a disc or short solid cylinder, but can also be
made into a tabular, spherical, parallel piped, or rectangular shape. The most frequently used DR
22
shapes are disc and puck since they can be easily manufactured than other shapes (Bing et al.,
2009).
The most popular resonator is the ceramic type of resonator which can be used either in
filter or in oscillator. It is based on a quarterwave arrangement and can be made from low loss
coaxial line or waveguide. The ceramic is silver plated and can be modeled as a quarterwave
section of TEM transmission line with a high relative dielectric constant ranging from 33 to 88.
It is known that a requirement for all resonators is acquire high Q for low loss and stable
oscillation. Lumped element, which has been mentioned before, fails to perform since its Q is
limited to only a few hundred. Cavity resonator, however, has Q of thousands but it is not suited
for miniature microwave integrated circuit and in addition, it also suffers from frequency drift
caused by dimension expansion due to temperature variation. Soon after low loss ceramic
dielectric material with controllable temperature coefficients became available at reasonable
cost, the DR became a widely employed component in microwave circuits, predominantly in
filters and solid-state oscillators (Tobar et al., 1999). Therefore, in achieving a high Q with low
loss and stable oscillation, DR is the right candidate for such task.
2.3.2 Theory of Dielectric Resonator
Resonators are an important component in microwave circuits. They play a major role in
frequency definition in oscillators where they store energy at the resonant frequency in the
electric and magnetic fields. The important characteristics of the microwave resonators are the
resonant frequency, quality factor (Q), which defines the bandwidth of the resonance and the
input impedance of the resonator (Ugurlu, 2011). There are several kinds of resonant circuits
which include lumped element resonant circuits, transmission line distributed resonant circuits,
and cavity resonators.

23
DR is the frequency-determining element of the DRO for realizing a stable microwave
frequency source. It is made of the material with high dielectric constant, high Q factor, and low
temperature coefficient (Bing et al., 2009). The dielectric constant, r varies from 20 to 80. DRs
have been widely used to make temperature compensated stable oscillators. But for most
applications they also need to have low noise characteristics as close as a few hundreds of Hz off
the carrier. During the past several years, a variety of microwave components which employ
DRs have been developed due to the availability of low-cost, temperature-stable, high
permittivity materials. Since the sizes of DRs are small depends on the material and the
frequency and can be as small as a few centimeters and they are the most preferable resonator in
high frequency applications(Ugurlu, 2011).
The DR functions as a resonator due to internal reflection of the electromagnetic waves
at the high dielectric constant material or air boundary. The interface between the air and the
high dielectric constant material can be explained as a hypothetical magnetic wall (covered by a
perfect magnetic conductor (PMC)), on which the normal component of the electric field and the
tangential component of the magnetic field will vanish at the boundary. Hence, most of the
energy will be internally reflected. The reflection coefficient increases as the ratio of the
dielectric constant of the DR to air increases.
As in a conventional metal cavity, an infinite number of modes can exist in a DR. The
most commonly utilized mode in a cylindrical DR is called the TE01∂ mode. Some call it a
“magnetic dipole mode” because of this mode appears as a magnetic dipole, instead of using the
term TE01∂. This particular mode for a given diameter or length ratio has the lowest resonant
frequency and therefore is designated the fundamental mode.
The most important properties for a DR in microwave circuit applications are dielectric
constant, r , quality factor, Q, and the temperature coefficient of the resonant frequency. The
24
dielectric constant, r of the material determines the resonator‟s dimension for a given
frequency. The unloaded quality factor, Qu depends on both dielectric and environmental losses.
The Q factor is a measure of the energy stored in the field inside the resonator as compared to
the energy lost or dissipated per cycle.
The next issue is to couple the DR to the microwave circuit. The simplest way is to place
it on top of a microstrip substrate. The lateral distance between the DR and the microstrip
conductor determines the amount of coupling between the resonator and the microstrip line. The
entire device is usually enclosed in a metal shielded box which is used to prevent radiation losses
and to shield the circuit from stray external fields (Pan, 1991).
2.3.2.1 Electric and Magnetic Field Patterns
There are many field patterns or mode present in a DR depending on the shape of the
DR. Cylindrical shape which operates at TE01∂mode is the most popular shape of the DR that has
been used recently in the industry until now (Hunter, 2001). There are four different basic modes
which present in a dielectric waveguide; Transverse Electric (TE), Transverse Magnetic (TM),
Electric Hybrid (EH) and Magnetic Hybrid (HE) modes.
2.3.2.2 Resonant Frequency
The resonant frequency of the DR is primarily determined by its dimensions and its
surroundings. Therefore, the frequency fluctuates very little producing a more stable frequency
source with a corresponding improvement in phase noise.Although the geometrical form of a DR
is extremely simple, an exact solution of the Maxwell equations is considerably more difficult
than for the hollow metallic cavity. For this reason, the exact resonant frequency of a certain
amount of mode, such as TE01∂, can only be computed by rigorous numerical procedures.
Currently, practical DRs cover a frequency range of 1 to 100 GHz. The lower frequency limit is