
Design Methodology of Camshaft Driven Charge Valves for ...
18
HAL Id: hal-01931291 https://hal.archives-ouvertes.fr/hal-01931291 Submitted on 22 Nov 2018 HAL is a multi-disciplinary open access archive for the deposit and dissemination of sci- entific research documents, whether they are pub- lished or not. The documents may come from teaching and research institutions in France or abroad, or from public or private research centers. L’archive ouverte pluridisciplinaire HAL, est destinée au dépôt et à la diffusion de documents scientifiques de niveau recherche, publiés ou non, émanant des établissements d’enseignement et de recherche français ou étrangers, des laboratoires publics ou privés. Design Methodology of Camshaft Driven Charge Valves for Pneumatic Engine Starts Michael M. Moser, Christoph Voser, Christopher H. Onder, Lino Guzzella To cite this version: Michael M. Moser, Christoph Voser, Christopher H. Onder, Lino Guzzella. Design Methodology of Camshaft Driven Charge Valves for Pneumatic Engine Starts. Oil & Gas Science and Technol- ogy - Revue d’IFP Energies nouvelles, Institut Français du Pétrole (IFP), 2015, 70 (1), pp.179-194. 10.2516/ogst/2013207. hal-01931291
Transcript of Design Methodology of Camshaft Driven Charge Valves for ...

HAL Id: hal-01931291https://hal.archives-ouvertes.fr/hal-01931291
Submitted on 22 Nov 2018
HAL is a multi-disciplinary open accessarchive for the deposit and dissemination of sci-entific research documents, whether they are pub-lished or not. The documents may come fromteaching and research institutions in France orabroad, or from public or private research centers.
L’archive ouverte pluridisciplinaire HAL, estdestinée au dépôt et à la diffusion de documentsscientifiques de niveau recherche, publiés ou non,émanant des établissements d’enseignement et derecherche français ou étrangers, des laboratoirespublics ou privés.
Design Methodology of Camshaft Driven Charge Valvesfor Pneumatic Engine Starts
Michael M. Moser, Christoph Voser, Christopher H. Onder, Lino Guzzella
To cite this version:Michael M. Moser, Christoph Voser, Christopher H. Onder, Lino Guzzella. Design Methodologyof Camshaft Driven Charge Valves for Pneumatic Engine Starts. Oil & Gas Science and Technol-ogy - Revue d’IFP Energies nouvelles, Institut Français du Pétrole (IFP), 2015, 70 (1), pp.179-194.�10.2516/ogst/2013207�. �hal-01931291�

This paper is a part of the hereunder thematic dossierpublished in OGST Journal, Vol. 70, No. 1, pp. 3-211
and available online hereCet article fait partie du dossier thématique ci-dessous publié dans la revue OGST, Vol. 70, n°1, pp. 3-211
et téléchargeable ici
Do s s i e r
Oil & Gas Science and Technology – Rev. IFP Energies nouvelles, Vol. 70 (2015), No. 1, pp. 3-211
Copyright © 2015, IFP Energies nouvelles
3 > EditorialB. Leduc and P. Tona
15 > A Challenging Future for the IC Engine: New Technologies and the Control RoleUn challenge pour le futur du moteur à combustion interne :nouvelles technologies et rôle du contrôle moteurF. Payri, J. M. Luján, C. Guardiola and B. Pla
31 > The Art of Control Engineering: Science Meets Industrial RealityL’art du génie automatique : science en rencontre avec la réalitéindustrielleU. Christen and R. Busch
41 > Energy Management of Hybrid Electric Vehicles: 15 Years ofDevelopment at the Ohio State UniversityGestion énergétique des véhicules hybrides électriques : 15 ans de développement à l’université d’État de l’OhioG. Rizzoni and S. Onori
55 > Automotive Catalyst State Diagnosis using MicrowavesDiagnostic de l’état de catalyseurs d’automobiles à l’aide de micro-ondesR. Moos and G. Fischerauer
67 > Control-Oriented Models for Real-Time Simulation of AutomotiveTransmission SystemsModélisation orientée-contrôle pour la simulation en temps réel des systèmes de transmission automobileN. Cavina, E. Corti, F. Marcigliano, D. Olivi and L. Poggio
91 > Combustion Noise and Pollutants Prediction for Injection Pattern and Exhaust Gas Recirculation Tuning in an Automotive Common-RailDiesel EnginePrédiction du bruit de combustion et des polluants pour le réglagedes paramètres d’injection et de l’EGR (Exhaust Gas Recirculation)dans un moteur Diesel Common-Rail pour l’automobileI. Arsie, R. Di Leo, C. Pianese and M. De Cesare
111 > Investigation of Cycle-to-Cycle Variability of NO in HomogeneousCombustionEnquête de la variabilité cycle-à-cycle du NO dans la combustionhomogèneA. Karvountzis-Kontakiotis and L. Ntziachristos
125 > Energy Management Strategies for Diesel Hybrid Electric VehicleLois de gestion de l’énergie pour le véhicule hybride DieselO. Grondin, L. Thibault and C. Quérel
143 > Integrated Energy and Emission Management for Diesel Engines with Waste Heat Recovery Using Dynamic ModelsUne stratégie intégrée de gestion des émissions et de l’énergie pourun moteur Diesel avec un système WHR (Waste Heat Recovery)F. Willems, F. Kupper, G. Rascanu and E. Feru
159 > Development of Look-Ahead Controller Concepts for a Wheel LoaderApplicationDéveloppement de concepts d’une commande prédictive, destinée à une application pour chargeur sur pneusT. Nilsson, A. Fröberg and J. Åslund
179 > Design Methodology of Camshaft Driven Charge Valves for PneumaticEngine StartsMéthodologie pour le design des valves de chargement opérées pararbre à camesM.M. Moser, C. Voser, C.H. Onder and L. Guzzella
195 > Design and Evaluation of Energy Management using Map-BasedECMS for the PHEV BenchmarkConception et évaluation de la gestion de l’énergie en utilisantl’ECMS (stratégie de minimisation de la consommation équivalente)basée sur des cartes, afin de tester les véhicules hybrides électriquesrechargeablesM. Sivertsson and L. Eriksson
DOSSIER Edited by/Sous la direction de : B. Leduc et P. Tona
IFP Energies nouvelles International Conference / Les Rencontres Scientifiques d’IFP Energies nouvellesE-COSM'12 — IFAC Workshop on Engine and Powertrain Control, Simulation and ModelingE-COSM'12 — Séminaire de l'IFAC sur le contrôle, la simulation et la modélisation des moteurs
et groupes moto-propulseurs

IFP Energies nouvelles International ConferenceRencontres Scientifiques d'IFP Energies nouvelles
E-COSM'12 - IFAC Workshop on Engine and Powertrain Control, Simulation and ModelingE-COSM'12 - Séminaire de l'IFAC sur le contrôle, la simulation et la modélisation des moteurs et groupes moto-propulseurs
Design Methodology of Camshaft Driven ChargeValves for Pneumatic Engine Starts
Michael M. Moser*, Christoph Voser, Christopher H. Onder and Lino Guzzella
Institute for Dynamic Systems and Control, ETH Zurich, Sonneggstrasse 3, 8092 Zurich - Switzerlande-mail: [email protected] - [email protected] - [email protected] - [email protected]
* Corresponding author
Abstract — Idling losses constitute a significant amount of the fuel consumption of internal com-
bustion engines. Therefore, shutting down the engine during idling phases can improve its overall effi-
ciency. For driver acceptance a fast restart of the engine must be guaranteed. A fast engine start can
be performed using a powerful electric starter and an appropriate battery which are found in hybrid
electric vehicles, for example. However, these devices involve additional cost and weight. An alter-
native method is to use a tank with pressurized air that can be injected directly into the cylinders
to start the engine pneumatically. In this paper, pneumatic engine starts using camshaft driven
charge valves are discussed. A general methodology for an air-optimal charge valve design is pre-
sented which can deal with various requirements. The proposed design methodology is based on a pro-
cess model representing pneumatic engine operation. A design example for a two-cylinder engine is
shown, and the resulting optimized pneumatic start is experimentally verified on a test bench engine.
The engine’s idling speed of 1200 rpm can be reached within 350 ms for an initial pressure in the air
tank of 10 bar. A detailed system analysis highlights the characteristics of the optimal design found.
Resume — Methodologie pour le design des valves de chargement operees par arbre a cames — Les
pertes a vide representent une partie essentielle de la consommation des moteurs a combustion
interne. La mise a l’arret du moteur pendant la marche a vide peut, par consequent, en
ameliorer son efficacite generale. Pour etre accepte par le conducteur, le redemarrage du moteur
doit etre rapide. On peut realiser ce demarrage rapide du moteur, moyennant un demarreur
electrique puissant conjointement avec un accumulateur approprie, solution retenue par
exemple, pour les vehicules a systeme hybride electrique. Cependant, ces derniers augmentent le
cout et le poids. Une alternative consiste dans le demarrage pneumatique du moteur en utilisant
de l’air comprime stocke dans un reservoir sous pression et injecte directement dans les
cylindres. Cette etude presente le demarrage pneumatique du moteur en utilisant des valves de
chargement commandees par arbre a cames. On presente une methodologie visant a une
consommation de l’air optimale en mesure de respecter des exigences differentes. La demarche
proposee s’appuie sur le modele d’un processus representant l’operation pneumatique du
moteur. La verification experimentale du demarrage pneumatique est realisee et optimisee sur
un moteur 2 cylindres sur banc d’essai. Avec une pression initiale de 10 bar dans le reservoir
d’air, la vitesse de rotation a vide de 1 200 tr/min peut etre atteinte en 350 ms. Une analyse
detaillee confirme les caracteristiques du systeme optimise.
Oil & Gas Science and Technology – Rev. IFP Energies nouvelles, Vol. 70 (2015), No. 1, pp. 179-194� M.M. Moser et al., published by IFP Energies nouvelles, 2014DOI: 10.2516/ogst/2013207
This is an Open Access article distributed under the terms of the Creative Commons Attribution License (http://creativecommons.org/licenses/by/4.0),which permits unrestricted use, distribution, and reproduction in any medium, provided the original work is properly cited.

INTRODUCTION
An inherent property of Internal Combustion
Engines (ICE) is their limited operability below a
minimum rotational speed. Starting an engine
involves accelerating it up to a specific minimal speed
of operation. Due to its inertia and the low starter
power, a conventional start of an ICE takes up to
1 second. An engine shutdown during idling phases
implying such long start times is not accepted by
the driver. Therefore, conventional ICE are typically
not shut down during idling phases.
However, idling losses constitute a significant amount
of the total fuel consumption. During the New European
Driving Cycle (NEDC), they amount to 4-8% depending
on the engine type and size as shown in [1-4]. In order to
exploit this fuel saving potential by eliminating the idling
phases while still satisfying driver demands, the duration
of an engine start needs to be reduced.
A common approach to reducing the engine start time
is the installation of a powerful Electric Starter (ES) and
an appropriate battery. This strategy can be pursued
with hybrid electric vehicles since they are equipped with
more powerful electric motors and batteries than con-
ventional engines. However, they induce additional
weight and cost. In [5], it is shown that for this setup start
times as low as 300 ms are achievable.
Several authors, e.g. those of [3, 6-8], investigated a
method for fast starts of gasoline engines with direct fuel
injection. The idea behind that approach is to inject fuel
into the stopped engine. If the engine has stopped at an
appropriate position, the fuel can be ignited at standstill
to restart the engine without using the ES. However, a
controlled engine shutdown is essential to enforce the
engine to stop at an appropriate position. Robustness
under all operating conditions and emissions due to
incomplete combustion at low engine speeds are critical
issues with this approach. The authors of [5] extended
the investigation to ES-assisted engine starts to reduce
the start time and the emissions.
A cost and weight effective alternative is to use com-
pressed air that can be injected directly into the cylin-
ders. The compressed air is stored in a tank. The tank
can be recharged by running the engine as a piston com-
pressor (as e.g. done in hybrid pneumatic engines [1]) or
by an additional compressor which can be engaged to the
crank shaft or which is driven electrically. For the rest of
the paper, it is assumed that the compressed air is avail-
able and the recharging method is not discussed any fur-
ther. Figure 1 shows a schematic representation of the
engine setup considered. Figure 2 shows the setup of
the engine on the testbench on which the measurements
presented later in this paper are performed.
To start the engine pneumatically, air is injected
during the expansion stroke where it produces a positive
torque that accelerates the engine. The engine is then
Air pressure tank
CV CVEV
IV
GasolineThrottle
Figure 1
Schematic illustration of the engine setup. A two-cylinder
engine with one Exhaust Valve (EV) and two Intake Valves
(IV) per cylinder is shown. One EV per cylinder is replaced
by a Charge Valve (CV).
Figure 2
Photograph of the engine including the testbench equip-
ment on which the measurements presented in this paper
are performed.
180 Oil & Gas Science and Technology – Rev. IFP Energies nouvelles, Vol. 70 (2015), No. 1

driven purely pneumatically without burning any fuel. In
[9], pneumatic engine starts using a fully variable valve
system for the actuation of the charge valves (CV) are
investigated. Using this setup, the CV lift profile can be
adapted on a cycle-to-cycle basis. However, a fully vari-
able valve system increases the complexity and cost of
the system.
In this paper, pneumatic engine starts using camshaft
driven CV are investigated. Camshaft driven CV are
characterized by a valve lift profile which cannot be
adapted during the operation of the engine. The CV lift
profile must be defined during the design process. Fur-
thermore, the camshaft driven valve system has an on/
off capability, i.e. the valves can either be activated or
deactivated. The level of complexity can be significantly
reduced by using camshaft driven CV instead of fully
variable CV. The goal of this work is to provide a meth-
odology for the optimization of the CV design for mini-
mum air consumption with the constraint of a
maximally allowable engine start time. Parts of this work
were already presented in [10], the content of which was
revised and extended with a detailed system analysis for
various operating conditions.
The paper is structured as follows: in Section 1, the
model and the setup of the engine as well as the bound-
ary conditions for the optimization of the CV design are
introduced. Additionally, an engine stop strategy is pro-
posed. In Section 2, the design problem is formulated as
a constrained minimization problem. A design method-
ology to solve this optimization problem is presented.
Section 3 shows the application of this methodology in
a design example whose results are verified experimen-
tally on a test bench engine. The CV design found is ana-
lyzed with respect to varying initial engine positions,
tank pressures and tank temperatures. The paper finishes
with a conclusion summarizing the contribution of this
work and an outlook on future research.
1 MODEL AND SETUP
For the determination of the optimal CV parameters a
process model of the engine is used to simulate the start.
A detailed description of the model can be found in
Appendix A. This section deals with the electric starter,
the parameters of the valve lift profile and the role of
the initial engine position. The influence of the pneu-
matic start on the catalyst temperature is a practical issue
which is briefly discussed in Appendix B.
Note that for the crank angle / ¼ 0�, the piston is
located at the Top Dead Center (TDC) after the com-
pression stroke. Crank angles with values of / > 0� arelocated after TDC.
1.1 Electric Starter
In contrast to [9], this paper focuses on camshaft driven
CV. In such a realization, the valve lift profile is fixed.
Furthermore, the valve can only be actuated by a rotat-
ing engine. For the initial actuation of the CV and for
other reasons as described in [7] an ES is essential. Fur-
thermore, the ES helps to reduce the start time since it
serves as an additional torque supplier during the pneu-
matic engine start.
In order to precisely predict the behavior of the engine
during the start phase, a good model of the ES is crucial.
Since the operation of the ES takes place under highly
dynamic conditions, the model of the ES needs to be
identified during transient operation. The behavior of
the ES is modeled as a static torque-speed relationship
TESðxeÞ for engine speeds below 200 rpm. For higher
engine speeds the engine and the ES are assumed to be
disconnected. A least squares approach is used to find
a polynomial fit for the torque-speed relationship.
Figure 3 shows the experimental validation of the rela-
tionship found by contrasting the simulated and the
measured engine speed trajectories. Only the first half
of the first engine revolution is shown because in this
phase the dynamics of the ES are dominant.
1.2 Valve Lift Profile
The valve lift profile is assumed to have a simplified valve
acceleration profile in the Crank Angle (CA) domain, i.e.
Eng
ine
spee
d (r
pm)
Time (s)0 0.05 0.10 0.15
0
50
100
150
200
250
300
MeasurementSimulation
Figure 3
Graph of the measured and simulated engine speed during
an engine start (first half of the first engine revolution,
where the ES is active). The measurements are taken on
the engine described in Section 3.
M.M. Moser et al. / Design Methodology of Camshaft Driven Charge Valves for Pneumatic Engine Starts 181

the magnitudes of the acceleration and the deceleration
are equal and piecewise constant. Accordingly, the valve
lift profile yCV ð/Þ becomes a function of the acceleration
in the CA domain aCV , the CV opening angle /CVO, the
CV closing angle /CVC and the maximum valve lift
yCV ;max that can be performed with the actuator chosen.
The angular durations of the acceleration crenels are:
�/ ¼ffiffiffiffiffiffiffiffiffiffiffiffiffiffiyCV ;maxaCV
rð1Þ
To avoid the collision of the valve with the piston the
following condition must be fulfilled:
yCV ð/Þ � minVcylð/ÞAcyl
; yCV ;max
� �ð2Þ
where Vcylð/Þ is the cylinder volume at the CA position
/ and Acyl is the cross-sectional area of the cylinder.
Figure 4 shows a sample CV lift profile.
To minimize throttling losses across the CV, the valve
should be opened and closed as fast as possible. The
valve acceleration thus has to be maximal. In contrast
to the Intake Valves (IV) and the Exhaust Valves (EV),
the CV is only actuated at low engine speeds. Since
mechanical stresses apply in the time domain, the maxi-
mum CV acceleration in the CA domain can be chosen
higher than that of the IV and EV. A reasonable value
for the CV acceleration aCV can be found with:
aCV ¼ aIV � xe;max
xe;s;max
� �2
ð3Þ
where aIV denotes the IV acceleration in the CA domain,
xe;max is the maximum engine speed and xe;s;max is the
maximally allowable engine speed during the pneumatic
start operation.
Given the maximum lift and the valve acceleration,
the remaining parameters of the CV lift profile are
/CVO and /CVC . A methodology to find appropriate val-
ues is presented in Section 2.
1.3 Initial Engine Position
The duration of the pneumatic engine start strongly
depends on the time that elapses until pressurized air is
injected for the first time. The sooner pressurized air is
injected, the faster the engine starts. The duration until
the CV opens at /CVO is mainly influenced by the size
of the ES and the initial engine position /0. Hence, the
engine should be shut down in a way such that the piston
which is in the compression stroke comes to rest closely
to the CV opening angle.
The rest position can be influenced by the amount of
air that is sucked into the cylinder during the intake
stroke. A higher air mass inside the cylinder results in
more compression work to be done during the compres-
sion stroke. Hence, the piston comes to rest more closely
to the Bottom Dead Center (BDC). For smaller air
masses inside the cylinder the gas spring force induced
by the compression is smaller resulting in piston rest
positions closer to TDC.
The actuation of the throttle during the engine shut-
down can be used to limit the pressure in the intake man-
ifold and thus to adjust the amount of air that enters the
cylinders. For engines equipped with a variable valve
timing system, the variability of the opening duration
of the IV can also be used to adjust the amount of air
inside the cylinders.
Since the engine considered in this paper (for details,
see Sect. 3) is not equipped with a variable valve timing
system for the IV, the throttle is used to adjust the engine
rest position. To find an appropriate value for the initial
engine position in the model, several experiments are
conducted. Several engine shutdowns with constant
throttle opening are performed on the warmed-up engine
and the rest position is recorded. The shutdowns are ini-
tialized at the engine’s idling speed of 1 200 rpm. Figure 5
shows the results for the two-cylinder parallel twin
engine considered. The best performance is achieved
with a throttle opening of 2% because the variance is
smallest and the mean position is closest to the TDC.
Higher values yield a rest position which is further away
from the TDC. Smaller throttle opening values yield a
poor repeatability of the rest position, which is not
Δφ
φCVCφ CVO
Val
ve a
ccel
.Li
ft
Crank angle (°)0 45 90 135
−aCV
aCV
yCV,max
0Piston positionCharge valve
Figure 4
Sample CV lift and acceleration profile.
182 Oil & Gas Science and Technology – Rev. IFP Energies nouvelles, Vol. 70 (2015), No. 1

desirable. Thus, an initial position of /0 ¼ �95� CA is
chosen.
1.4 Throttle Control during Engine Start
The throttle position setting found above is only relevant
during engine shutdown. As shown in [9], completely
closing the throttle during the engine start phase is air-
and time-optimal. A closed throttle implies that the
intake manifold pressure decreases during the start.
Hence, the amount of air inside the cylinder is reduced,
which causes less compression work to be required. Min-
imizing the compression work results in minimal nega-
tive torque during the engine start, which leads to
shorter start times. Therefore, for the design methodol-
ogy described below the throttle is always assumed to
be completely closed during the engine start.
If a variable valve timing system for the IV is avail-
able, the compression work is minimized by setting the
opening duration of the IV to the minimum.
2 DESIGN METHODOLOGY
In this section, the underlying optimization problem of
the CV design is stated. The optimization problem is
analyzed and discussed. A stepwise procedure for its
solution is presented. The feasible set satisfying all the
constraints is determined and specific design choices
are introduced.
The objective of the proposed design methodology is
to find values for the design variables which enable the
engine to reach a prescribed start speed xe;s within less
than a prescribed start time ts;max and which at the same
time minimize the amount of pressurized air used. The
relevant design variables are: /CVO;CV opening angle,
/CVC ;CV closing angle, dCV ;CV diameter.
Let � ¼ f/CVO;/CVC ; dCVg 2 R� R� Rþ be the
parameter space considered for the relevant design vari-
ables. The variable d denotes a single design in the set�.
The start time and the air consumption also depend
on the initial tank pressure pt. During the operation of
the engine on a drive cycle, the tank pressure varies.
The variation of the tank pressure is induced by the emp-
tying and recharging of the tank caused by operating
modes that use or provide pressurized air, respectively.
Fully variable valves can adjust their valve timing to
account for the changing tank pressure. However, the
valve timing of camshaft driven CV is fixed. Hence, the
design procedure has to consider the entire operating
range of the tank pressure. To that end, the weighted
sum of the amounts of air consumption resulting for ndifferent tank pressures ~pt 2 Rn;þ is minimized.
The tank temperature impacts the start time and the
air consumption as well, due to its influence on the mass
transfer into the cylinders. However, for the proposed
design methodology the tank temperature is assumed
to be constant due to the following reasons. According
to Equation (A2) the mass flow only depends on the
square root of the tank temperature in contrast to the
tank pressure on which the mass flow depends linearly.
Furthermore, the relative temperature change of the
air tank during the operation of the engine is signifi-
cantly smaller than the relative tank pressure change.
Due to the uninsulated tank, the temperature varies
according to measurements between 10�C and 50�C or
283K and 323K, respectively, i.e.�7%, whereas the tank
pressure varies between 6 bar and 14 bar, i.e. �40%. The
influence of the air temperature in the tank on the result-
ing optimal CV design is analyzed in Appendix C. It
turns out that the assumption of a constant air tempera-
ture in the tank is justified.
Considering only the variation in the tank pressure,
the optimization problem can be written as:
mind2�
Xni¼1
w ~pt ið Þð Þ � ma d;~pt ið Þð Þ s:t: tsðd;~ptðiÞÞ � ts;max
ð4Þ
where wð~ptðiÞÞ are the pressure dependent weighting fac-
tors, ts is the time needed to reach the desired engine
speed xe;s and ma denotes the amount of air used for
Throttle opening (%)
φ 0 (°
)
0 1 2 3 4−360
−270
−180
−90
0
Figure 5
Measured engine rest positions for various throttle open-
ings during engine shutdown. For details concerning the
engine see Section 3.
M.M. Moser et al. / Design Methodology of Camshaft Driven Charge Valves for Pneumatic Engine Starts 183
the start. The values of ts and ma are calculated with the
nonlinear process model fPM :
½maðd; ptÞ; tsðd; ptÞ� ¼ fPM ðd; pt;xe;sÞ ð5Þ
The air consumption ma is calculated by taking the
integral over the mass flow through the CV _mCV :
ma ¼Z ts
0_mCVdt ð6Þ
where ts implies an extension of the integration interval
to ts ts. It is defined as the smallest value of ts satisfyingthe following constraints:
xeðtsÞ xe;s ð7Þ
_mCV ðtsÞ ¼ 0 ð8Þ
Hence, the variable ts defines the instant when the
CV are closed and the pneumatic start is completed. This
definition accounts for the fact that the CV cannot be
closed and deactivated immediately when xe ¼ xe;s is
reached. In contrast to the fully variable valves used in
[9], the camshaft driven CV can only be deactivated if
/ 62 ½/CVO;/CVC�. Figure 6 visualizes the definitions of
ts and ts for a pneumatic engine start.
The scalar weighting function wðptÞ 0 only depends
on the initial tank pressure. It is used to select and penal-
ize specific initial tank pressures in the optimization.
Promoting high initial tank pressures results in an
inferior design for low initial tank pressures and vice
versa. A reasonable choice of wðptÞ is to make it large
at low initial tank pressures. For low initial tank pres-
sures, the air consumption can become a critical issue
during a drive cycle. On the other hand, if the initial tank
pressure is high, an increased air consumption can
be accepted. Special attention should be paid to fre-
quently occurring initial tank pressures during the drive
cycle.
2.1 Properties of the Optimization Problem
Due to the reciprocating behavior of the engine and the
highly nonlinear process model fPM the optimization
problem has special features. These are discussed below.
The feasible set is defined as:
XðptÞ :¼ f�jtsð�; ptÞ � ts;maxg ð9Þ
i.e., it contains all designs which fulfill the performance
constraint for the initial tank pressure pt. The smallest
initial tank pressure for which XðptÞ is not empty is
defined as the minimum tank pressure ~pt;X of the feasible
set. The tank pressures considered have to fulfill the
inequality ~pt ið Þ ~pt;X 8i. However, since the minimum
tank pressure is not known a priori, the choice of~pt is dif-ficult. This fact makes it also difficult to formulate a rea-
sonable weighting function wðptÞ, which ensures that the
correct tank pressure range is promoted or penalized.
Furthermore, the reciprocating behavior of the engine
implies a further difficulty for the solution of the optimi-
zation problem. The function ½ma; ts� ¼ fPM is piecewise
continuous in both the air mass and the start time. This
fact is shown by introducing the following consideration.
Let d1 and d2 be two designs with jd1 � d2j jj1 < e wherej�j jj1 denotes the infinity norm and e > 0 is a very small
number. Hence, the two designs differ just slightly. How-
ever, for specific choices of d1 and d2 the evaluation of
fPM ðdi; ptÞ for the same initial tank pressure yields com-
pletely different results. Such a discrepancy occurs when
xe;s is reached in different numbers of power strokes:
Npsðd1Þ 6¼ Npsðd2Þ. Thus, there is a discontinuity in ma
and ts between d1 and d2. Discontinuities in the objective
function can cause problems with numerical optimiza-
tion algorithms. Further details on this discontinuity
property are shown in Section 3.3 for a design example.
2.2 Solution to the Optimization Problem
Depending on the objective of the optimization and the
prior knowledge two solving methods are proposed,
namely numerical optimization and a brute-force
approach. For the numerical optimization, the Particle
TimeAir
cons
umpt
ion
ωe = const.Eng
ine
spee
d
0
0 ts
ts
ts
ts
ma
ωe,s
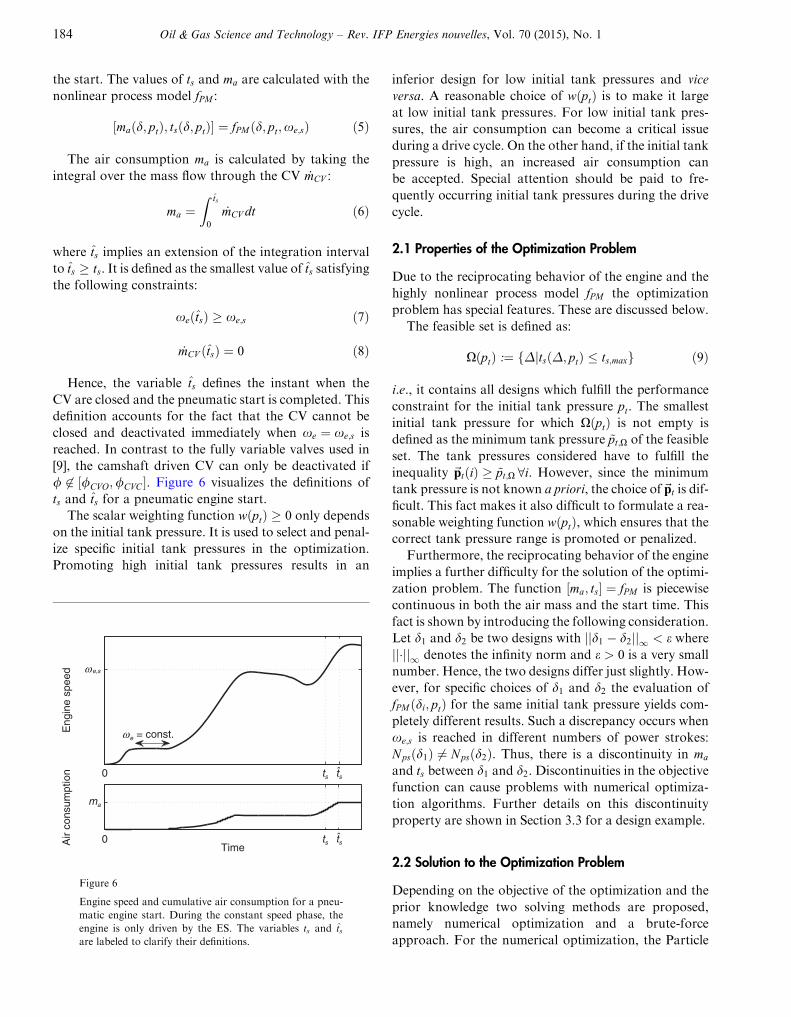
Figure 6
Engine speed and cumulative air consumption for a pneu-
matic engine start. During the constant speed phase, the
engine is only driven by the ES. The variables ts and tsare labeled to clarify their definitions.
184 Oil & Gas Science and Technology – Rev. IFP Energies nouvelles, Vol. 70 (2015), No. 1

Swarm Optimization (PSO) is proposed since it copes
well with the properties of the problem described above.
Table 1 lists the properties of the proposed methods. The
numerical optimization is suited if the minimum tank
pressure is known, such that ~pt can reasonably be
selected. The derivation of the optimal solution is rather
fast, and a precise solution is found.
In the brute-force approach the process model is
simulated for a multitude of CV design variables and
tank pressures. It is computationally more demanding.
Of course, the computational demand depends on the
coarseness of the considered grid. The advantage of
this method lays in the fact that the minimum tank
pressure does not need to be known in advance. It is
found within the approach. Furthermore, the simula-
tion results can be used for sensitivity analyses. The
precision of the solution is limited by the coarseness
of the grid.
In the following, the two solution methods are
explained. Regardless of the solving method, the specifi-
cations, i.e. xe;s and ts;max, have to be formulated first.
2.2.1 Numerical Optimization
If the minimum tank pressure ~pt;X is known, a reasonable
tank pressure range~pt and a reasonable weighting func-
tion can be defined. For the solution the PSO algorithm
presented in [11] is proposed.
2.2.2 Brute-Force
The brute-force approach visualized in Figure 7 starts
with the definition of a grid C ¼ f�; ptg on which the
process model is evaluated. Then, the evalution of the
process model on C follows. The computational effort
for the evaluation depends on the discretization chosen.
Given tsðCÞ ¼ fPM ðC;xe;sÞ, the feasible set X and the
minimum tank pressure ~pt;X can be derived. A reasonable
tank pressure range~pt and a reasonable weighting func-
tion thus can be defined.
The optimal solution d ¼ f/CVO;/
CVC ; d
CVg is found
by evaluating Equation (4) on the feasible set X. This
minimum search is computationally not demanding if~pt 2 C, i.e., if ~pt consists only of tank pressures that are
also part of C. Then, no further model evaluations are
necessary. Alternatively, a numerical optimization can
be conducted with the defined tank pressure range and
weighting function. It is computationally more demand-
ing than the minimum search on an already existing grid.
However, the solution is more precise.
3 DESIGN EXAMPLE
The following design example shows the application of
the CV design methodology presented. The engine under
consideration is a two-cylinder parallel twin engine. For
more details on the engine, see [9] where the same engine
was used. The specifications of the engine are given in
Table 2. The maximum CV lift is yCV ;max ¼ 4mm, which
corresponds to the value that can be performed on the
test bench engine. The IV acceleration aIV that guaran-
tees safe operation up to the maximum engine speed
xe;max is given in Table 2. By applying Equation (3),
the maximally allowable CV acceleration in the CA
domain is found to be aCV ¼ 3:04 � 10�5m=�CA2.
Specifications
The desired start engine speed is set to
xe;s ¼ xe;idle ¼ 1 200 rpm: The maximally allowable start
TABLE 1
Comparison of the solving methods
Method Numerical optimization Brute-force
Min. tank pressure Must be known Is found
Calculation time Fast Slow
Precision of solution High Lower
Sensitivity analysis Not suited Suited
Define specifications
ts,max, ω e,s
Define grid Γ
Evaluate fPM (Γ)
Define pt and w (pt)
Minimum searchNumerical optimization
Find Ω and pt, Ω˜
φ CVO ,∗ φCVC ,∗ dCV
∗
Figure 7
CV design procedure for pneumatic engine start.
M.M. Moser et al. / Design Methodology of Camshaft Driven Charge Valves for Pneumatic Engine Starts 185

time is chosen as ts;max ¼ 350ms. These specifications arein accordance with the values used in [5] and [9].
Grid Definition
The grid C considered in the design example is given in
Table 3.
Evaluation of the Process Model
In this step, the nonlinear process model fPM is evaluated
for C, which involves 13 872 model evaluations for the
grid considered.
Determination of the Feasible Set and its Minimum Initial TankPressure
The analysis of the simulation results yields a minimum
initial tank pressure of ~pt;X � 9:2 bar for dCV > 13 mm.
Figure 8 visualizes this result. It shows the minimum
start time achievable for fixed combinations of dCV and
pt. The bold 350 ms line indicates the boundary of the
feasible set in the pt-dCV subspace. All combinations of
initial tank pressures and CV diameters with
ts � 350 ms are part of the feasible set.On the test bench, CV with a diameter of
dCV ¼ 19mm are installed. This diameter is thus chosen
for the design example and kept as a fixed value through-
out the rest of the optimization procedure.
Definition of the Tank Pressure Range and the WeightingFunction
Based on the data depicted in Figure 8 the tank pressure
vector ~pt can be defined. In this example, only one tank
pressure close to the boundary of the feasible set is con-
sidered. Thus, no weighting is necessary:
TABLE 2
Design example parameterization
Parameter Variable Value Unit
Number of cylinders Ncyl 2 –
Displacement Vd 0.75 l
Bore diameter B 85 mm
Stroke S 66 mm
Connecting rod l 115 mm
Compression ratio e 9 –
Idling speed xe,idle 1 200 rpm
Max. engine speed xe,max 6 000 rpm
Max. start engine speed xe,s,max 1 500 rpm
Number of IV per cyl. NIV 2 –
Number of EV per cyl. NEV 1 –
Number of CV per cyl. NCV 1 –
IV closing CA /IVC –114 �CA
EV opening CA /EVO 114 �CA
IV acceleration aIV 0.19 9 10�5 m/�CA2
CV acceleration aCV 3.04 9 10�5 m/�CA2
CV diameter dCV 19.0 mm
Maximum valve lift yCV,max 4.0 mm
Initial engine position /0 �95 �CA
Tank volume Vt 30 l
Tank temperature #t 50 �C
TABLE 3
Grid C used in the design example.
Variable Lower bound Upper bound Step size
/CVO �110�CA 50�CA 10�CA
/CVC 60�CA 220�CA 10�CA
dCV 7 mm 21 mm 2 mm
pt 7 bar 12 bar 1 bar
600
300
350
550
500
450
400
ts (ms)
d CV (
mm
)
pt (bar)7 8 9 10 11 12
8
10
12
14
16
18
20
Figure 8
Minimum start time for various CV diameters and initial
tank pressures.
186 Oil & Gas Science and Technology – Rev. IFP Energies nouvelles, Vol. 70 (2015), No. 1

~pt ¼ f10 barg; wðptÞ ¼ 1 ð10Þ
Minimum Search and Numerical Optimization
According to the procedure described in Section 2, the
optimal CV design can be found by a minimum search
on the feasible set. Since the tank pressure considered
is on the grid, no further simulations are necessary.
Table 4 lists the values for the design variables found
by the minimum search and the PSO, respectively, for
dCV ¼ 19mm and pt ¼ 10 bar. The resulting valve tim-
ings found with the two methods are very close to each
other. The resulting start time is 350 ms. Thus, the max-
imum start time is fully exploited, and the solution lies
on the boundary of the feasible set. The number of
power strokes required to start the engine is Nps ¼ 4.Figure 9 shows the air consumption for the relevant
part of f/CVO;/CVCg 2 C and a tank pressure of 10 bar.
3.1 Discussion
The optimization procedure yields a CV opening angle
after TDC. This result is advantageous because the first
engine revolution would become critical if the CV was to
be opened before TDC and the initial tank pressure was
large, i.e. significantly larger than the in-cylinder pres-
sure at TDC. In that case, a negative torque would be
produced by the injection of pressurized air before the
piston passes TDC. If this torque exceeded the torque
produced by the ES, the engine could not be started
pneumatically.
Figure 9 clearly shows that a later closing of the CV is
unfavorable with respect to the air consumption. The
reason for this fact is that the opening angle of the EV
is at / ¼ 114�CA. A design where /CVC > 114�CAimplies that pressurized air flows from the CV directly
into the exhaust manifold. Such a design increases the
air consumption without producing significantly higher
torques.
Sensitivity Analysis
Based on the results depicted in Figures 8-10, a sensitiv-
ity analysis of the parameters in the set C can be
performed.
Figure 8 shows that for small CV diameters the mini-
mum tank pressure to satisfy ts � ts;max increases signifi-cantly. For small values of dCV less air can be transferred
through the CVs due to the flow restriction. Thus, the
torque is lower. The increased flow restriction needs to
be compensated by a higher density, i.e. a higher tank
pressure. For dCV > 14mm; the start time is almost con-
stant for a fixed tank pressure. Larger values of dCVmight be expected to result in more air being transferred
and hence in reduced start times. However, there is a
counteracting effect. For large valve diameters, the pres-
sure difference between tank and cylinder decreases rap-
idly once the CV is opened. This effect results in a
reduction of the mass flow rate.
Figure 10 shows the start time for various combina-
tions of /CVO and /CVC for fixed values of pt ¼ 10 barand dCV ¼ 19mm. The maximum start time on the grid
shown is equal to 370 ms, and it is indicated by a gray
triangle. The minimum start time is 341 ms and is indi-
cated by a black circle. Thus, the maximum start time
is 8% higher than the minimum start time, which indi-
cates a rather small sensitivity. Around TDC, the start
time ts is almost constant for varying CV opening angles.
TABLE 4
Optimal values of the design variables for dCV ¼ 19mm and pt ¼ 10 bar
Minimum search PSO
/CVO 10�CA 13.7�CA
/CVC 110�CA 110.1�CA
ma 10.15 g 10.13 g
ts 350 ms 350 ms
Nps 4 4
9.09.5
10.010.5
11.0
11.5
12.0
12.5
13.0
13.5
ma (g)
φ CVO (°CA)
φ CV
C (
°CA
)
Optimum
− 50 − 40 − 30 − 20 − 10 0 10 20 30100
110
EVO
120
130
140
Figure 9
Consumption of pressurized air for various CV opening
and closing angles with dCV ¼ 19mm and pt ¼ 10 bar. Theblack bold line denotes the boundary of the feasible set.
The label EVO denotes the EV opening angle. Black circle:
minimum air consumption. Gray triangle: maximum air
consumption.
M.M. Moser et al. / Design Methodology of Camshaft Driven Charge Valves for Pneumatic Engine Starts 187

On the other hand, the start time can be reduced by a
later closing of the CV.
The air consumption depicted in Figure 9 shows a
rather high sensitivity to the CV timing. In the CV timing
intervals depicted, the minimum air consumption is 8.7 g
(black circle). The maximum air consumption amounts
to 13.8 g (gray triangle), which is 58% larger. Analo-
gously to the start time, around TDC there is a small var-
iation of ma in terms of the CV opening angle. However,
the gradient of the air consumption as a function of the
CV closing angle points in the opposite direction of the
gradient of the start time.
These results allow the conclusion that a later closing
of the CV implies shorter start times but an increased air
consumption. Comparing the time optimal and air opti-
mal designs within the grid considered indicated by the
black circles in Figures 9 and 10 leads to the statement
that accepting an increase in the start time by 8% results
in an air saving of 36%.
3.2 Experiments
In order to verify the quality of the model and the CV
design found, the pneumatic start is implemented on a
test bench engine with the optimal CV timings obtained
from the design example. The CV are actuated by a
fully variable valve system which allows the emulation
of a wide variety of CV lift profiles. Figure 11 shows
the desired and the emulated CV lift profiles of both
cylinders for the engine start shown in Figure 12.
Figure 12 shows the engine speed trajectories for a
measured and a simulated pneumatic start. The limit
of ts ¼ ts;max ¼ 350ms is fully exploited, which corre-
sponds to the result predicted by simulation and
presented in Table 4. The pressure drop in the air
tank over the entire pneumatic engine start phase is
approximately 300mbar. The corresponding air mass
consumption is 10:5 g, which agrees with the value pre-
dicted by the process model. The discrepancy is 3%.
ts (ms)
365
360360
355
355
350
350
350
345
345
− 50 − 40 − 30 − 20 − 10 0 10 20 30100
110
120
130
140
φ CVO (°CA)
φ CV
C (
°CA
)
Figure 10
Start times for various CV opening and closing angles for
pt ¼ 10 bar and dCV ¼ 19mm. The bold black line denotes
the boundary of the feasible set where all combinations
above the line are feasible. Black circle: minimum start
time. Gray triangle: maximum start time.
y CV (
mm
)
CA (°)0 180 360 540 720 900 1 080 1 260
0
1
2
3
4
DesiredCylinder 2Cylinder 1
Figure 11
Desired and emulated CV lift profiles.
Eng
ine
spee
d(r
pm)
Time (ms)
0 50 100 150 200 250 300 3500
200
400
600
800
1 000
1 200
MeasurementSimulation
Figure 12
Measured and simulated pneumatic engine start.
188 Oil & Gas Science and Technology – Rev. IFP Energies nouvelles, Vol. 70 (2015), No. 1

Only four power strokes are required to reach the desired
final engine speed xe;s ¼ xe;idle ¼ 1 200 rpm. During the
first third of the start time, the engine is driven only by
the ES until /CVO is reached. This duration can only be
reduced by a more powerful ES.
The good agreement between measurement and
simulation data confirms the quality of the process
model.
3.3 System Analysis
3.3.1 Influence of the Initial Engine Position
The throttle strategy during the engine shutdown pre-
sented in Section 1.3 showed reliable results on the test
bench. In this section, the importance of the initial
engine position is highlighted by simulating the engine
start for various initial positions. Figure 13 shows the
resulting air consumption and start time data as a
function of the initial engine position /0. If the start
is initiated closer to the CV opening position the start
time is shorter because it takes less time until pressur-
ized air is injected and, thus, a high torque is applied.
Furthermore, the first CV opening lasts longer since
the engine speed is low. Hence, more air is injected,
which yields a higher torque. The influence of the start
position on the start time is significant. If the engine is
started from the BDC position, it takes 430 ms.
The start from the TDC position takes just 259 ms,
which is faster by 40%.
In contrast, the air consumption is not very sensitive
to the initial engine position. For the start positions
considered, an increase of just 5% can be observed.
The air consumption is rather constant for start posi-
tions from / ¼ �180�CA to / ¼ �120�CA. This can
be explained by the open IV, through which air is
blown out. The air consumption is highest if the initial
position is just before the CV opening because in this
case the engine speed and the cylinder pressure are
rather low during the first air injection. Hence, the
CV is open for a very long time and a lot of com-
pressed air is injected.
In conclusion, a good positioning of the engine during
the shutdown substantially influences the start time
while the air consumption is affected only slightly.
3.3.2 Variation of the Initial Tank Pressure
During the operation of the engine, the tank pressure
varies due to emptying and refilling of the air pressure
tank. In this section, the start performance of camshaft
driven CV with respect to the air used and the start dura-
tion is analyzed for various initial tank pressures. The
analysis is conducted for the optimal CV design with
/CVO ¼ 10�CA and /
CVC ¼ 110�CA using the process
model fPM . Figure 14 shows the results. The first subplot
shows the total amount of air used, ma, and the amount
of air used when the desired engine speed is reached
maðtsÞ. The second subplot shows the start time ts andthe time ts when the valves are closed. The third subplot
shows the number of power strokes Nps required to reach
the desired engine speed.
As stated in Equation (6), the amount of air used to
start the engine is calculated as the integral of the air
mass flow. Therefore, the same amount of air is used
whether a larger mass flow occurs for a short time
or whether a small mass flow exists for a longer time
duration. For instance, the air consumptions for initial
tank pressures of pt ¼ 9:3 bar and pt ¼ 12 bar, respec-
tively, are equal. However, the start times are differ-
ent.
Obviously, a higher tank pressure leads to a higher air
mass flow. The torque exerted is larger, which leads to a
shorter start time ts. The total amount of air ma used for
an engine start is a piecewise continuous function of the
tank pressure. The steps occur when the number of
power strokes changes. For an equal number of power
strokes the amount of air used increases along with an
increasing tank pressure mainly because the valve cannot
be closed when the desired engine speed is reached. If a
CV is available that can be deactivated immediately
the air consumption can be reduced to maðtsÞ. However,
the piecewise continuity remains.
φ 0 (CA)
ma
(g)
t s (m
s)
− 180 − 150 − 120 − 90 − 60 − 30 0
− 180 − 150 − 120 − 90 − 60 − 30 0
200
300
400
10.0
10.5
11.0
Figure 13
Air consumption and start time for various initial engine
positions /0 for /CVO ¼ 10�CA, /
CVC ¼ 110�CA,dCV ¼ 19mm and pt ¼ 10 bar.
M.M. Moser et al. / Design Methodology of Camshaft Driven Charge Valves for Pneumatic Engine Starts 189

CONCLUSION
A general design methodology for camshaft driven
charge valves used for pneumatic engine starts is pre-
sented. The design procedure is exemplified for a two-
cylinder engine, and the results are verified experimen-
tally. The discrepancy between the results predicted
and those obtained on the testbench is 3%.
Pneumatic engine starts enable significantly reduced
engine start times compared to those of conventionally
started engines. In contrast to conventional engine
starts, a large positive torque is produced already during
the first expansion stroke. Another advantage of pneu-
matic engine starts is the fact that they are applicable
on engines with port fuel injection as well as on those
with direct injection. Starting the engine without burning
any fuel also reduces the emission of hydrocarbons and
carbon-monoxide which are caused by the incomplete
combustion occurring at very low engine speeds.
In summary, pneumatic engine starts offer the possi-
bility to implement stop/start strategies that satisfy the
comfort demands of the driver without significantly
increasing the complexity and cost of the whole engine
system.
OUTLOOK
The pneumatic engine start treated in this paper was
investigated on a gasoline engine with port fuel injection.
However, the possibility to inject pressurized air directly
into the cylinders offers additional advantages for
engines with direct gasoline injection. As mentioned
e.g. in [6] and [7], the direct start using fuel injection into
the stopped engine suffers from the fact that a successful
start is guaranteed only for a limited range of engine rest
positions. The injection of pressurized air can be used to
extend the range of initial engine positions where the
direct engine start is guaranteed to be successful. Addi-
tionally, the pneumatically assisted engine start with
early direct fuel injection can help to further reduce the
start time. The combination of the pneumatic start
and the direct start is being considered in ongoing
research.
REFERENCES
1 Donitz C., Vasile I., Onder C., Guzzella L. (2009) DynamicProgramming for Hybrid Pneumatic Vehicles, AmericanControl Conference, 3956-3963.
2 Silva C., Ross M., Farias T. (2009) Analysis and Simula-tion of “Low-cost” Strategies to Reduce Fuel Consumptionand Emissions in Conventional Gasoline Light-duty Vehi-cles, Energy Conversion and Management, 215-222.
3 Zulch C.D. (2007) Konzepte fur einen sicheren Direktstartvon Ottomotoren, PhD Thesis, University of Stuttgart.
4 Rau A. (2009) Analyse und Optimierung des Ottomotori-schen Starts und Stopps fur eine Start Stopp Automatik,PhD Thesis, Technical University of Clausthal.
5 Fesefeldt T., Muller S. (2009) Optimization and Compari-son of Quick and Hybrid Start, SAE Technical Paper2009-01-1340.
6 Kulzer A., Laubender J., Lauff U., Mossner D., Sieber U.(2006) Direct Start – From Model to Demo Vehicle, MTZWorldwide. 67, 9, 12-15.
7 Kramer U. (2005) Potentialanalyse des Direktstarts fur denEinsatz in einem Stopp-Start-System an einem Ottomotormit strahlgefuhrter Benzin-Direkteinspritzung unter beson-derer Berucksichtigung des Motorauslaufvorgangs, PhDThesis, University of Duisburg-Essen.
8 Ueda K., Kaihara K., Kurose K., Ando H. (2001) IdlingStop System Coupled with Quick Start Features of Gaso-line Direct Injection, SAE Technical Paper 2001-01-0545.
9 Vasile I., Donitz C., Voser C., Vetterli J., Onder C.,Guzzella L. (2009) Rapid Start of Hybrid PneumaticEngines, Proceedings of the IFAC Workshop on Engineand Powertrain Control, Simulation and Modeling,E-COSM’09, IFP Energies nouvelles, Rueil-Malmaison,France, 30 Nov.-02 Dec, pp. 123-130.
pt (bar)
Nps
(-)
8 9 10 11 12 13 14 15
8 9 10 11 12 13 14 15
8 9 10 11 12 13 14 15
234567
200
300350400
500
600
6
8
10
12
14m
a (g
)t (
ms)
ma
ma (ts)
ts
ts
Figure 14
Air consumption, start time and number of power strokes
for various tank pressures for /CVO ¼ 10� CA,
/CVC ¼ 110� CA and dCV ¼ 19 mm. The black dot indi-
cates the optimal result of the design example.
190 Oil & Gas Science and Technology – Rev. IFP Energies nouvelles, Vol. 70 (2015), No. 1

10 Moser M., Voser C., Onder C., Guzzella L. (2012) DesignMethodology of Camshaft Driven Charge Valves for Pneu-matic Engine Starts, Proceedings of the IFAC Workshop onEngine and Powertrain Control, Simulation and Modeling,E-COSM’12, IFP Energies nouvelles, France, 23-25 Oct.,pp. 33-40.
11 Ebbesen S., Kiwitz P., Guzzella L. (2012) A Generic Parti-cle Swarm Optimization Matlab Function, Proceedings ofthe American Control Conference, Montreal, Canada,27-29 June, pp. 1519-1524.
12 Guzzella L., Onder C. (2010) Introduction to Modeling andControl of Internal Combustion Engine Systems, Springer,2nd ed.
13 Pischinger R., Krassnig G., Taucar G., Sams T. (1989)Thermodynamik der Verbrennungskraftmaschine, Springer,Wien, New York.
Manuscript accepted in November 2013
Published online in April 2014
Cite this article as: M.M. Moser, C. Voser, C.H. Onder and L. Guzzella (2015). Design Methodology of Camshaft DrivenCharge Valves for Pneumatic Engine Starts, Oil Gas Sci. Technol 70, 1, 179-194.
M.M. Moser et al. / Design Methodology of Camshaft Driven Charge Valves for Pneumatic Engine Starts 191

APPENDIX A: PROCESS MODEL
The most important relations used in the process model fPM are described in this appendix. The engine cylinders are
modeled as receivers with variable volume. Every cylinder i ¼ f1; :::;Ncylg has its crank angle position /i. For
/i ¼ 0� CA the piston is located at the TDC after the compression stroke.
Mass Balance
The air mass of every cylinder mcyl;i is determined by the mass flows _mk;i through each valve type k ¼ IV ;EV ;CVf g:
dmcyl;iðtÞdt
¼ _mIV ;i þ _mCV ;i � _mEV ;i ðA1Þ
Blow-by is neglected. According to [12] the mass flow through the valves is modeled as a compressible flow restric-
tion:
_mk;i ¼ cd � A � pupffiffiffiffiffiffiffiffiffiffiffiffiffiffiffiRa � 0up
p � w puppdown
� �ðA2Þ
where cd denotes the discharge coefficient, A is the maximal opening area of the valve, pup and pdown correspond to the
upstream and downstream pressures, respectively, 0up is the upstream temperature, Ra is the ideal gas constant of air
and wð:Þ is the flow function. For the discharge coefficient cd the relation of [13] is used, where it is defined as a func-
tion of the relative lift yCV=dCV . Figure A1 shows the relations for all engine valves.
The flow function wð:Þ is defined by:
wpuppdown
� �¼
ffiffiffiffiffiffiffiffiffiffiffiffiffiffiffiffiffiffij 2
jþ1
h ijþ1j�1
rfor pdown < pcr
pdownpup
h i1j
ffiffiffiffiffiffiffiffiffiffiffiffiffiffiffiffiffiffiffiffiffiffiffiffiffiffiffiffiffiffiffiffiffiffiffiffiffiffi2jj�1 1� pdown
pup
� �j�1j
sfor pdown pcr
8>>>>><>>>>>:
ðA3Þ
Dis
char
ge c
oeffi
cien
t (-)
Relative valve lift (-)
0 0.1 0.2 0.30
0.2
0.4
0.6
0.8
CV
EV
IV
Figure A1
Discharge coefficient as a function of the relative valve lift.
The relative valve lift is the ratio of the absolute valve lift
and the valve diameter.
192 Oil & Gas Science and Technology – Rev. IFP Energies nouvelles, Vol. 70 (2015), No. 1

where j is the ratio of the specific heats. The critical pressure pcr at which the flow reaches sonic conditions in the nar-
rowest part is given by:
pcr ¼2
jþ 1
jj�1
� pup ðA4Þ
Energy Balance
The internal energy balance of every cylinder is given by the enthalpy flows _Hk;i, the heat transfer and the instanta-
neous work done:
dUi
dt¼ _HIV ;i þ _HCV ;i � _HEV ;i � _Qi � pcyl;i � _Vcyl;i ðA5Þ
where _Qi is the heat transfer to and from the walls. The cylinder volume Vcyl;i depends on the cylinder’s crank angle
position
Vcyl;ið/iÞ ¼ Vcyl;TDC þ Acyl � ðl þ r � ð1� cos/iÞÞ � Acyl �ffiffiffiffiffiffiffiffiffiffiffiffiffiffiffiffiffiffiffiffiffiffiffiffiffiffiffiffiffiffil2 � r2 � sin2 /i
q� �ðA6Þ
where r is the crank radius, l is the length of the connecting rod and Acyl is the piston area. The cylinder temperatures
and pressures are calculated using the definition of the internal energy:
0cyl;i ¼ Ui
mcyl;i � cv;a ðA7Þ
and the ideal gas equation:
pcyl;i ¼mcyl;i � Ra � 0cyl;i
V cyl;iðA8Þ
respectively, where cv;a is the specific heat of air at constant volume. The instantaneous torque Ti of each cylinder is
defined as:
Ti ¼ pcyl;i � Acyl � r � sin/i þr2 � sin/i � cos/iffiffiffiffiffiffiffiffiffiffiffiffiffiffiffiffiffiffiffiffiffiffiffiffiffiffiffiffiffiffil2 � r2 � sin2 /i
q264
375 ðA9Þ
Conservation of Angular Momentum
The law of the conservation of angular momentum determines the engine’s acceleration:
J e � dxe
dt¼
XTi � TfricðxeÞ þ TESðxeÞ ðA10Þ
where J e is the engine’s inertia and Tfric is the friction torque. The engine speed xe is the time derivative of any crank
angle:
d/i
dt¼ xe ðA11Þ
M.M. Moser et al. / Design Methodology of Camshaft Driven Charge Valves for Pneumatic Engine Starts 193

APPENDIX B: CATALYST TEMPERATURE
This section discusses the influence of the pneumatic start on the catalyst temperature which is an important issue for
the implementation.
During the pneumatic engine start, the pressurized air from the tank is expanded in the cylinder to produce a torque
that accelerates the engine. This expansion decreases the temperature of the gas flowing through the catalyst. The cold
gas might lower the catalyst temperature leading to an efficiency drop of the latter.
Due to the lack of a catalytic converter on the test bed no analysis has yet been performed. Here, several qualitative
arguments are given on how the temperature of the catalyst is influenced. Firstly, the number of pneumatic power
strokes to start the engine is only 2-6 as shown in Figure 14. Hence, the total amount of cold gas leaving the cylinders
is very low. Secondly, the cold gas will be heated up by the hot exhaust pipes before it reaches the catalyst. If the cool-
ing of the catalyst remains an issue, the number of pneumatic power strokes can be further reduced by an earlier
switch to the combustion mode during the engine start.
APPENDIX C: INFLUENCE OF THE AIR TEMPERATURE IN THE TANK
During the operation of the engine also the air temperature in the tank can vary. However, according to the arguments
mentioned in Section 2 the relative variation of the tank temperature is restricted to a significantly smaller range than
the relative variation of the tank pressure. Hence, a variation of the tank temperature is not taken into account in the
design methodology. To justify this simplification the optimal CV design is computed for various tank temperatures
using the PSO algorithm. The results are shown in Figure A2. The two top plots show that the resulting optimal CV
timings only vary within a very small range. For all design temperatures, the resulting start time is ts ¼ 350 ms. Thebottom plot of Figure A2 shows that the air mass used increases with lower temperature due to the temperature
dependence of the air density.
The dashed line shows the air consumption of the design given in Table 4 for various temperatures. This design has
a slightly lower air consumption but the start time ts is 1-4 ms above the limit ts;max ¼ 350ms.
ma
(g)
ϑ t (°C)
10 20 30 40 50
10 20 30 40 50
10 20 30 40 50
10
11
12
110.0
110.5
111.0
13
14
15
φ CV
C (
°CA
)∗
φ CV
O (
°CA
)∗
Design exampleTemp. dep. design
Figure A2
Optimal CV timings and resulting air consumption
obtained for CV designs optimized at the respective tank
temperature (temp. dep. design). The air consumption
obtained with the design given in Table 4 is also shown
(design example). This design yields a slightly lower air con-
sumption but exceeds the maximum start time limit ts;max by1-4 ms at temperatures below 50�C.
194 Oil & Gas Science and Technology – Rev. IFP Energies nouvelles, Vol. 70 (2015), No. 1


