Design, Manufacturing, Certification and Testing of Small Propellers
33
Design, Manufacturing, and Testing of Small Propellers: Propeller Certification Process Adam Thomas Michael Lopez July 25, 2014 Department of Aerospace Engineering
-
Upload
michael-lopez -
Category
Documents
-
view
36 -
download
0
Transcript of Design, Manufacturing, Certification and Testing of Small Propellers

Design, Manufacturing, and Testing of Small
Propellers:
Propeller Certification Process
Adam Thomas
Michael Lopez
July 25, 2014
Department of Aerospace Engineering
Georgia Institute of Technology
Atlanta, GA 30332

SummaryFor the design, rapid prototyping, and manufacturing of small propeller
research, small propeller blades are milled out of American Sitka Spruce and placed in an aluminum hub to obtain test data. These propeller blades and testing equipment are operated near their failure limits to obtain the most amount of data possible. Anytime a device is near its physical limit, risk of failure becomes more prominent. Because the propellers are rotating at high speeds, injury to personnel and damage to testing equipment is possible.
Risk in injury to personnel and damage to testing equipment can be minimized by incorporating a proper safety plan. By assessing the possible risks and the likelihood of their presence, the safety plan can be practical while still retaining high level of risk mitigation. With the testing of small propellers at high RPM, propeller failure is the highest possibility of creating danger. A certification and documentation process has been implemented to maximize safety. If followed properly, risk of failure to the propeller can be greatly reduced.
ii

Table of ContentsSummary.................................................................................................... ii1. General.................................................................................................1
1.1. Purpose............................................................................................11.2. Principles........................................................................................1
2. Scope of Procedure..............................................................................12.1. Outline of Process...........................................................................12.2. Testing Environment......................................................................1
2.2.1. Test Box.....................................................................................12.2.1.1. Materials and Construction.....................................................22.2.2. Data Test Stand........................................................................22.2.2.1. Materials and Construction....................................................2
2.3. Propeller Materials.........................................................................32.3.1. Blades........................................................................................32.3.2. Hub...........................................................................................3
3. Certification Process............................................................................43.1. Certification Process Outline..........................................................43.2. Requirements..................................................................................4
3.2.1. Limits.........................................................................................43.2.1.1. Propeller..................................................................................53.2.1.2. Motor......................................................................................53.2.1.3. Stresses on Wood....................................................................53.2.1.4. Thrust and Torque Gauge.......................................................5
3.3. MATLAB Code.................................................................................63.3.1. Assumptions..............................................................................63.3.2. Formulas used...........................................................................63.3.3. RPM Plots and maximum RPM value........................................8
3.4. Certification Test..........................................................................103.5. Stamp of Approval........................................................................11
3.5.1. Physical Label..........................................................................113.5.2. Documentation........................................................................11
4. Post-Certification Testing...................................................................114.1. Post-Certification Precautions......................................................114.2. Pre-Test Check off........................................................................12
4.2.1. Weight.....................................................................................124.2.2. Physical Inspection.................................................................124.2.3. Hub Fit....................................................................................12
5. Conclusion..........................................................................................12Appendix...................................................................................................13
iii
List of FiguresFigure 2-1: Safety Test Box and Test Stand....................................................2Figure 2-2: Hub Assembly...............................................................................4Figure 3-1: Thrust/Torque Gauge....................................................................6
List of TablesTable 3-1: Thrust vs RPM................................................................................9Table 3-2: Torque vs RPM...............................................................................9Table 3-3: Stress vs RPM...............................................................................10Table 3-4: Watts vs RPM................................................................................10Table 3-5: Example MATLAB Output.............................................................11
iv
1. General
1.1.Purpose
During data acquisition of small propellers, it is important to extract the most amounts of data possible from a given propeller. To receive the most data, the propeller and testing instruments must be pushed to their physical limits. Although known properties and calculations can be used to predict the fail-point of the propeller and system, a physical test beyond data acquisition testing speeds are essential for the safety of personnel and equipment. A propeller certification process was created to ensure safe data acquisition testing.
1.2.Principles
Basic principles used while studying the mechanics of materials as well as principles from physics were incorporated to predict the failure point for a given propeller as well as the testing equipment. The formulas used for these calculations are discussed in more detail in section 3.3.2.
2. Scope of Procedure
2.1.Outline of Process
The propeller begins as an .STL file that is created by a given set of parameters using MATLAB in conjunction with SolidWorks. The .STL file is then loaded into a CNC program, which is used to make a physical model of the propeller created. Once the physical propeller is created, it will be ran through a certification process, then used to extract data through a testing process. This data received will be used to compare the results from the physical propeller to the theoretical results calculated using the propeller’s ideal geometries. A high definition three-dimensional scan of the physical propeller will also be taken to compare the deviation in the physical propeller geometries compared to the ideal propeller geometries. The geometry deviation along with the difference in real versus calculated data will be applied to optimize the analytic methods used to predict accurate performance results for a given propeller design.
2.2.Testing Environment
The testing will be conducted in an enclosed lab setting for both the certification procedure as well as the static data acquisition testing process. A wind tunnel will be used for varying free airstream velocity data acquisition testing.
1
2.2.1. Test Box
A test box will be used only during the propeller certification process to house the propeller and test stand in case a failure occurs. This box is designed to contain propeller fragments, should a propeller break during the certification process.
2.2.1.1. Materials and Construction
The test box was designed to minimize complexity and size to allow any user to confidently assemble and easily store when not in use. The test box consists of two main parts, the base and the safety box.
The base is made of ¾” medium density fiberboard (MDF) to assure a strong, sturdy base to mount the certification test stand to. The certification test stand design similar to the design to the data acquisition test stand but excludes the thrust/torque gauge. The certification test stand is to remain attached to the base at all times, including during storage, to increase consistency and to reduce the risk of a created error.
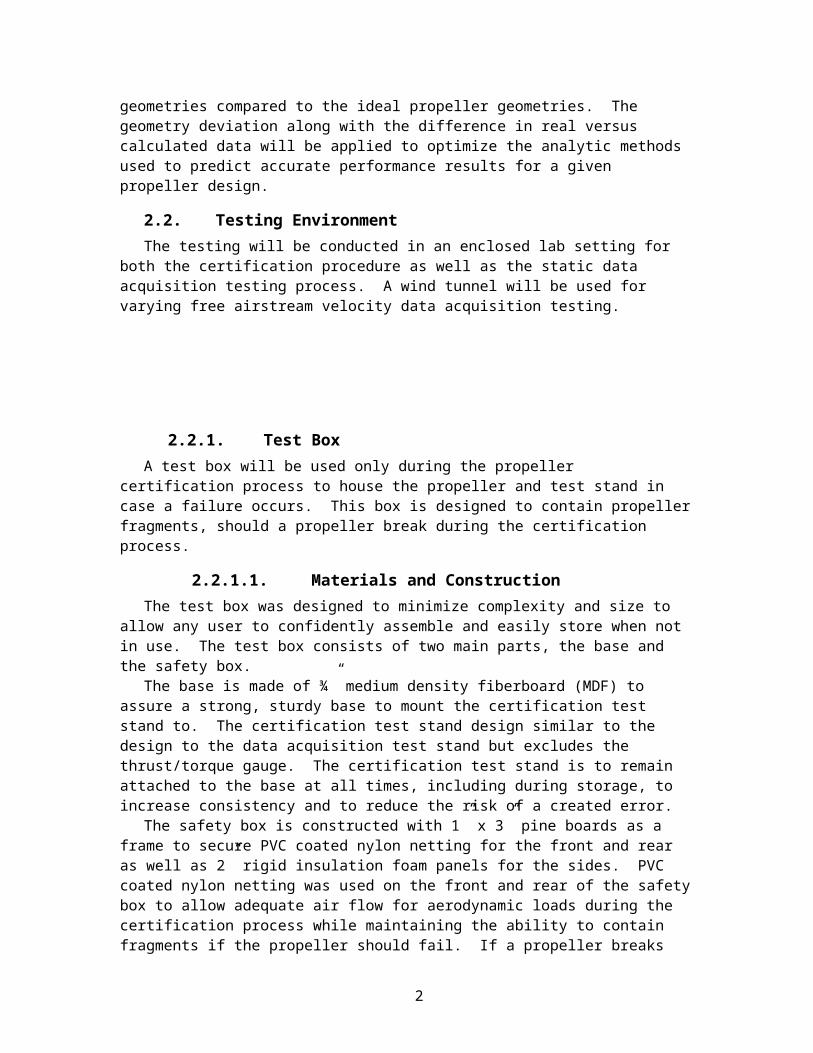
The safety box is constructed with 1” x 3” pine boards as a frame to secure PVC coated nylon netting for the front and rear as well as 2” rigid insulation foam panels for the sides. PVC coated nylon netting was used on the front and rear of the safety box to allow adequate air flow for aerodynamic loads during the certification process while maintaining the ability to contain fragments if the propeller should fail. If a propeller breaks during the certification process, the majority of the propeller will travel outward in the plane of the propeller rotation. For this reason, the sides of the safety box are constructed with 2” rigid insulation panels to absorb the impact of the propeller fragments, while maintaining an overall solid formation.
2

Figure 2-1: Safety Test Box and Test Stand
2.2.2. Data Test Stand
The data test stand is completely separate from the certification test stand and safety box. A thrust/torque gauge is mounted between the test stand frame and the electric motor that holds the propeller. The thrust/torque gauge substantially limits the amount of forces allowed by the system. Therefore, this stand is used for the collection of test data and should not be used for the certification process.
2.2.2.1. Materials and Construction
To minimize on aerodynamic interference to the propeller, the data test stand is streamlined, placing the propeller well ahead of the support structure. Because this stand is used for static testing as well as wind tunnel testing, the height of the propeller is set at 21”, which is ½ of the inner wind tunnel height. A ¾” plywood base is used to hold the support structure steady during testing. To assure a rigid yet streamlined support structure, ¾” galvanized steel pipe is used. The support structure is rigidly connected to the thrust/torque gauge, which on its other side is mounted rigid to the electric motor that holds the propeller.
2.3.Propeller Materials
The propeller consists of two parts, the hub and the blades. The hub is mounted to the electric motor through its center and holds each of the two blades at its ends by way of a dovetail joint. With this design, larger diameter propellers can be milled with the same length limitations presented by the CNC machine because the limitation only applies to one blade at a time as opposed to the entire propeller. It also allows the possibility of testing specific blades at different pitch angles by simply changing to a hub that holds the dovetail joints at a different angle. Milling
3
time is also reduced when making a propeller because the hub no longer needs to be milled with the blades.
2.3.1. Blades
The blades are made of American Sitka Spruce, which is a soft wood with minimum grain defects and good flexibility characteristics. The small amount of grain defects increases consistency between blades, decreases risk of failure due to propeller material, and allows for a quality propeller to be milled, reducing the amount of geometry deviation from the ideal design geometry.
The cross-sectional area of the dovetail joint limits the amount of aerodynamic force allowed to the propeller blades. The neck of the dovetail joint has the smallest cross-sectional area of the dovetail joint yet experiences the greatest amount of torque to do thrust and friction because the neck is where the aerodynamic load is transferred from the blade to the hub. The hub size limits the maximum cross-sectional area of the dovetail joint’s neck because of its own size limitations. The maximum width of the dovetail neck is 3/8” to allow the hub to maintain a thickness of ½” for mounting to the motor shaft. The height of the dovetail neck is also 3/8”, which allows a 1/8” flare for adequate support of the blade inside the hub mount. Although the height of the dovetail neck can be increased, the tradeoff results in a larger hub, which will affect the amount of torque to the electric motor.
2.3.2. Hub
The hub is a two-piece aluminum system held together by the motor shaft nut that sandwiches the blades at a dovetail joint at each end as seen in Figure 2-2. Because the hub is made of aluminum as opposed to the wood blades, stress due to aerodynamic loads by the propeller blades is neglected.
Figure 2-2: Hub Assembly
3. Certification Process
4
The certification procedure will qualify a given propeller at a certain data acquisition test RPM by testing the propeller at a higher RPM in a safe, controlled environment.
3.1.Certification Process Outline
The propeller’s geometries are loaded into a MATLAB function, StressFailureTest.m, along with the test system’s limitations. StressFailureTest.m then calculates the maximum RPM, with a safety factor of two, based on the system’s limitations and the predicted aerodynamic loads. Once the maximum RPM is established, the propeller is tested inside the test box at the maximum allowed RPM. If the propeller successfully completes the maximum RPM test without failure or physical damage, it is certified to continue for data acquisition testing at 75% maximum RPM. After testing, the propeller blades are properly stored and inspected for changes in weight and physical appearance before future testing.
3.2.Requirements
The certification procedure is implemented to ensure the safety of personnel and equipment while receiving the maximum amount of data allowed by the system’s physical limitations. It is imperial to capture the most data possible for the accuracy of the actual data when comparing actual data to theoretical data.
3.2.1. Limits
There are two types of limits to account for during testing. Depending on the design of the propeller being tested, stall may occur before any physical system limitations are met. If this is the case, an increase in friction will present itself in the form of torque, while thrust will rapidly decrease. When stall occurs, data past this point is not of use and testing should cease. The other type of limitation is the physical limits of the testing equipment and propellers. These limits require attention because if met, injury to personnel or damage to equipment could result.
3.2.1.1. Propeller
The propeller is limited by the amount of aerodynamic load accepted due to the small cross-sectional area of the dovetail neck. Because the neck is the location that transfers the aerodynamic load from the blades to the hub, the greatest amount of torque due to thrust and friction is experienced here as well as the axial force caused by the rotating mass of the propeller blades. With the neck being weakest point on the propeller blade, calculations are simplified because the location of failure is known.
Propeller diameter is restricted to 10” due to the force limitations presented by the blade neck and other testing equipment. Although the CNC machine is capable of milling propellers up to 24”, the data received from the current test equipment would be limited to low RPM, which would be of little use.
3.2.1.2. Motor
5

The electric motor used, an E-Flite Power 10 Brushless Outrunner, has been tested for 7800 RPM at 357 Watts with an average duration of 6-9 minutes according to its manufacturer. However, during testing a maximum of 375 Watts for 2-3 minutes is acceptable to maintain longevity of the motor.
3.2.1.3. Stresses on Wood
American Sitka Spruce has an ultimate tensile strength of 230 psi perpendicular to the grain and a modulus of rupture of 5.50 ksi in static bending. For this reason, propeller blades are machined with its length in the direction of the wood grain to maximize allowable stresses on the wood by directing the forces perpendicular to the grain. During testing of the propellers, axial load is much smaller than the torques produced by thrust and friction; therefore more emphasis is place on the modulus of rupture while the ultimate tensile strength is ignored.
3.2.1.4. Thrust and Torque Gauge
The thrust/torque gauge assembly is made of two separate gauges milled from aluminum, fastened together by their hubs in the center while the outer rings are attached to the motor and test stand. Each gauge is milled such that deformation will occur in four thin sections of aluminum connecting the hub to its outer ring. One gauge is designed to deform only when thrust occurs while the other gauge is to deform only by a torque. Strain gauges are mounted to both sides of each thin aluminum sections and wired in a wheatstone bridge configuration to translate strain in the aluminum to thrust and torque. The gauge is calibrated using a variety of known weights for both thrust and torque directions.
Figure 3-3: Thrust/Torque Gauge
6

3.3.MATLAB Code
3.3.1. Assumptions
In this analysis of the propeller stresses, certain assumptions were necessary to simplify calculations. As this is only a rough estimation of stresses and max RPM value, a safety factor is included to ensure that any errors or variations from theoretical values are still well within the acceptable range.
Within the calculations, each stress is measured at only one point along the propeller blade axis. Although there will be stress throughout the blade, the point chosen is the location for the theoretical maximum stress value. This maximum value is then transformed into the corresponding value at the root of the blade. The stress due to thrust and torque are measured at the aerodynamic center of the blade. The distance to this location is assumed to be 70% of the radius of the propeller. The centrifugal force is calculated at the center of gravity of the blade. The distance to this location is assumed to be 38% of the radius of the propeller.
3.3.2. Formulas used
In order to obtain an estimation of the propeller strength as well as the maximum safe testable RPM and its corresponding limiting factor, MATLAB was used to analyze the stresses on the propeller. These stresses were computed at their maximum value locations and then transformed into the corresponding stress at the root of the propeller blade, where failure is most likely.
In order to compute theoretical stress values for these propellers, data was taken from the University of Illinois at Urbana-Champaign (UIUC) propeller database by use of propeller_database_example.m. The data used from the UIUC database was the coefficient of thrust and coefficient of torque values for a specific set of RPM’s based on propellers of similar design to those being tested here. Based on these values and the RPM range used by UIUC, data for coefficient of thrust and coefficient of torque the testing RPM range is either interpolated or extrapolated depending on whether it lies inside or outside the UIUC data range. This is accomplished with the created static_data function within StressFailureTest.m. From this, the corresponding thrust and torque values can be obtained via these equations.
T=CT∗ρa∗n2∗d4
Q=C P∗ρa∗n2∗d5
These aerodynamic forces are then transformed into bending moments via the following equations.
M y '=−Q∗xac−xroot
xac
M z '=T∗(xac−xroot)
7

The prime designation is due to the fact that the blade root is not at the origin of the x-axis. It is on the positive x-axis at the point x = xroot. The moments of inertia for these y’ and z’ axes are calculated as:
Iy '= 112
∗b∗h3
Iz'= 112
∗h∗b3
The most likely points of failure for this propeller design are the corners at the root of the blade. Therefore, the stress is calculated at each corner independently using the property of superposition. Corner 1 is designated to be the top left corner, corner 2 is designated to be the top right corner, corner 4 is designated to be the bottom left corner, and corner 4 is designated to be the bottom right corner. All of these designations are made with the blade being oriented along the positive x axis with the root being closer to the origin. The positive y-axis is oriented to the right when looking along the x-axis from root to tip. The positive z-axis is oriented up from this same view. With this in mind, the equations used to calculate the stress at the corners of the propeller root become the following:
σ y 1=M y '∗z1I y '
σ y 2=M y '∗z2I y '
σ y 3=M y '∗z3I y '
σ y 4=M y '∗z4I y'
σ z1=M z '∗ y1I z '
σ z2=M z '∗y2I z '
σ z3=M z '∗y3I z '
σ z4=M z '∗y4I z '
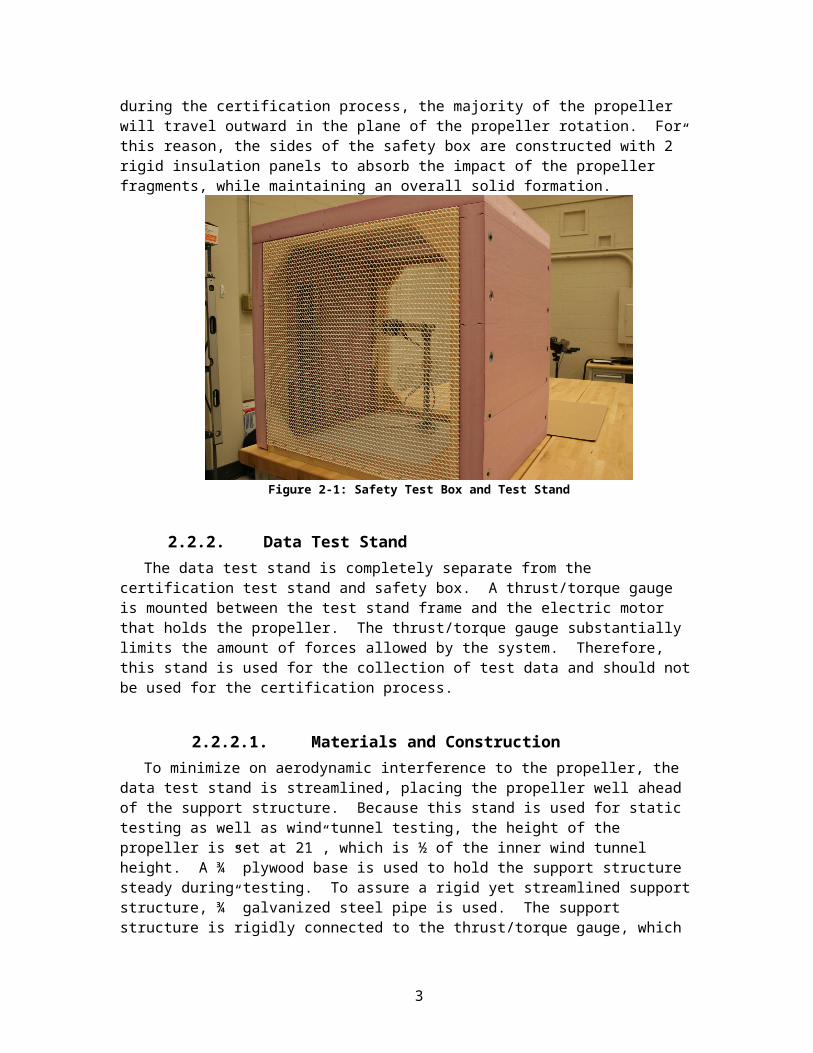
Finally, the stress due to centrifugal force, or axial stress, will be equal at all of these corners. This stress is calculated with the following equations.
v=2∗π∗RPM60
∗xcg
8

F c=m∗v2
xcg
σ A=Fcb∗h
All of these calculated stresses can then be added together using the principle of superposition to obtain the final stress value at each corner.
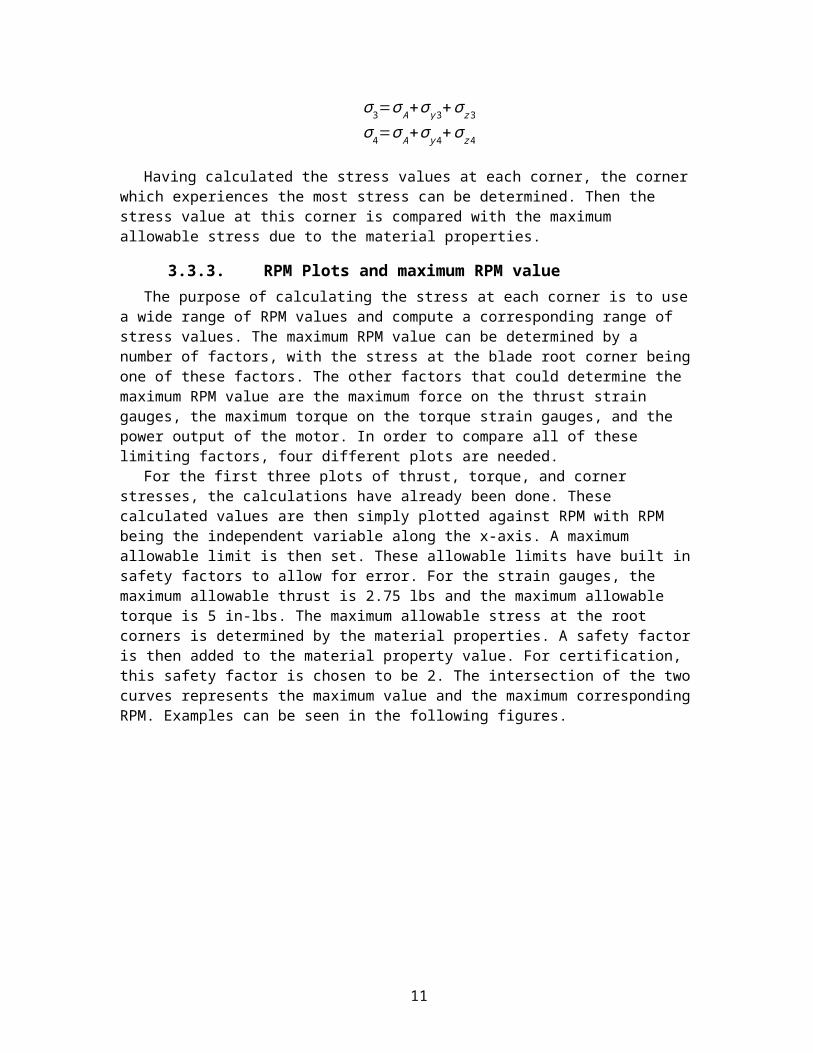
σ 1=σ A+σ y 1+σ z1σ 2=σ A+σ y 2+σ z2σ 3=σ A+σ y3+σ z3σ 4=σ A+σ y 4+σ z 4
Having calculated the stress values at each corner, the corner which experiences the most stress can be determined. Then the stress value at this corner is compared with the maximum allowable stress due to the material properties.
3.3.3. RPM Plots and maximum RPM value
The purpose of calculating the stress at each corner is to use a wide range of RPM values and compute a corresponding range of stress values. The maximum RPM value can be determined by a number of factors, with the stress at the blade root corner being one of these factors. The other factors that could determine the maximum RPM value are the maximum force on the thrust strain gauges, the maximum torque on the torque strain gauges, and the power output of the motor. In order to compare all of these limiting factors, four different plots are needed.
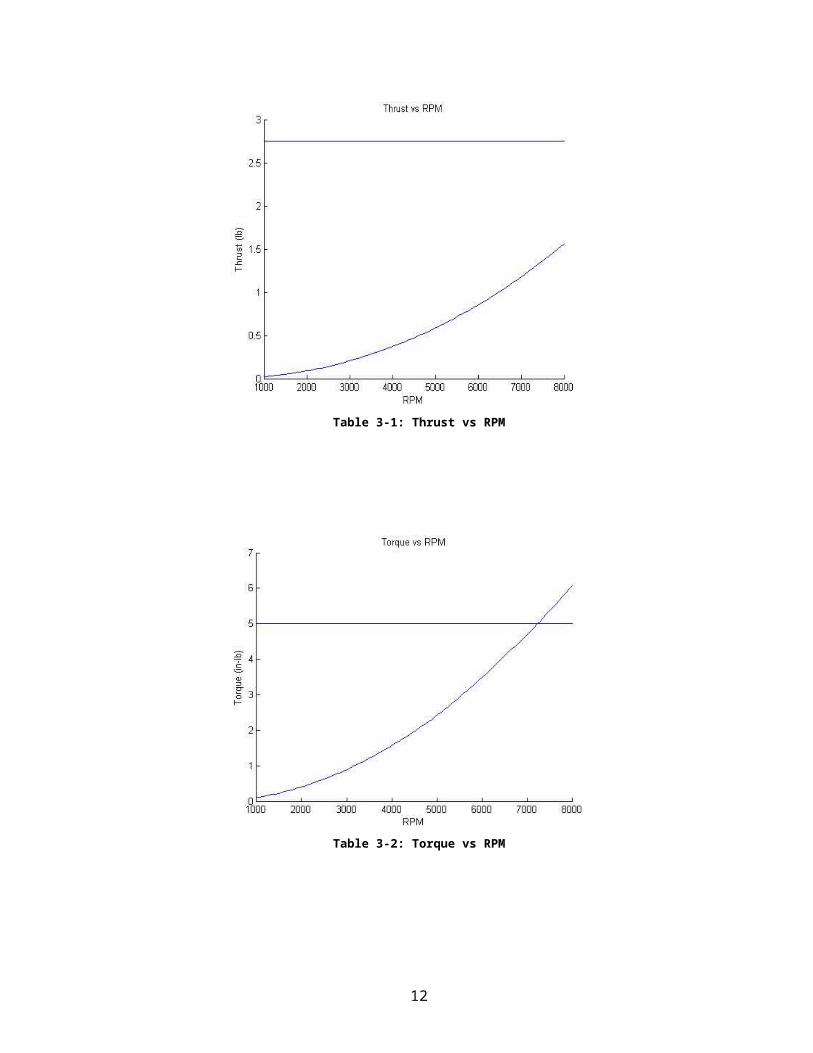
For the first three plots of thrust, torque, and corner stresses, the calculations have already been done. These calculated values are then simply plotted against RPM with RPM being the independent variable along the x-axis. A maximum allowable limit is then set. These allowable limits have built in safety factors to allow for error. For the strain gauges, the maximum allowable thrust is 2.75 lbs and the maximum allowable torque is 5 in-lbs. The maximum allowable stress at the root corners is determined by the material properties. A safety factor is then added to the material property value. For certification, this safety factor is chosen to be 2. The intersection of the two curves represents the maximum value and the maximum corresponding RPM. Examples can be seen in the following figures.
9

Table 3-1: Thrust vs RPM
Table 3-2: Torque vs RPM
10

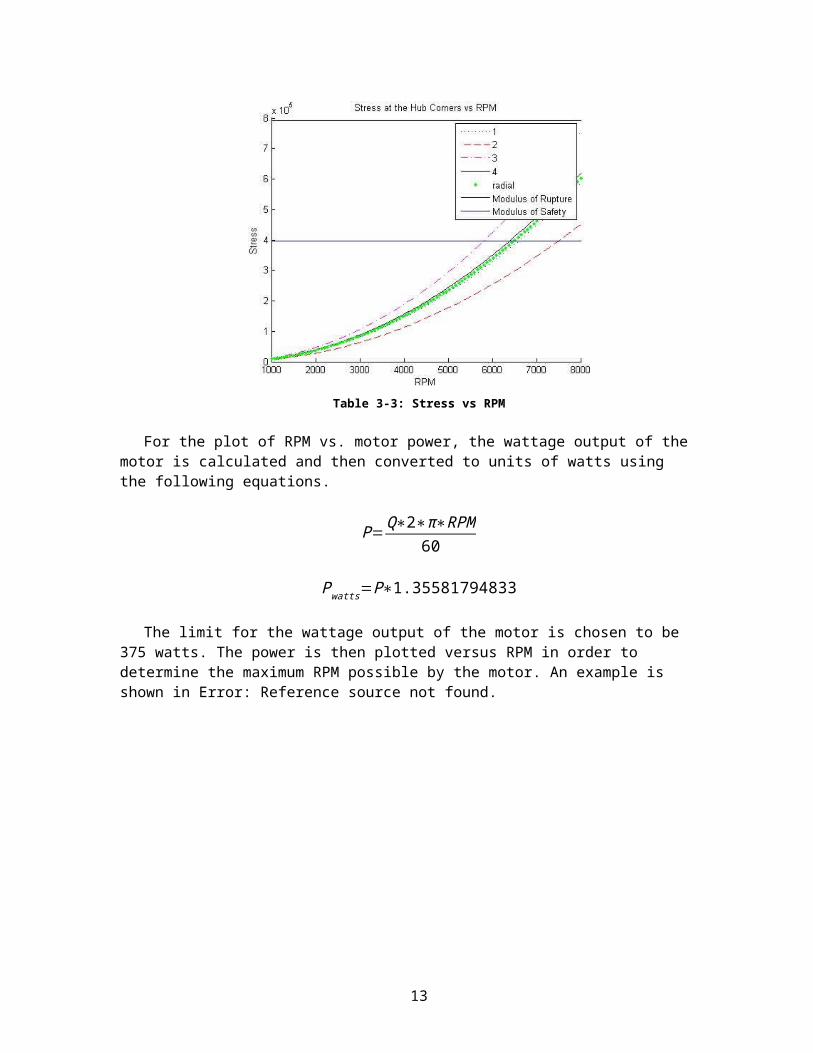
Table 3-3: Stress vs RPM
For the plot of RPM vs. motor power, the wattage output of the motor is calculated and then converted to units of watts using the following equations.
P=Q∗2∗π∗RPM60
Pwatts=P∗1.35581794833
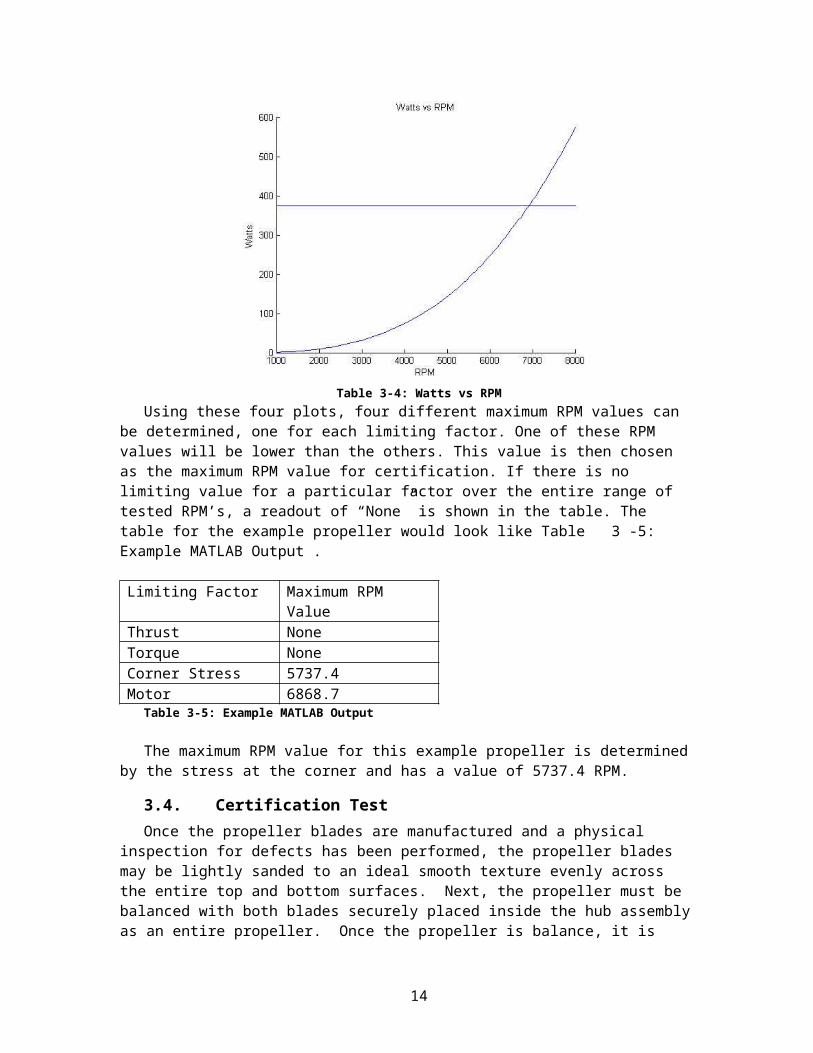
The limit for the wattage output of the motor is chosen to be 375 watts. The power is then plotted versus RPM in order to determine the maximum RPM possible by the motor. An example is shown in Error: Reference source not found.
11
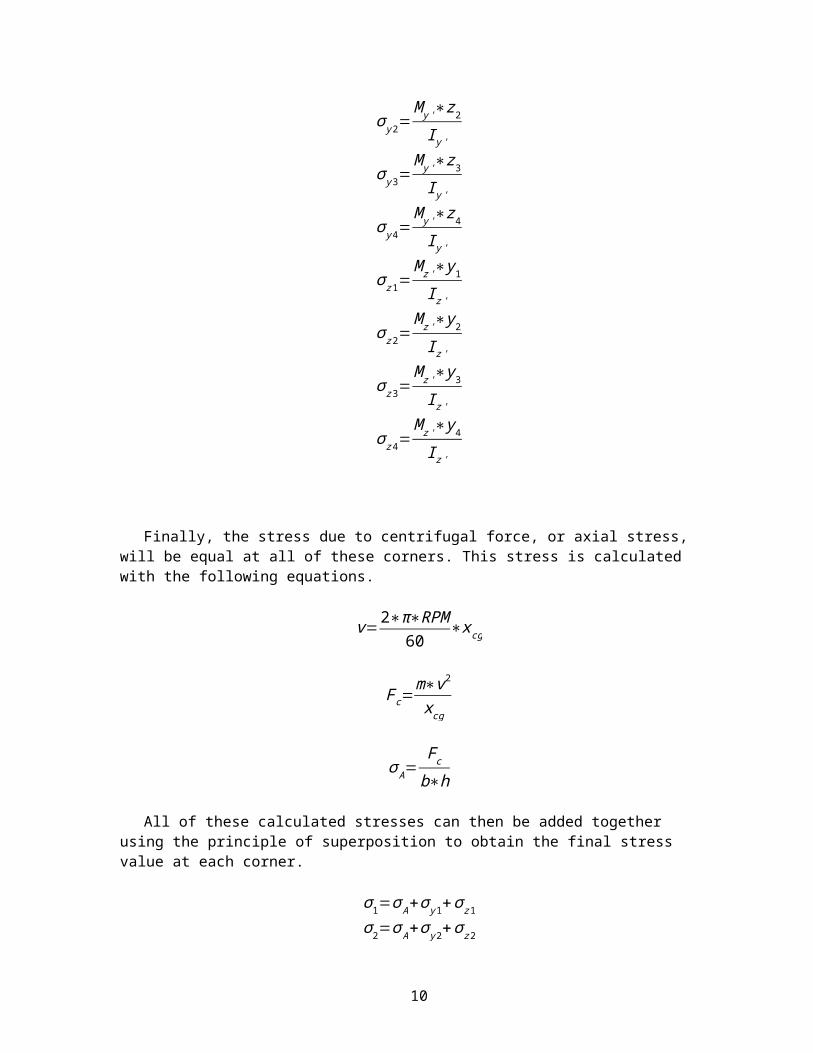
Table 3-4: Watts vs RPMUsing these four plots, four different maximum RPM values can be
determined, one for each limiting factor. One of these RPM values will be lower than the others. This value is then chosen as the maximum RPM value for certification. If there is no limiting value for a particular factor over the entire range of tested RPM’s, a readout of “None” is shown in the table. The table for the example propeller would look like Table 3-5: Example MATLAB Output .
Limiting Factor Maximum RPM Value
Thrust NoneTorque NoneCorner Stress 5737.4Motor 6868.7
Table 3-5: Example MATLAB Output
The maximum RPM value for this example propeller is determined by the stress at the corner and has a value of 5737.4 RPM.
3.4.Certification Test
Once the propeller blades are manufactured and a physical inspection for defects has been performed, the propeller blades may be lightly sanded to an ideal smooth texture evenly across the entire top and bottom surfaces. Next, the propeller must be balanced with both blades securely placed inside the hub assembly as an entire propeller. Once the propeller is balance, it is installed onto the electric motor shaft using the prop adaptor with collet that is supplied by the motor manufacturer. The test box is placed over the test stand assembly with the PVC coated nylon netting in front and behind the propeller to allow adequate airflow through the propeller disk. A weight should be placed on top of the test box to ensure it remains firmly on the ground during the event of a propeller failure. Once the test box is installed, the motor should begin to spin at a low RPM to
12
verify that the RPM sensor is working properly. If the RPM sensor is working properly, slowly increase the motor speed until the maximum certification test RPM is reached or until a failure occurs. Once the power is turned off to the electric motor, the propeller should be removed from the motor shaft and the propeller blades removed from the hub. After a physical inspection for damage of the propeller blades, paying special attention to the neck of the dovetail joint, the propeller blades should be stored in its proper position and location. The certification process should be documented in the propeller log.
3.5.Stamp of Approval
Although an actual stamp of approval will not be provided to a propeller for being certified, each propeller will have a unique physical identification label that will be documented in the propeller log for its certification
3.5.1. Physical Label
A number will be milled on the dovetail joint of each propeller blade during the manufacturing process. Each set of propeller blades will have matching numbers unique to only one propeller.
3.5.2. Documentation
Documentation is an important step in the certification process. A proper, detailed log that is kept up to date increases overall safety by allowing all personnel at any given time access to the history and characteristics of any propeller.
A current log should be available at all times in the lab with documentation of all propellers. This log includes .STL filename, manufacture date, certification date, certification RPM, data acquisition RPM, certification weight, and dates of post-certification testing.
4. Post-Certification TestingA propeller passing the certification test does not guarantee a safe
operation for the life of the propeller. Several factors can affect a propellers curing process, which may result in a less qualified propeller than tested during the certification process.
4.1.Post-Certification Precautions
There are several precautions to be aware of before testing a propeller after its certification process. These precautions include changes that cannot be controlled such as the curing of the wood as well as situations that can be minimized by personnel.
Depending on the level that the wood has been cured prior to machining as well as the humidity level in the storage location, the wood has an opportunity to undergo a change that could potentially cause the propeller to fail at a lower RPM that it was certified for. When wood is completely cured, the majority of the moisture is removed throughout the wood creating a uniform low level of moisture within. The more dense grain holds less
13
moisture than the less dense grain, therefore does not decrease as much in volume as the less dense grain. This causes the wood to undergo a process of relieving stress, which results in the wood possibly warping or splitting in different locations. If the curing process occurs after the certification process, grain defects and geometric changes may result.
By maintaining a consistent level of humidity in the location of the wood propeller stock and the storage location of manufactured propellers, risk of density change can be minimized. If the density changes, axial load predictions from StressFailureTest.m will not be the same. This change could potentially cause a propeller to fail at a lower RPM than it is certified for.
By storing the propeller blades vertically in a hanging position from the dovetail joint, geometric changes due to gravity will be minimized. If a propeller blade is laid horizontally on a hard surface, sagging and warping may occur especially if a change in humidity is presented. The aerodynamic loads will change if the geometries are affected by warping or sagging, resulting in a possible failure.
Careful handling of the propeller blades is essential to prevent surface damage resulting in a geometric change. The propeller blades are precisely milled out of a soft wood with a very thin trailing edge. They are also unprotected by the use of a sealant to maintain its precision in geometry. Because they are unprotected and precisely machined, damage to the surface is easily achieved.
4.2.Pre-Test Check off
Before each test, a check off shall be performed to ensure the greatest amount of risk mitigation possible.
4.2.1. Weight
The propeller should be weighed on a digital scale before each post-certification test. If the weight is at all different than the certification testing weight, the new value should be implemented into to StressFailureTest.m view its new maximum RPM. In the event that the new maximum RPM be greater than of equal to 1% less of the certification RPM, the propeller must be re-certified and documented. If the maximum RPM is greater than the certification RPM, document this finding and proceed with testing.
4.2.2. Physical Inspection
A physical inspection for grain-separation, gouges, chipping, or warping shall be performed before all tests. If a defect is found, discontinue testing of this propeller and document its ineligibility.
4.2.3. Hub Fit
The dovetail joint of the propeller blades should fit tightly into the hub. This fit test should be performed before any testing is done. A change in humidity or temperature may result in a change in volume to the wood propeller blades as well as the aluminum hub. If the fit between the
14
propeller blades and hub is not tight, document this finding and do not proceed with testing until the fit is tight.
5. Conclusion This certification process was created with the current parameters used
in the propeller research. If these parameters change as research progresses, changes in the certification and documentation procedures may require changes as well. Documentation of future changes is highly recommended when implementing new procedures to the process to ensure the highest level of risk mitigation
15
Appendix
MATLAB Function 1: StressFailureTest.m
function RPM_table = StressFailureTestclose all%Test block mass is .0439 slugs%Test block volume is 3.492*1.132*(24+21/32) = 97.4648 in^3 = .0564 ft^3%Test block density is calculated to be .7784 slugs/ft^3 = .0145 lbs/in^3 % % % % % % % % % % % % % % USER INPUTS % % % % % % % % % % % % % % % %Choose the RPM range to testMinRPM = 1000;MaxRPM = 8000;RPM = linspace(MinRPM,MaxRPM); %Choose a diameter and pitch for the propeller%Choices are 9x4.5, 9x6, 10x5, 10x7, 11x5.5, 11x7, % 11x8, 11x8.5, 11x10, 14x12, 17x12, 19x12%Tip to tip propeller diameter (inches)D = 9;d = D ./ 12;%Blade pitch angle (degrees)P = 6;%Pull the CT and CP data from the UIUC database[RPM_data,CT_data,CP_data] = propeller_database_example(D,P); %Input the rest of the parameters of the propeller%Hub half length (inches)x_root = .5;x_root = x_root ./ 12;%Blade radius (inches)r = d ./ 2;%Root x-section width (inches)b = .375;b = b ./ 12;%Root x-section height (inches)h = .375;h = h ./ 12;%Blade weight (ounces)W = 3.03;W = W ./ 16;%Safety factor (for certification)%Testing safety factor will be higher than certifications = 2; % % % % % % % % % % % % % % % CALCULATIONS % % % % % % % % % % % % % % % %Constants:
16
%Fluid density (slug/ft^3)rho_a = 0.0023769;%Gravitational acceleration (ft/s^2)g = 32.2;%Sitka spruce modulus of rupture(psi)sigma_rupture = 5500;sigma_rupture = sigma_rupture .* 144;sigma_safety = sigma_rupture ./ s; %Radius to blade mass-centerx_cg = .38.*r;%Location of the aerodynamic centerx_ac = .7.*r; %Coefficient of thrust[CT,CP] = static_data(RPM,RPM_data,CT_data,CP_data); %Estimations%Propeller speed (rev/s)n = RPM ./ 60;omega = 2.* pi .* n;%Calculate the static thrust based on the UIUC data (lbs)T = CT .* rho_a .* n.^2 .* d.^4;%Similarly, calculate the static torque based on the UIUC data (ft-lbs)Q = CP .* rho_a .* n.^2 .* d.^5; %Sources of Stress%Axial force due to centrifugal forcem = W ./ g;v = omega .* x_cg;F_c = m .* v.^2 ./ x_cg;%Bending moment about Y due to aerodynamic torque (ft-lbs)M_yp = -Q .* ((x_ac - x_root)./x_ac);%Bending moment about Z' due to thrust (ft-lbs)M_zp = T .* (x_ac - x_root); %Superposition of Stresses%Normal stress due to axial loadA = b.*h;sigma_A = F_c ./ A;%Normal stress due to bending load about Z and YI_yp = (1./12).*b.*h.^3;I_zp = (1./12).*h.*b.^3; %{Looking from the tip to the root ^z' 1 | 2 |-------|-------| | | | h | --------+-----> y' | | |---------------| 3 4 b%}
17

y1 = -b./2;y2 = b./2;y3 = -b./2;y4 = b./2;z1 = h./2;z2 = h./2;z3 = -h./2;z4 = -h./2;sigma_Y1 = M_yp.*z1./I_yp;sigma_Y2 = M_yp.*z2./I_yp;sigma_Y3 = M_yp.*z3./I_yp;sigma_Y4 = M_yp.*z4./I_yp;sigma_Z1 = -M_zp.*y1./I_zp;sigma_Z2 = -M_zp.*y2./I_zp;sigma_Z3 = -M_zp.*y3./I_zp;sigma_Z4 = -M_zp.*y4./I_zp; %Calculate stress at all of the corners by superpositionsigma_1 = sigma_A + sigma_Y1 + sigma_Z1;sigma_2 = sigma_A + sigma_Y2 + sigma_Z2;sigma_3 = sigma_A + sigma_Y3 + sigma_Z3;sigma_4 = sigma_A + sigma_Y4 + sigma_Z4; %Power (ft-lbs/s)P = Q .* omega;%Convert to wattsP_watts = P .* 1.35581794833; %Calculate the maximum RPM value that this setup can safely runRPM_table = RPMlimiter(T,Q,sigma_3,sigma_safety,P_watts,RPM); % % % % % % % % % % % % % % % % PLOTS % % % % % % % % % % % % % % % % %Plot Thrust and Torque vs RPMhold onplot(RPM,T)plot(RPM,RPM.*0+2.75)xlabel('RPM')ylabel('Thrust (lb)')title('Thrust vs RPM')hold offfigurehold onplot(RPM,Q.*12)plot(RPM,RPM.*0+5)xlabel('RPM')ylabel('Torque (in-lb)')title('Torque vs RPM')hold off %Plot the values of stress at the corners vs the RPM being testedfigurehold onplot(RPM,sigma_1,'b:')plot(RPM,sigma_2,'r--')plot(RPM,sigma_3,'m-.')
18

plot(RPM,sigma_4,'k')plot(RPM,sigma_A,'g.')plot(RPM,sigma_rupture + RPM.*0,'k-')plot(RPM,sigma_safety + RPM.*0,'b-')xlabel('RPM')ylabel('Stress')title('Stress at the Hub Corners vs RPM')legend('1','2','3','4','radial','Modulus of Rupture','Modulus of Safety')hold off %Plot Power in watts vs RPMfigurehold onplot(RPM,P_watts)plot(RPM,RPM.*0+375)xlabel('RPM')ylabel('Watts')title('Watts vs RPM')hold offend function [CT,CP] = static_data(RPM,RPM_data,CT_data,CP_data)%Initialize an empty vector for the resultant valuesCT = [];CP = [];%Set up a best fit line for extrapolation useCTfit = polyfit(RPM_data,CT_data,1);CPfit = polyfit(RPM_data,CP_data,1);%Using a for loop, check each RPM value and either interpolate or%extrapolate depending on whether it is within the UIUC range. Then%concatenate each value into the results vectorfor s = 1:100 %If it is within the UIUC range, use interpolation if min(RPM_data) < RPM(s) && RPM(s) < max(RPM_data) CTvalue = interp1(RPM_data,CT_data,RPM(s)); CT = [CT, CTvalue]; CPvalue = interp1(RPM_data,CP_data,RPM(s)); CP = [CP, CPvalue]; else %Otherwise, extrapolate using the best fit line CTvalue = polyval(CTfit,RPM(s)); CT = [CT, CTvalue]; CPvalue = polyval(CPfit,RPM(s)); CP = [CP, CPvalue]; endendend function RPM_table = RPMlimiter(T,Q,sigma_3,sigma_safety,P_watts,RPM)test1 = T-2.75 > 0;T_failures = test1;test2 = Q-5 > 0;Q_failures = test2;test3 = sigma_3 - sigma_safety > 0;Stress_failures = test3;
19

test4 = P_watts - 375 > 0;Motor_failures = test4;failure = false;cause = 'None';n = 1;while failure == false && n < 101 if T_failures(n) == 1 failure = true; cause = 'Thrust'; elseif Q_failures(n) == 1 failure = true; cause = 'Torque'; elseif Stress_failures(n) == 1 failure = true; cause = 'Corner stress'; elseif Motor_failures(n) == 1 failure = true; cause = 'Motor'; else n = n + 1; endendif failure == false sprintf('No failures at any of the current range of RPM values')else RPM_maxvalue = RPM(n-1); if strcmp(cause,'Thrust') == true sprintf('Maximum of %d RPM. Limited by thrust on strain gauge.',RPM_maxvalue) elseif strcmp(cause,'Torque') == true sprintf('Maximum of %d RPM. Limited by torque on strain gauge.',RPM_maxvalue) elseif strcmp(cause,'Corner stress') == true sprintf('Maximum of %d RPM. Limited by stress at corner 3.',RPM_maxvalue) elseif strcmp(cause,'Motor') == true sprintf('Maximum of %d RPM. Limited by the motor.',RPM_maxvalue) endendfound1 = false;found2 = false;found3 = false;found4 = false;for x = 1:100 if found1 == false if T_failures(x) == 1 Thrust_fail = RPM(x-1); found1 = true; end end if found2 == false if Q_failures(x) == 1 Torque_fail = RPM(x-1); found2 = true; end end if found3 == false
20
if Stress_failures(x) == 1 Stress_fail = RPM(x-1); found3 = true; end end if found4 == false if Motor_failures(x) == 1 Motor_fail = RPM(x-1); found4 = true; end endendif found1 == false Thrust_fail = 'None';endif found2 == false Torque_fail = 'None';endif found3 == false Stress_fail = 'None';endif found4 == false Motor_fail = 'None';endRPM_table = {'Thrust',Thrust_fail;'Torque',Torque_fail;'Stress',Stress_fail;... 'Motor',Motor_fail;'Max RPM',RPM_maxvalue};end
MATLAB Function 2: propeller_database_example.m
function [RPM_data,CT_data,CP_data] = propeller_database_example(D,P) %If the D and P being inputted are not one of the combinations for the APC%Thin Electric Props, output an error messagepass_D = any(D==[9,10,11,14,17,19]);if ~pass_D error('Chosen diameter is not one of the allowed options')endpass_P = any(P==[4.5,5,5.5,6,7,8,8.5,10,12]);if ~pass_P error('Chosen pitch is not one of the allowed options')endCombos = [[9,9,10,10,11,11,11,11,11,14,17,19]',[4.5,6,5,7,5.5,7,8,8.5,10,12,12,12]'];pass = false;for n = 1:12 test = Combos(n,:); if D == test(1) && P == test(2) pass = true; endendif pass == false
21
error('Chosen diamter and pitch are not an allowed combination')end load APC_Thin_Electric_Propsprops = APC_Thin_Electric_Props; % Geometry datainds = ismember({props.Type},'Geometry');geoms = props(inds); % Freestream datainds = ismember({props.Type},'Freestream');freestreams = props(inds); % Static datainds = ismember({props.Type},'Static');statics = props(inds); % Examine the static data for a DxP propprop = grab_prop(statics,D,P);RPM_data = prop.Data.RPM;CT_data = prop.Data.CT;CP_data = prop.Data.CP; % available diametersunique([geoms.Diameter]); % available pitchesunique([geoms.Pitch]); % available propellersentries = [[geoms.Diameter]',[geoms.Pitch]'];end function prop = grab_prop(props,diameter,pitch)inds = ismember([props.Diameter],diameter) & ... ismember([props.Pitch],pitch);prop = props(inds);end
22