DESIGN MANUAL FOR URBAN ROADS AND STREETS Design RIAI-Eddie... · DESIGN MANUAL FOR URBAN ROADS AND...
46
DESIGN MANUAL FOR URBAN ROADS AND STREETS EDDIE CONROY County Architect County Architect South Dublin County Council RIAI April 11, 2013
Transcript of DESIGN MANUAL FOR URBAN ROADS AND STREETS Design RIAI-Eddie... · DESIGN MANUAL FOR URBAN ROADS AND...
DESIGN MANUAL FOR URBAN ROADS AND STREETS
EDDIE CONROYCounty ArchitectCounty Architect
South Dublin County Council
RIAIApril 11, 2013
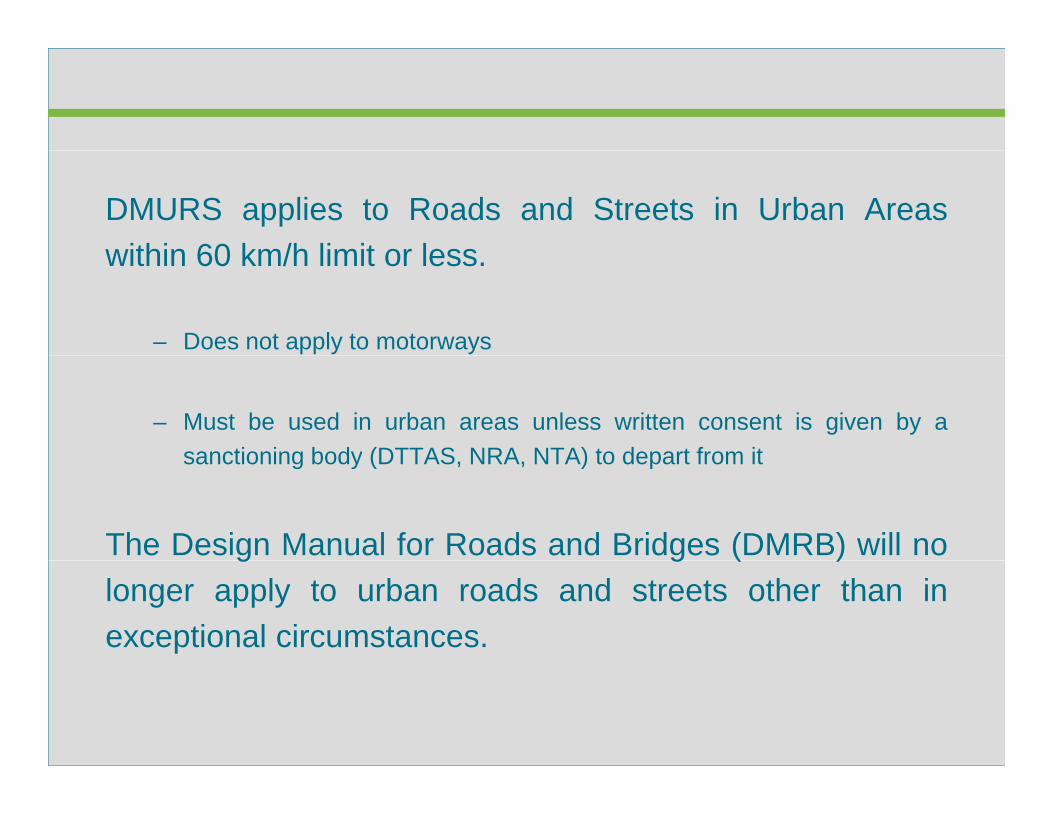
DMURS applies to Roads and Streets in Urban Areaswithin 60 km/h limit or lesswithin 60 km/h limit or less.
– Does not apply to motorways
– Must be used in urban areas unless written consent is given by asanctioning body (DTTAS NRA NTA) to depart from itsanctioning body (DTTAS, NRA, NTA) to depart from it
The Design Manual for Roads and Bridges (DMRB) will nog g ( )longer apply to urban roads and streets other than inexceptional circumstances.
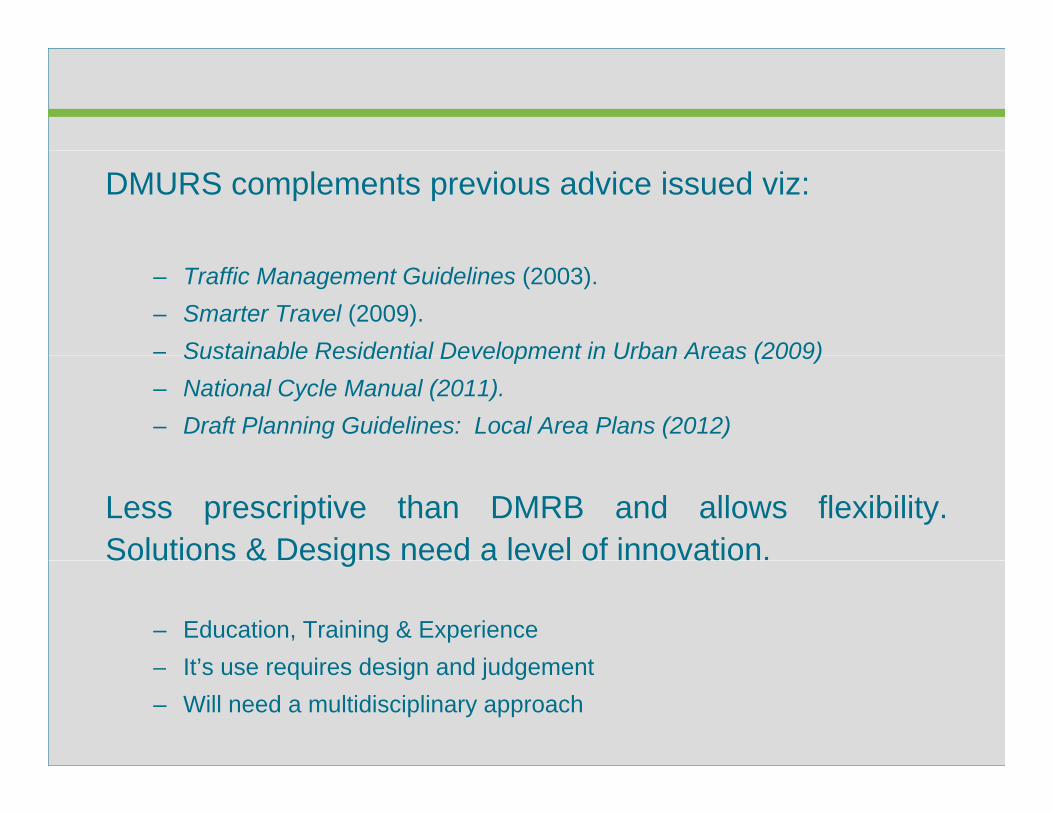
DMURS complements previous advice issued viz:
– Traffic Management Guidelines (2003).– Smarter Travel (2009).– Sustainable Residential Development in Urban Areas (2009)Sustainable Residential Development in Urban Areas (2009)– National Cycle Manual (2011).– Draft Planning Guidelines: Local Area Plans (2012)
Less prescriptive than DMRB and allows flexibility.Solutions & Designs need a level of innovation.So u o s & es g s eed a e e o o a o
– Education, Training & ExperienceIt’s use requires design and judgement– It’s use requires design and judgement
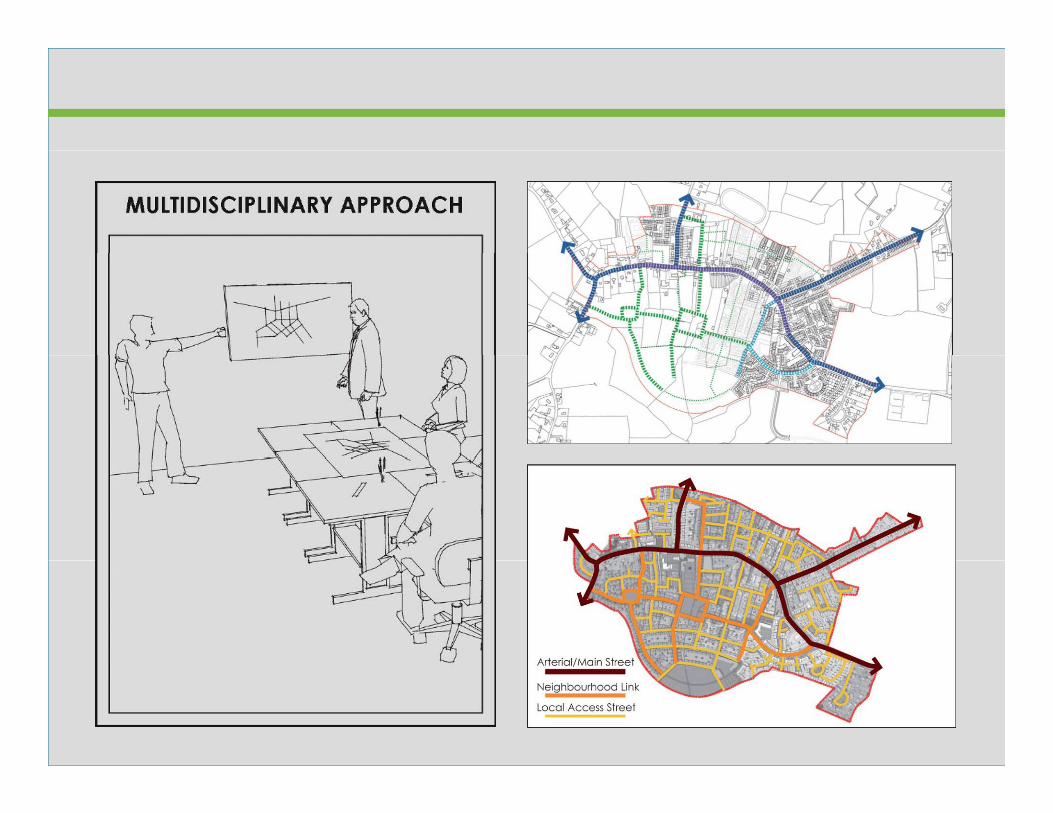
– Will need a multidisciplinary approach
Emphasis on road design documents has mainly been incatering for traffic even in urban areascatering for traffic even in urban areas
NRA DMRB used as the default standard
– Not suited for Urban Roads
– Suited for Isolated/Rural Roads
– Minimum speed 50 km/h
– Addresses roads in terms of movement as opposed to place
– Motorway versus Distributor Road versus Boulevard
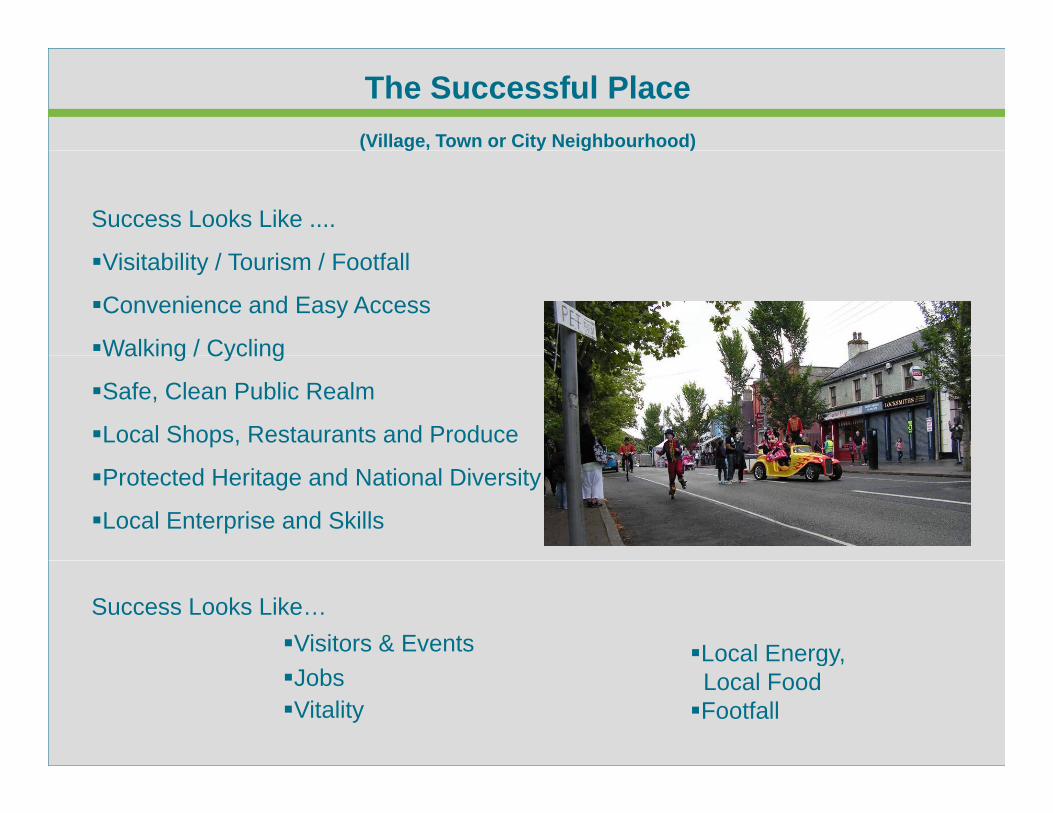
The Successful Place(Village, Town or City Neighbourhood)( g y g )
Success Looks Like ....
Vi i bili / T i / F f llVisitability / Tourism / Footfall
Convenience and Easy Access
Walking / CyclingWalking / Cycling
Safe, Clean Public Realm
Local Shops, Restaurants and Produce
Protected Heritage and National Diversity
Local Enterprise and Skills
Success Looks Like…Visitors & Events Local Energy, JobsVitality
gy,Local FoodFootfall
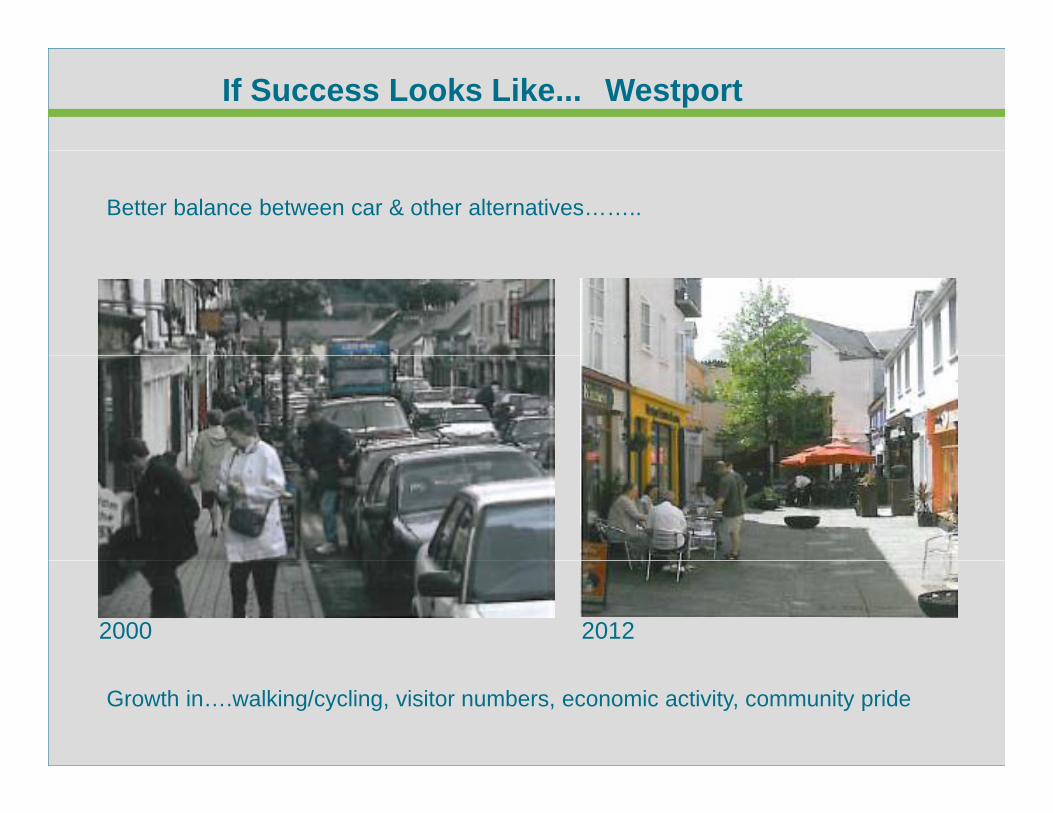
If Success Looks Like... Westport
Better balance between car & other alternatives……..
2000 2012
Growth in….walking/cycling, visitor numbers, economic activity, community pride
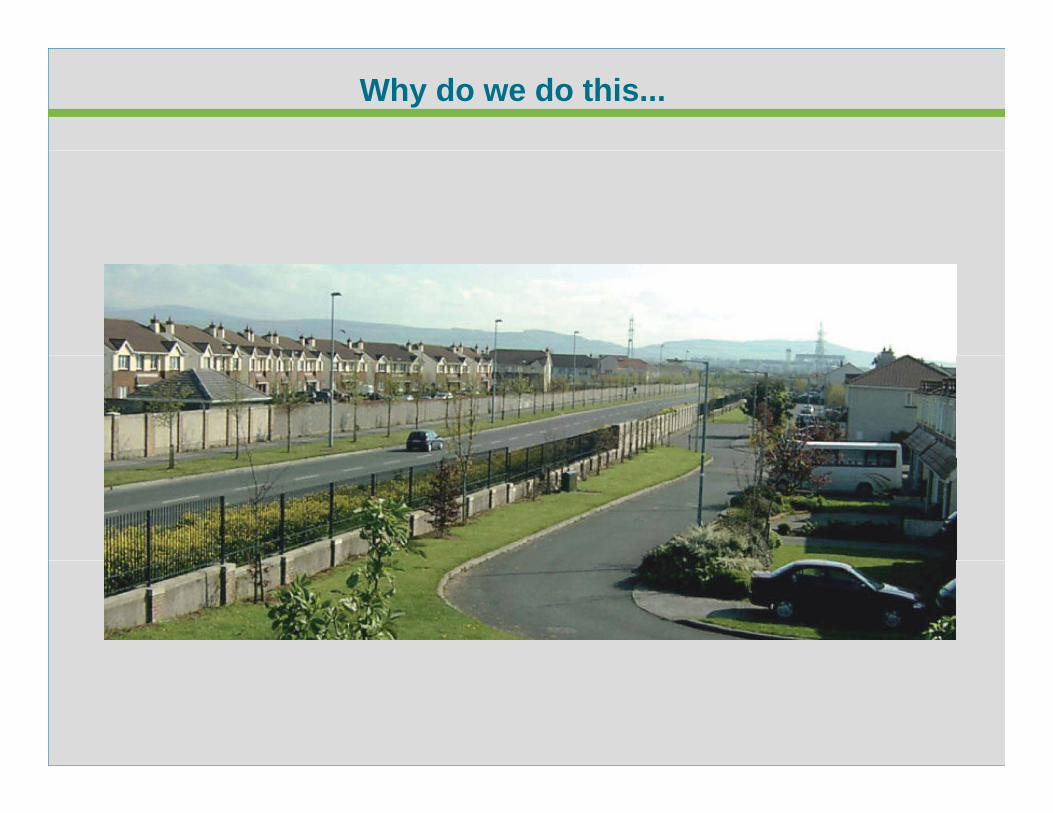
Why do we do this...
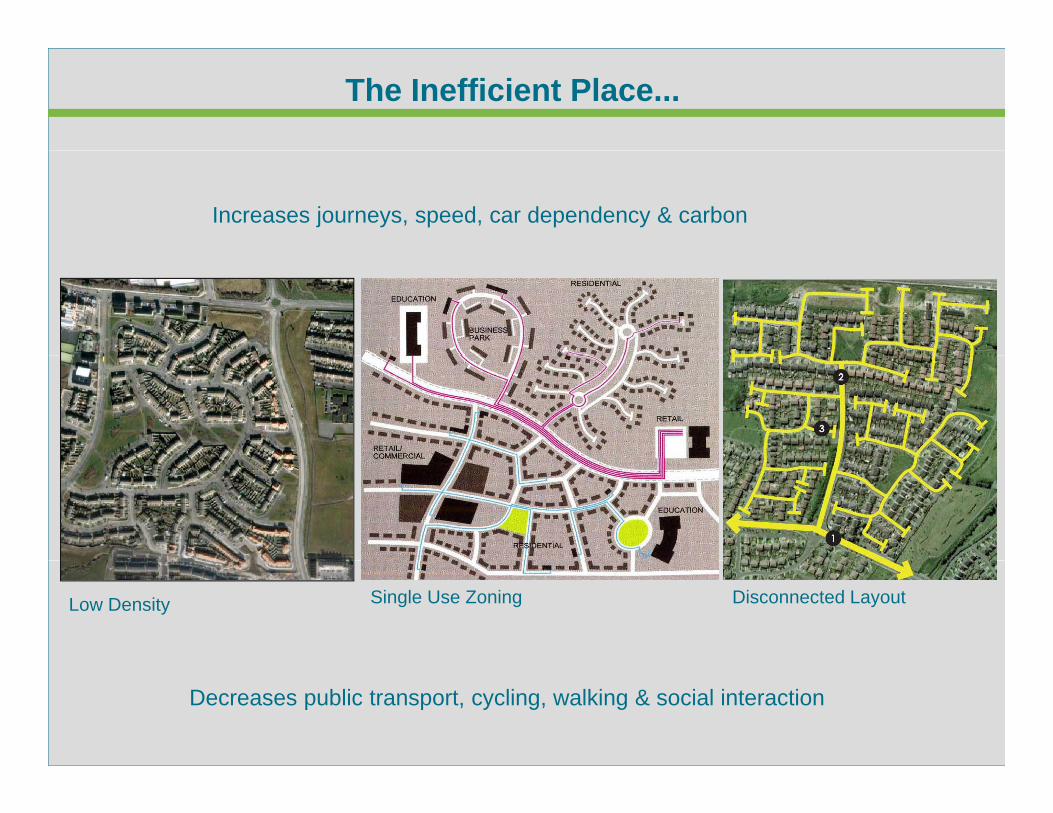
The Inefficient Place...
Increases journeys, speed, car dependency & carbon
Low Density Single Use Zoning Disconnected Layout
Decreases public transport, cycling, walking & social interaction
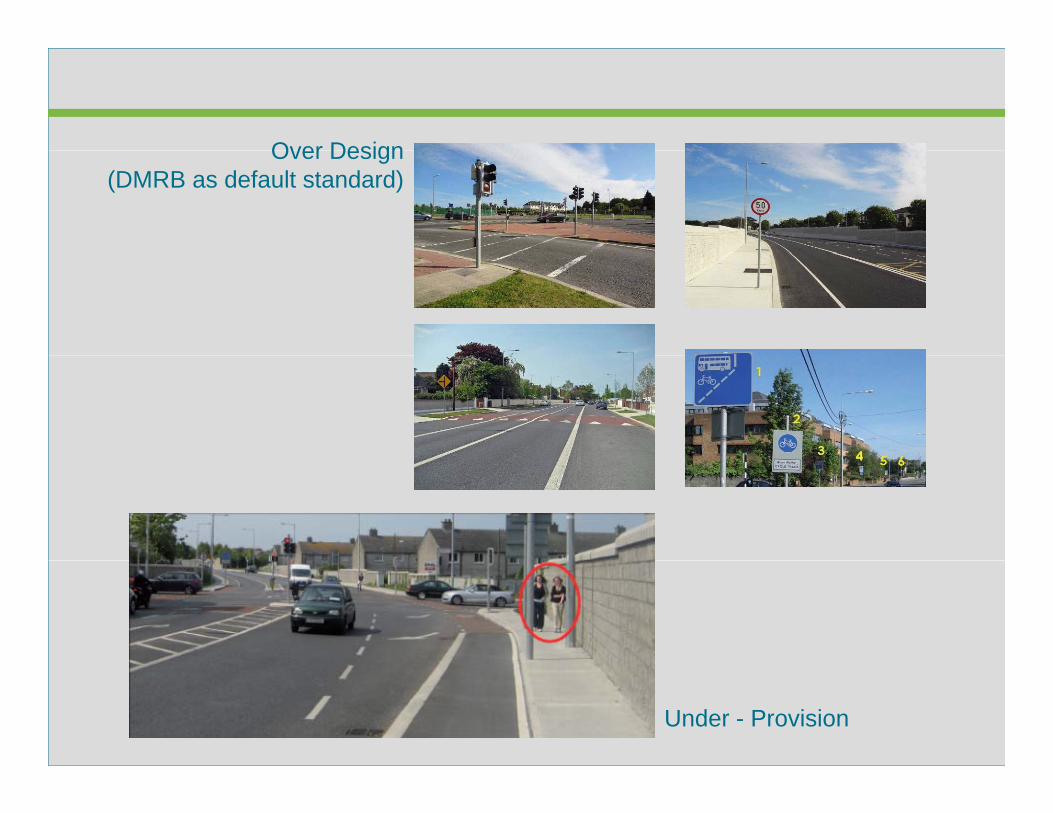
Over DesignOver Design(DMRB as default standard)
Under - Provision
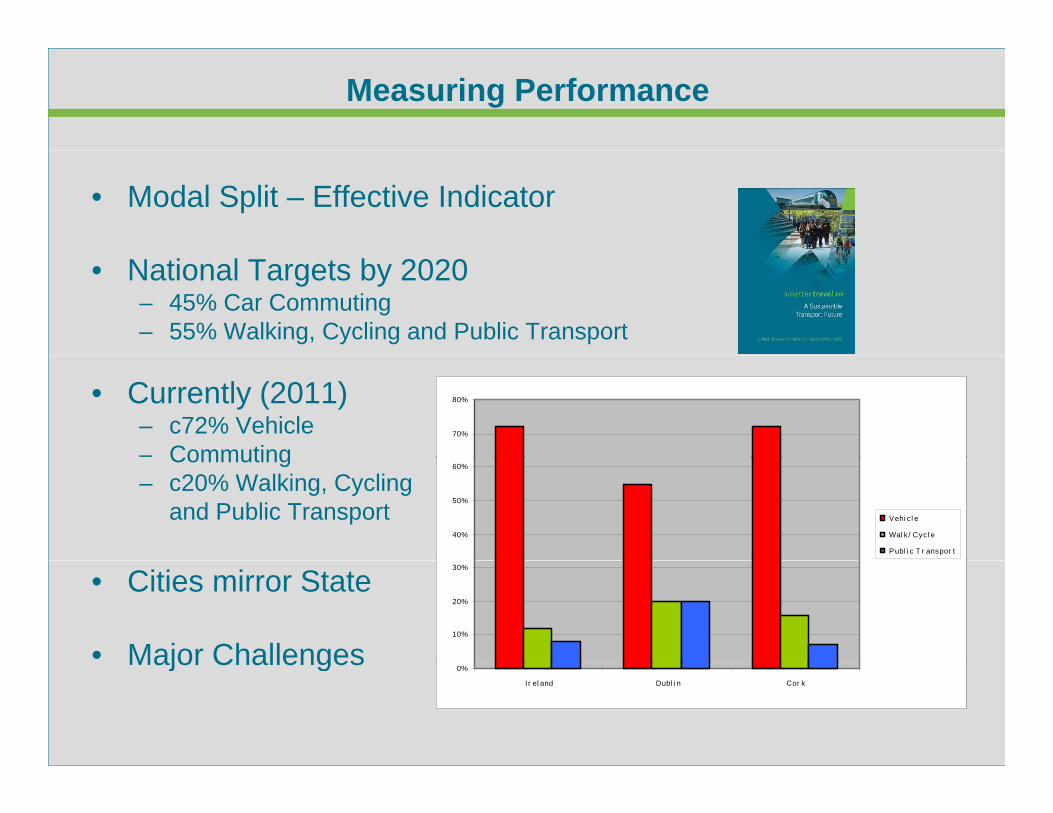
Measuring Performance
• Modal Split – Effective Indicator
• National Targets by 2020– 45% Car Commuting– 55% Walking, Cycling and Public Transport
• Currently (2011)– c72% Vehicle – Commuting
70%
80%
Commuting– c20% Walking, Cycling
and Public Transport40%
50%
60%
Vehi c l e
Wal k/ Cycl e
Publ i c T r anspor t
• Cities mirror State
• Major Challenges10%
20%
30%
Major Challenges 0%
Ir el and Dubl i n Cor k
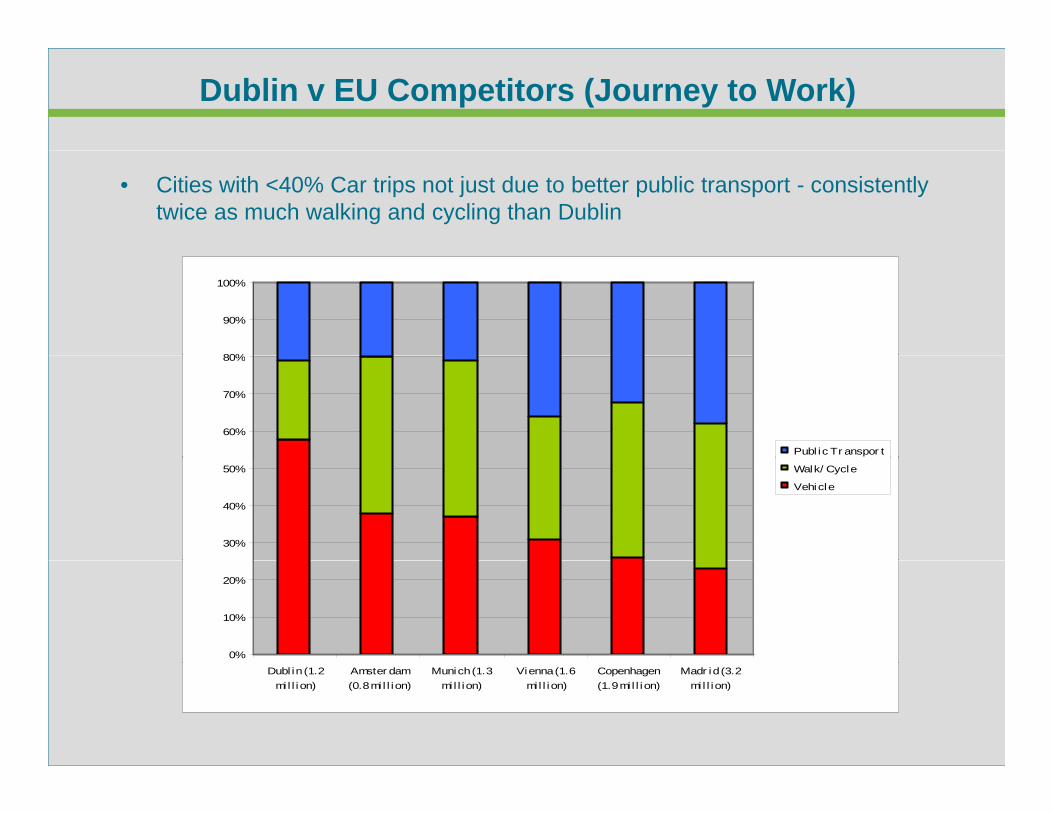
Dublin v EU Competitors (Journey to Work)
• Cities with <40% Car trips not just due to better public transport - consistently twice as much walking and cycling than Dublin
80%
90%
100%
Space for Image60%
70%
80%
Publ ic Tr anspor t
30%
40%
50% Walk/ Cycle
Vehicle
0%
10%
20%
Dubl in (1.2mi l l ion)
Amster dam(0.8 mi l l ion)
Munich (1.3mi l l ion)
Vienna (1.6mi l l ion)
Copenhagen(1.9 mi l l ion)
Madr id (3.2mi l l ion)
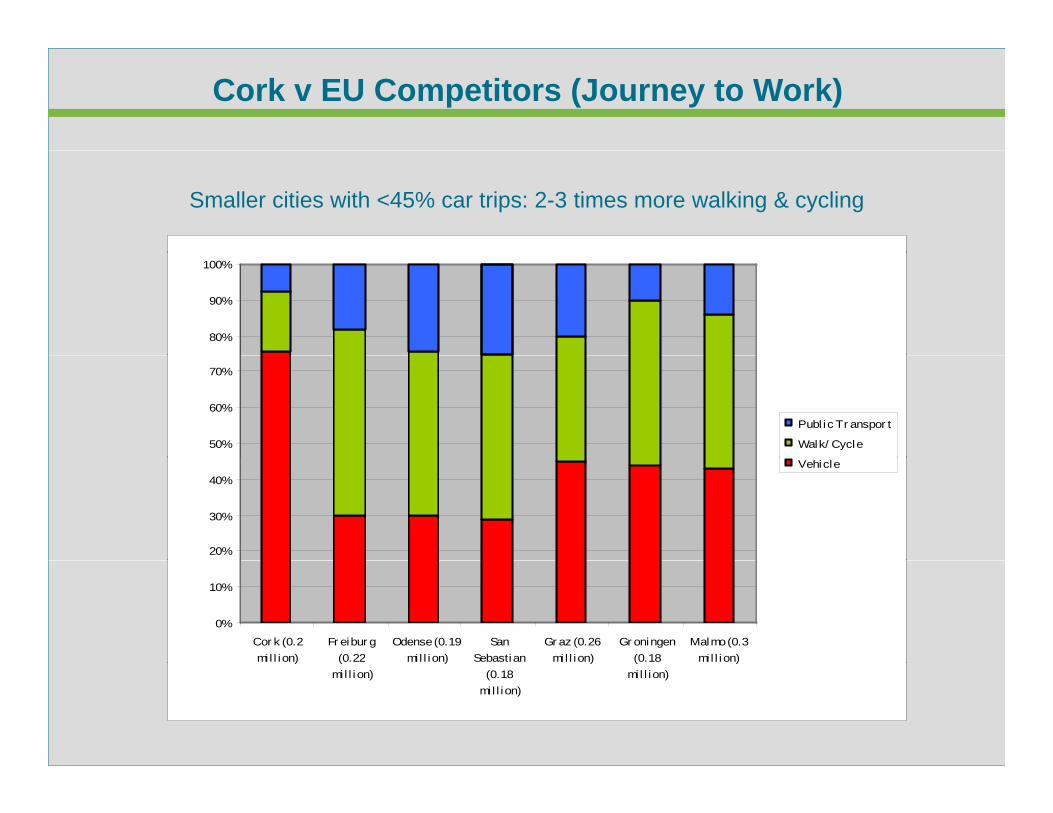
Cork v EU Competitors (Journey to Work)
Smaller cities with <45% car trips: 2-3 times more walking & cycling
80%
90%
100%
50%
60%
70%
Publ ic Tr anspor t
Walk/ Cycle
20%
30%
40%Vehicle
0%
10%
Cor k (0.2mi l l ion)
Fr eibur g(0.22
Odense (0.19mi l l ion)
SanSebastian
Gr az (0.26mi l l ion)
Gr oningen(0.18
Malmo (0.3mi l l ion)) (
mi l l ion))
(0.18mi l l ion)
) (mi l l ion)
)
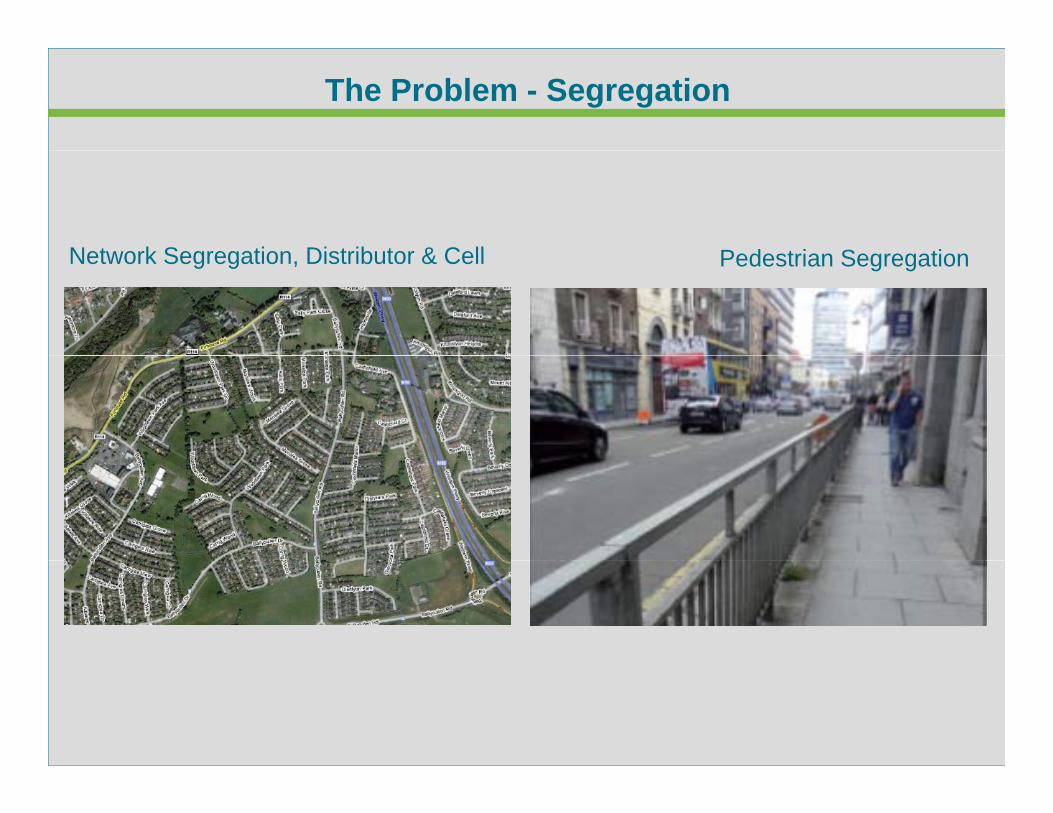
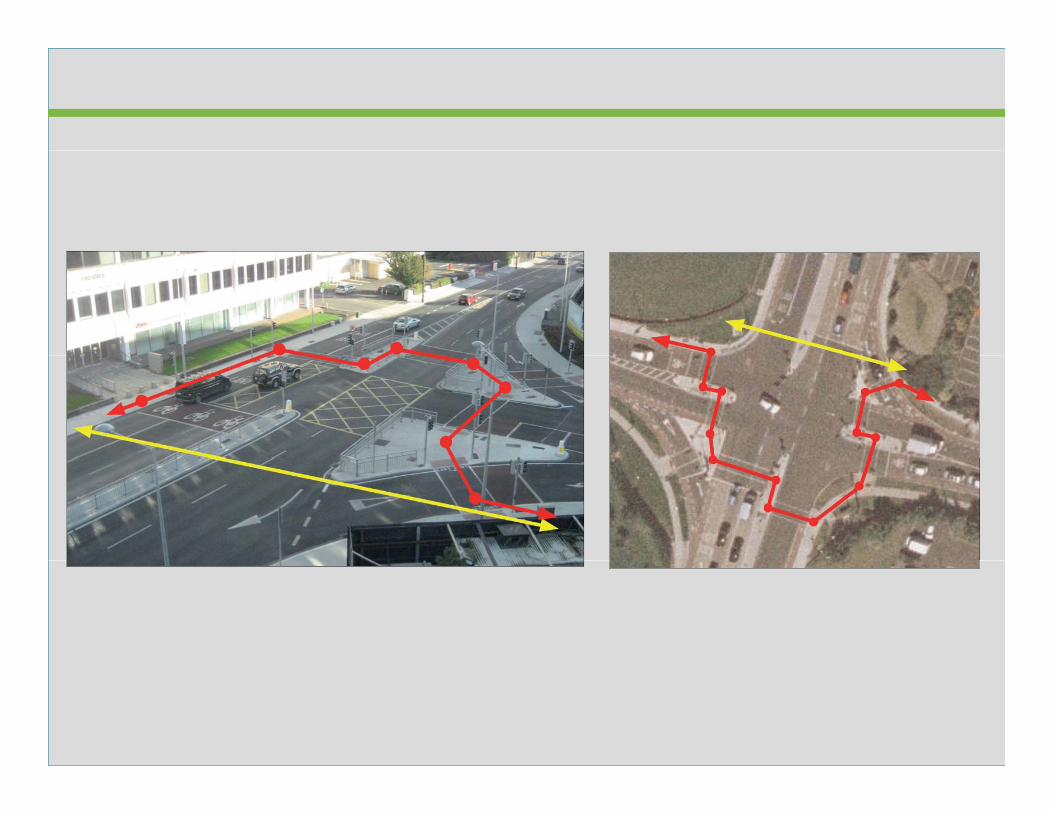
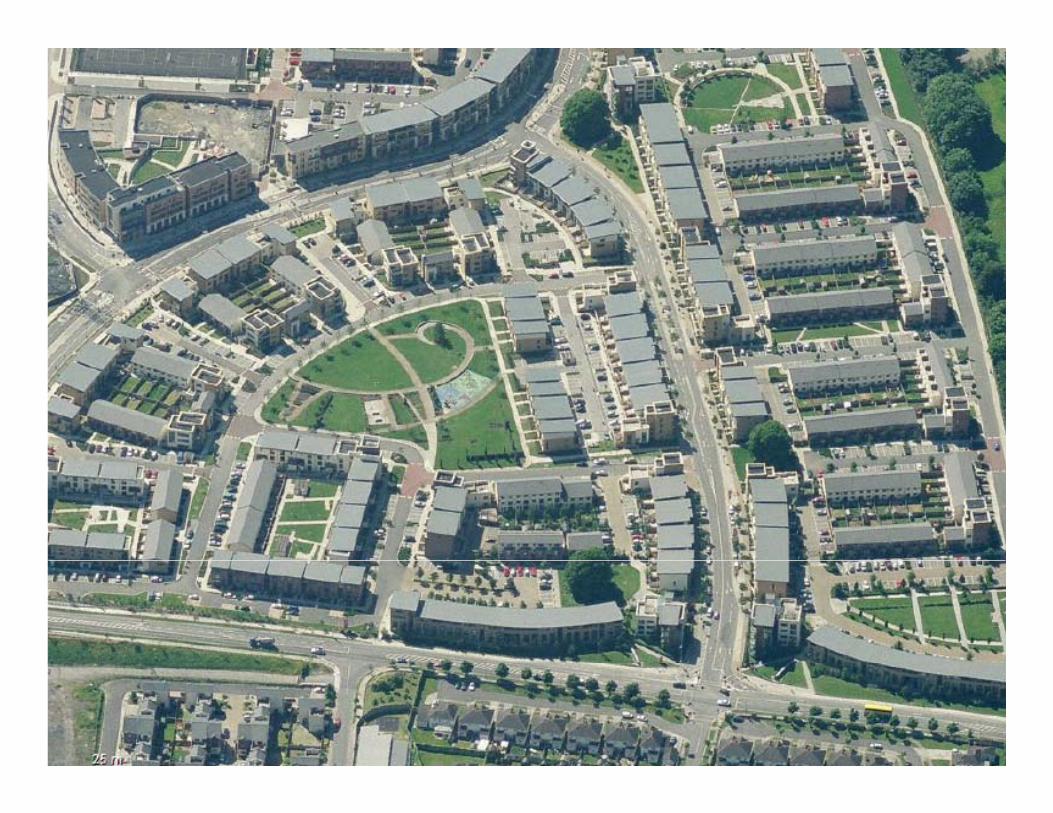
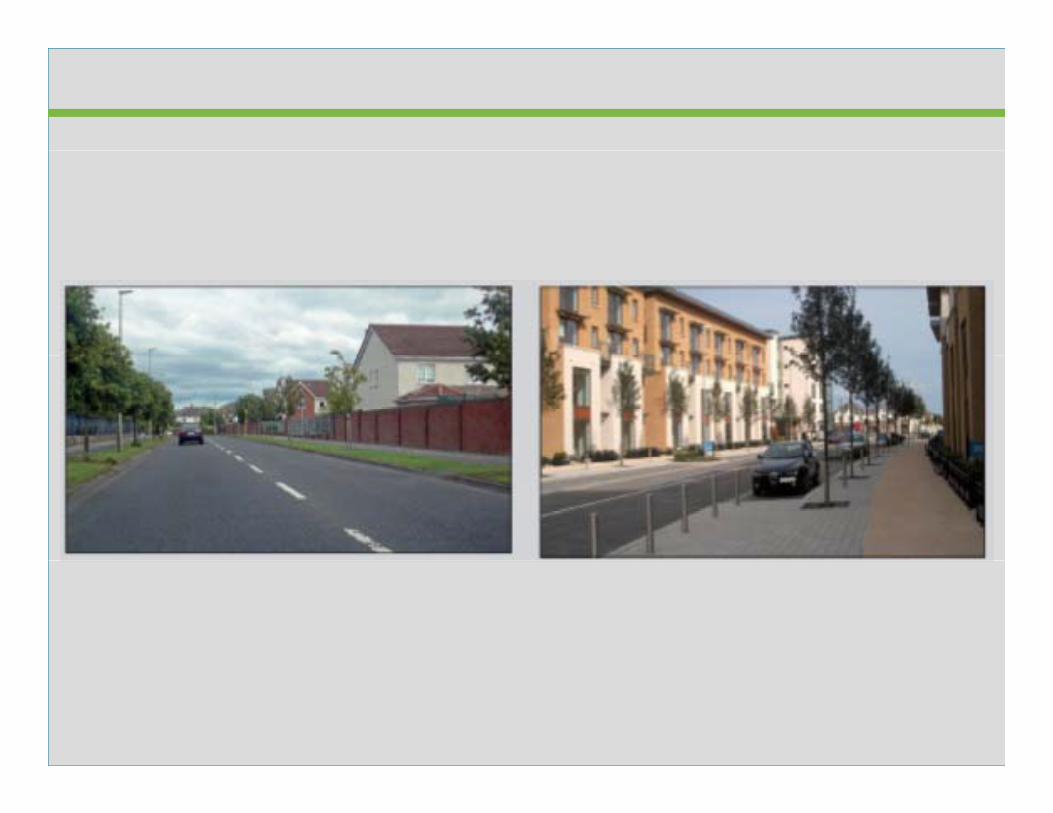
The Problem - Segregation
P d t i S tiNetwork Segregation Distributor & Cell Pedestrian SegregationNetwork Segregation, Distributor & Cell
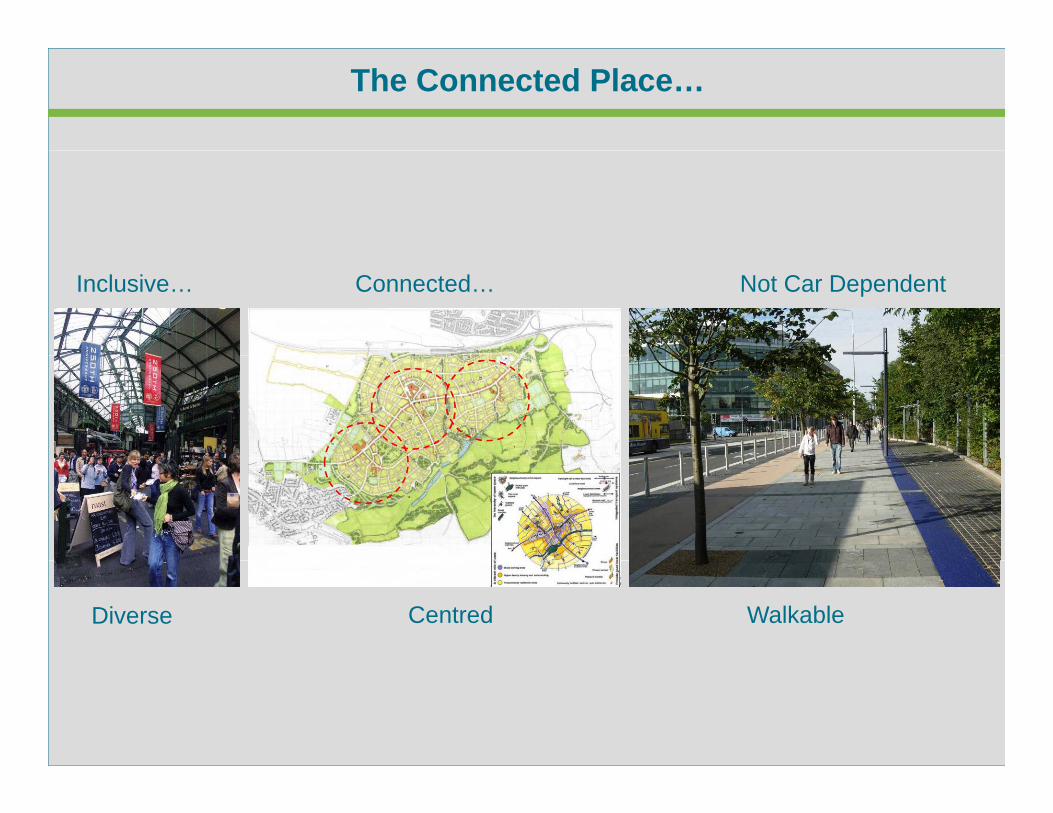
The Connected Place…
Not Car DependentInclusive… Connected…
Diverse Centred Walkable
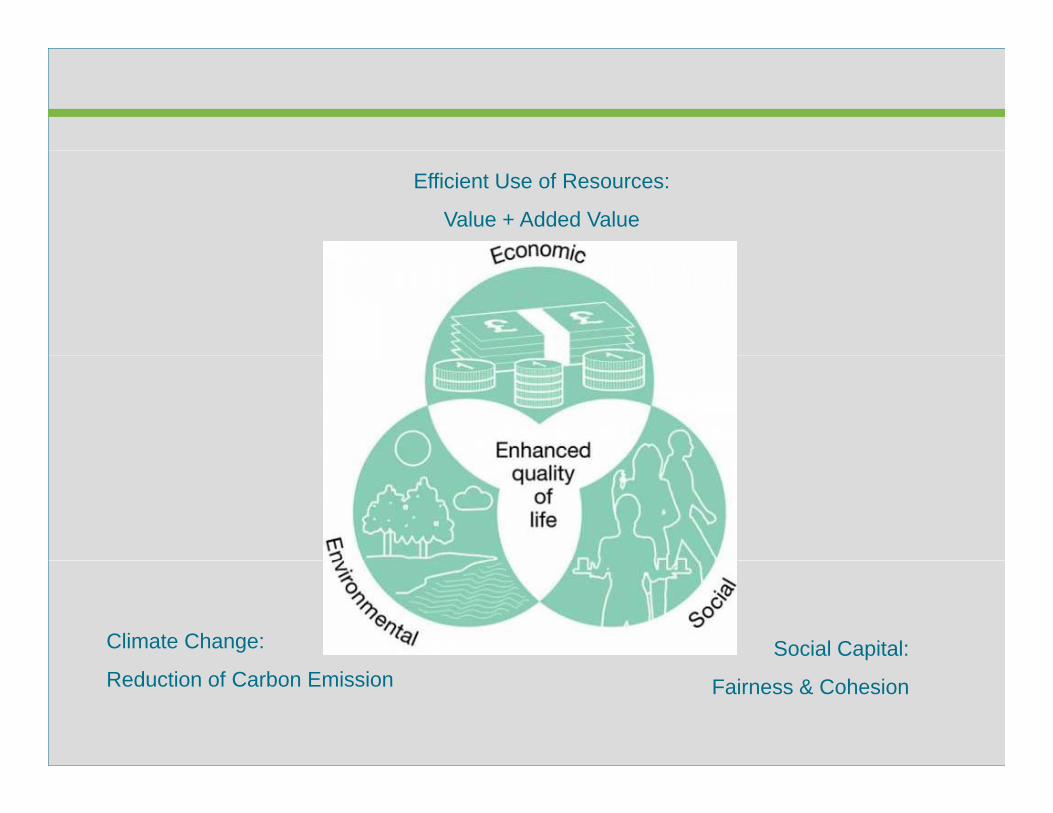
Efficient Use of Resources:
Value + Added Value
Climate Change: Social Capital: Reduction of Carbon Emission Fairness & Cohesion
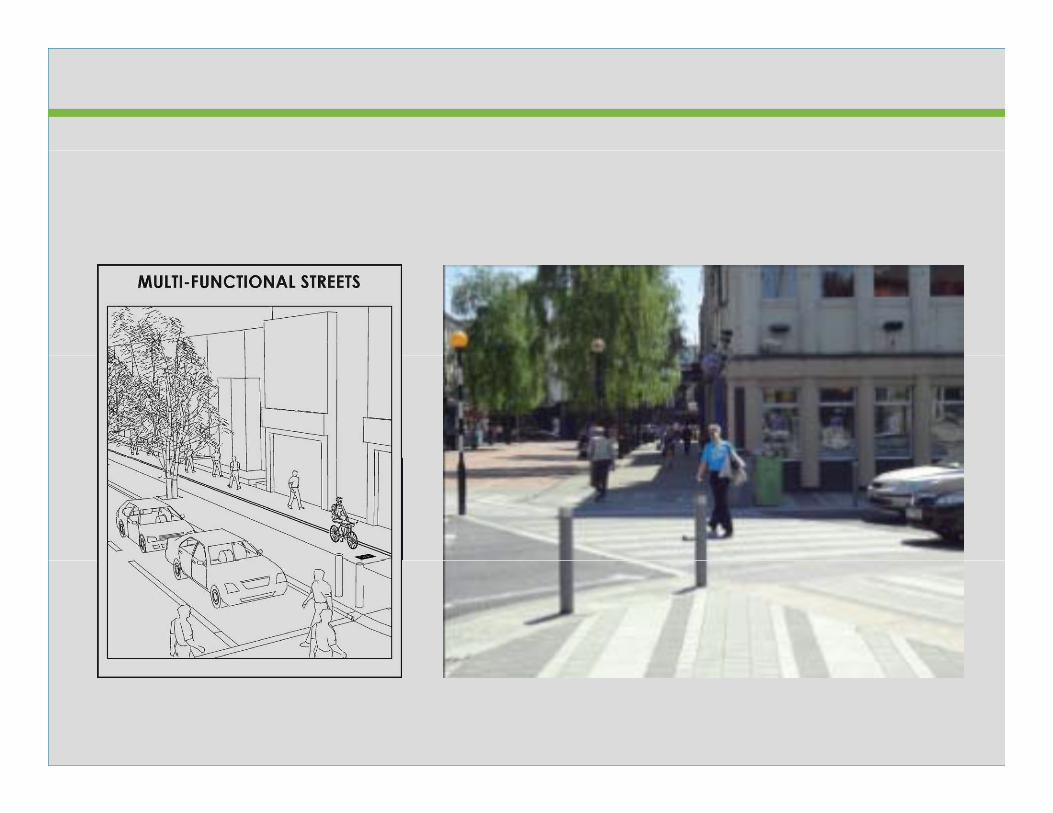
U b R d t diff t t f l
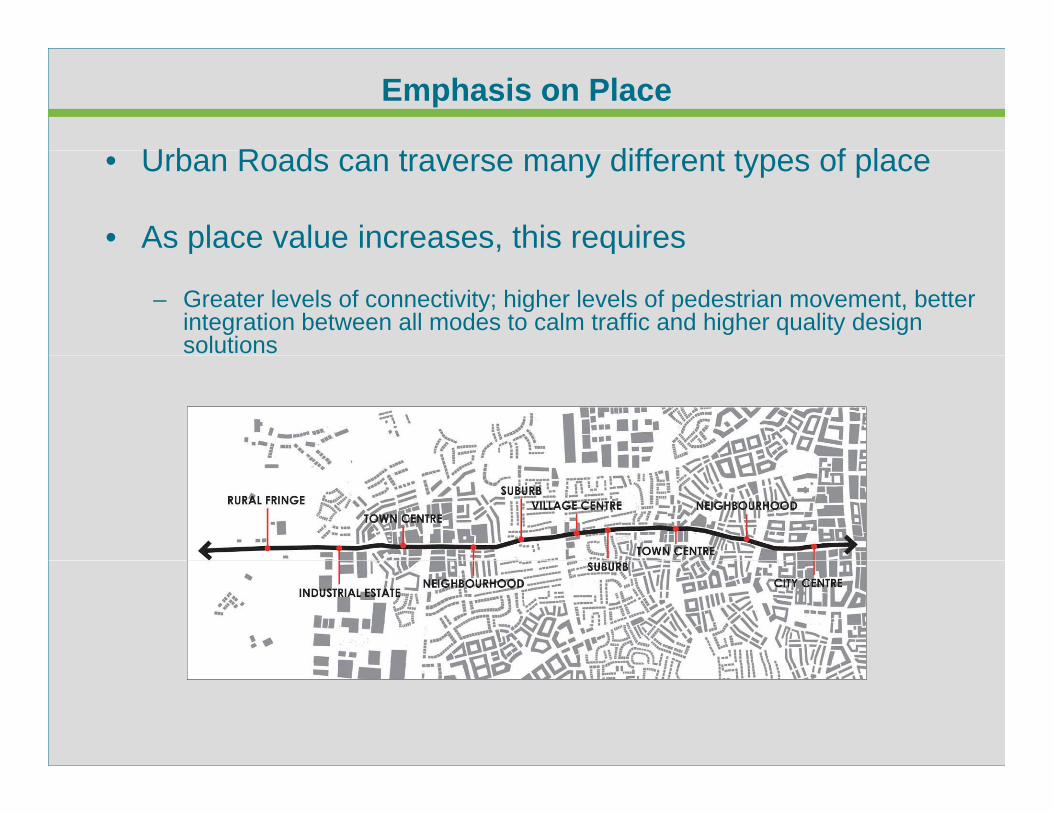
Emphasis on Place
• Urban Roads can traverse many different types of place
• As place value increases, this requiresp q
– Greater levels of connectivity; higher levels of pedestrian movement, better integration between all modes to calm traffic and higher quality design solutions
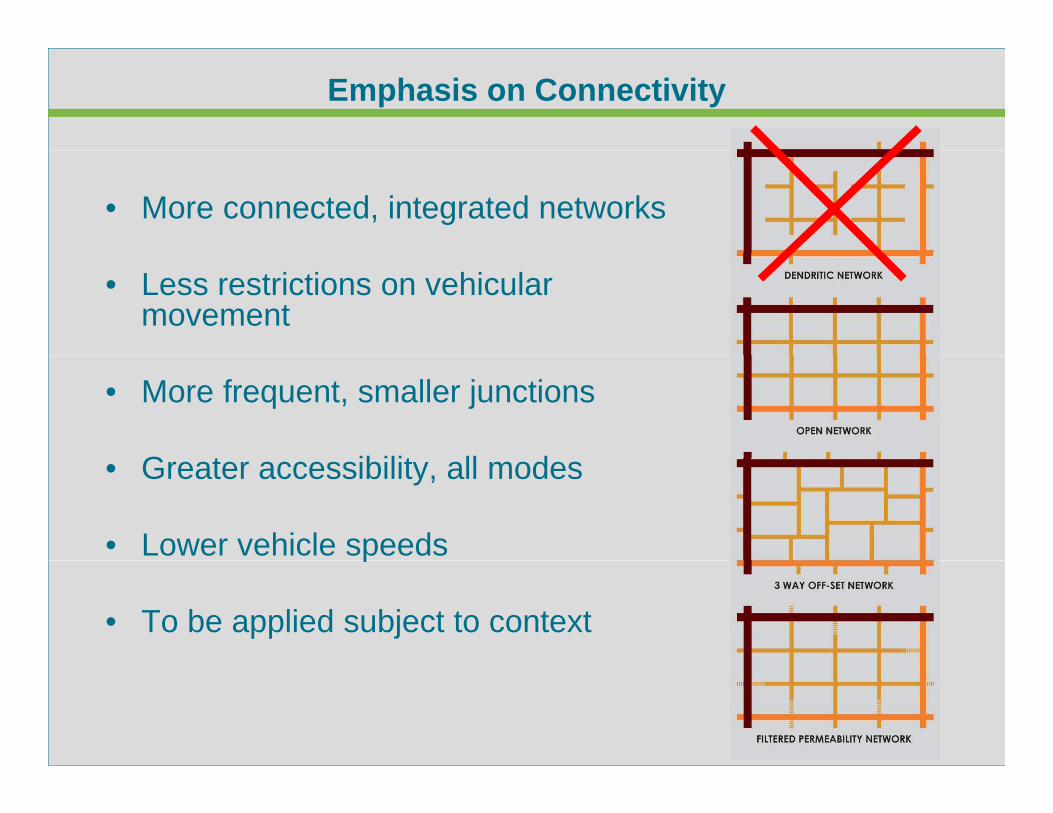
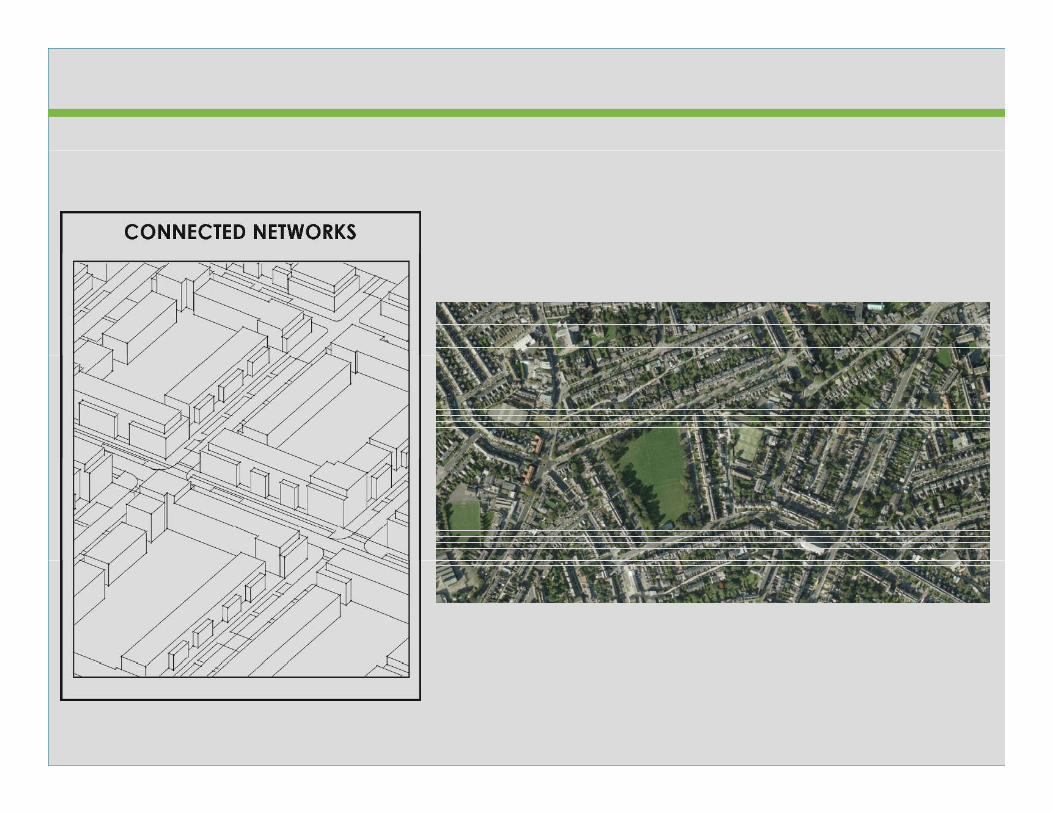
Emphasis on Connectivity
• More connected, integrated networks
• Less restrictions on vehicular movement
• More frequent, smaller junctions
G t ibilit ll d• Greater accessibility, all modes
• Lower vehicle speedsp
• To be applied subject to context
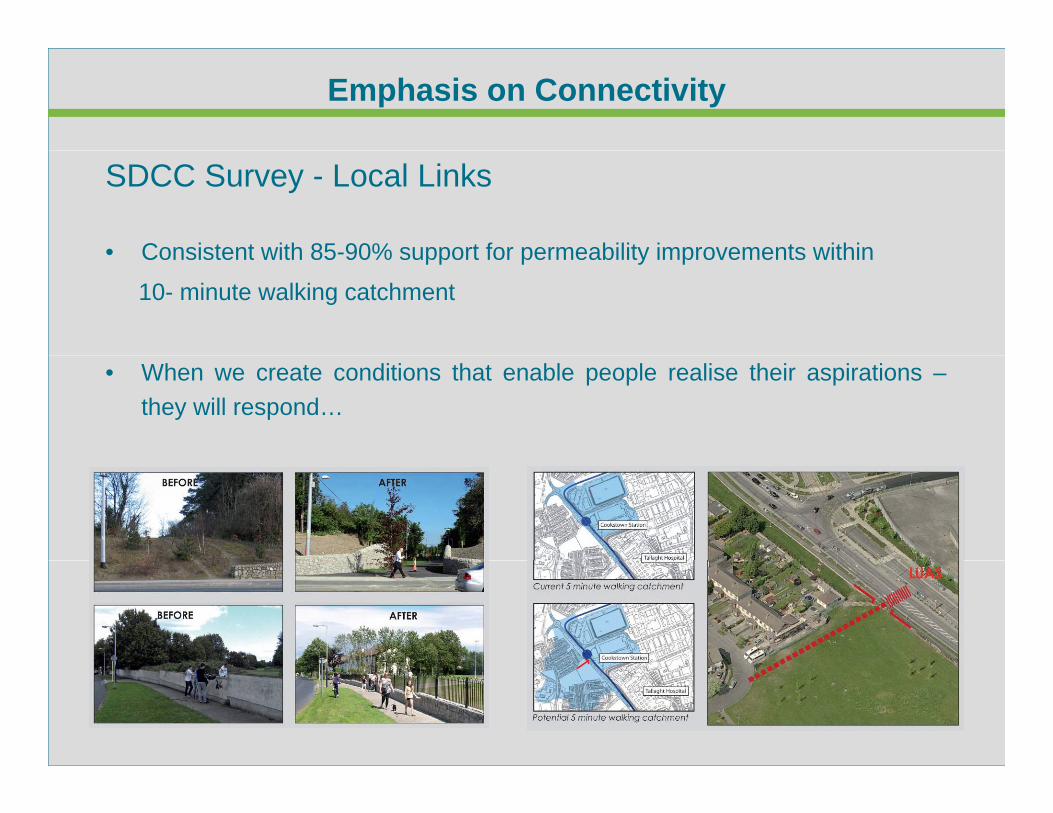
Emphasis on Connectivity
SDCC Survey - Local Links
• Consistent with 85-90% support for permeability improvements within• Consistent with 85-90% support for permeability improvements within
10- minute walking catchment
• When we create conditions that enable people realise their aspirations –they will respond…
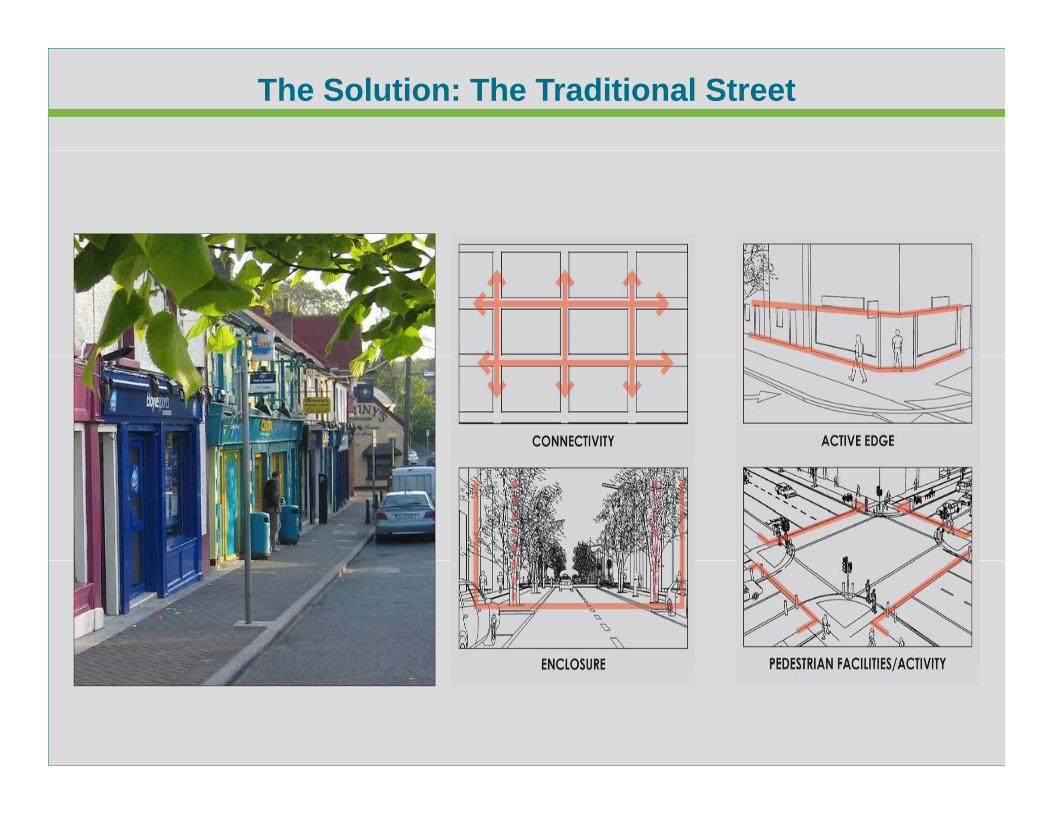
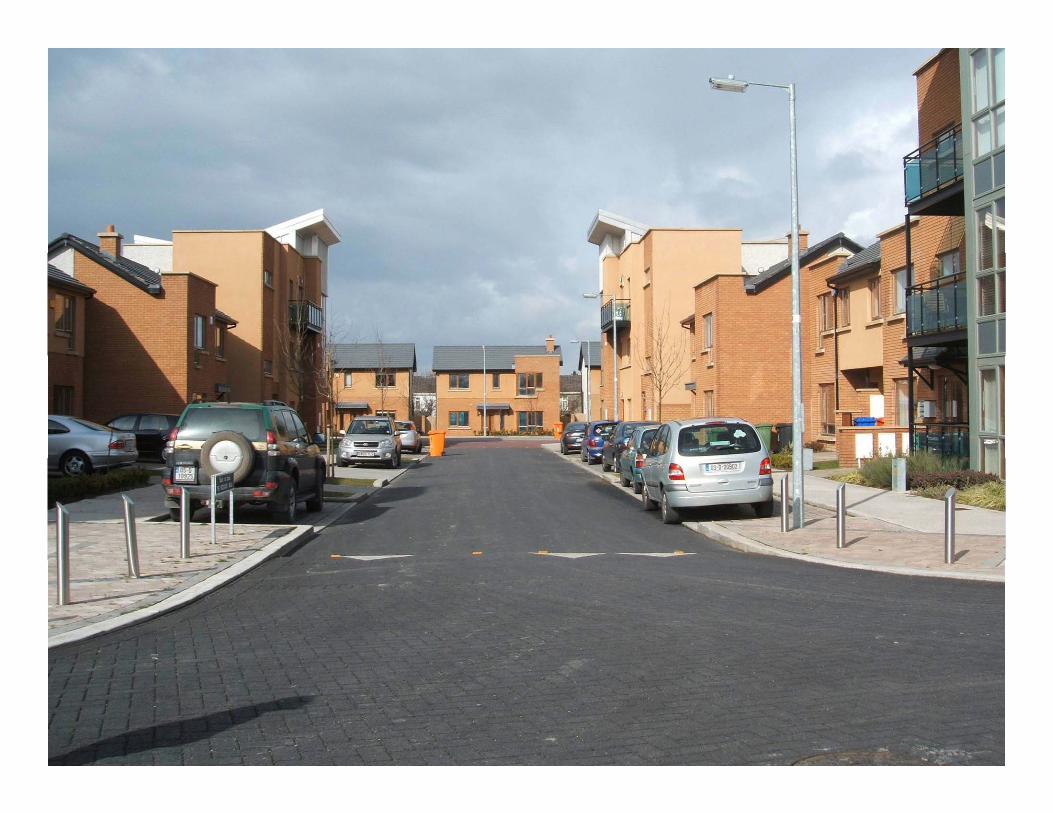
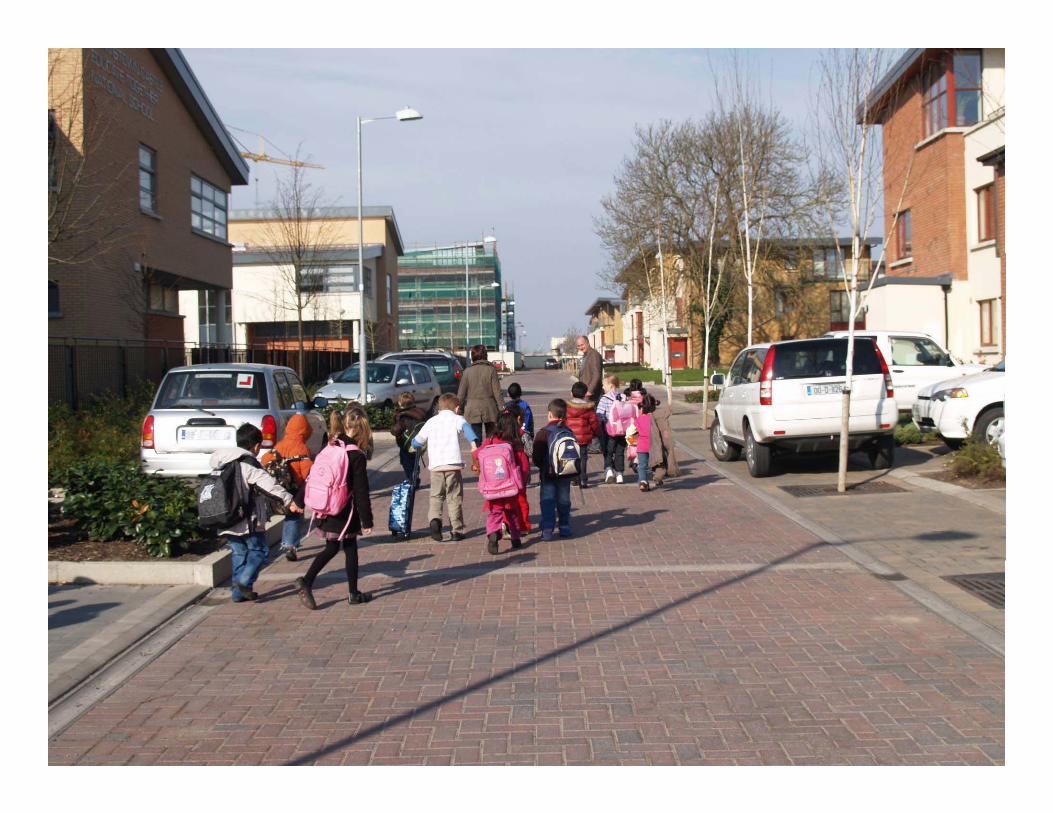
The Solution: The Traditional Street
'Pl ' b d d ti l th t i fl d i b h i
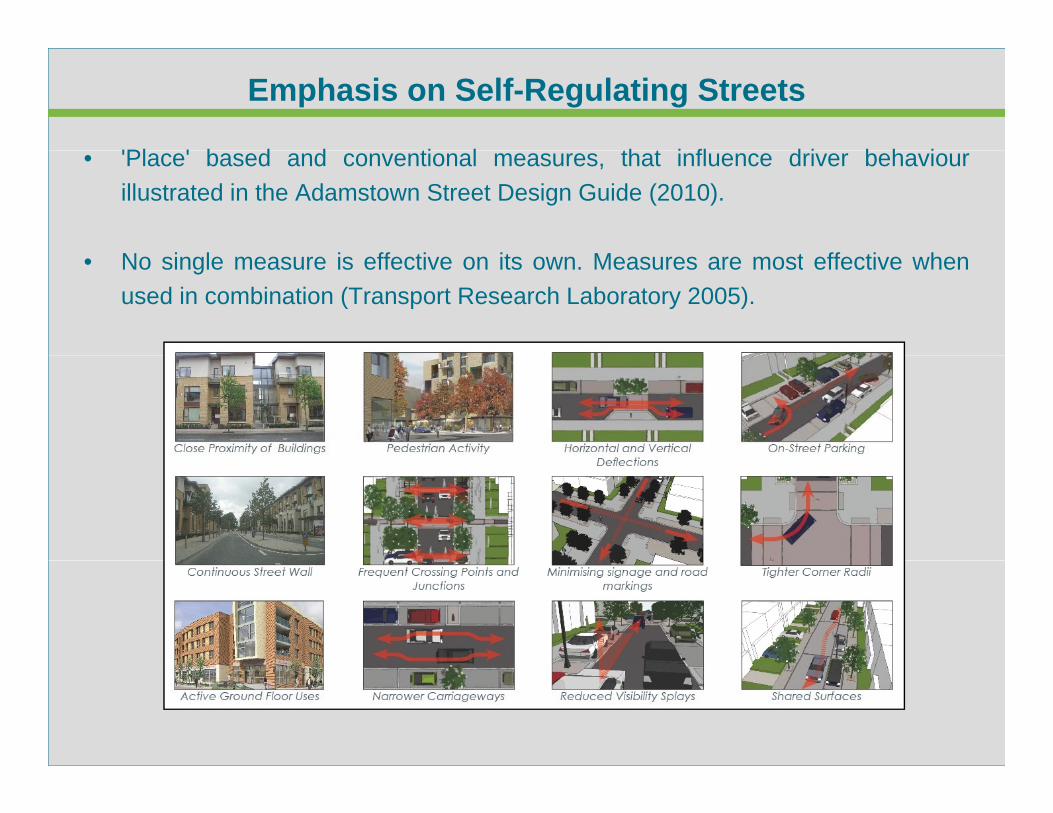
Emphasis on Self-Regulating Streets
• 'Place' based and conventional measures, that influence driver behaviourillustrated in the Adamstown Street Design Guide (2010).
N i l i ff ti it M t ff ti h• No single measure is effective on its own. Measures are most effective whenused in combination (Transport Research Laboratory 2005).
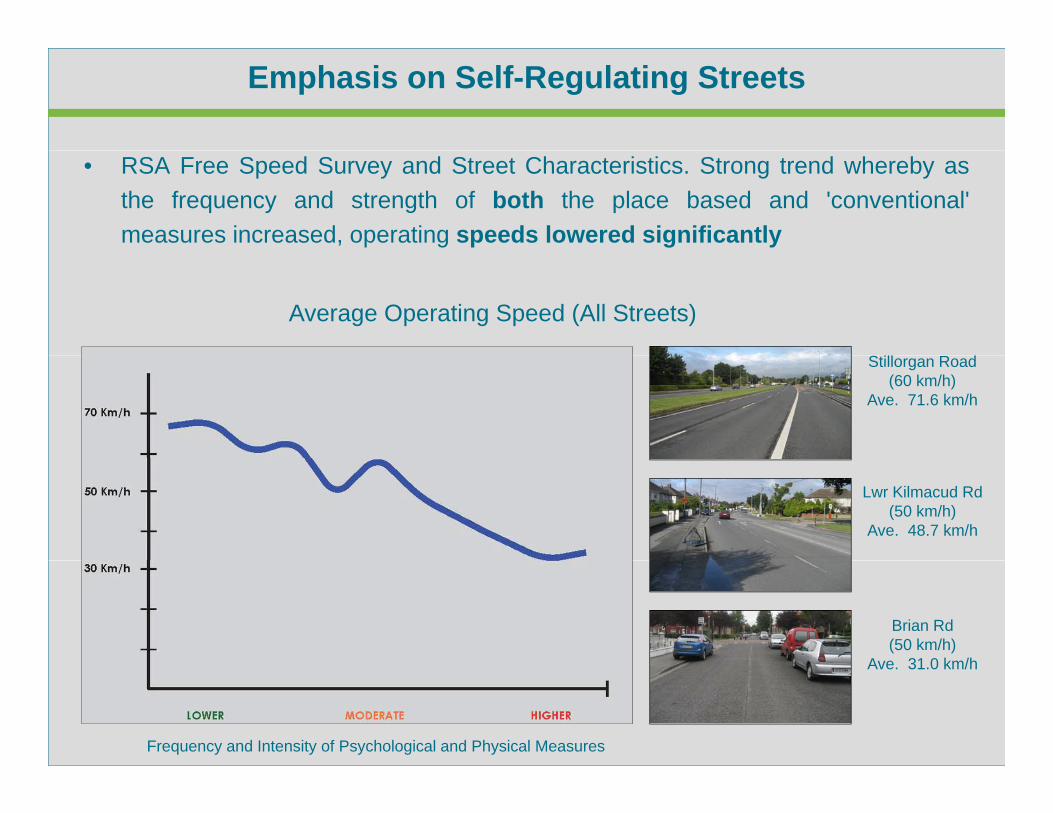
Emphasis on Self-Regulating Streets
• RSA Free Speed Survey and Street Characteristics. Strong trend whereby asthe frequency and strength of both the place based and 'conventional'measures increased, operating speeds lowered significantly
Average Operating Speed (All Streets)
S ill R dStillorgan Road (60 km/h)
Ave. 71.6 km/h
Lwr Kilmacud Rd (50 km/h)
Ave. 48.7 km/h
Brian Rd (50 km/h)
Ave 31 0 km/h
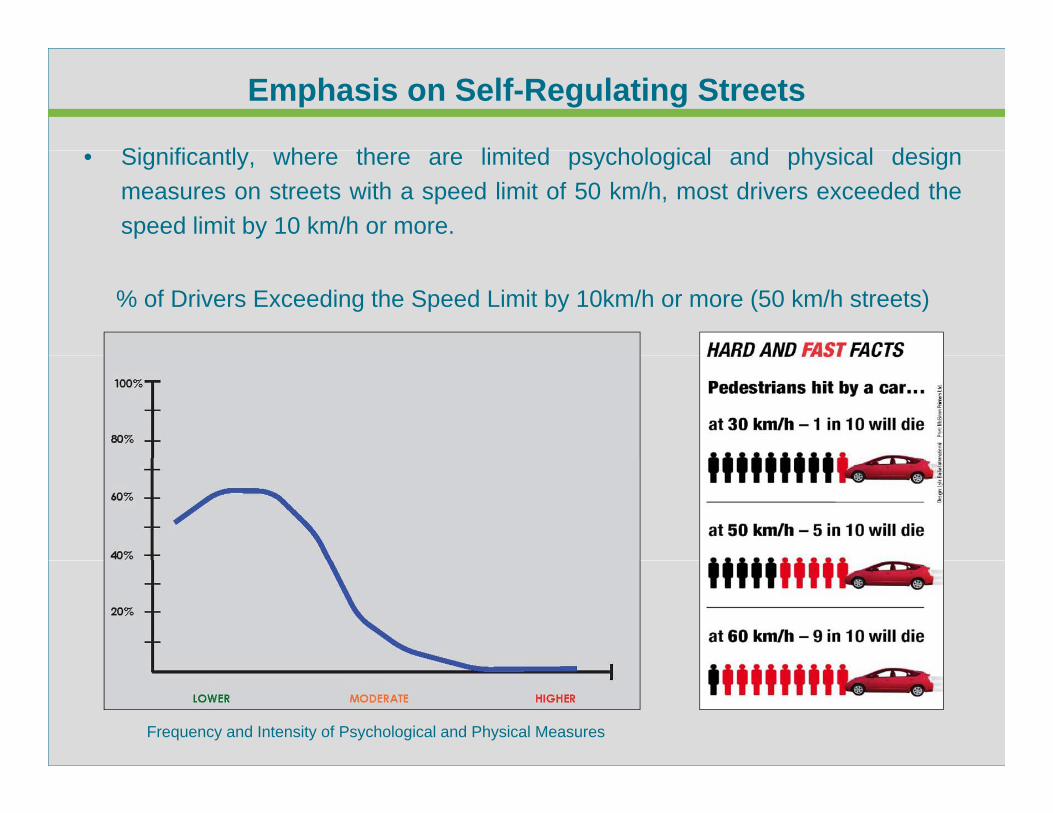
Frequency and Intensity of Psychological and Physical Measures
Ave. 31.0 km/h
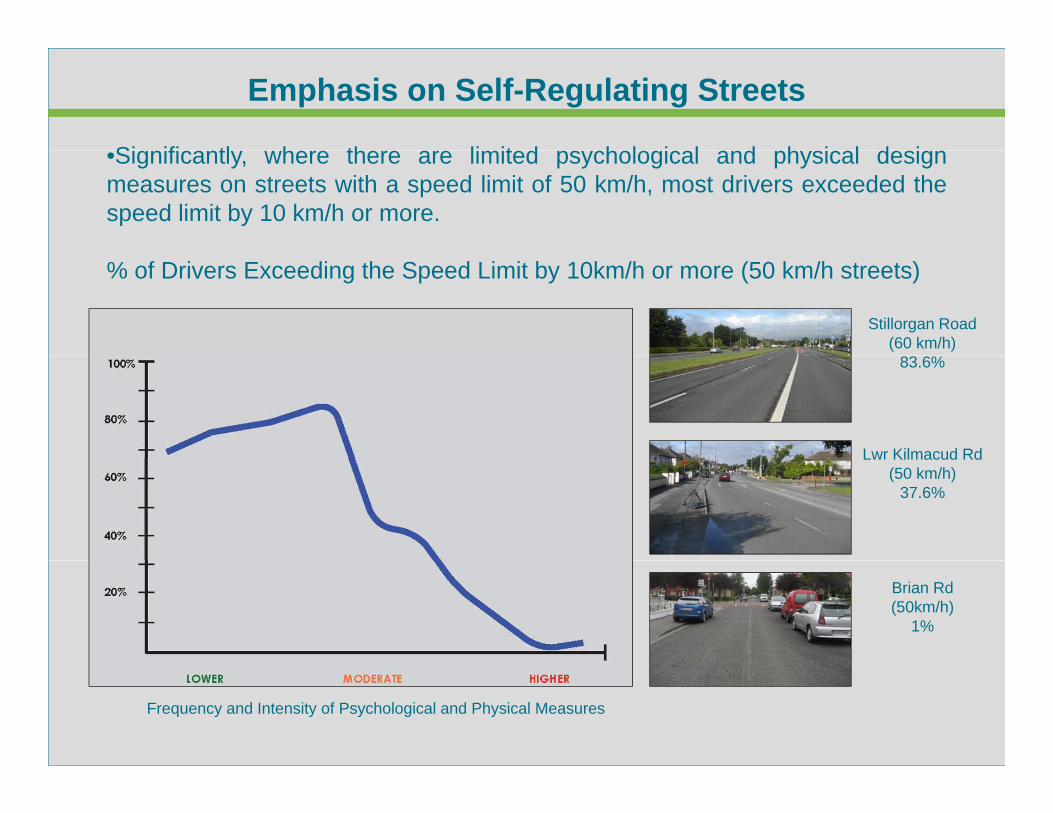
Emphasis on Self-Regulating Streets
Si ifi tl h th li it d h l i l d h i l d i•Significantly, where there are limited psychological and physical designmeasures on streets with a speed limit of 50 km/h, most drivers exceeded thespeed limit by 10 km/h or more.
Stillorgan Road (60 km/h)
% of Drivers Exceeding the Speed Limit by 10km/h or more (50 km/h streets)
83.6%
Lwr Kilmacud RdLwr Kilmacud Rd (50 km/h)
37.6%
Brian Rd (50km/h)
1%
Frequency and Intensity of Psychological and Physical Measures
Si ifi tl h th li it d h l i l d h i l d i
Emphasis on Self-Regulating Streets
• Significantly, where there are limited psychological and physical designmeasures on streets with a speed limit of 50 km/h, most drivers exceeded thespeed limit by 10 km/h or more.
% of Drivers Exceeding the Speed Limit by 10km/h or more (50 km/h streets)
Frequency and Intensity of Psychological and Physical Measures
Emphasis on Self-Regulating Streets
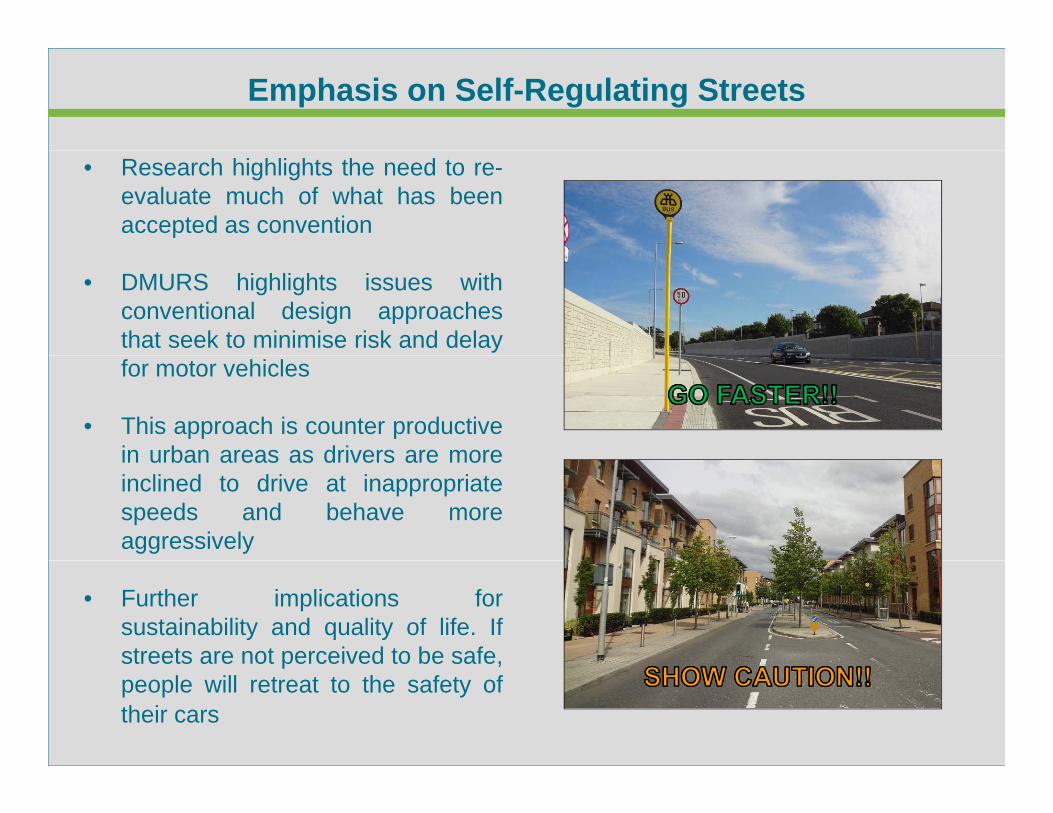
• Research highlights the need to re-evaluate much of what has beenaccepted as convention
• DMURS highlights issues withconventional design approachesthat seek to minimise risk and delayfor motor vehicles
• This approach is counter productivein urban areas as drivers are morein urban areas as drivers are moreinclined to drive at inappropriatespeeds and behave moreaggressively
• Further implications forsustainability and quality of life. Ifstreets are not perceived to be safe,streets are not perceived to be safe,people will retreat to the safety oftheir cars
Emphasis on Details
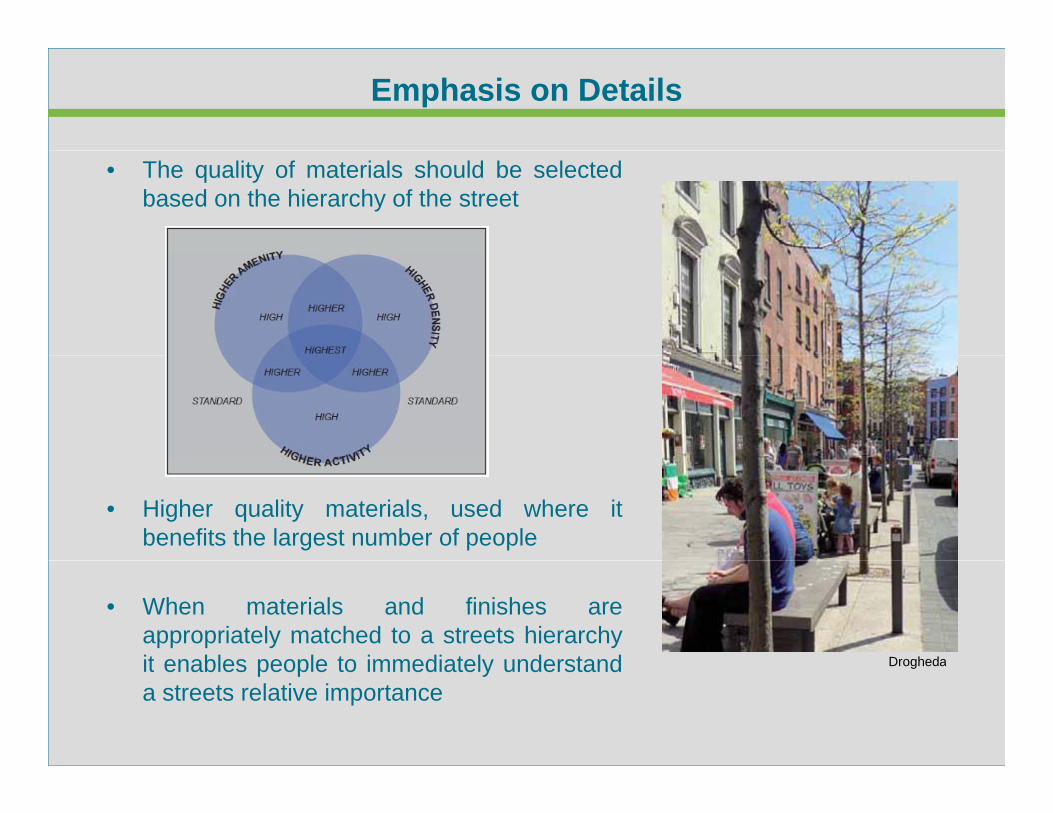
• The quality of materials should be selectedbased on the hierarchy of the street
• Higher quality materials, used where itbenefits the largest number of people
• When materials and finishes areappropriately matched to a streets hierarchyit enables people to immediately understand Droghedait enables people to immediately understanda streets relative importance
Drogheda
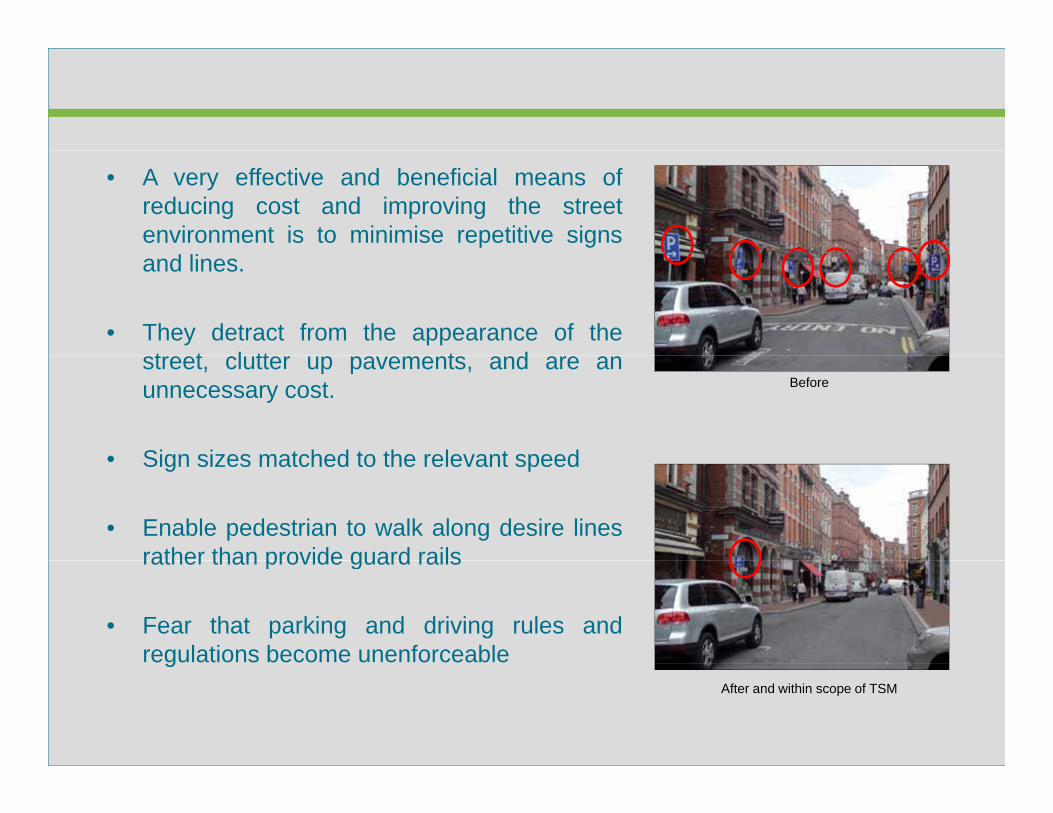
• A very effective and beneficial means ofreducing cost and improving the streetenvironment is to minimise repetitive signsand lines.
• They detract from the appearance of thet t l tt t dstreet, clutter up pavements, and are an
unnecessary cost.
• Sign sizes matched to the relevant speed
Before
• Sign sizes matched to the relevant speed
• Enable pedestrian to walk along desire linesrather than provide guard railsrather than provide guard rails
• Fear that parking and driving rules andregulations become unenforceableg
After and within scope of TSM
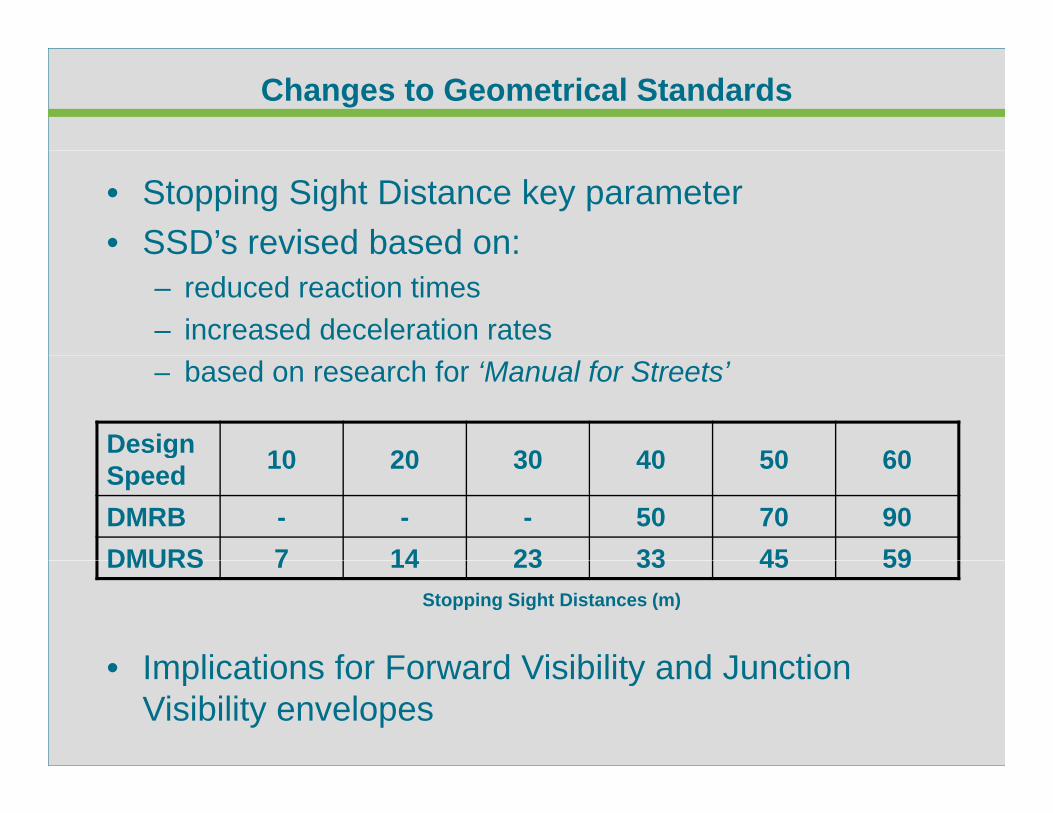
Changes to Geometrical Standards
• Stopping Sight Distance key parameter • SSD’s revised based on:SSD s revised based on:
– reduced reaction times– increased deceleration rates– based on research for ‘Manual for Streets’
Design 10 20 30 40 50 60gSpeed 10 20 30 40 50 60
DMRB - - - 50 70 90DMURS 7 14 23 33 45 59
Stopping Sight Distances (m)
• Implications for Forward Visibility and Junction
DMURS 7 14 23 33 45 59
• Implications for Forward Visibility and Junction Visibility envelopes
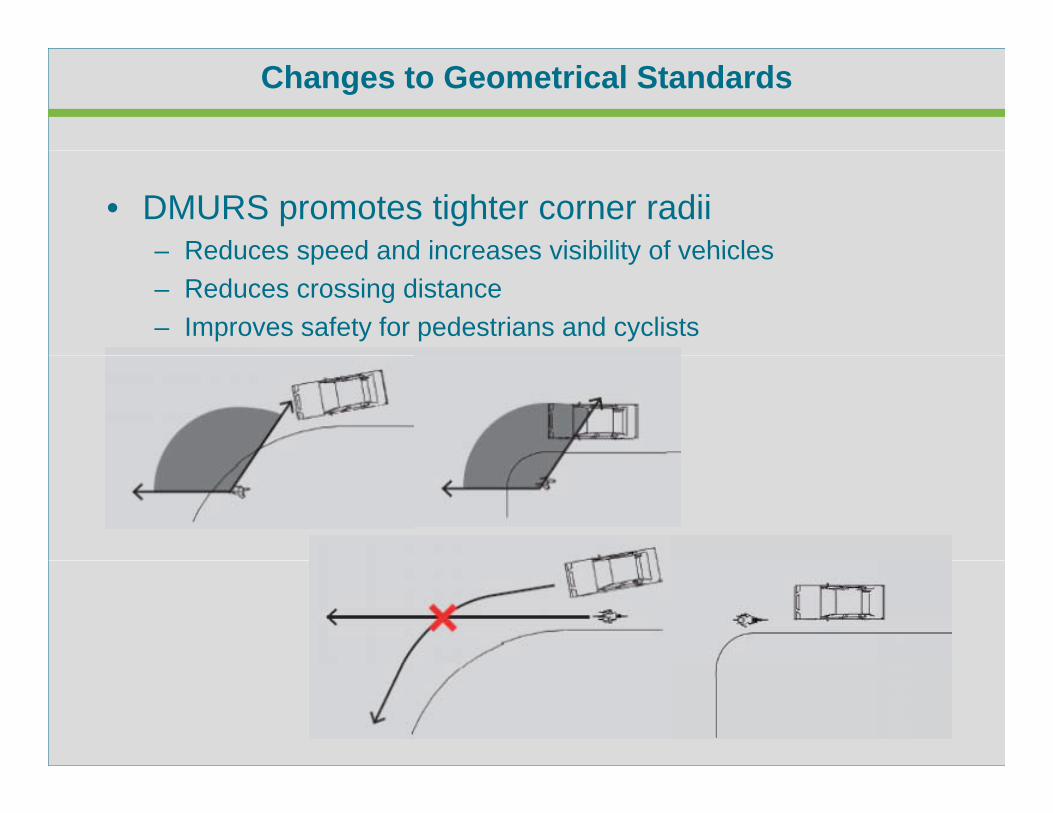
Changes to Geometrical Standards
• DMURS promotes tighter corner radii – Reduces speed and increases visibility of vehicles– Reduces speed and increases visibility of vehicles– Reduces crossing distance– Improves safety for pedestrians and cyclists
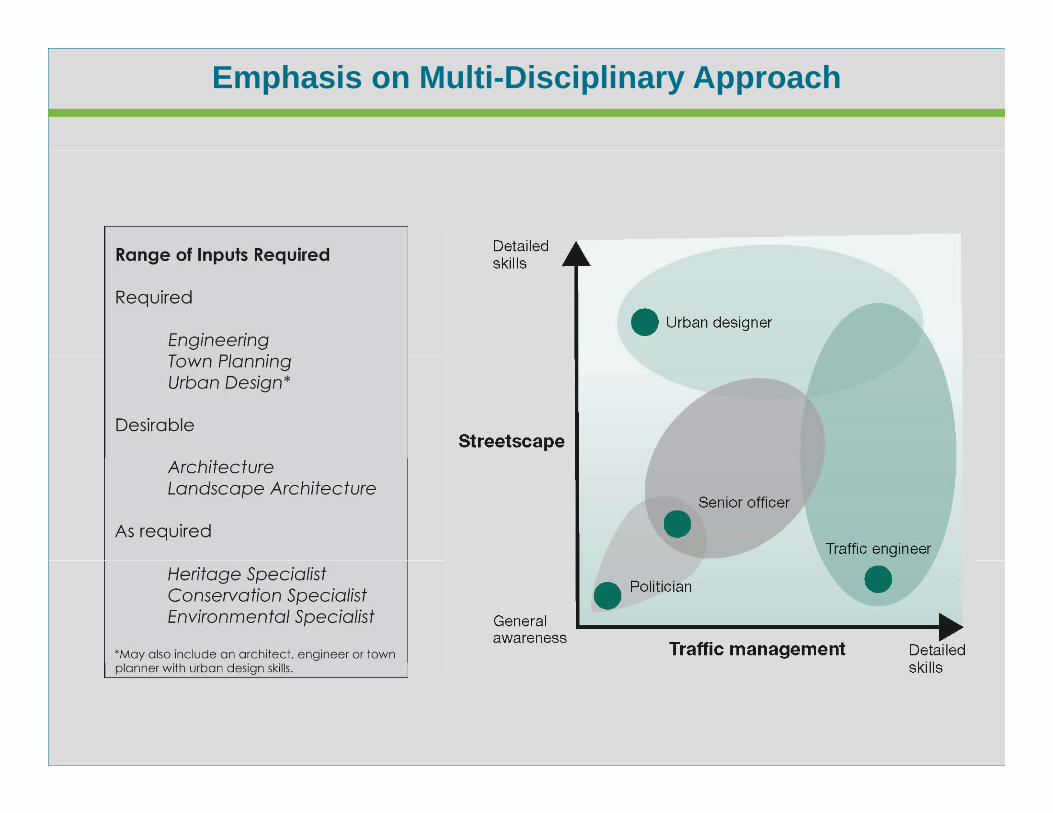
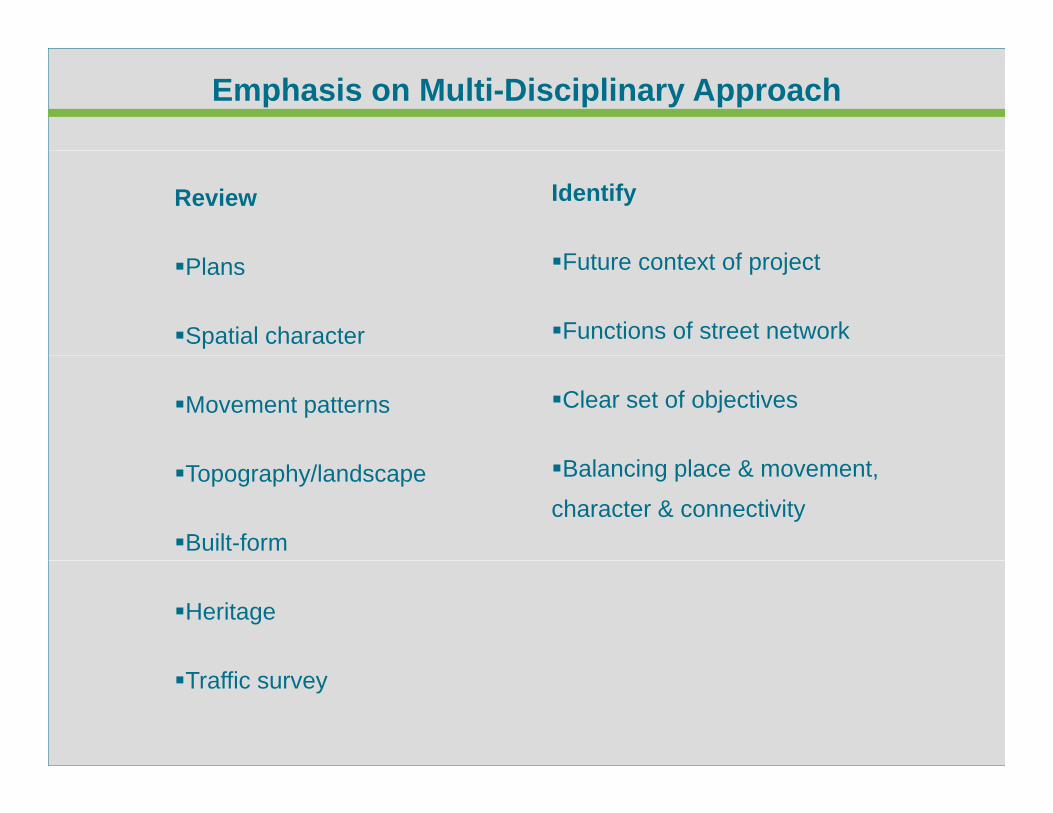
Emphasis on Multi-Disciplinary Approach
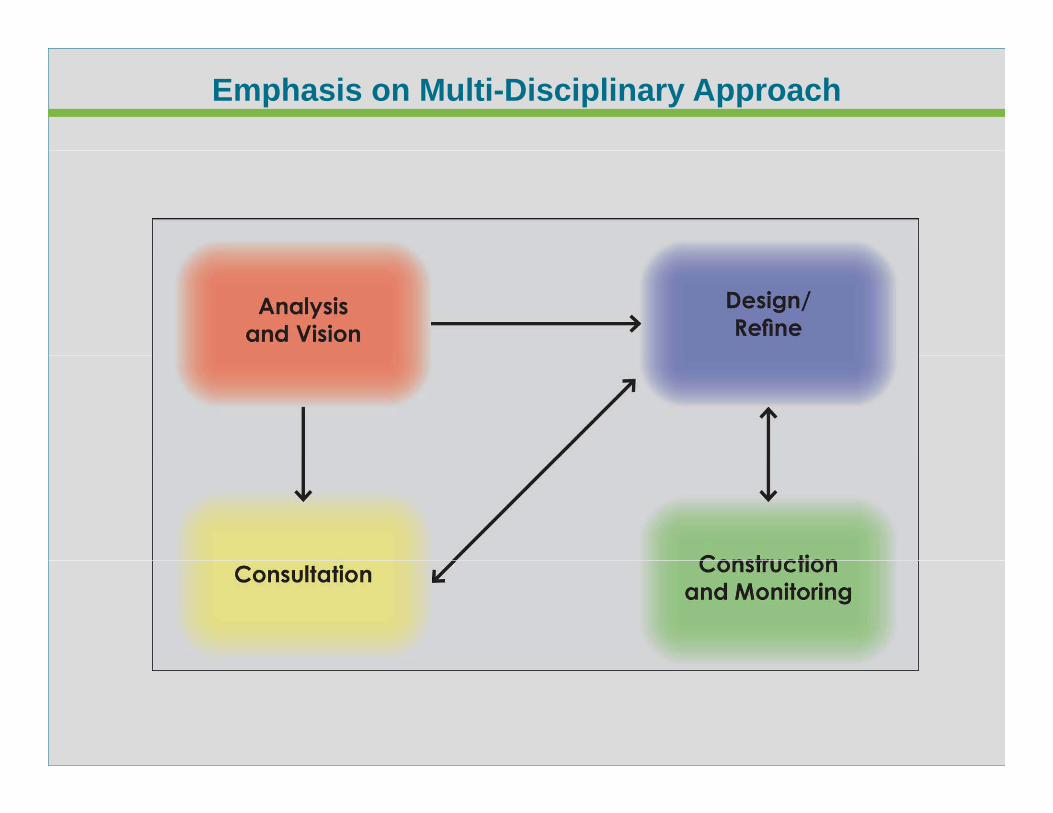
Emphasis on Multi-Disciplinary Approach
Emphasis on Multi-Disciplinary Approach
Review Identify
F f jPlans
Spatial character
Future context of project
Functions of street network
Movement patterns Clear set of objectives
Topography/landscape
Built-form
Balancing place & movement,
character & connectivity
Heritage
Traffic survey
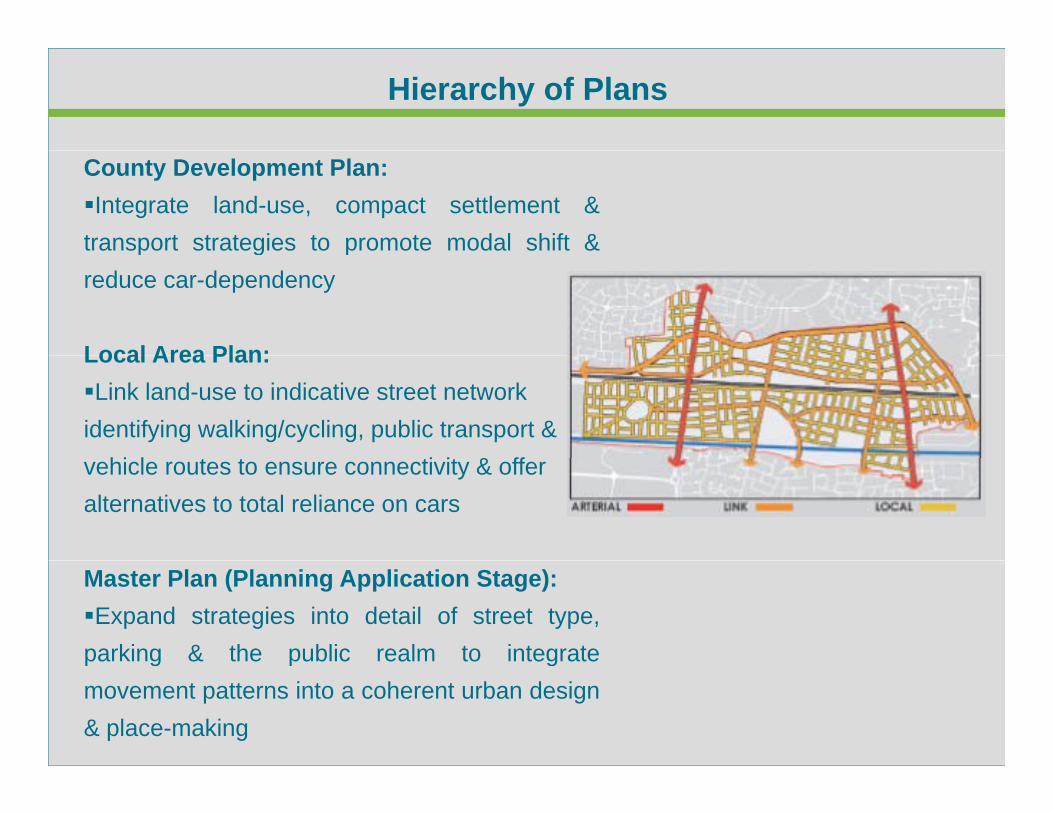
Hierarchy of Plans
County Development Plan:Integrate land-use, compact settlement &transport strategies to promote modal shift &p g preduce car-dependency
Local Area Plan:Local Area Plan:Link land-use to indicative street network identifying walking/cycling, public transport &
hi l t t ti it & ffvehicle routes to ensure connectivity & offer alternatives to total reliance on cars
Master Plan (Planning Application Stage):Expand strategies into detail of street type,parking & the public realm to integratep g p gmovement patterns into a coherent urban design& place-making
M t F k
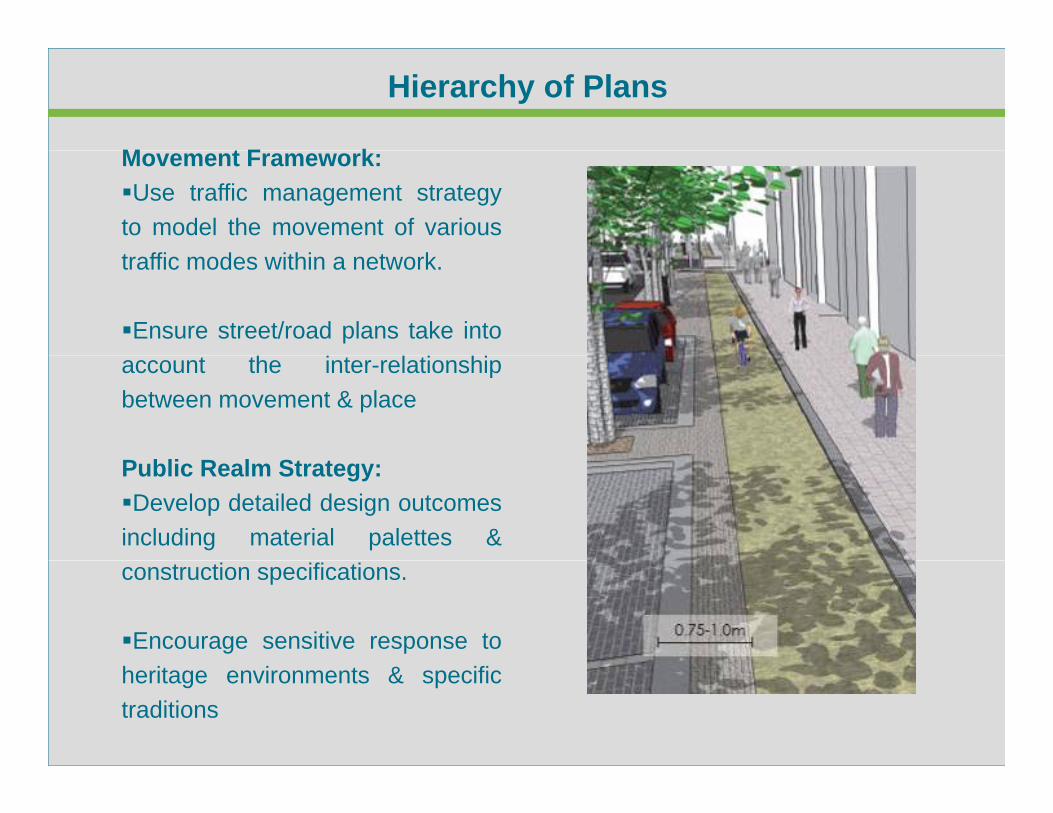
Hierarchy of Plans
Movement Framework:Use traffic management strategyto model the movement of varioust ffi d ithi t ktraffic modes within a network.
Ensure street/road plans take intoaccount the inter-relationshipbetween movement & place
Public Realm Strategy:Develop detailed design outcomesincluding material palettes &construction specifications.
Encourage sensitive response toheritage environments & specifictraditions
Quality Audits
Quality audit is a check that all the potential Social Economical & EnvironmentalQuality audit is a check that all the potential Social, Economical & Environmental opportunities within the project are realised & integrated into a coherent design of Place:
An audit of visual quality
A review of how the street is/may be used by the community
An access audit
A walking audit
A cycle audit
A non-motorised user audito oto sed use aud t
A community street audit (in existing streets) and
A place check auditA place check audit
A road safety audit, including a risk assessment
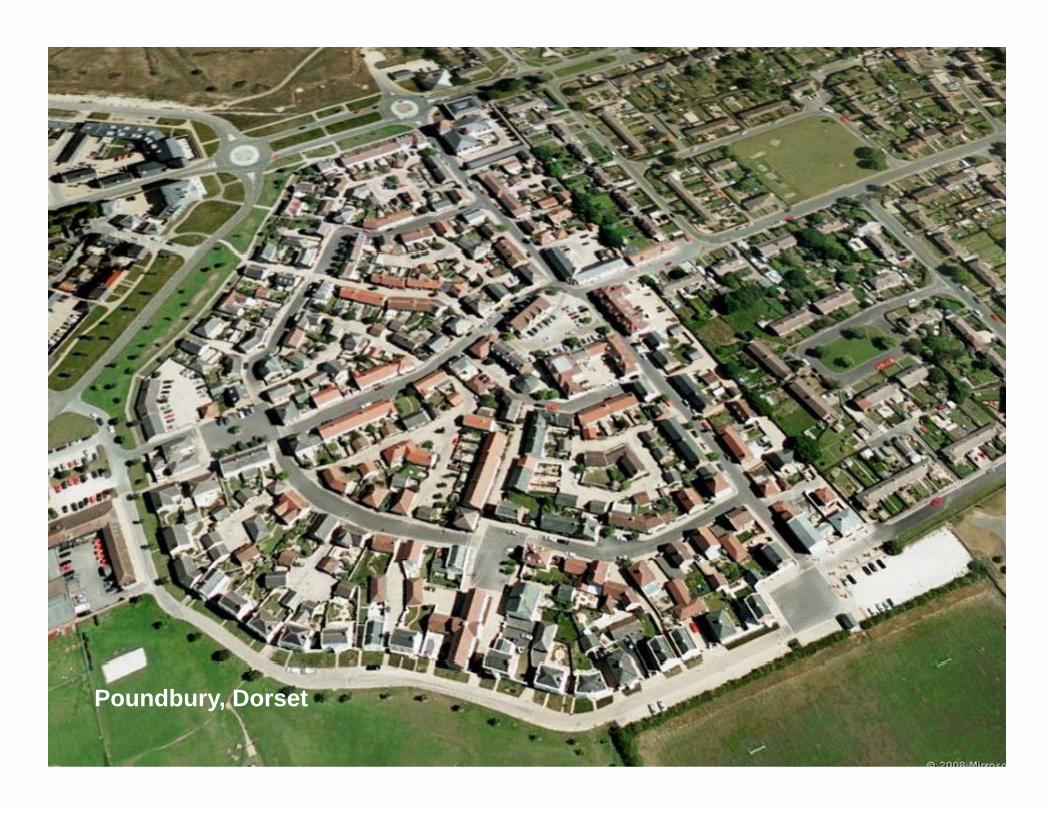
Poundbury, Dorset
Conclusions
• DMURS replaces the NRA DMRB for use of UrbanRoads and Streets.
• DMURS seeks to address the issues associated withmore conventional/traffic orientated design.
• DMURS compliments existing government polices thatpromote more attractive, walkable/Cyclable, connectedand therefore sustainable communities.
C l iConclusions
K t• Key outcomes.
– Permeable/legible urban environmentg
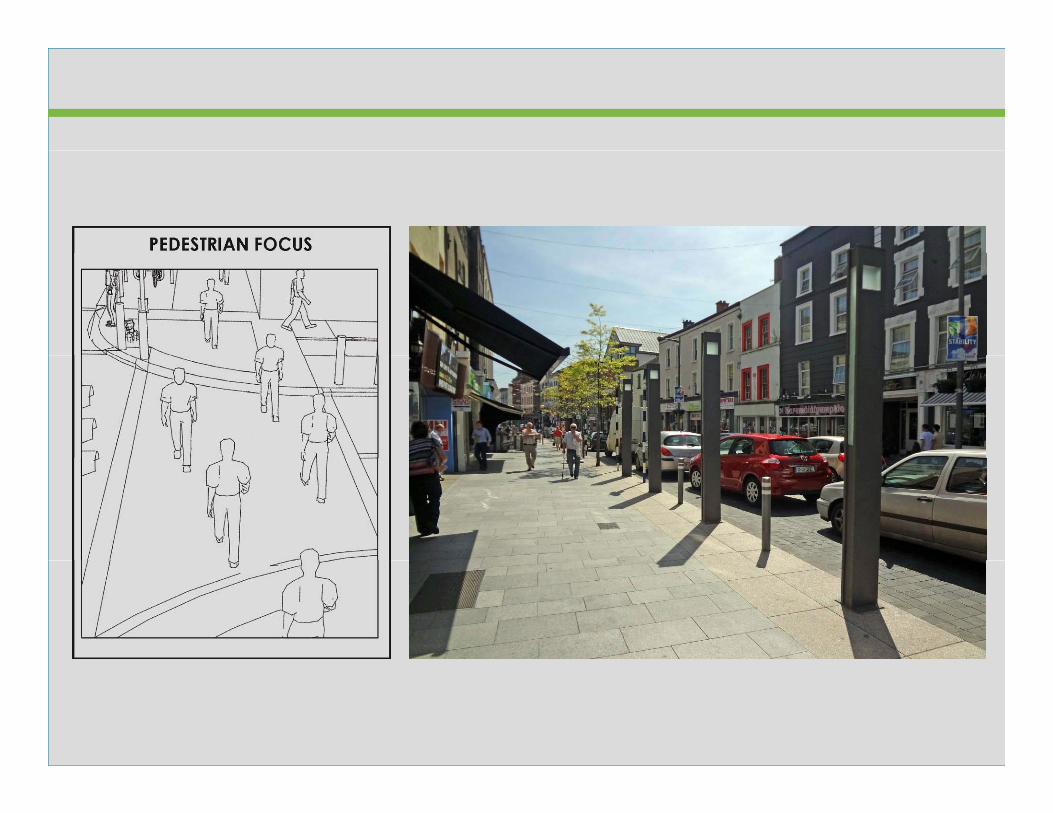
– Focus on pedestrian movement
– Enhanced place value
– Better managed vehicle speedsg p
– Multi-Disciplinary design process


![TEMPLATE Roads and Streets SCOPE Map extents …...TEMPLATE FOR LOCAL AUTHORITY STREET GUIDANCE Roads and Streets Design Guidance for [ .] SCOPE Map extents and main places within](https://static.fdocuments.in/doc/165x107/5e8989e46dc14c2eb605b611/template-roads-and-streets-scope-map-extents-template-for-local-authority-street.jpg)