Design Guidelines for Lightning Protection of PV...
122
Design Guidelines for Lightning Protection of PV systems ENG460 Engineering Thesis Final Report Mick Constable August 2012 to November 2013 A report submitted to the School of Engineering and Energy, Murdoch University in partial fulfilment of the requirements for the degree of Bachelor of Engineering. Supervisor: Dr Martina Calais
Transcript of Design Guidelines for Lightning Protection of PV...

Design Guidelines for Lightning Protection of
PV systems
ENG460 Engineering Thesis Final Report
Mick Constable
August 2012 to November 2013
A report submitted to the School of Engineering and Energy, Murdoch University in partial fulfilment of the
requirements for the degree of Bachelor of Engineering.
Supervisor: Dr Martina Calais
~ ii ~
Abstract
Lightning is a powerful and potentially destructive force of nature; failure to include appropriate
measures in the design and construction of buildings can have severe consequences. The
electrical and physical forces released during a lightning strike can result in serious damage to
structures, electrical infrastructure and the sensitive electronic components used in computers,
media devices and electronic systems that have become crucial to the modern existence.
Developments in electronics technology have resulted in the increased proliferation of PV systems
and devices that incorporate sensitive electronic components. The average modern home will
include a PV system, microwave, inverter controlled air conditioner, multiple computers and
permanently connected media devices; all contain electronic components that will fail when
exposed to the electrical surges associated with lighting strikes.
PV arrays are generally installed on the roof or immediately adjacent to a structure and generally
do not change the likelihood that lighting will strike a building. However the modules and their
associated framework provide sharp conductive points that are close to the peaks or edges of a
roof line. Therefore in the event that lightning strikes a building they are more likely to form part
of the conductive path and provide a direct connection into the structures and electrical systems
of the buildings they are mounted on.
This thesis documents the nature of lightning and the associated risk, a detailed gap analysis of
International & Australian lightning protection standards and the development of lightning
protection assessment tools. Additionally it documents the use of the developed tools to conduct
a lighting protection assessment of the recently constructed Murdoch Engineering building, which
includes 4 roof mounted PV systems that alter the building profile.
~ iii ~
Acknowledgements
I would like to thank Peter Carter, Julie Yewers, David Morrison, Melanie Harris (BOM) and
Vladimir Rakov for their assistance which made this project possible.
Thank you Gareth for the understanding and accommodations you facilitated for a mature
student completing an engineering degree while balancing the needs of raising a family and
demanding work commitments.
A special thank you goes to Martina Calais for the consistent assistance and guidance that you
provided in the development of this thesis project and throughout my engineering studies. Your
patience and dedication in assisting students to understand the electrical engineering concepts
will leave a legacy for many generations to come.
Last and the opposite of least, I would like to thank my wife and sons Nola, Brandon, Logan &
Tristan for the patience, understanding and support you have given me. I appreciate the load you
carried so that I could complete my engineering studies. I fully intend to repay with interest every
fishing trip, family function and anniversary that I deferred to sit in my office studying.

~ iv ~
Contents
Abstract ............................................................................................................................................... ii
Acknowledgements ............................................................................................................................ iii
Contents ............................................................................................................................................. iv
List of Figures .................................................................................................................................... vii
List of Tables ........................................................................................................................................ x
List of Symbols ................................................................................................................................... xi
Definitions (Glossary) ........................................................................................................................ xii
1 Introduction ............................................................................................................................... 1
2 Objectives ................................................................................................................................... 2
3 Lightning ..................................................................................................................................... 3
3.1 What is lightning? .............................................................................................................. 3
3.2 How does lightning form? .................................................................................................. 4
3.2.1 Cloud electrification ................................................................................................... 4
3.2.2 Spark propagation ...................................................................................................... 6
3.2.3 Lightning physics ........................................................................................................ 8
3.2.4 Peak Current ............................................................................................................. 10
3.3 What happens when lightning strikes the ground/object? ............................................. 11
3.3.1 Strike 1 ..................................................................................................................... 12
3.3.2 Strike 2 ..................................................................................................................... 14
3.3.3 Strike 3 ..................................................................................................................... 17
3.3.4 Strike 4 ..................................................................................................................... 19
3.3.5 Strike 5 ..................................................................................................................... 20
3.4 Is it possible to control/predict the location of a lightning strike? .................................. 22
3.4.1 Prediction of lightning activity ................................................................................. 22
3.4.2 Prediction of lightning strike point .......................................................................... 24
3.5 Is it possible to control/harness the energy transferred by lightning? ............................ 31
3.5.1 Practical Considerations ........................................................................................... 31
3.5.2 Lightning electromagnetic impulse and surge protection ....................................... 33
3.6 What lightning protection technologies exist today and how effective are they?.......... 41
3.6.1 Early streamer emission systems ............................................................................. 41
3.6.2 Laser guided lightning interception systems ........................................................... 43
3.6.3 Lightning elimination systems .................................................................................. 43
~ v ~
4 Identification of typical Australian installations ...................................................................... 44
5 Lightning protection standards gap analysis ............................................................................ 45
5.1 Purpose ............................................................................................................................ 45
5.2 Method ............................................................................................................................. 45
5.3 Results .............................................................................................................................. 46
5.3.1 Structure and content .............................................................................................. 46
5.3.2 Methods to determine requirement for lightning protection ................................. 46
5.3.3 Risk assessment tools provided by the standards ................................................... 46
5.3.4 Recommended protection methods ........................................................................ 47
6 Audit sheet development......................................................................................................... 48
6.1 Purpose ............................................................................................................................ 48
6.2 Method ............................................................................................................................. 48
6.3 Results .............................................................................................................................. 48
7 Lightning protection requirements tool ................................................................................... 49
7.1 Purpose ............................................................................................................................ 49
7.2 Method ............................................................................................................................. 49
7.3 Excel tool overview .......................................................................................................... 49
8 Case study ................................................................................................................................ 56
8.1 Purpose ............................................................................................................................ 56
8.2 Method ............................................................................................................................. 56
8.3 Results .............................................................................................................................. 56
9 Conclusion ................................................................................................................................ 59
10 Recommendations for further work .................................................................................... 60
11 Bibliography ......................................................................................................................... 61
Australian Installations ............................................................................................. 65 Appendix A
....................................................................................................................................... 66 Appendix B
Structure and Content of Standard .................................................................................. 66 B.1
B.1.1 Comparison of IEC 62305-1 and AS / NZS 1768 ....................................................... 66
B.1.2 Observations ............................................................................................................ 66
B.1.3 Comparison of IEC 62305-2 and AS / NZS 1768 ....................................................... 68
B.1.4 Observations ............................................................................................................ 69
B.1.5 Comparison of IEC 62305-3 and AS / NZS 1768 ....................................................... 70
B.1.6 Observations ............................................................................................................ 71
B.1.7 Comparison of IEC 62305-4 and AS / NZS 1768 ....................................................... 72
~ vi ~
B.1.8 Observations ............................................................................................................ 73
B.1.9 Information gaps not identified by the one way IEC to AS / NZS Analysis............... 74
Risk Assessment Process .................................................................................................. 75 B.2
Excel Based Risk assessment tools provided with the standards .................................... 80 B.3
Recommended Protection methods ................................................................................ 82 B.4
Case Study: Murdoch Engineering Building ............................................................. 83 Appendix C
C.1.1 Copper cladding façade and colorbond roofing materials ....................................... 84
C.1.2 Cantilever overhang for Northwest corner .............................................................. 84
C.1.3 Smart wiring and use of sensitive computer equipment ......................................... 85
C.1.4 Frame mounted, roof top PV system and associated power electronics ................ 85
C.1.5 Lightning Protection System (LPS) design ................................................................ 88
Risk Assessments .............................................................................................................. 91 C.2
C.2.1 AN /NZS 1768 Risk Assessment ................................................................................ 92
C.2.2 IEC Risk Assessment tool developed as part of this project .................................... 93
C.2.3 Engineering building audit work sheet .................................................................... 99
~ vii ~
List of Figures
Figure 3.1 Different types of Lightning .............................................................................................. 3
Figure 3.2 Cloud structure supporting Graupel and Ice collision mechanism (National Weather
Service 2010) ...................................................................................................................................... 5
Figure 3.3 Convection mechanism cloud development ..................................................................... 5
Figure 3.4 Convection mechanism cloud electrification .................................................................... 6
Figure 3.5 Stepped leader process steps. Adapted from Uman(1997,2001) ..................................... 7
Figure 3.6 Simple model of the Impulse current parameters for a cloud to ground lightning strike. 9
Figure 3.7 Front edge of an impulse current, displaying time constant and maximum current
derivative parameters. ....................................................................................................................... 9
Figure 3.8 Different strikes experienced by a exposed building ...................................................... 11
Figure 3.9 Electrical circuit for a down conductor system .............................................................. 12
Figure 3.10 Inductions loop impacted by lightning currents ........................................................... 13
Figure 3.11 Calculation of induced Voltage ..................................................................................... 13
Figure 3.12 Calculation of induced voltage Loop 3 .......................................................................... 14
Figure 3.13 Strike 2 to a standalone PV array that has been installed with insufficient
consideration of impact of induction current in the down conductor system. ............................... 14
Figure 3.14 Electrical circuit representation of Figure 2.13 ............................................................. 15
Figure 3.15 System circuit diagram of Strike to overhead power line ............................................. 17
Figure 3.16 Damaged PV modules, overheating of localised sections within the module consistent
with overvoltage induced bypass diode failure, potentially as a result of distant lightning. (Surge
Protection Devices Ltd Unknown) .................................................................................................... 18
Figure 3.17 Damaged PV Inverter: Overvoltage induced damage to PV components damage, the
right hand picture displays damage at incoming connection to inverter power card, which would
be consistent with a surge caused by lightning to overhead power lines external to the
installation. (Surge Protection Devices Ltd Unknown). ................................................................... 18
Figure 3.18 Ground voltage gradient as a result of a lightning strike. ............................................. 19
Figure 3.19 Maximum ground voltage and step potential profiles experienced during a lightning
strike to moist sandy soil ................................................................................................................. 20
Figure 3.20 Damage to buried cables caused by Triggered lightning at the International Centre for
Lightning Research, Camp Blanding, Florida (V. A. Rakov 2011) ..................................................... 21
~ viii ~
Figure 3.21 Representation of global Lighting flash data obtained from LIS and ODT Satellite
sensors. Image developed by Marit Jentoft-Nilsen (NASA Earth Observatory 2006)...................... 22
Figure 3.22 40km by 40km grid, cloud to ground lightning strike probability and National Weather
service warning maps used to provide real time regional lightning strike probability in North
America. (Bothwell 2006) (National Oceanic and Atmospheric Administration 2013) ................... 23
Figure 3.23 Real time lightning flash occurrence and ground flash density maps for in use in
Australia today. ................................................................................................................................ 24
Figure 3.24 Geometric model for identification of lightning strike point. ....................................... 25
Figure 3.25 Zone of Protection on a structure established by a rolling sphere of radius a. Adapted
from AS1768 ..................................................................................................................................... 26
Figure 3.26 Application of the rolling sphere method to a complex comprised of multiple building
of different dimensions, the red areas indicate areas that are exposed to direct lightning strikes.
(DEHN + SOHNE 2007) ..................................................................................................................... 26
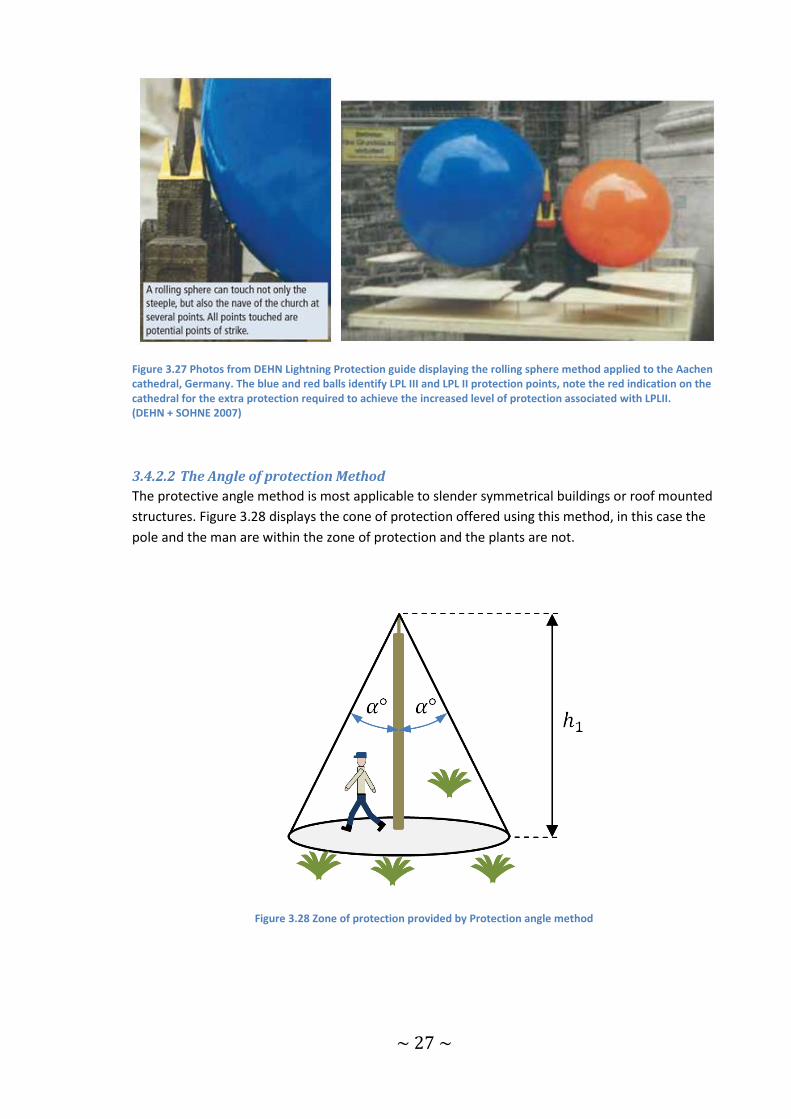
Figure 3.27 Photos from DEHN Lightning Protection guide displaying the rolling sphere method
applied to the Aachen cathedral, Germany. The blue and red balls identify LPL III and LPL II
protection points, note the red indication on the cathedral for the extra protection required to
achieve the increased level of protection associated with LPLII. (DEHN + SOHNE 2007) ..... 27
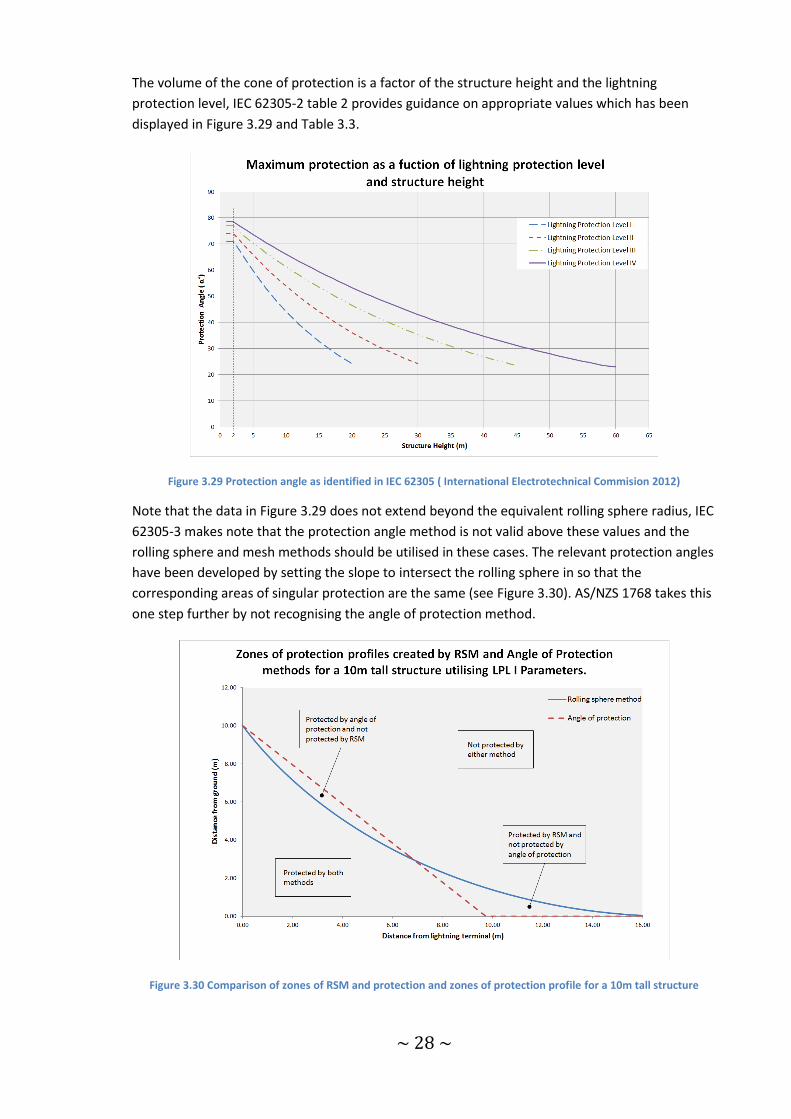
Figure 3.28 Zone of protection provided by Protection angle method ........................................... 27
Figure 3.29 Protection angle as identified in IEC 62305 ( International Electrotechnical Commision
2012) ................................................................................................................................................ 28
Figure 3.30 Comparison of zones of RSM and protection and zones of protection profile for a 10m
tall structure ..................................................................................................................................... 28
Figure 3.31 Mesh Method Applied to a Factory unit ....................................................................... 30
Figure 3.32 Lightning Protection Zone concept diagram. Adapted from IEC 62305-4 Figure 1 ...... 34
Figure 3.33 Single phase Series connected individual module SPD's and a three phase shunt
connected modular SPD ................................................................................................................... 36
Figure 3.34 Schematic diagrams for a Series SPD; the internal schematic is representative of 1
phase of a typical circuits used in commercial SPD's, this circuit would be duplicated for all phases
and neutral, other components may be used to provide additional features (diodes to prevent
reverse bias issues). ......................................................................................................................... 37
Figure 3.35 Selection and placement of SPD’s for Lightning protection (schematic diagram).
Adapted from IEC 62305-4 ............................................................................................................... 39
Figure 3.36 Images of different air terminals, the image to left portrays a conventional air terminal
while the 4 right images are representative of ESE air terminals. Images adapted from various
internet LPS advertisements. ........................................................................................................... 42
~ ix ~
Figure 7.1 Excel Summary and Data Entry page displaying red, green and black formatting to guide
the use .............................................................................................................................................. 50
Figure 7.2 RSM Chart Data Entry ..................................................................................................... 51
Figure 7.3 Levels 1 & 2 of the Risk Calculation sheet ....................................................................... 52
Figure 7.4 level 2 & 3 Risk Component Summary and detail ........................................................... 53
Figure 7.5 Level 2 & 3 Risk Component Calculation sections .......................................................... 53
Figure 7.6 Level 5 the risk component calculation for” Average number of dangerous events due
to flashes” ........................................................................................................................................ 54
Figure 7.7 Visual comparison of meta-file data and Australian ground flash density map provided
in AS / NZS 1768 ............................................................................................................................... 55
Figure 8.1 Zone of protection that could be achieved using the PV array frame. ........................... 57
Figure Appendix B.1 AS /NZS 1768 risk assessment process flow chart .......................................... 78
Figure Appendix B.2 IEC 623505 risk assessment process flow chart ............................................. 79
Figure Appendix B.3 IEC 62305 excel risk assessment tool front screen ......................................... 80
Figure Appendix B.4 AS / NS excel risk assessment tool front screen ............................................. 80
Figure Appendix B.5 AS / NZS Excel risk assessment tool data and calculations screen ................. 81
Figure Appendix C.1 Location of Murdoch Engineering building..................................................... 83
Figure Appendix C.2 Potential down conductor routing ................................................................. 84
Figure Appendix C.3 Installed down conductor compared with Figure Appendix C.2 .................... 84
Figure Appendix C.4 Murdoch Engineering building Roof top PV systems external components .. 85
Figure Appendix C.5 Cable routing of roof top PV system ............................................................... 86
Figure Appendix C.6 Murdoch engineering building roof top PV system internal components ..... 87
Figure Appendix C.7 Lightning protection zone dimensions ........................................................... 90
Figure Appendix C.8 Murdoch Engineering building array zone of protection assessment ............ 90
Figure Appendix C.9 Murdoch Engineering building roof top layout and Lightning protection
system .............................................................................................................................................. 90
Figure Appendix C.10 AS / NZS Excel tool Lightning protection risk assessment for Murdoch
Engineering building......................................................................................................................... 92
~ x ~
List of Tables
Table 3.1 Physical parameters used for induced voltage calculations. ........................................... 15
Table 3.2 Rolling sphere radius as a function LPL and minimum peak current. Adapted from IEC
62305-1 Table 4 ................................................................................................................................ 25
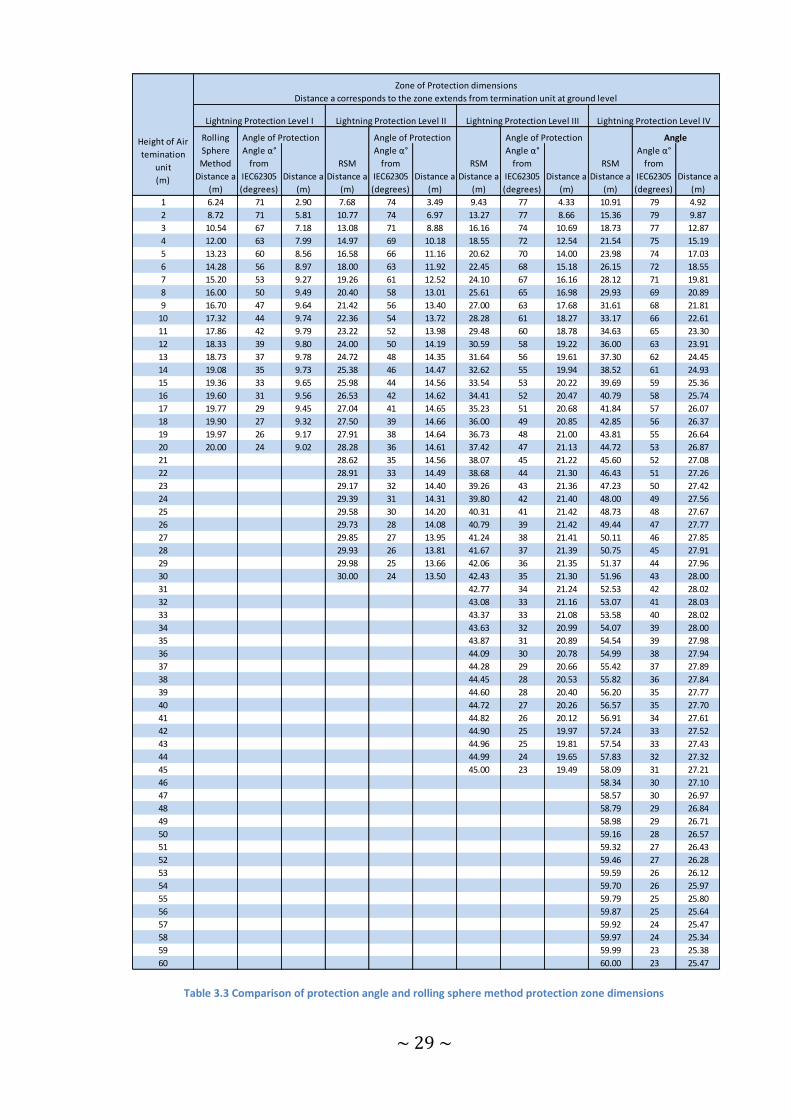
Table 3.3 Comparison of protection angle and rolling sphere method protection zone dimensions
.......................................................................................................................................................... 29
Table 3.4 Maximum mesh size for a given Lightning protection level ............................................. 31
Table 3.5 Modified RSM method for large flat surfaces. Adapted from AS/NZS 1768 table 4.2..... 31
Table 3.6 Typical values for overall flash data for downward negative lightning. Adapted from
Table 1.1 “Lightning Physics and Effects” (Uman and Rakov 2003) ................................................ 32
Table 3.7 Lightning Energy available at specific locations within Australia ..................................... 32
Table 3.8 LPZ design comments for Figure 3.32 .............................................................................. 34
Table 5.1 Content quality observation frequency from analysis in Appendix B.2 ........................... 46
Table Appendix A.1 Extract from table documenting Australian Installations ................................ 65
Table Appendix B.1 Content Comparison IEC 62305-1 & AS/NZS 1768 .......................................... 66
Table Appendix B.2 Content Comparison IEC 62305-2 & AS/NZS 1768 .......................................... 68
Table Appendix B.3 Content Comparison IEC 62305-3 & AS/NZS 1768 .......................................... 70
Table Appendix B.4 Content Comparison IEC 62305-4 & AS/NZS 1768 .......................................... 72
Table Appendix B.5 Comparison of risk components ...................................................................... 77
Table Appendix B.6 Comparison of recommended methods. ........................................................ 82
Table Appendix C.1 Murdoch Engineering building roof top PV systems internal components ..... 87
Table Appendix C.2 Risk of loss of human life results for major centres in Australia ...................... 91

~ xi ~
List of Symbols
A = Area = Step or touch distance
= Angle of Protection = Magnetic flow density at interval r = Length of open loop of array circuit C = Coulomb = Open loop to down conductor separation distance = Distance between conductor and centre of open induction loop
(
)
= Maximum current derivative
= Impulse current = Peak current during a lightning strike J = Joule K = Kelvin = Correction factor for the peak current = Width of open loop of array circuit = Mutual inductance = Permeability of free space Ω = Ohmn = Mutual inductance = Permeability of free space = Ground Resistivity (Ωm) Q = Charge Rconductor = Electrical resistance of down conductor Rground = Electrical resistance of ground terminal to mass of earth rB = Final step distance for a stepped leader to the point of attachment = Time = front time constant = tail time constant V = Voltage or potential difference
⁄ ∫
= Specific energy or action integral
= Mesh Width = distance from point of strike = Maximum voltage at the air termination device during a lightning strike
= Maximum voltage at the main earth bar during a lightning strike = Potential difference between distance and the point of strike (V) = Step or touch potential (Voltage between body parts in contact with the
voltage gradient)
= Magnetic flux in a closed loop °C = Degrees Centigrade
~ xii ~
Definitions (Glossary)
AC
Alternating current
Air termination Device
A vertical or horizontal conductor of an LPS, positioned so as to intercept a lightning discharge,
which establishes a protection zone.
Bypass diode
A diode that is connected in parallel with a PV module, or a group of PV cells within a PV module,
and prevents the PV module or group of cells from being reverse biased.
DC
Direct current
Down conductor
A conductor that connects an air termination device with an earth termination
Earthing electrodes
A conductive rod or cable installed into the ground to create a direct low resistance electrical
contact with the earth.
Impulse current
The current injected into a system or object by a lightning strike
Inverter
A device which converts DC currents into AC currents
Junction box
An enclosure where cables are terminated or connected to electrical equipment
L1, L2, L3
The phases of a three-phase AC power system.
Lightning electromagnetic pulse (LEMP)
The electromagnetic pulse associated with a lightning discharge.
~ xiii ~
Lightning strike (or flash)
An electrical discharge in the atmosphere involving one or more electrically charged regions, most
commonly in a cumulonimbus cloud, taking either of the following forms:
a. (IC) Intra Cloud: a lightning flash that occurs between regions of a cloud
b. (CC) Cloud to Cloud: a lightning flash that occurs between different clouds
c. (CG) Cloud to Ground: a lightning flash that occurs between a cloud and the ground
Lightning protection system (LPS)
Complete system used to reduce the danger of physical damages or injury caused by direct
lightning strikes to a structure. It consists of air termination devices, down conductors and
earthing electrodes.
Lightning Protection Zone (LPZ)
An area of increased protection from the effects of Lightning due to the coordinated application
of an LPS, surge protection, magnetic shield, line routing or equipotential techniques
Lightning strike attachment point
The point on the ground or on a structure where the lightning connects during a lightning strike
Protection level
A set of maximum and minimum lightning parameters that have been defined to enable the
appropriate selection of lightning protection system components and placement in line with the
probability of a strike
PV system
The entire photovoltaic arrangement inclusive of PV array, inverters, and all other components to
deliver electrical energy to distribution board or equipment
Risk assessment
The process of identifying the potential risk of loss due to a lightning strike taking into account
potential or established measures to limit the mitigate the probability or consequence of the loss.
This process is also known as risk management.
Risk component
Partial risk assessed according to the source of damage and the type of damage.
Service
A service line entering a structure E.G. Electrical Power, communications or other services

~ xiv ~
Step or Touch Potential
The difference in voltage experienced by a person whose body is in contact with objects or
locations of different electrical potential
Structure
Any building or construction, process plant, storage tank, tree, or similar, that protrudes from or is
embedded in the ground.
Surge protective device (SPD)
A device that is intended to mitigate surge over voltages and overcurrent’s
Thunder-day
A calendar day during which thunder is heard at a given location
Tolerable risk
Maximum value of the risk that can be tolerated in the structure that is to be protected. Also
referred to as acceptable risk, being the maximum value of risk acceptable based on community
expectations.
Zone of Protection
The portion of space within which an object or structure is considered to be protected from a
direct strike by an LPS.
~ 1 ~
1 Introduction
Commercial Engineering design and construction relies heavily on the application of international,
national, regional and organisational based standards. They are used ensure proven
methodologies are applied to prevent potentially catastrophic failure or harm to living beings and
the environment. The first objective of any investigation in the event of failure generally includes
a check to identify if the item was designed and made according to the applicable standards.
AS5033 Installation of photovoltaic (PV) arrays is the principle standard for the design and
installation of Australian PV systems, it attempts to provide guidance on how suitable lightning
protection and overvoltage protection should be achieved. However the guidance is general in
nature and makes frequent references to European standards such IEC 62305 Protection against
lightning. The referencing of a non-Australian standard has the potential to create confusion,
especially considering the existence of an appropriate Australian standard namely AS 1768
lightning protection. The confusion is increased as AS/NZS 1768 and IEC 62305 utilise a risk
management approach to lightning protection requirements compared with approach taken by
AS5033 Section 3.5.1 which states;
“For a residential building located in a lightning area where the lightning flash density Ng is greater than two flashes per square kilometre per year, protection against overvoltage surges due to lightning is recommended.” (Standards Australia 2012)
Therefore it is not clear what requirements Australian photovoltaic array designers and installers
must comply with. The potential for error is increased as IEC standards are not commonly
available to Australian Engineering companies. It is common practise for companies to purchase a
license agreement from SAI Global for access to Australian standards, which generally does not
include access to the IEC suite of standards.
The case study in this thesis project validated that the confusion issue is real when the review of a
lightning protection report for the Engineering building (inclusive of a roof mounted PV system)
made frequent reference to the AS 1768 standard with a complete lack of to the IEC 62305
standard.
This confusion drove a need to evaluate what approach should be taken to design a standards
compliant PV system in Australia. The aim of this thesis is to understand the principles and
methodologies behind the standards, apply the gained understanding to conduct a detailed gap
analysis and develop tools that can be used by an Australian designer to evaluate structures in
accordance with both standards.
~ 2 ~
2 Objectives
The success of the project will be determined by the documented completion of the following
tasks;
1. Conduct background research on the nature of lightning through responses to the following 6
questions;
What is lightning?
Why does lightning strike?
What happens when lightning strikes the ground/object?
Is it possible to control/predict the location of a lightning strike? If so how?
Is it possible to control/harness the energy transferred by lightning? If so how?
What lightning protection technologies exist today and how effective are they?
2. Identify typical Australian photovoltaic array installations.
3. Conduct a lightning protection gap analysis to identify discrepancies between the Australian
standards AS1768:2007 Lightning protection and European standard IEC 62305 Protection
against lightning.
4. Develop an appropriate set of cost effective lightning protection designs.
5. Develop a photovoltaic array installation lightning protection audit sheet that can be used to
evaluate the compliance of an installations standards
6. Develop an excel tool that can be used by Australian designers to evaluate the lightning
protection system requirements for photovoltaic installations.
7. Use the tools in a case study, which will evaluate the lightning protection requirements of the
Murdoch Engineering building with particular focus on the impacts of the installation roof
mounted PV system.
~ 3 ~
3 Lightning
3.1 What is lightning? The oxford dictionary defines “lightning” as:
“The occurrence of a natural electrical discharge of very short duration and high voltage between a cloud and
the ground or within a cloud, accompanied by a bright flash and typically also thunder” (Oxford Unversity
Press 2012)
Lightning is the electrostatic discharge that occurs when the strength of the electric fields
contained within the atmosphere exceeds the dielectric strength of the atmosphere between
them. Generally lightning is associated with thunderstorms comprised of Cumulonimbus clouds,
section 2.2 will explore the mechanisms that occur within Cumulonimbus clouds to facilitate the
generation of the electric charge and associated electric field that results in the spark propagation
and subsequent lightning strikes.
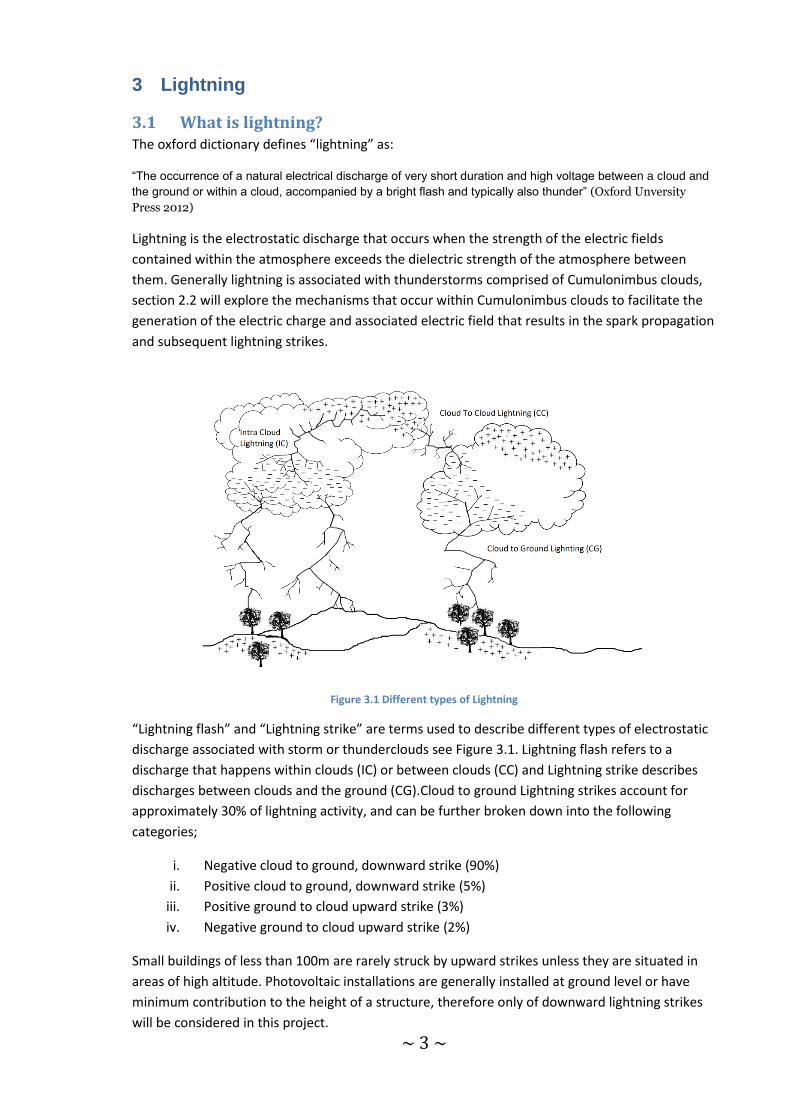
Figure 3.1 Different types of Lightning
“Lightning flash” and “Lightning strike” are terms used to describe different types of electrostatic
discharge associated with storm or thunderclouds see Figure 3.1. Lightning flash refers to a
discharge that happens within clouds (IC) or between clouds (CC) and Lightning strike describes
discharges between clouds and the ground (CG).Cloud to ground Lightning strikes account for
approximately 30% of lightning activity, and can be further broken down into the following
categories;
i. Negative cloud to ground, downward strike (90%)
ii. Positive cloud to ground, downward strike (5%)
iii. Positive ground to cloud upward strike (3%)
iv. Negative ground to cloud upward strike (2%)
Small buildings of less than 100m are rarely struck by upward strikes unless they are situated in
areas of high altitude. Photovoltaic installations are generally installed at ground level or have
minimum contribution to the height of a structure, therefore only of downward lightning strikes
will be considered in this project.
~ 4 ~
3.2 How does lightning form?
Lightning is a multicomponent process that includes 4 stages;
1. Charge accumulation / cloud electrification
2. Spark propagation
3. First stroke &
4. Subsequent strokes
Stages 3 & 4 will be explored in sub section 3.2.3.
3.2.1 Cloud electrification
Downward lightning strikes are almost exclusively produced by Cumulonimbus clouds that have
been exposed to the necessary metrological conditions required to generate sufficient charge
separation with in the cloud structure. It is worth noting that not all Cumulonimbus clouds
produce lightning, however their large vertical formation creates the conditions required for most
cloud electrification theorems.
The mechanisms that generate this charge separation, is the subject of ongoing research and
understanding and is divided between two principle theories;
Graupel-ice collision mechanism
Convection mechanism
This purpose of the inclusion of these theorems is not to discuss their correctness; an
appreciation of the different principles can help to understand some of the different methods
used to achieve lightning protection of structures.
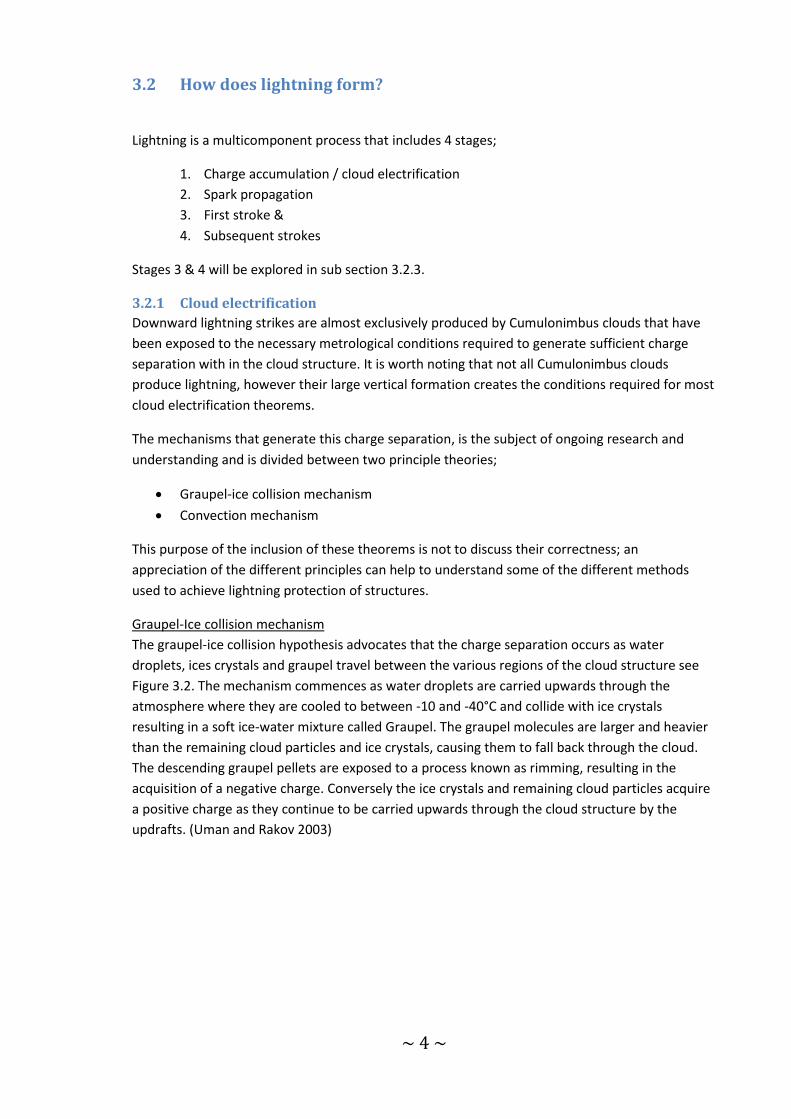
Graupel-Ice collision mechanism
The graupel-ice collision hypothesis advocates that the charge separation occurs as water
droplets, ices crystals and graupel travel between the various regions of the cloud structure see
Figure 3.2. The mechanism commences as water droplets are carried upwards through the
atmosphere where they are cooled to between -10 and -40°C and collide with ice crystals
resulting in a soft ice-water mixture called Graupel. The graupel molecules are larger and heavier
than the remaining cloud particles and ice crystals, causing them to fall back through the cloud.
The descending graupel pellets are exposed to a process known as rimming, resulting in the
acquisition of a negative charge. Conversely the ice crystals and remaining cloud particles acquire
a positive charge as they continue to be carried upwards through the cloud structure by the
updrafts. (Uman and Rakov 2003)
~ 5 ~
Figure 3.2 Cloud structure supporting Graupel and Ice collision mechanism (National Weather Service 2010)
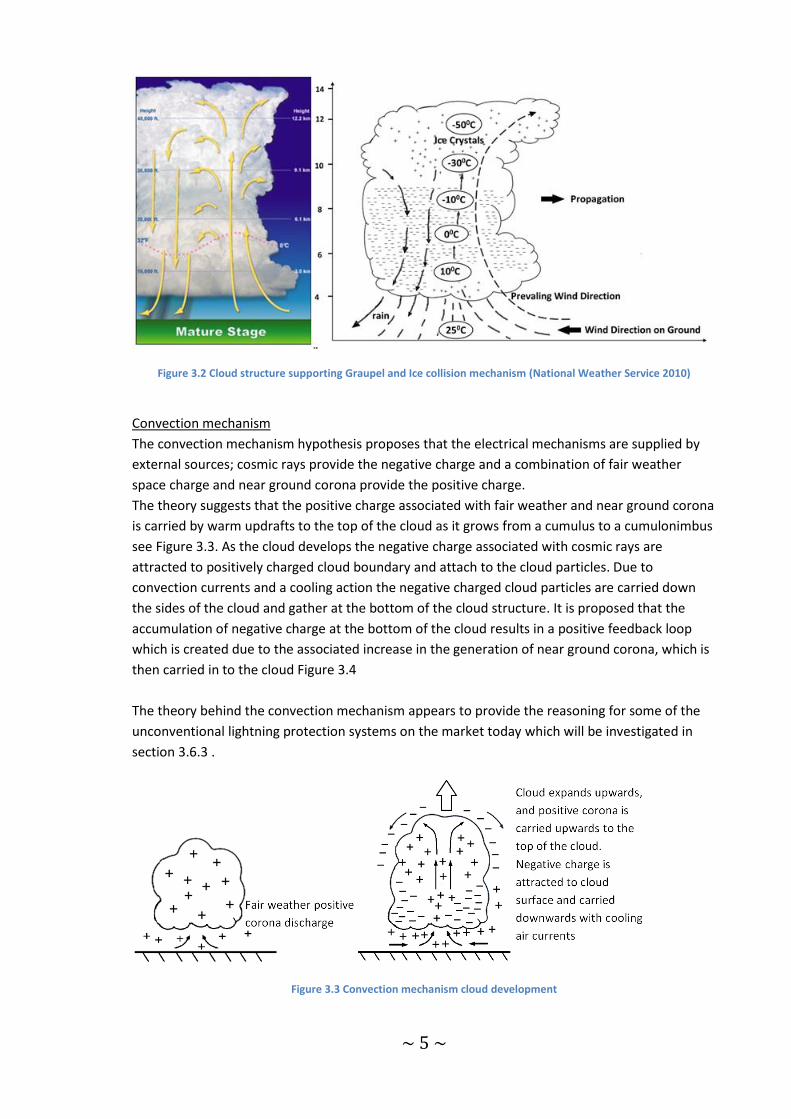
Convection mechanism
The convection mechanism hypothesis proposes that the electrical mechanisms are supplied by
external sources; cosmic rays provide the negative charge and a combination of fair weather
space charge and near ground corona provide the positive charge.
The theory suggests that the positive charge associated with fair weather and near ground corona
is carried by warm updrafts to the top of the cloud as it grows from a cumulus to a cumulonimbus
see Figure 3.3. As the cloud develops the negative charge associated with cosmic rays are
attracted to positively charged cloud boundary and attach to the cloud particles. Due to
convection currents and a cooling action the negative charged cloud particles are carried down
the sides of the cloud and gather at the bottom of the cloud structure. It is proposed that the
accumulation of negative charge at the bottom of the cloud results in a positive feedback loop
which is created due to the associated increase in the generation of near ground corona, which is
then carried in to the cloud Figure 3.4
The theory behind the convection mechanism appears to provide the reasoning for some of the
unconventional lightning protection systems on the market today which will be investigated in
section 3.6.3 .
Figure 3.3 Convection mechanism cloud development
~ 6 ~
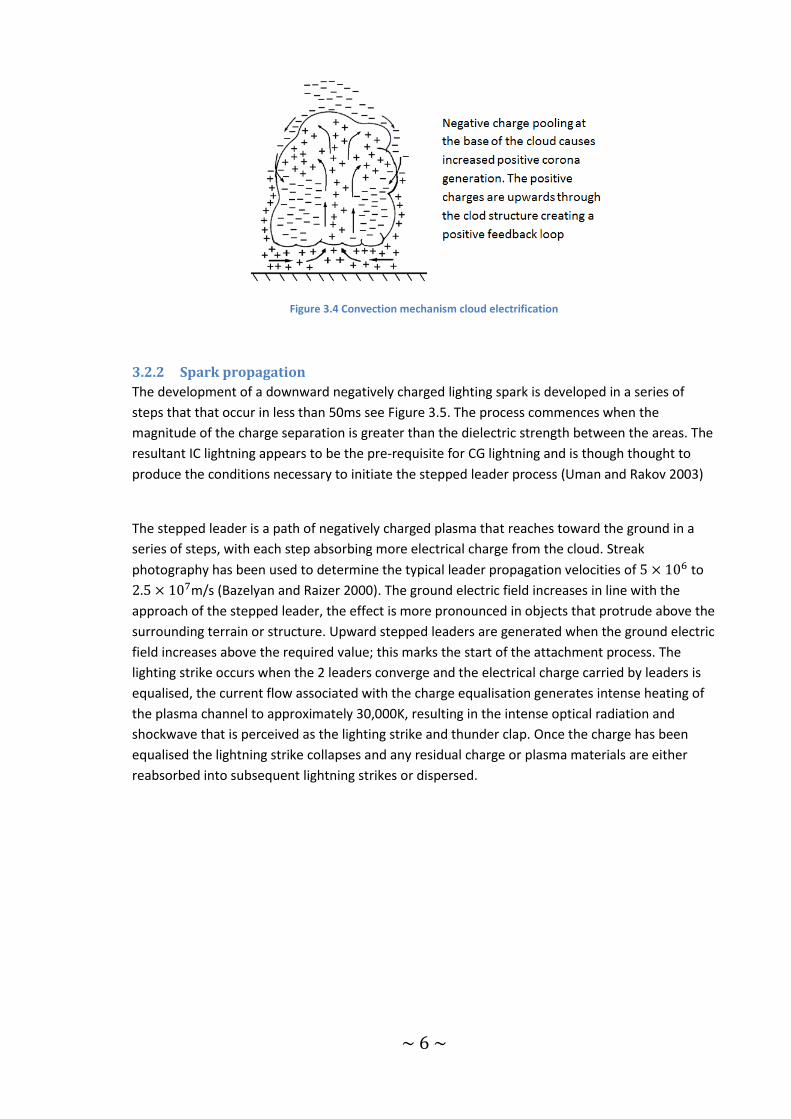
Figure 3.4 Convection mechanism cloud electrification
3.2.2 Spark propagation
The development of a downward negatively charged lighting spark is developed in a series of
steps that that occur in less than 50ms see Figure 3.5. The process commences when the
magnitude of the charge separation is greater than the dielectric strength between the areas. The
resultant IC lightning appears to be the pre-requisite for CG lightning and is though thought to
produce the conditions necessary to initiate the stepped leader process (Uman and Rakov 2003)
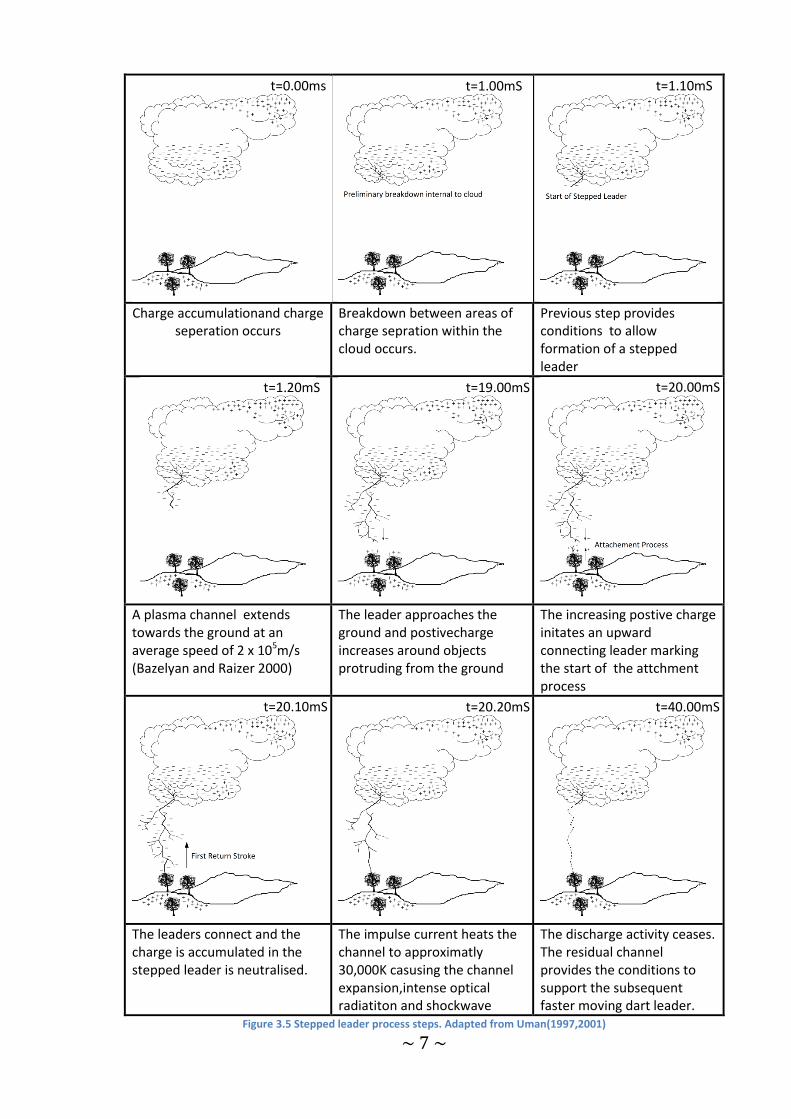
The stepped leader is a path of negatively charged plasma that reaches toward the ground in a
series of steps, with each step absorbing more electrical charge from the cloud. Streak
photography has been used to determine the typical leader propagation velocities of to
m/s (Bazelyan and Raizer 2000). The ground electric field increases in line with the
approach of the stepped leader, the effect is more pronounced in objects that protrude above the
surrounding terrain or structure. Upward stepped leaders are generated when the ground electric
field increases above the required value; this marks the start of the attachment process. The
lighting strike occurs when the 2 leaders converge and the electrical charge carried by leaders is
equalised, the current flow associated with the charge equalisation generates intense heating of
the plasma channel to approximately 30,000K, resulting in the intense optical radiation and
shockwave that is perceived as the lighting strike and thunder clap. Once the charge has been
equalised the lightning strike collapses and any residual charge or plasma materials are either
reabsorbed into subsequent lightning strikes or dispersed.
~ 7 ~
Charge accumulationand charge
seperation occurs Breakdown between areas of charge sepration within the cloud occurs.
Previous step provides conditions to allow formation of a stepped leader
A plasma channel extends towards the ground at an average speed of 2 x 10⁵m/s (Bazelyan and Raizer 2000)
The leader approaches the ground and postivecharge increases around objects protruding from the ground
The increasing postive charge initates an upward connecting leader marking the start of the attchment process
The leaders connect and the charge is accumulated in the stepped leader is neutralised.
The impulse current heats the channel to approximatly 30,000K casusing the channel expansion,intense optical radiatiton and shockwave
The discharge activity ceases. The residual channel provides the conditions to support the subsequent faster moving dart leader.
Figure 3.5 Stepped leader process steps. Adapted from Uman(1997,2001)
t=0.00ms
t=40.00mS
t=1.00mS t=1.10mS
t=1.20mS t=19.00mS t=20.00mS
t=20.10mS t=20.20mS
~ 8 ~
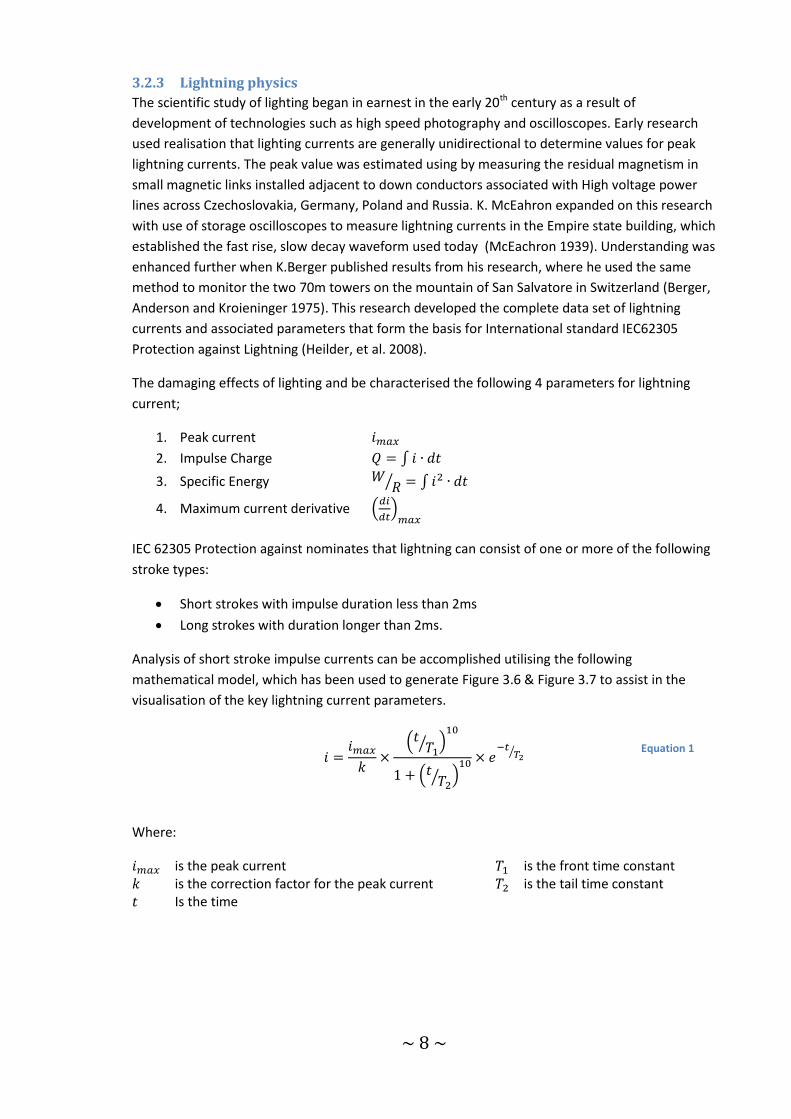
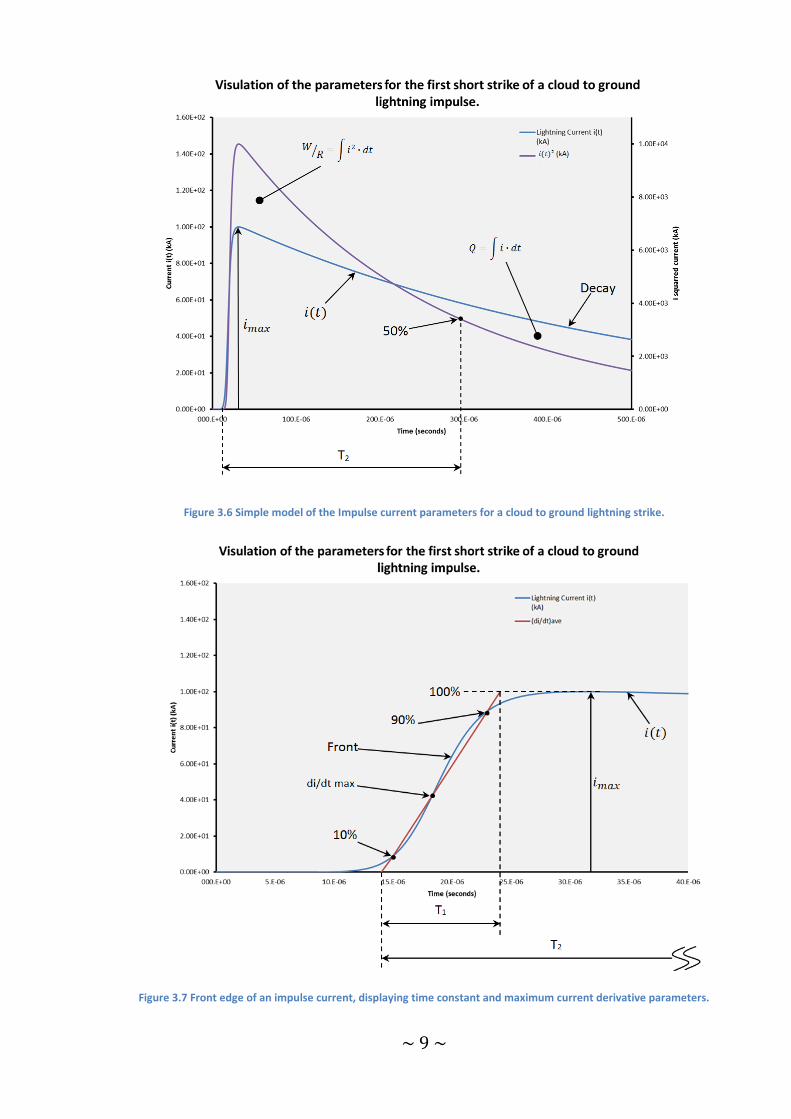
3.2.3 Lightning physics
The scientific study of lighting began in earnest in the early 20th century as a result of
development of technologies such as high speed photography and oscilloscopes. Early research
used realisation that lighting currents are generally unidirectional to determine values for peak
lightning currents. The peak value was estimated using by measuring the residual magnetism in
small magnetic links installed adjacent to down conductors associated with High voltage power
lines across Czechoslovakia, Germany, Poland and Russia. K. McEahron expanded on this research
with use of storage oscilloscopes to measure lightning currents in the Empire state building, which
established the fast rise, slow decay waveform used today (McEachron 1939). Understanding was
enhanced further when K.Berger published results from his research, where he used the same
method to monitor the two 70m towers on the mountain of San Salvatore in Switzerland (Berger,
Anderson and Kroieninger 1975). This research developed the complete data set of lightning
currents and associated parameters that form the basis for International standard IEC62305
Protection against Lightning (Heilder, et al. 2008).
The damaging effects of lighting and be characterised the following 4 parameters for lightning
current;
1. Peak current
2. Impulse Charge ∫
3. Specific Energy ⁄ ∫
4. Maximum current derivative (
)
IEC 62305 Protection against nominates that lightning can consist of one or more of the following
stroke types:
Short strokes with impulse duration less than 2ms
Long strokes with duration longer than 2ms.
Analysis of short stroke impulse currents can be accomplished utilising the following
mathematical model, which has been used to generate Figure 3.6 & Figure 3.7 to assist in the
visualisation of the key lightning current parameters.
( ⁄ )
( ⁄ )
⁄ Equation 1
Where:
is the peak current is the front time constant is the correction factor for the peak current is the tail time constant Is the time
~ 9 ~
Figure 3.6 Simple model of the Impulse current parameters for a cloud to ground lightning strike.
Figure 3.7 Front edge of an impulse current, displaying time constant and maximum current derivative parameters.
~ 10 ~
3.2.4 Peak Current
Research of peak lightning currents has identified that for 99% of
all negative and positive cloud to ground lightning strikes respectively (V. A. Rakov 2007, Berger,
Anderson and Kroieninger 1975).
Allowance for peak current plays a significant part in the design of grounding systems and sizing
of down conductors to eliminate voltage spikes and side flashes. IEC 62305 recommends that an
earth termination system resistance < 10Ω is maintained and will be explored further in section
3.3. ( International Electrotechnical Commision 2012)
3.2.4.1 Impulse Charge (Q)
The impulse charge Q is the time integral of the lighting current for the duration of the flash and is
responsible for the melting effects at the attachment point for the lightning channel. Typical
values for negative cloud to ground lightning range from 1 to 20 coulomb, positive CG lightning is
substantially larger with values ranging from 20 to 350 coulomb (Bazelyan and Raizer 2000,
Berger, Anderson and Kroieninger 1975).
IEC 62305-3 table 3 specifies minimum thickness for metal sheets and pipes used in air
termination systems to address these melting effects and will be explored further in section 3.3.
3.2.4.2 Specific Energy (W/R)
The time integral of represents the specific energy of the lighting impulse, also known as the
action integral, this parameter is used to characterise the mechanical impacts of the lightning
strike that result in the heating or generation of movement. Typical values for the specific energy
transferred by negative CG impulses are in the range of to A2s and 2.5
to A2s for positive flashes (Bazelyan and Raizer 2000) (Berger, Anderson and
Kroieninger 1975).
3.2.4.3 Maximum Current derivative (
)
The maximum current derivative and average front describes the speed of change of the current
in the impulse and is used to characterise the electrical inductive response in conductors not
carrying the principle lightning current. Lightning protection techniques that protect against the
impacts of this characteristic focus on preventing the impacts of induction by physical /electrical
separation & magnetic shielding or through the use of devices to redirect the energy associated
with over voltages and current surges. Typical values for naturally occurring lightning flashes are
in the range of 1 to 280 kA/μs (Berger, Anderson and Kroieninger 1975) (Heilder, et al. 2008), the
impacts of the maximum current derivative will be further explored in section 3.3.
~ 11 ~
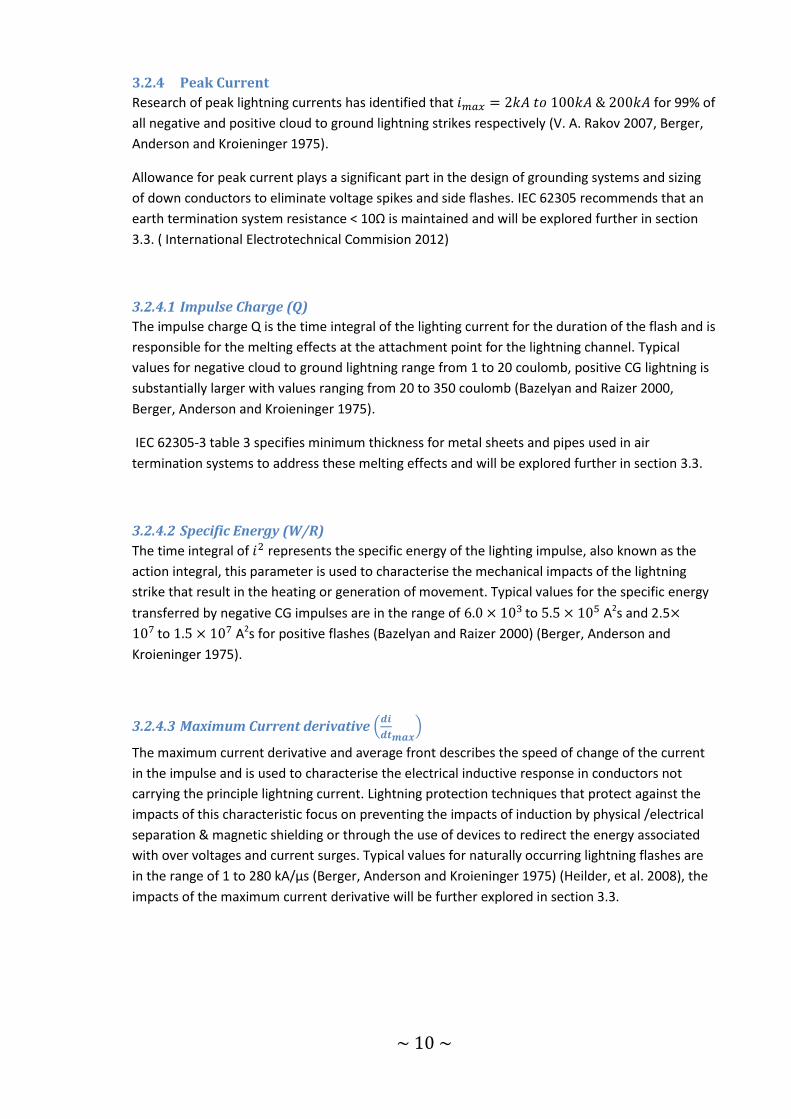
3.3 What happens when lightning strikes the ground/object?
What happens when lightning strikes / object or the ground will be explored by considering the
case displayed in Figure 3.8 . The building is the highest structure in the local area and is grid
connected with 2 PV arrays.
Figure 3.8 Different strikes experienced by a exposed building
Strike 1 A direct strike to the lightning conductor on the building, impulse current flows along the down conductors to ground and into interconnected systems. Induced currents occur in conductive materials located near down conductors.
Strike 2 A direct strike to the frame of photovoltaic array, impulse current flows along the down conductors to ground and into interconnected systems. Induced currents occur in conductive materials located near down conductors.
Strike 3 Direct strike to Electrical distribution system overhead cables, The Impulse current flows along the power distribution system into the building electrical system, current flows into the earthing systems of distribution poles.
Strike 4 Direct strike to the ground near overhead power lines, elevated ground potentials occur in the vicinity of the lighting strike.
Strike 5 Direct strike to the ground near building and / or Photovoltaic array, elevated ground potentials occur in the vicinity of the lighting strike causing elevated voltages in the building and PV array earthing systems, physical damage can occur to underground services, cables and pipes.
Note
The building, power poles and photovoltaic array
are well grounded with suitably sized down
conductors.
~ 12 ~
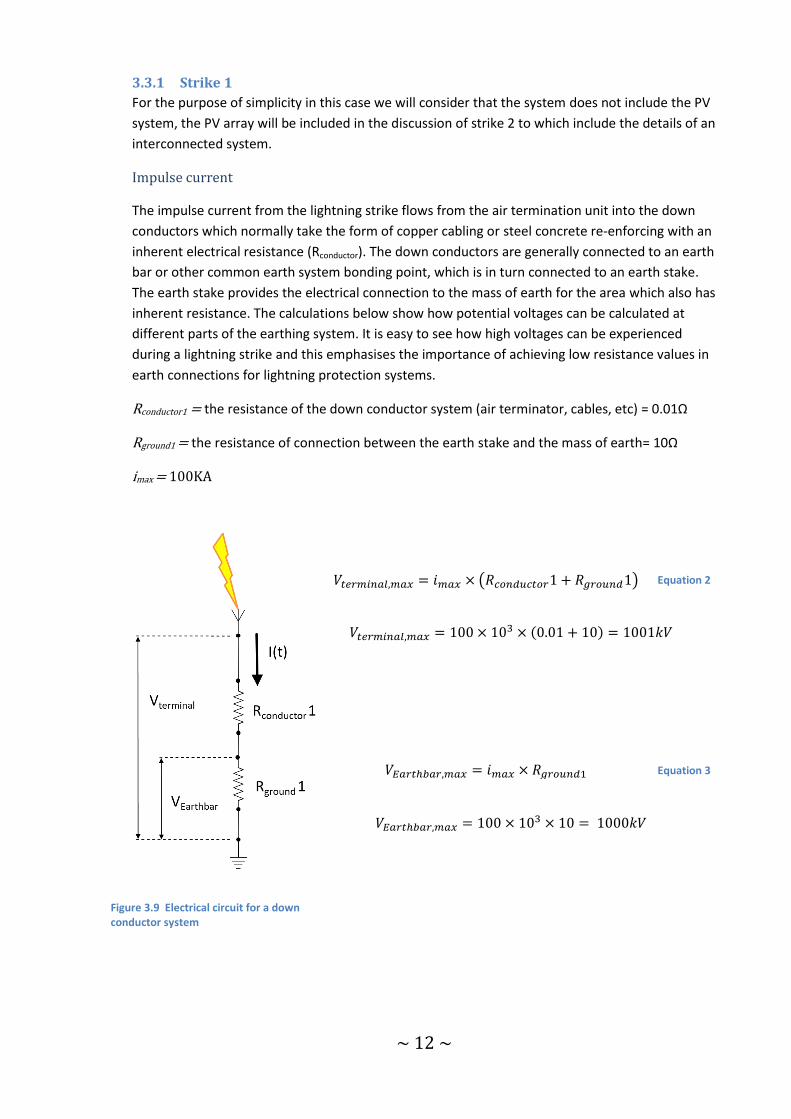
3.3.1 Strike 1
For the purpose of simplicity in this case we will consider that the system does not include the PV
system, the PV array will be included in the discussion of strike 2 to which include the details of an
interconnected system.
Impulse current
The impulse current from the lightning strike flows from the air termination unit into the down
conductors which normally take the form of copper cabling or steel concrete re-enforcing with an
inherent electrical resistance (Rconductor). The down conductors are generally connected to an earth
bar or other common earth system bonding point, which is in turn connected to an earth stake.
The earth stake provides the electrical connection to the mass of earth for the area which also has
inherent resistance. The calculations below show how potential voltages can be calculated at
different parts of the earthing system. It is easy to see how high voltages can be experienced
during a lightning strike and this emphasises the importance of achieving low resistance values in
earth connections for lightning protection systems.
Rconductor1 = the resistance of the down conductor system (air terminator, cables, etc) = 0.01Ω
Rground1 = the resistance of connection between the earth stake and the mass of earth= 10Ω
imax = 100KA
( )
( ) Equation 2
Equation 3
Figure 3.9 Electrical circuit for a down conductor system
~ 13 ~
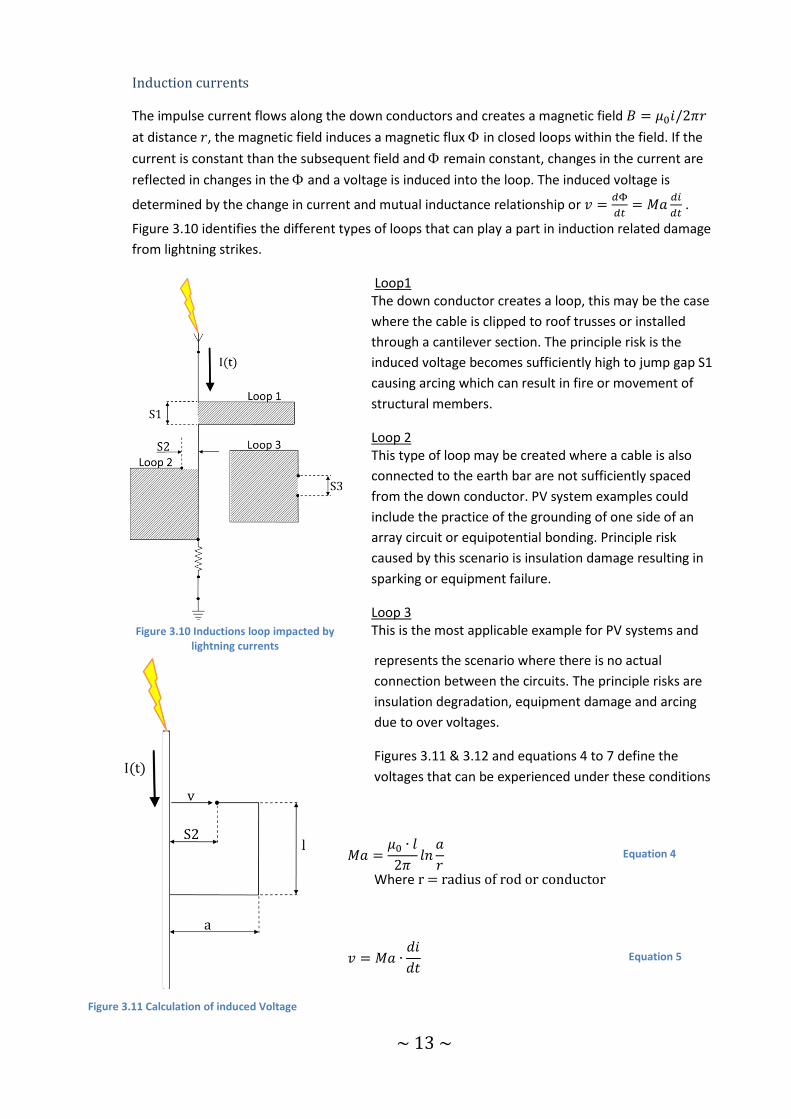
Induction currents
The impulse current flows along the down conductors and creates a magnetic field
at distance , the magnetic field induces a magnetic flux in closed loops within the field. If the
current is constant than the subsequent field and remain constant, changes in the current are
reflected in changes in the and a voltage is induced into the loop. The induced voltage is
determined by the change in current and mutual inductance relationship or
.
Figure 3.10 identifies the different types of loops that can play a part in induction related damage
from lightning strikes.
Loop1 The down conductor creates a loop, this may be the case
where the cable is clipped to roof trusses or installed
through a cantilever section. The principle risk is the
induced voltage becomes sufficiently high to jump gap S1
causing arcing which can result in fire or movement of
structural members.
Loop 2 This type of loop may be created where a cable is also
connected to the earth bar are not sufficiently spaced
from the down conductor. PV system examples could
include the practice of the grounding of one side of an
array circuit or equipotential bonding. Principle risk
caused by this scenario is insulation damage resulting in
sparking or equipment failure.
Loop 3 This is the most applicable example for PV systems and
represents the scenario where there is no actual
connection between the circuits. The principle risks are
insulation degradation, equipment damage and arcing
due to over voltages.
Figures 3.11 & 3.12 and equations 4 to 7 define the
voltages that can be experienced under these conditions
Where r = radius of rod or conductor
Equation 4
Equation 5
Figure 3.10 Inductions loop impacted by lightning currents
Figure 3.11 Calculation of induced Voltage

~ 14 ~
3.3.2 Strike 2
Figure 3.13 displays the case of of a strike to the PV array lightning termional, the to a standalone
pv array has been installed with lighnting protection although it has the following defects In that
has been installed with lightning portection Although lightning protection is evident it has the
following defects;
Down conductor cabling installed adjacent to PV array cabling. ( note the green and
orange lines in Figure 3.13)
The down conductor path for the downcondutor from the struck terminal does does not
travel to ground via the most direct path. (Note how the green cable travels along the top
of the array prior to heading to ground on the the right hand support).
PV array cabling has been installed with a large open loop. ( Note the loop created by the
orange cable)
Figure 3.13 Strike 2 to a standalone PV array that has been installed with insufficient consideration of impact of induction current in the down conductor system.
Equation 6
Equation 7
Green Line represents LPS Down conductor cabling. Orange line represents PV array cabling.
Figure 3.12 Calculation of induced voltage Loop 3
~ 15 ~
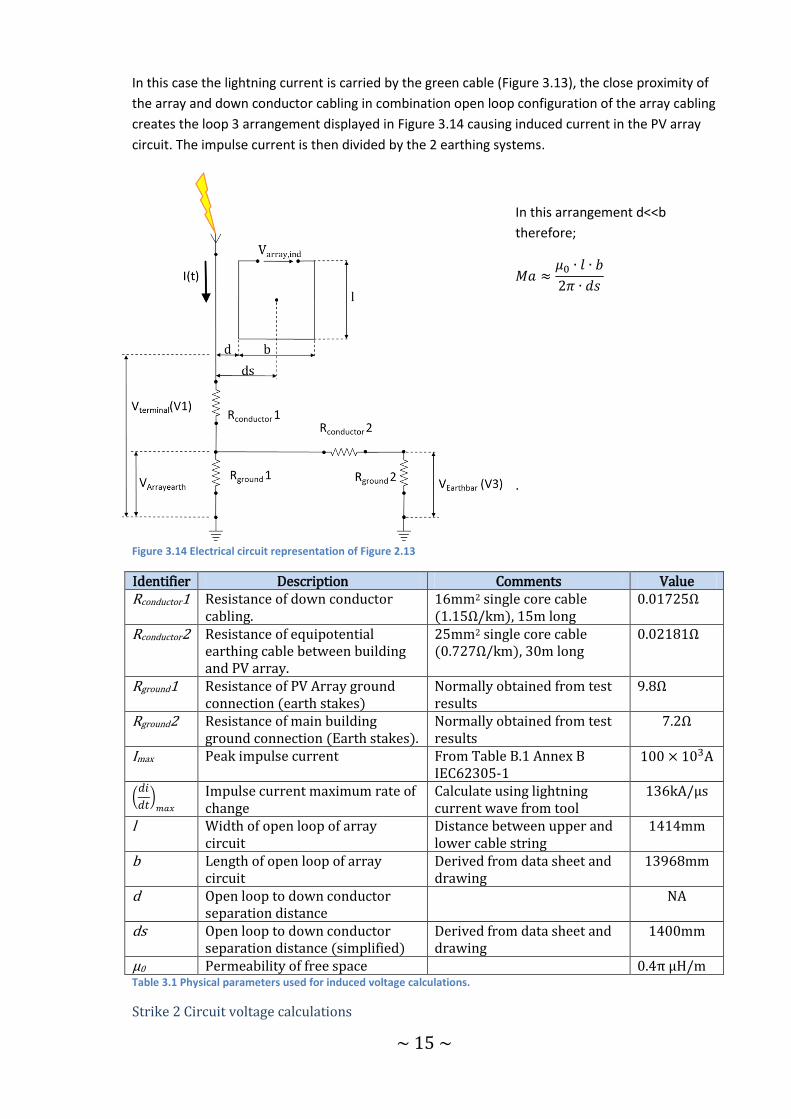
In this case the lightning current is carried by the green cable (Figure 3.13), the close proximity of
the array and down conductor cabling in combination open loop configuration of the array cabling
creates the loop 3 arrangement displayed in Figure 3.14 causing induced current in the PV array
circuit. The impulse current is then divided by the 2 earthing systems.
In this arrangement d<<b
therefore;
.
Figure 3.14 Electrical circuit representation of Figure 2.13
Identifier Description Comments Value Rconductor1 Resistance of down conductor
cabling. 16mm2 single core cable ( Ω km), 15m long
0.01725Ω
Rconductor2 Resistance of equipotential earthing cable between building and PV array.
25mm2 single core cable ( 7 7Ω km) 3 m long
8 Ω
Rground1 Resistance of PV Array ground connection (earth stakes)
Normally obtained from test results
9 8Ω
Rground2 Resistance of main building ground connection (Earth stakes).
Normally obtained from test results
7 Ω
Imax Peak impulse current From Table B.1 Annex B IEC62305-1
A
(
)
Impulse current maximum rate of change
Calculate using lightning current wave from tool
136kA/μs
l Width of open loop of array circuit
Distance between upper and lower cable string
1414mm
b Length of open loop of array circuit
Derived from data sheet and drawing
13968mm
d Open loop to down conductor separation distance
NA
ds Open loop to down conductor separation distance (simplified)
Derived from data sheet and drawing
1400mm
μ0 Permeability of free space 4π μH m Table 3.1 Physical parameters used for induced voltage calculations.
Strike 2 Circuit voltage calculations

~ 16 ~
Air Termination unit Voltage (V1)
( ( )
)
Equation 8
( 7 9 8 ( 8 7 )
9 8 8 7 ) 4 7 7
Array Common Earthing Point Voltage (V2)
( )
Equation 9
9 8 ( 8 7 )
9 8 8 7 4 78
Building Earth Bar Voltage (V3)
3 7 7 73 4 4 7
Earthing System Node Voltage differentials
V1-V2=1.725kV; V2-V3=1.255kV
PV Array circuit induced current
4 (
)
4 3 4π 3 9 8 4 4
4 384
Low voltage equipment and cabling are normally constructed with an insulation rating of 1kV,
therefore it is easy to see how the circuit voltages in the strike 2 scenario can result in damage to
living beings and equipment. The following devices are at particular risk of damage due to
potential differences in the earthing system;
PV Array bypass diodes
PV System inverter
Electrical metering and protection devices connected to the building earth bar.
~ 17 ~
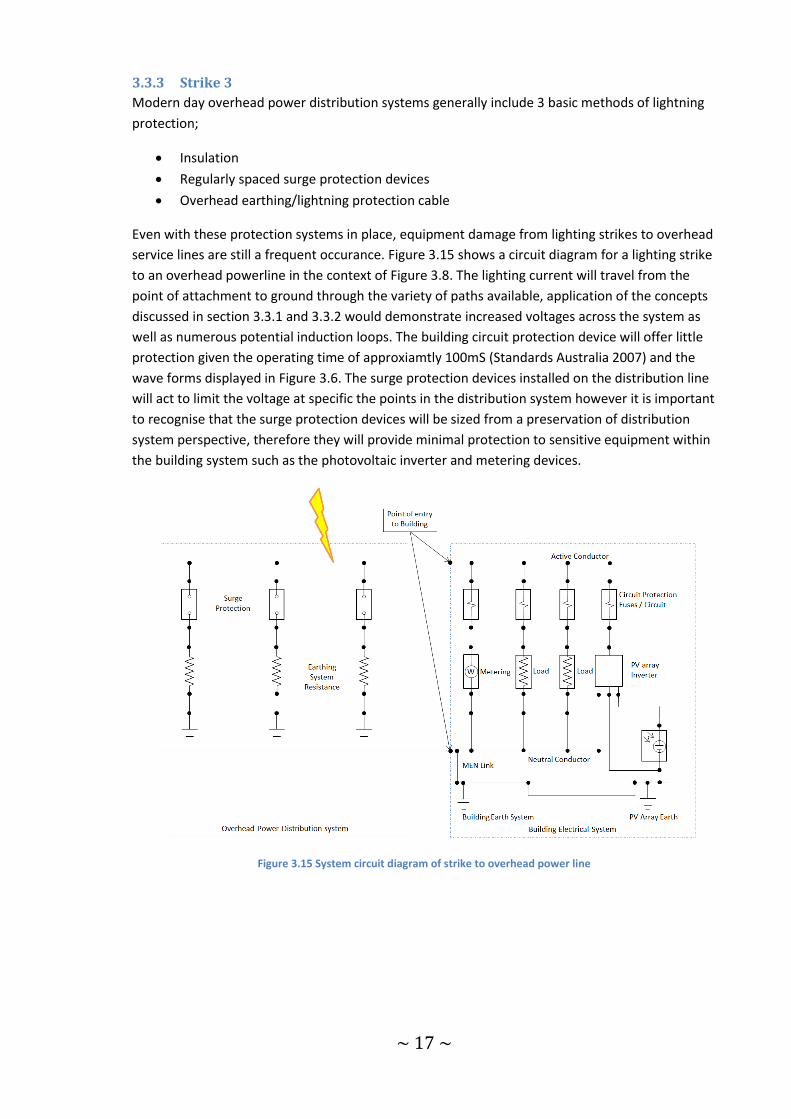
3.3.3 Strike 3
Modern day overhead power distribution systems generally include 3 basic methods of lightning
protection;
Insulation
Regularly spaced surge protection devices
Overhead earthing/lightning protection cable
Even with these protection systems in place, equipment damage from lighting strikes to overhead
service lines are still a frequent occurance. Figure 3.15 shows a circuit diagram for a lighting strike
to an overhead powerline in the context of Figure 3.8. The lighting current will travel from the
point of attachment to ground through the variety of paths available, application of the concepts
discussed in section 3.3.1 and 3.3.2 would demonstrate increased voltages across the system as
well as numerous potential induction loops. The building circuit protection device will offer little
protection given the operating time of approxiamtly 100mS (Standards Australia 2007) and the
wave forms displayed in Figure 3.6. The surge protection devices installed on the distribution line
will act to limit the voltage at specific the points in the distribution system however it is important
to recognise that the surge protection devices will be sized from a preservation of distribution
system perspective, therefore they will provide minimal protection to sensitive equipment within
the building system such as the photovoltaic inverter and metering devices.
Figure 3.15 System circuit diagram of strike to overhead power line
~ 18 ~
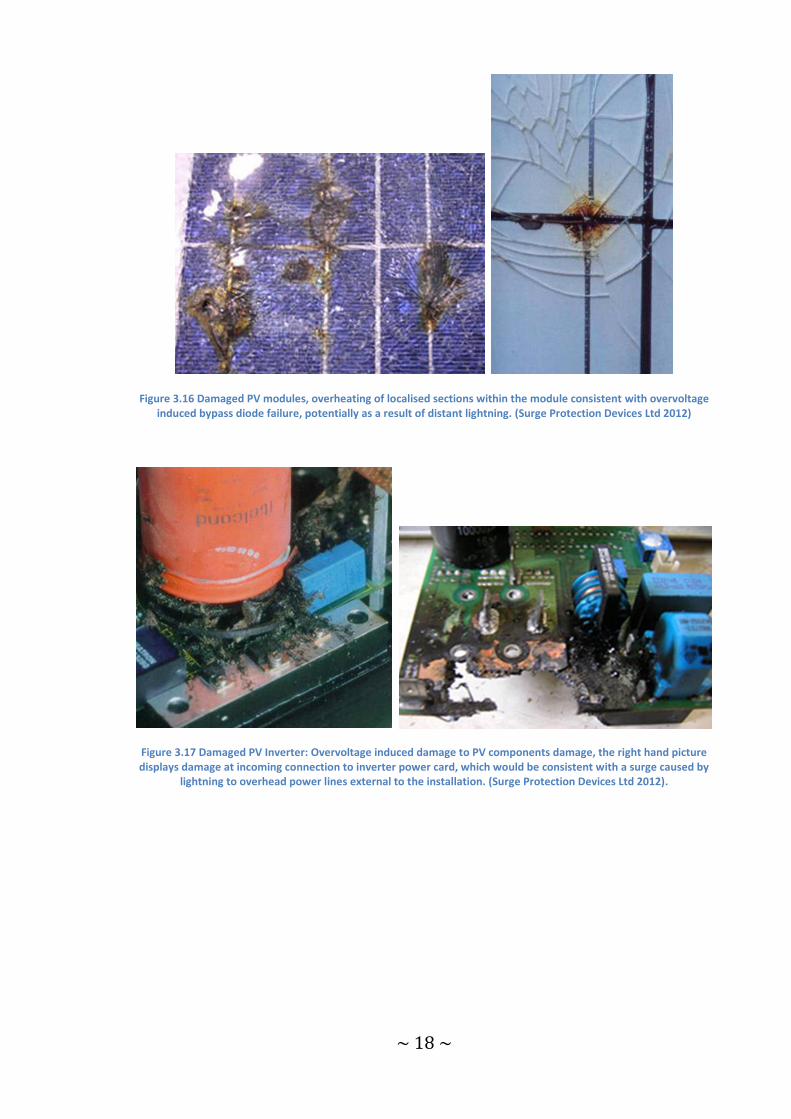
Figure 3.16 Damaged PV modules, overheating of localised sections within the module consistent with overvoltage induced bypass diode failure, potentially as a result of distant lightning. (Surge Protection Devices Ltd 2012)
Figure 3.17 Damaged PV Inverter: Overvoltage induced damage to PV components damage, the right hand picture displays damage at incoming connection to inverter power card, which would be consistent with a surge caused by
lightning to overhead power lines external to the installation. (Surge Protection Devices Ltd 2012).
~ 19 ~
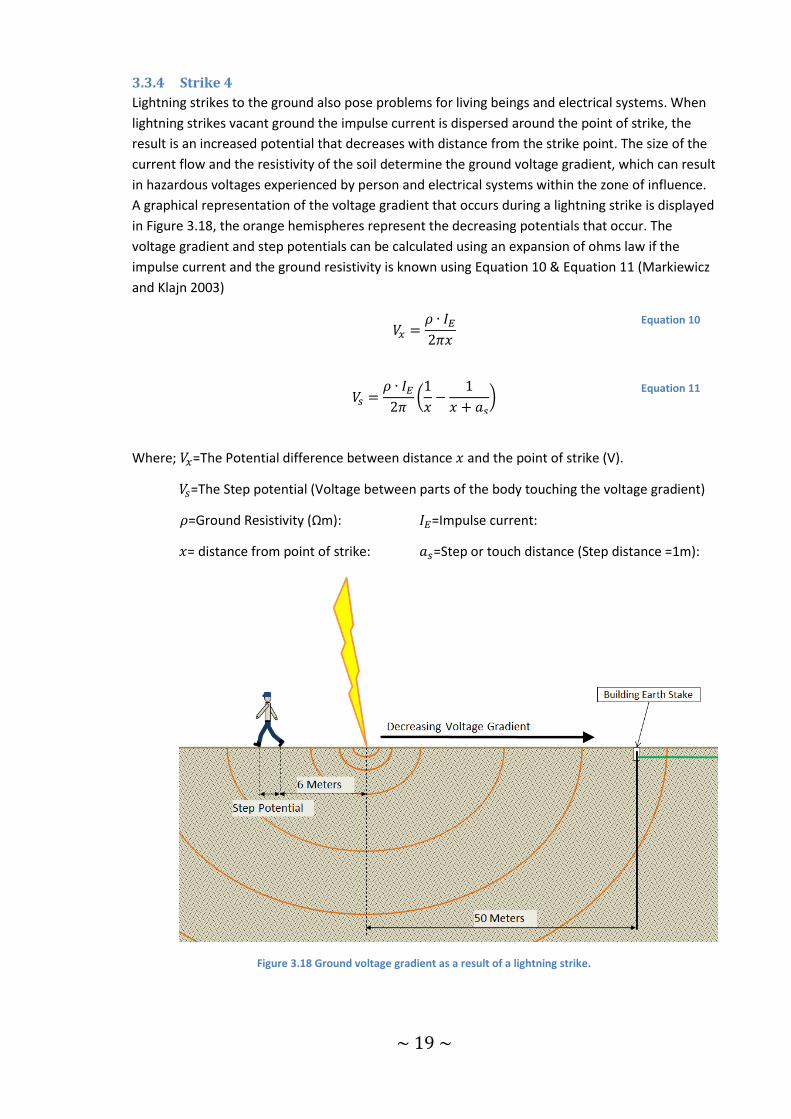
3.3.4 Strike 4
Lightning strikes to the ground also pose problems for living beings and electrical systems. When
lightning strikes vacant ground the impulse current is dispersed around the point of strike, the
result is an increased potential that decreases with distance from the strike point. The size of the
current flow and the resistivity of the soil determine the ground voltage gradient, which can result
in hazardous voltages experienced by person and electrical systems within the zone of influence.
A graphical representation of the voltage gradient that occurs during a lightning strike is displayed
in Figure 3.18, the orange hemispheres represent the decreasing potentials that occur. The
voltage gradient and step potentials can be calculated using an expansion of ohms law if the
impulse current and the ground resistivity is known using Equation 10 & Equation 11 (Markiewicz
and Klajn 2003)
Equation 10
(
)
Equation 11
Where; =The Potential difference between distance and the point of strike (V).
=The Step potential (Voltage between parts of the body touching the voltage gradient)
=Ground Resistivity (Ωm): =Impulse current:
= distance from point of strike: =Step or touch distance (Step distance =1m):
Figure 3.18 Ground voltage gradient as a result of a lightning strike.
~ 20 ~
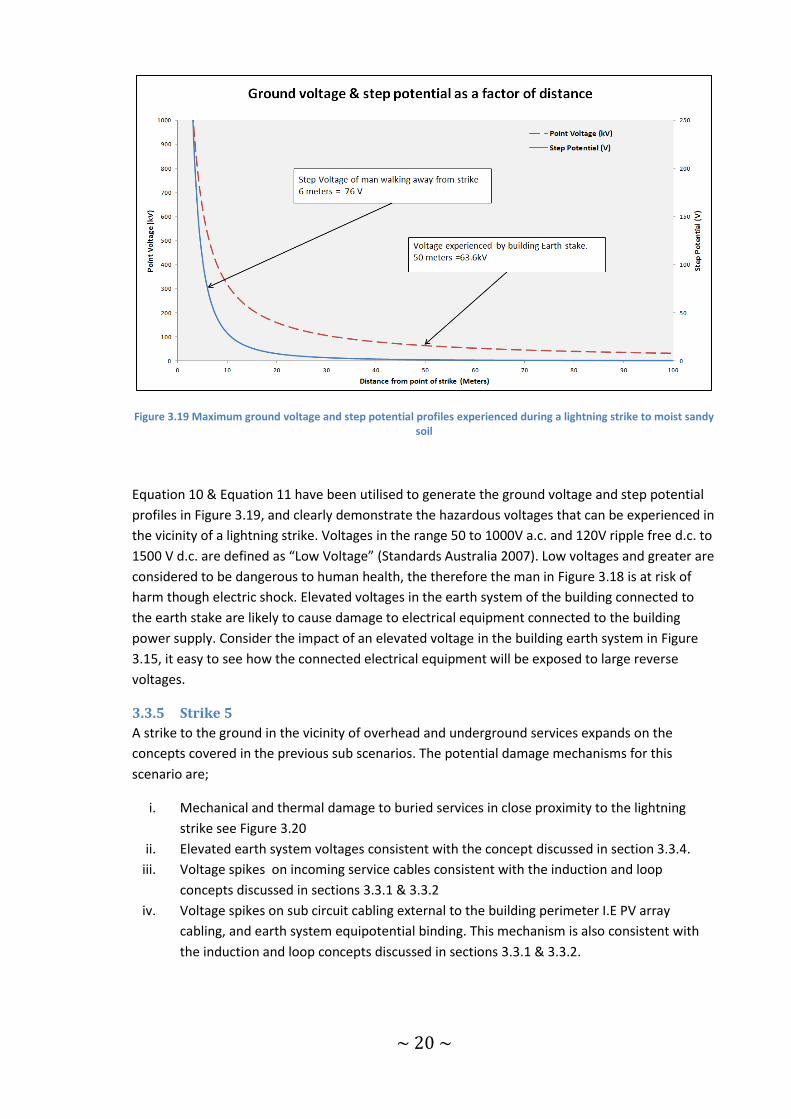
Figure 3.19 Maximum ground voltage and step potential profiles experienced during a lightning strike to moist sandy soil
Equation 10 & Equation 11 have been utilised to generate the ground voltage and step potential
profiles in Figure 3.19, and clearly demonstrate the hazardous voltages that can be experienced in
the vicinity of a lightning strike. Voltages in the range 50 to 1000V a.c. and 120V ripple free d.c. to
1500 V d.c. are defined as “Low Voltage” (Standards Australia 2007). Low voltages and greater are
considered to be dangerous to human health, the therefore the man in Figure 3.18 is at risk of
harm though electric shock. Elevated voltages in the earth system of the building connected to
the earth stake are likely to cause damage to electrical equipment connected to the building
power supply. Consider the impact of an elevated voltage in the building earth system in Figure
3.15, it easy to see how the connected electrical equipment will be exposed to large reverse
voltages.
3.3.5 Strike 5
A strike to the ground in the vicinity of overhead and underground services expands on the
concepts covered in the previous sub scenarios. The potential damage mechanisms for this
scenario are;
i. Mechanical and thermal damage to buried services in close proximity to the lightning
strike see Figure 3.20
ii. Elevated earth system voltages consistent with the concept discussed in section 3.3.4.
iii. Voltage spikes on incoming service cables consistent with the induction and loop
concepts discussed in sections 3.3.1 & 3.3.2
iv. Voltage spikes on sub circuit cabling external to the building perimeter I.E PV array
cabling, and earth system equipotential binding. This mechanism is also consistent with
the induction and loop concepts discussed in sections 3.3.1 & 3.3.2.

~ 21 ~
Figure 3.20 Damage to buried cables caused by Triggered lightning at the International Centre for Lightning Research, Camp Blanding, Florida (V. A. Rakov 2011)
~ 22 ~
3.4 Is it possible to control/predict the location of a lightning strike?
The simple answer to this question is no, current technology is unable to accurately predict or
control the exact time and place of a lightning strike. However some control is possible, weather
monitoring systems are able to predict the probability that a particular storm system will produce
lightning and will be discussed in section 3.4.1. Additionally strategic placement of lightning
protection systems will intercept strikes that occur within a limited area of influence and will be
discussed in section 3.4.2.
3.4.1 Prediction of lightning activity
Prediction of lightning activity can be classified in 2 categories;
i. Historically based average flash density
ii. Real time tracking of flash data.
The first is most applicable to permanent infrastructure and building design, whereas the second
method is utilised to control the impact to specific events such as the movement of expensive and
potentially explosive rockets at Cape Kennedy Space Centre.
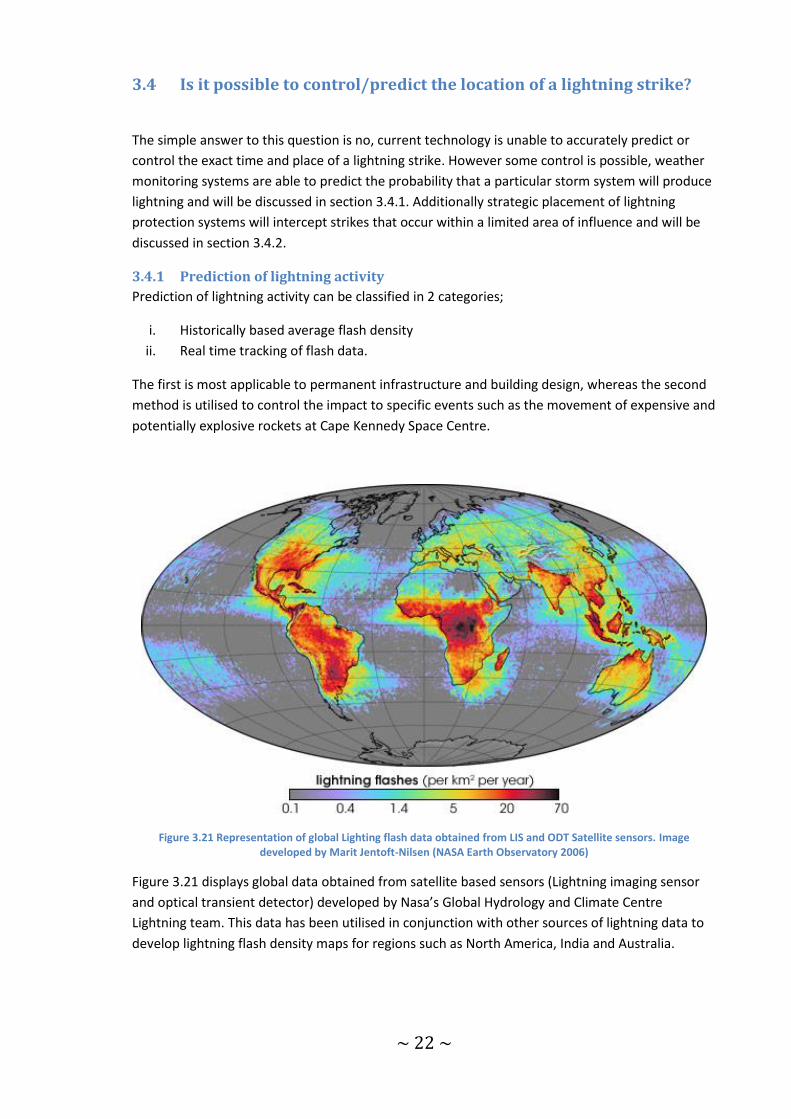
Figure 3.21 Representation of global Lighting flash data obtained from LIS and ODT Satellite sensors. Image developed by Marit Jentoft-Nilsen (NASA Earth Observatory 2006)
Figure 3.21 displays global data obtained from satellite based sensors (Lightning imaging sensor
and optical transient detector) developed by Nasa’s Global Hydrology and Climate Centre
Lightning team. This data has been utilised in conjunction with other sources of lightning data to
develop lightning flash density maps for regions such as North America, India and Australia.
~ 23 ~
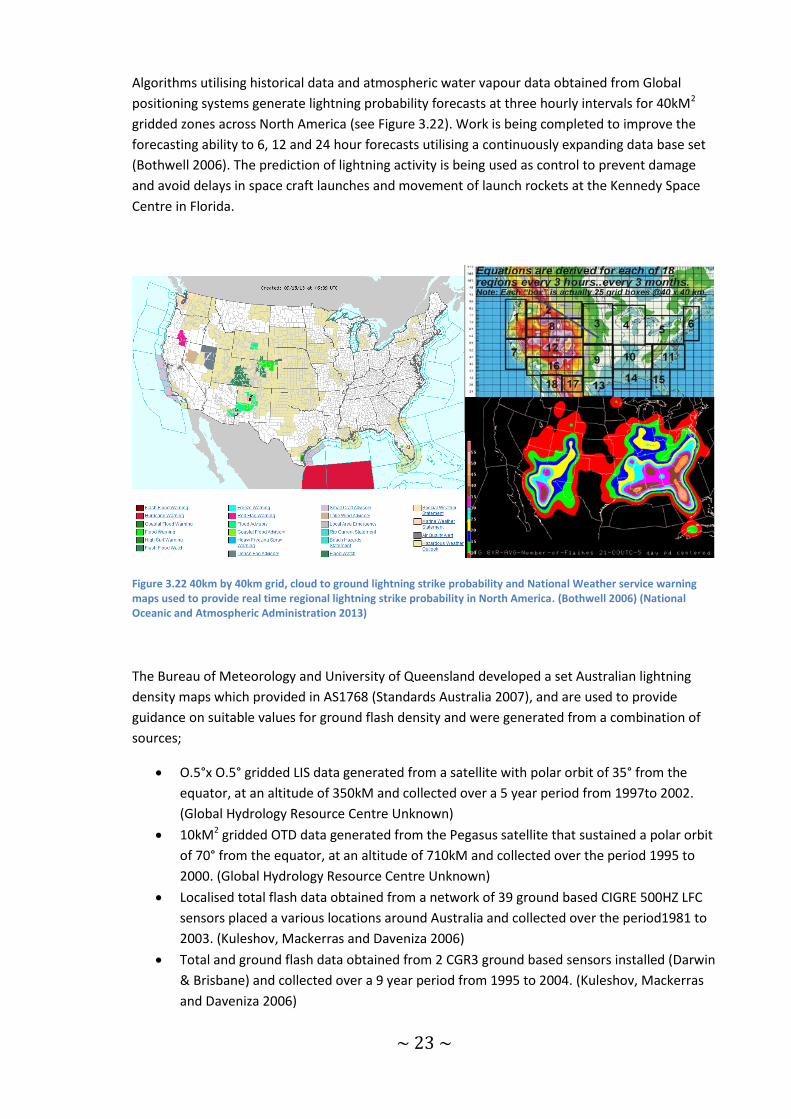
Algorithms utilising historical data and atmospheric water vapour data obtained from Global
positioning systems generate lightning probability forecasts at three hourly intervals for 40kM2
gridded zones across North America (see Figure 3.22). Work is being completed to improve the
forecasting ability to 6, 12 and 24 hour forecasts utilising a continuously expanding data base set
(Bothwell 2006). The prediction of lightning activity is being used as control to prevent damage
and avoid delays in space craft launches and movement of launch rockets at the Kennedy Space
Centre in Florida.
Figure 3.22 40km by 40km grid, cloud to ground lightning strike probability and National Weather service warning maps used to provide real time regional lightning strike probability in North America. (Bothwell 2006) (National Oceanic and Atmospheric Administration 2013)
The Bureau of Meteorology and University of Queensland developed a set Australian lightning
density maps which provided in AS1768 (Standards Australia 2007), and are used to provide
guidance on suitable values for ground flash density and were generated from a combination of
sources;
O.5°x O.5° gridded LIS data generated from a satellite with polar orbit of 35° from the
equator, at an altitude of 350kM and collected over a 5 year period from 1997to 2002.
(Global Hydrology Resource Centre Unknown)
10kM2 gridded OTD data generated from the Pegasus satellite that sustained a polar orbit
of 70° from the equator, at an altitude of 710kM and collected over the period 1995 to
2000. (Global Hydrology Resource Centre Unknown)
Localised total flash data obtained from a network of 39 ground based CIGRE 500HZ LFC
sensors placed a various locations around Australia and collected over the period1981 to
2003. (Kuleshov, Mackerras and Daveniza 2006)
Total and ground flash data obtained from 2 CGR3 ground based sensors installed (Darwin
& Brisbane) and collected over a 9 year period from 1995 to 2004. (Kuleshov, Mackerras
and Daveniza 2006)
~ 24 ~
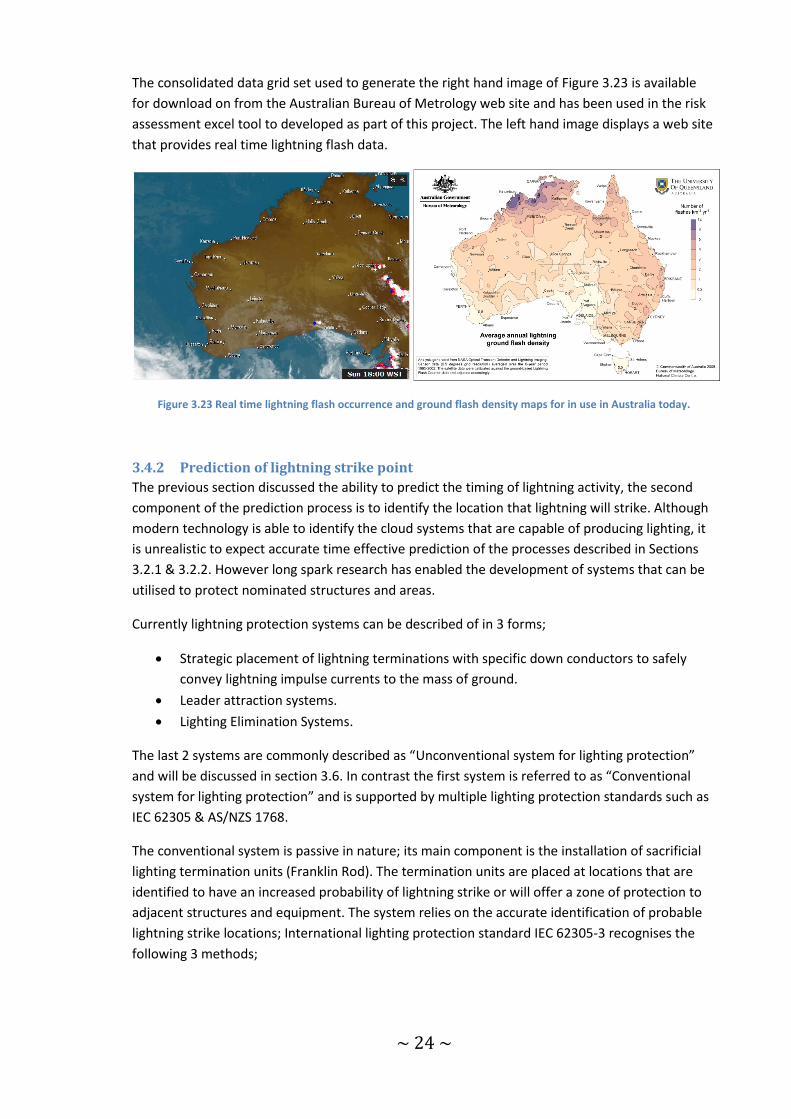
The consolidated data grid set used to generate the right hand image of Figure 3.23 is available
for download on from the Australian Bureau of Metrology web site and has been used in the risk
assessment excel tool to developed as part of this project. The left hand image displays a web site
that provides real time lightning flash data.
Figure 3.23 Real time lightning flash occurrence and ground flash density maps for in use in Australia today.
3.4.2 Prediction of lightning strike point
The previous section discussed the ability to predict the timing of lightning activity, the second
component of the prediction process is to identify the location that lightning will strike. Although
modern technology is able to identify the cloud systems that are capable of producing lighting, it
is unrealistic to expect accurate time effective prediction of the processes described in Sections
3.2.1 & 3.2.2. However long spark research has enabled the development of systems that can be
utilised to protect nominated structures and areas.
Currently lightning protection systems can be described of in 3 forms;
Strategic placement of lightning terminations with specific down conductors to safely
convey lightning impulse currents to the mass of ground.
Leader attraction systems.
Lighting Elimination Systems.
The last 2 systems are commonly described as “Unconventional system for lighting protection”
and will be discussed in section 3.6. In contrast the first system is referred to as “Conventional
system for lighting protection” and is supported by multiple lighting protection standards such as
IEC 62305 & AS/NZS 1768.
The conventional system is passive in nature; its main component is the installation of sacrificial
lighting termination units (Franklin Rod). The termination units are placed at locations that are
identified to have an increased probability of lightning strike or will offer a zone of protection to
adjacent structures and equipment. The system relies on the accurate identification of probable
lightning strike locations; International lighting protection standard IEC 62305-3 recognises the
following 3 methods;
~ 25 ~
The rolling sphere method. (RSM)
The protection angle method.
The mesh method
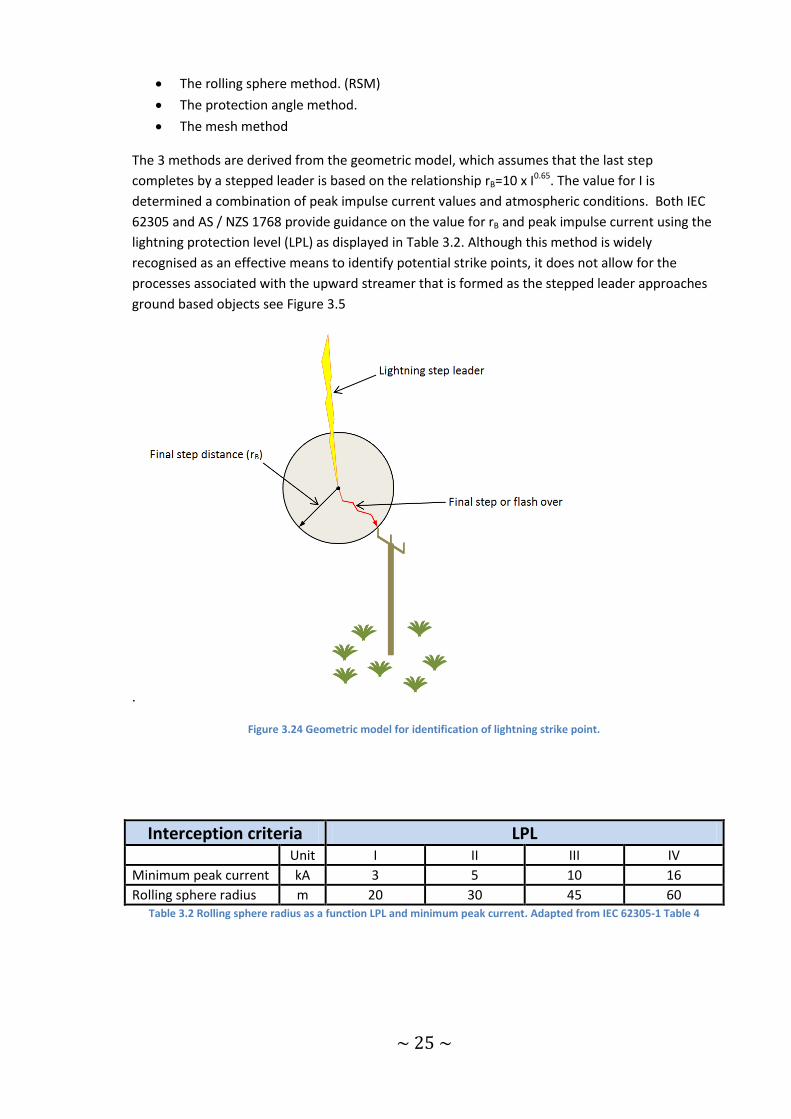
The 3 methods are derived from the geometric model, which assumes that the last step
completes by a stepped leader is based on the relationship rB=10 x I0.65. The value for I is
determined a combination of peak impulse current values and atmospheric conditions. Both IEC
62305 and AS / NZS 1768 provide guidance on the value for rB and peak impulse current using the
lightning protection level (LPL) as displayed in Table 3.2. Although this method is widely
recognised as an effective means to identify potential strike points, it does not allow for the
processes associated with the upward streamer that is formed as the stepped leader approaches
ground based objects see Figure 3.5
.
Figure 3.24 Geometric model for identification of lightning strike point.
Interception criteria LPL Unit I II III IV
Minimum peak current kA 3 5 10 16
Rolling sphere radius m 20 30 45 60 Table 3.2 Rolling sphere radius as a function LPL and minimum peak current. Adapted from IEC 62305-1 Table 4
~ 26 ~
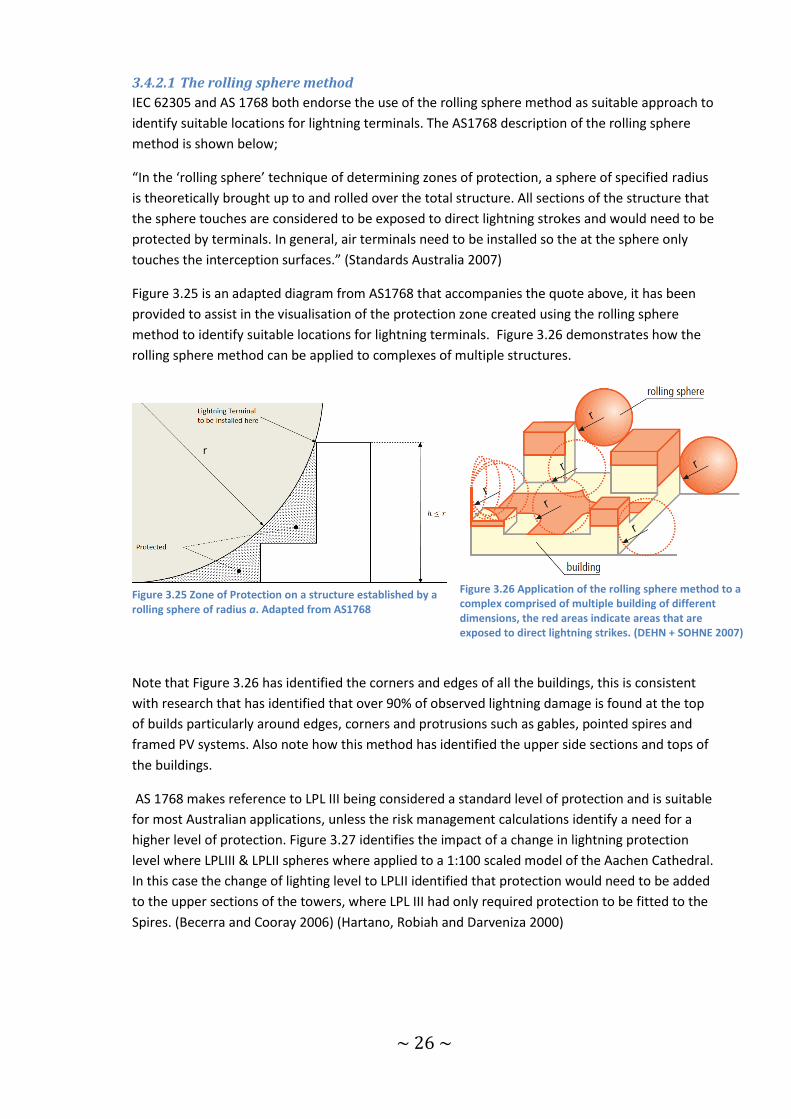
3.4.2.1 The rolling sphere method
IEC 62305 and AS 1768 both endorse the use of the rolling sphere method as suitable approach to
identify suitable locations for lightning terminals. The AS1768 description of the rolling sphere
method is shown below;
“In the ‘rolling sphere’ technique of determining zones of protection, a sphere of specified radius
is theoretically brought up to and rolled over the total structure. All sections of the structure that
the sphere touches are considered to be exposed to direct lightning strokes and would need to be
protected by terminals. In general, air terminals need to be installed so the at the sphere only
touches the interception surfaces.” (Standards Australia 2007)
Figure 3.25 is an adapted diagram from AS1768 that accompanies the quote above, it has been
provided to assist in the visualisation of the protection zone created using the rolling sphere
method to identify suitable locations for lightning terminals. Figure 3.26 demonstrates how the
rolling sphere method can be applied to complexes of multiple structures.
Figure 3.25 Zone of Protection on a structure established by a rolling sphere of radius a. Adapted from AS1768
Figure 3.26 Application of the rolling sphere method to a complex comprised of multiple building of different dimensions, the red areas indicate areas that are exposed to direct lightning strikes. (DEHN + SOHNE 2007)
Note that Figure 3.26 has identified the corners and edges of all the buildings, this is consistent
with research that has identified that over 90% of observed lightning damage is found at the top
of builds particularly around edges, corners and protrusions such as gables, pointed spires and
framed PV systems. Also note how this method has identified the upper side sections and tops of
the buildings.
AS 1768 makes reference to LPL III being considered a standard level of protection and is suitable
for most Australian applications, unless the risk management calculations identify a need for a
higher level of protection. Figure 3.27 identifies the impact of a change in lightning protection
level where LPLIII & LPLII spheres where applied to a 1:100 scaled model of the Aachen Cathedral.
In this case the change of lighting level to LPLII identified that protection would need to be added
to the upper sections of the towers, where LPL III had only required protection to be fitted to the
Spires. (Becerra and Cooray 2006) (Hartano, Robiah and Darveniza 2000)
~ 27 ~
Figure 3.27 Photos from DEHN Lightning Protection guide displaying the rolling sphere method applied to the Aachen cathedral, Germany. The blue and red balls identify LPL III and LPL II protection points, note the red indication on the cathedral for the extra protection required to achieve the increased level of protection associated with LPLII. (DEHN + SOHNE 2007)
3.4.2.2 The Angle of protection Method
The protective angle method is most applicable to slender symmetrical buildings or roof mounted
structures. Figure 3.28 displays the cone of protection offered using this method, in this case the
pole and the man are within the zone of protection and the plants are not.
Figure 3.28 Zone of protection provided by Protection angle method
~ 28 ~
The volume of the cone of protection is a factor of the structure height and the lightning
protection level, IEC 62305-2 table 2 provides guidance on appropriate values which has been
displayed in Figure 3.29 and Table 3.3.
Figure 3.29 Protection angle as identified in IEC 62305 ( International Electrotechnical Commision 2012)
Note that the data in Figure 3.29 does not extend beyond the equivalent rolling sphere radius, IEC
62305-3 makes note that the protection angle method is not valid above these values and the
rolling sphere and mesh methods should be utilised in these cases. The relevant protection angles
have been developed by setting the slope to intersect the rolling sphere in so that the
corresponding areas of singular protection are the same (see Figure 3.30). AS/NZS 1768 takes this
one step further by not recognising the angle of protection method.
Figure 3.30 Comparison of zones of RSM and protection and zones of protection profile for a 10m tall structure
~ 29 ~
Table 3.3 Comparison of protection angle and rolling sphere method protection zone dimensions
Angle α°
from
IEC62305
(degrees)
Distance a
(m)
Angle α°
from
IEC62305
(degrees)
Distance a
(m)
Angle α°
from
IEC62305
(degrees)
Distance a
(m)
Angle α°
from
IEC62305
(degrees)
Distance a
(m)
1 6.24 71 2.90 7.68 74 3.49 9.43 77 4.33 10.91 79 4.92
2 8.72 71 5.81 10.77 74 6.97 13.27 77 8.66 15.36 79 9.87
3 10.54 67 7.18 13.08 71 8.88 16.16 74 10.69 18.73 77 12.87
4 12.00 63 7.99 14.97 69 10.18 18.55 72 12.54 21.54 75 15.19
5 13.23 60 8.56 16.58 66 11.16 20.62 70 14.00 23.98 74 17.03
6 14.28 56 8.97 18.00 63 11.92 22.45 68 15.18 26.15 72 18.55
7 15.20 53 9.27 19.26 61 12.52 24.10 67 16.16 28.12 71 19.81
8 16.00 50 9.49 20.40 58 13.01 25.61 65 16.98 29.93 69 20.89
9 16.70 47 9.64 21.42 56 13.40 27.00 63 17.68 31.61 68 21.81
10 17.32 44 9.74 22.36 54 13.72 28.28 61 18.27 33.17 66 22.61
11 17.86 42 9.79 23.22 52 13.98 29.48 60 18.78 34.63 65 23.30
12 18.33 39 9.80 24.00 50 14.19 30.59 58 19.22 36.00 63 23.91
13 18.73 37 9.78 24.72 48 14.35 31.64 56 19.61 37.30 62 24.45
14 19.08 35 9.73 25.38 46 14.47 32.62 55 19.94 38.52 61 24.93
15 19.36 33 9.65 25.98 44 14.56 33.54 53 20.22 39.69 59 25.36
16 19.60 31 9.56 26.53 42 14.62 34.41 52 20.47 40.79 58 25.74
17 19.77 29 9.45 27.04 41 14.65 35.23 51 20.68 41.84 57 26.07
18 19.90 27 9.32 27.50 39 14.66 36.00 49 20.85 42.85 56 26.37
19 19.97 26 9.17 27.91 38 14.64 36.73 48 21.00 43.81 55 26.64
20 20.00 24 9.02 28.28 36 14.61 37.42 47 21.13 44.72 53 26.87
21 28.62 35 14.56 38.07 45 21.22 45.60 52 27.08
22 28.91 33 14.49 38.68 44 21.30 46.43 51 27.26
23 29.17 32 14.40 39.26 43 21.36 47.23 50 27.42
24 29.39 31 14.31 39.80 42 21.40 48.00 49 27.56
25 29.58 30 14.20 40.31 41 21.42 48.73 48 27.67
26 29.73 28 14.08 40.79 39 21.42 49.44 47 27.77
27 29.85 27 13.95 41.24 38 21.41 50.11 46 27.85
28 29.93 26 13.81 41.67 37 21.39 50.75 45 27.91
29 29.98 25 13.66 42.06 36 21.35 51.37 44 27.96
30 30.00 24 13.50 42.43 35 21.30 51.96 43 28.00
31 42.77 34 21.24 52.53 42 28.02
32 43.08 33 21.16 53.07 41 28.03
33 43.37 33 21.08 53.58 40 28.02
34 43.63 32 20.99 54.07 39 28.00
35 43.87 31 20.89 54.54 39 27.98
36 44.09 30 20.78 54.99 38 27.94
37 44.28 29 20.66 55.42 37 27.89
38 44.45 28 20.53 55.82 36 27.84
39 44.60 28 20.40 56.20 35 27.77
40 44.72 27 20.26 56.57 35 27.70
41 44.82 26 20.12 56.91 34 27.61
42 44.90 25 19.97 57.24 33 27.52
43 44.96 25 19.81 57.54 33 27.43
44 44.99 24 19.65 57.83 32 27.32
45 45.00 23 19.49 58.09 31 27.21
46 58.34 30 27.10
47 58.57 30 26.97
48 58.79 29 26.84
49 58.98 29 26.71
50 59.16 28 26.57
51 59.32 27 26.43
52 59.46 27 26.28
53 59.59 26 26.12
54 59.70 26 25.97
55 59.79 25 25.80
56 59.87 25 25.64
57 59.92 24 25.47
58 59.97 24 25.34
59 59.99 23 25.38
60 60.00 23 25.47
Zone of Protection dimensions
Distance a corresponds to the zone extends from termination unit at ground level
Height of Air
temination
unit
(m)
Lightning Protection Level IV
RSM
Distance a
(m)
Angle
Lightning Protection Level III
RSM
Distance a
(m)
Angle of ProtectionAngle of ProtectionRolling
Sphere
Method
Distance a
(m)
RSM
Distance a
(m)
Angle of Protection
Lightning Protection Level I Lightning Protection Level II
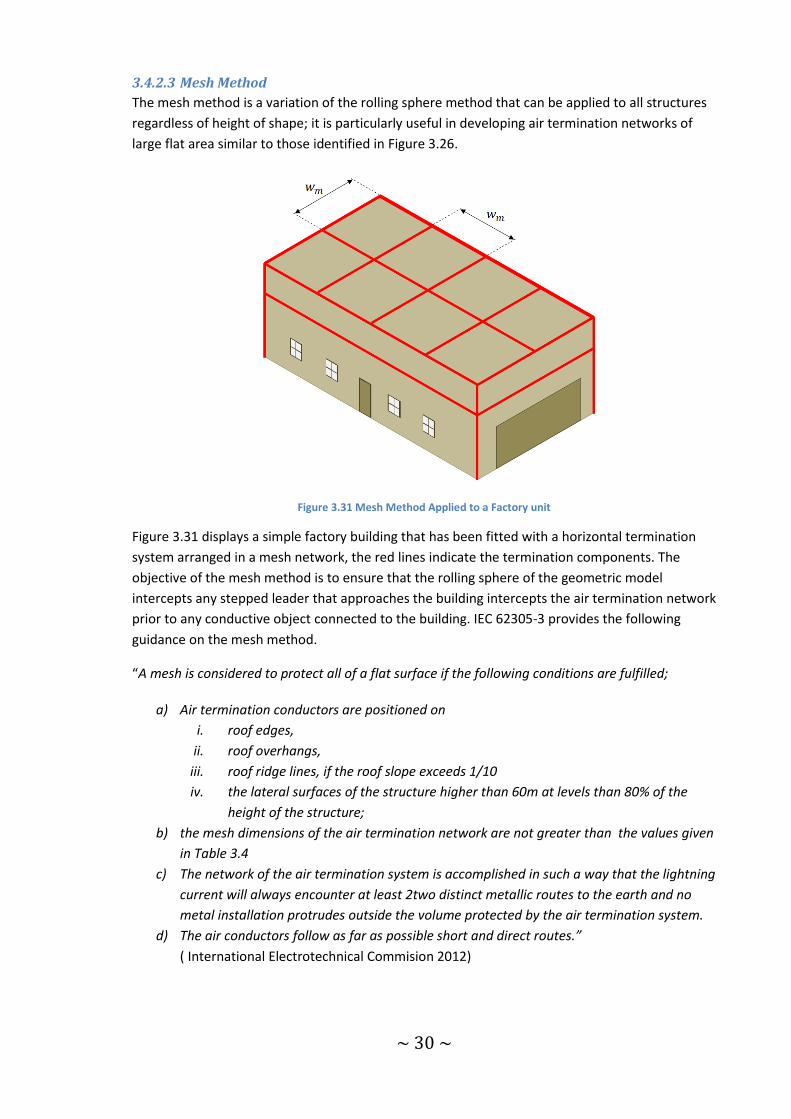
~ 30 ~
3.4.2.3 Mesh Method
The mesh method is a variation of the rolling sphere method that can be applied to all structures
regardless of height of shape; it is particularly useful in developing air termination networks of
large flat area similar to those identified in Figure 3.26.
Figure 3.31 Mesh Method Applied to a Factory unit
Figure 3.31 displays a simple factory building that has been fitted with a horizontal termination
system arranged in a mesh network, the red lines indicate the termination components. The
objective of the mesh method is to ensure that the rolling sphere of the geometric model
intercepts any stepped leader that approaches the building intercepts the air termination network
prior to any conductive object connected to the building. IEC 62305-3 provides the following
guidance on the mesh method.
“A mesh is considered to protect all of a flat surface if the following conditions are fulfilled;
a) Air termination conductors are positioned on
i. roof edges,
ii. roof overhangs,
iii. roof ridge lines, if the roof slope exceeds 1/10
iv. the lateral surfaces of the structure higher than 60m at levels than 80% of the
height of the structure;
b) the mesh dimensions of the air termination network are not greater than the values given
in Table 3.4
c) The network of the air termination system is accomplished in such a way that the lightning
current will always encounter at least 2two distinct metallic routes to the earth and no
metal installation protrudes outside the volume protected by the air termination system.
d) The air conductors follow as far as possible short and direct routes.”
( International Electrotechnical Commision 2012)
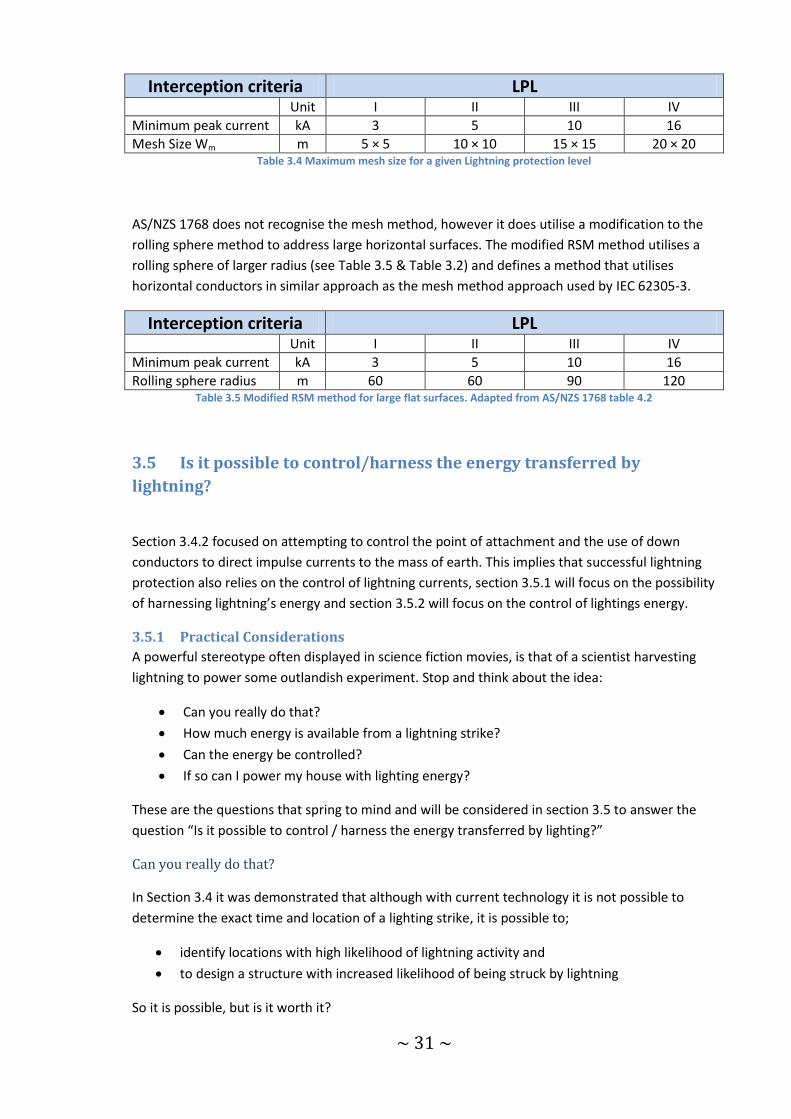
~ 31 ~
Interception criteria LPL Unit I II III IV
Minimum peak current kA 3 5 10 16
Mesh Size Wm m 5 × 5 10 × 10 15 × 15 20 × 20 Table 3.4 Maximum mesh size for a given Lightning protection level
AS/NZS 1768 does not recognise the mesh method, however it does utilise a modification to the
rolling sphere method to address large horizontal surfaces. The modified RSM method utilises a
rolling sphere of larger radius (see Table 3.5 & Table 3.2) and defines a method that utilises
horizontal conductors in similar approach as the mesh method approach used by IEC 62305-3.
Interception criteria LPL Unit I II III IV
Minimum peak current kA 3 5 10 16
Rolling sphere radius m 60 60 90 120 Table 3.5 Modified RSM method for large flat surfaces. Adapted from AS/NZS 1768 table 4.2
3.5 Is it possible to control/harness the energy transferred by
lightning?
Section 3.4.2 focused on attempting to control the point of attachment and the use of down
conductors to direct impulse currents to the mass of earth. This implies that successful lightning
protection also relies on the control of lightning currents, section 3.5.1 will focus on the possibility
of harnessing lightning’s energy and section 3.5.2 will focus on the control of lightings energy.
3.5.1 Practical Considerations
A powerful stereotype often displayed in science fiction movies, is that of a scientist harvesting
lightning to power some outlandish experiment. Stop and think about the idea:
Can you really do that?
How much energy is available from a lightning strike?
Can the energy be controlled?
If so can I power my house with lighting energy?
These are the questions that spring to mind and will be considered in section 3.5 to answer the
question “Is it possible to control / harness the energy transferred by lighting?”
Can you really do that?
In Section 3.4 it was demonstrated that although with current technology it is not possible to
determine the exact time and location of a lighting strike, it is possible to;
identify locations with high likelihood of lightning activity and
to design a structure with increased likelihood of being struck by lightning
So it is possible, but is it worth it?

~ 32 ~
How much energy is available from a lightning strike?
Negative cloud to ground lighting accounts for 90 % of all ground impacting lighting strike.
Therefore “How much energy is available in a lighting strike?” is best answered by considering
downward negative lightning; typical values are displayed in Table 3.6, typical energy transfer of
5GJ will be used to demonstrate the energy available from lightning at specific locations in
Australia.
Overall flash parameter Unit Typical Value Duration ms 200 - 300
Number of strokes per flash
(15-20% of strikes are composed of a single strike) 3 - 5
Interstroke interval ms 60
Charge transfer C 20
Energy J 109 - 1010
Table 3.6 Typical values for overall flash data for downward negative lightning. Adapted from Table 1.1 “Lightning Physics and Effects” (Uman and Rakov 2003)
Table 3.6 Typical values for overall flash data for downward negative lightning. Adapted from
Table 1.1 “Lightning Physics and Effects” provides lightning energy data for various locations
within Australia. The number of flashes per km2/year information was obtained using lightning
flash gridded meta data file available from the bureau of meteorology and used in the excel risk
assessment tool. The Kimberly location represents the maximum value of any Australian grid and
is a substantial distance away from any town or populated area.
Area / Location
Grid co-ordinate
latitude
Grid co-ordinate longitude
Number of flashes
per km2/yr
Energy available per
km2/year (j)
kWh available per
year
Kimberly S16 E125 13.11 6.56E+10 18,208
Perth S32 E116 0.46 2.30E+09 639
Darwin S12 E131 6.58 3.29E+10 9,139
Sydney S34 E151 1.21 6.05E+09 1,681
Melbourne S38 E145 0.97 4.85E+09 1,347
Cairns S17 E145 1.97 9.85E+09 2,736
Brisbane S24 E153 0.2 1.00E+09 278 Table 3.7 Lightning Energy available at specific locations within Australia
Can the energy be controlled
Section 3.4.2 demonstrated part of the solution to effectively control the flow of energy from a
lightning strike through the careful application of well designed and installed lighting protection
systems. All the methods demonstrated the need to direct the main impulse current to ground by
the most direct route with as much separation from other electrical conductors and circuits as
possible. In some cases the impulse energy entered incoming or building services; control of this
type of energy is affected by surge protection and will be covered in section 3.5.2.
~ 33 ~
Can I power my house with lightning energy?
Annual Australian residential electrical energy consumption is 223 petajoules which equates to
average annual house hold consumption of approximately 8MWhs per year. It is clear that the
logistical effort and cost of attempting to establish structures to capture all the available lighting
and store the energy for distribution over a year is prohibitive. Assuming that all the energy could
be captured, stored and distributed with zero losses, the Kimberly location (Table 3.7) would
require a lighting protection structure capable of catching all lightning in an area of approximately
1km2 to provide energy for 2 houses. (Australian Bureau of Statistics 2012) (Australian Institute of
Family Studies 2013)
3.5.2 Lightning electromagnetic impulse and surge protection
It will be seen in section 5 that both IEC 62305 and AS/NZS 1768 agree that a complete solution
for protection against the effects of lightning is achieved careful application of;
Lighting Protection System
Lightning electromagnetic impulse and surge protection.
The term LEMP or lightning electromagnetic impulse is used to describe all of the electromagnetic
effects of lightning current. LEMP effects include resistive, inductive and capacitive coupling of
electrical systems and conductive components, which normally manifest as voltage and current
surges or development of magnetic fields. ( International Electrotechnical Commision 2012)
LEMP protection design is based on creating zones of protection, each zone is designed to ensure
the LEMP Protection level is sufficient to protect the withstand level of equipment to be
protected within. Protection methods include;
Earthing / equipotential bonding of all conductors entering the zone (see section3.5.2.1)
Surge protection fitted to all electrical conductors entering the zone (see section 3.5.2.2)
Isolating interfaces
Magnetic shielding, separation and line routing (see section 3.5.2.4)
LEMP withstand level is a measure of the equipment’s inherent ability to withstand LEMP effects,
generally equipment of a similar withstand level is grouped into corresponding lightning
protection zones (LPZ). Equipment that has a low withstand levels require zones of increased
protection (higher LPZ number), while equipment with higher withstand levels would be kept in
zones of lesser protection (lower LPZ number). Suitable surge protection and equipotential
bonding is applied at the boundary between the zones to control the flow of energy. Figure 3.32
represents a typical methodology that might be applied to a building like the one in Figure 3.8,
details on the methodology utilising 3 LPZ levels and 4 area design are provided in Table 3.8;
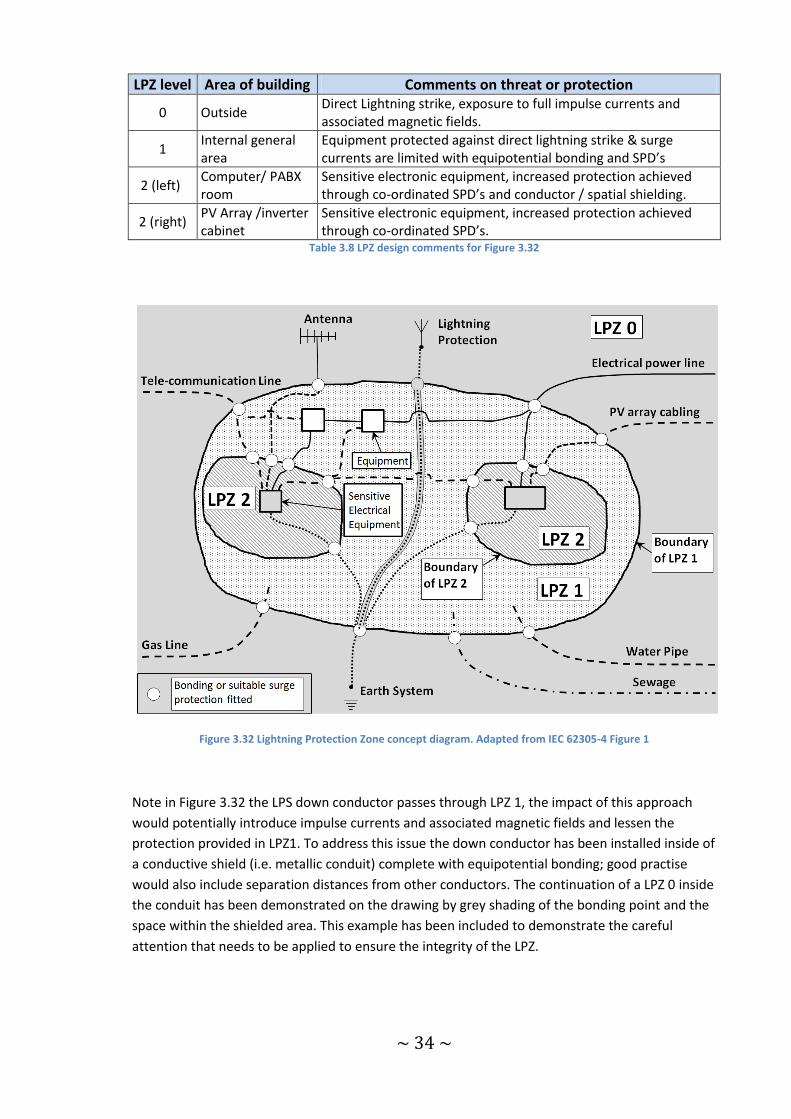
~ 34 ~
LPZ level Area of building Comments on threat or protection
0 Outside Direct Lightning strike, exposure to full impulse currents and associated magnetic fields.
1 Internal general area
Equipment protected against direct lightning strike & surge currents are limited with equipotential bonding and SPD’s
2 (left)f Computer/ PABX room
Sensitive electronic equipment, increased protection achieved through co-ordinated SPD’s and conductor / spatial shielding.
2 (right) PV Array /inverter cabinet
Sensitive electronic equipment, increased protection achieved through co-ordinated SPD’s.
Table 3.8 LPZ design comments for Figure 3.32
Figure 3.32 Lightning Protection Zone concept diagram. Adapted from IEC 62305-4 Figure 1
Note in Figure 3.32 the LPS down conductor passes through LPZ 1, the impact of this approach
would potentially introduce impulse currents and associated magnetic fields and lessen the
protection provided in LPZ1. To address this issue the down conductor has been installed inside of
a conductive shield (i.e. metallic conduit) complete with equipotential bonding; good practise
would also include separation distances from other conductors. The continuation of a LPZ 0 inside
the conduit has been demonstrated on the drawing by grey shading of the bonding point and the
space within the shielded area. This example has been included to demonstrate the careful
attention that needs to be applied to ensure the integrity of the LPZ.
~ 35 ~
3.5.2.1 Earthing / equipotential bonding of all conductors entering the zone
Earthing and equipotential bonding provide 2 functions in the context of a complete Lighting
protection system;
LPS earthing system to carry primary impulse currents and distribute safely into the mass
of earth (soil)
Equipotential bonding to minimise potential differences and reduction of magnetic fields.
Earthing
Due to the high current and frequency profile of lightning, these objectives are best met with a
single structured earth termination system that provides the lowest possible impedance /
resistance to earth I.E one that is to provide earthing requirements for electrical power
protection, lightning protection and telecommunication systems.
IEC 62305-3 provides the following guidance on earthing systems utilised for lightning protection;
“The earth termination system of the structure shall comply with IEC 62305. In structures where
only electrical systems are provided, a type A earthing arrangement may be used, but a Type B
earthing arrangement is preferable. In structures with electronic systems, a type B earthing
arrangement is recommended.” ( International Electrotechnical Commision 2012)
A “type A “ earthing arrangement consists of horizontal, vertical or foundation earth electrodes
not connected to each other or in a closed loop, each electrode is connected to a down
conductor. The system must comprise of 2 or more electrodes and achieve an earthing resistance
of less than 10Ω.
A “type B” earthing arrangement consists of a ring conductor external to and surrounding the
structure to be protected. The ring conductor is to be buried at a depth of 0.5m and
approximately 1m from the external walls; additionally the ring conductor must form a closed
loop and be in contact with soil for at least 80 % of its length.
A combination of the 2 systems will provide the best outcome in locations with poor soil
conductivity and will increase potential equalisation at ground/ electrode level, resulting in
reduced potential levels throughout the earthing system. Type A systems are prone to unbalanced
distribution of lightning currents due to variation in down conductor length and earth resistance.
Equipotential bonding
Section 3.3 demonstrated how lightning strikes develop magnetic fields and potentially dangerous
step / touch voltages that impact the conductive components of a building. Equipotential bonding
addresses this through electrical bonding of metallic structures, frames, enclosures and other
conductive components together and to the structures earthing system.
The bonding network reduces magnetic fields through 2 mechanisms; firstly it creates multiple
current paths resulting in reduced impulse currents and realising a reduction in magnetic field
strength and the subsequent inductive effects. Secondly a well-designed bonding arrangement
can create a 3 dimensional grid that intercept magnetic fields and carry induced currents to earth.
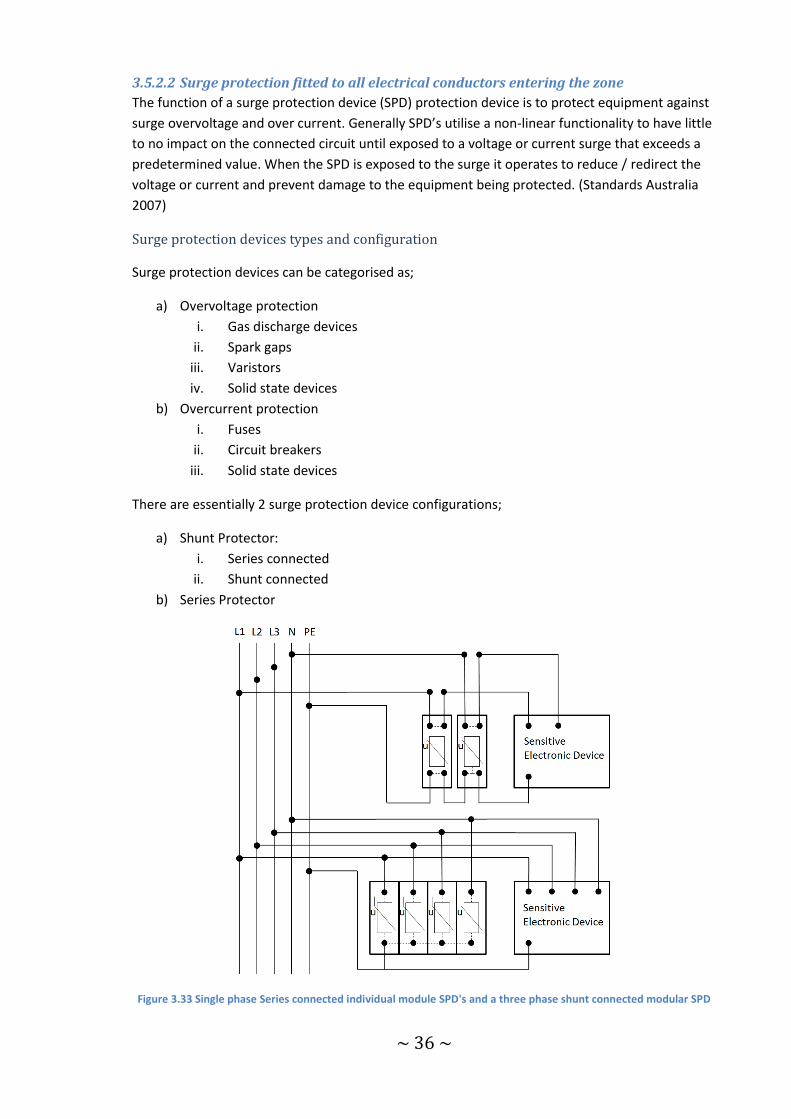
~ 36 ~
3.5.2.2 Surge protection fitted to all electrical conductors entering the zone
The function of a surge protection device (SPD) protection device is to protect equipment against
surge overvoltage and over current. Generally SPD’s utilise a non-linear functionality to have little
to no impact on the connected circuit until exposed to a voltage or current surge that exceeds a
predetermined value. When the SPD is exposed to the surge it operates to reduce / redirect the
voltage or current and prevent damage to the equipment being protected. (Standards Australia
2007)
Surge protection devices types and configuration
Surge protection devices can be categorised as;
a) Overvoltage protection
i. Gas discharge devices
ii. Spark gaps
iii. Varistors
iv. Solid state devices
b) Overcurrent protection
i. Fuses
ii. Circuit breakers
iii. Solid state devices
There are essentially 2 surge protection device configurations;
a) Shunt Protector:
i. Series connected
ii. Shunt connected
b) Series Protector
Figure 3.33 Single phase Series connected individual module SPD's and a three phase shunt connected modular SPD
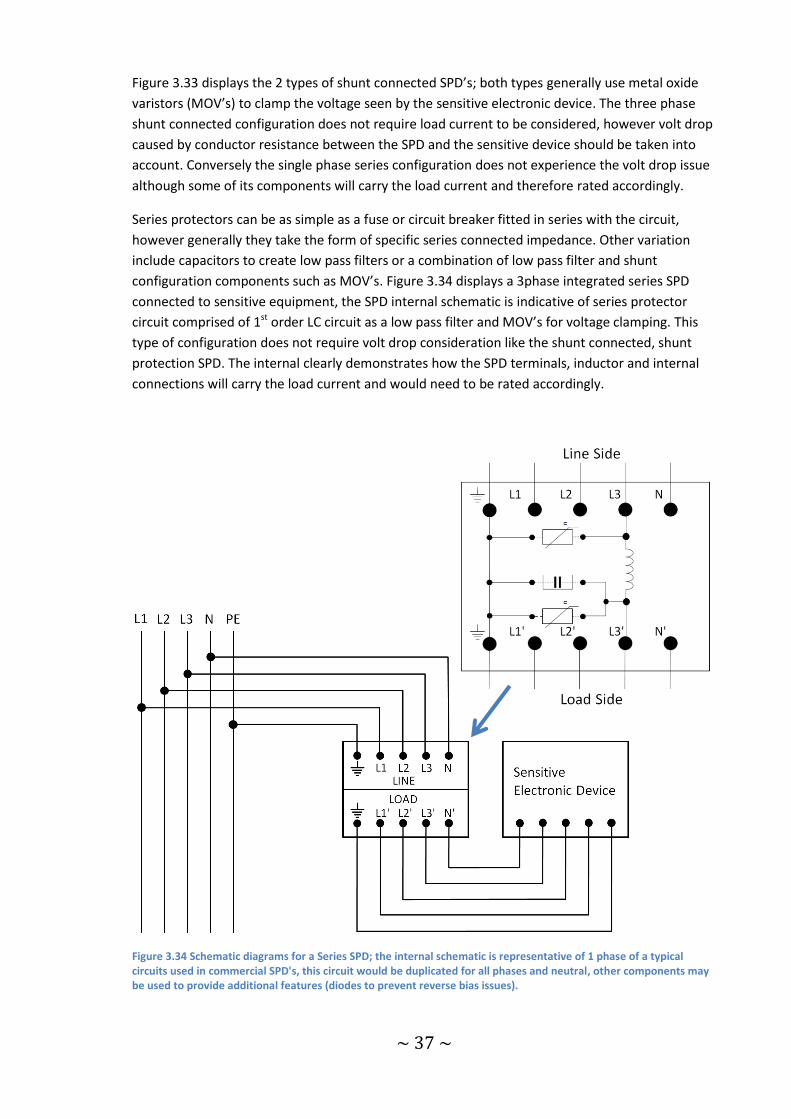
~ 37 ~
Figure 3.33 displays the 2 types of shunt connected SPD’s; both types generally use metal oxide
varistors (MOV’s) to clamp the voltage seen by the sensitive electronic device. The three phase
shunt connected configuration does not require load current to be considered, however volt drop
caused by conductor resistance between the SPD and the sensitive device should be taken into
account. Conversely the single phase series configuration does not experience the volt drop issue
although some of its components will carry the load current and therefore rated accordingly.
Series protectors can be as simple as a fuse or circuit breaker fitted in series with the circuit,
however generally they take the form of specific series connected impedance. Other variation
include capacitors to create low pass filters or a combination of low pass filter and shunt
configuration components such as MOV’s. Figure 3.34 displays a 3phase integrated series SPD
connected to sensitive equipment, the SPD internal schematic is indicative of series protector
circuit comprised of 1st order LC circuit as a low pass filter and MOV’s for voltage clamping. This
type of configuration does not require volt drop consideration like the shunt connected, shunt
protection SPD. The internal clearly demonstrates how the SPD terminals, inductor and internal
connections will carry the load current and would need to be rated accordingly.
Figure 3.34 Schematic diagrams for a Series SPD; the internal schematic is representative of 1 phase of a typical circuits used in commercial SPD's, this circuit would be duplicated for all phases and neutral, other components may be used to provide additional features (diodes to prevent reverse bias issues).
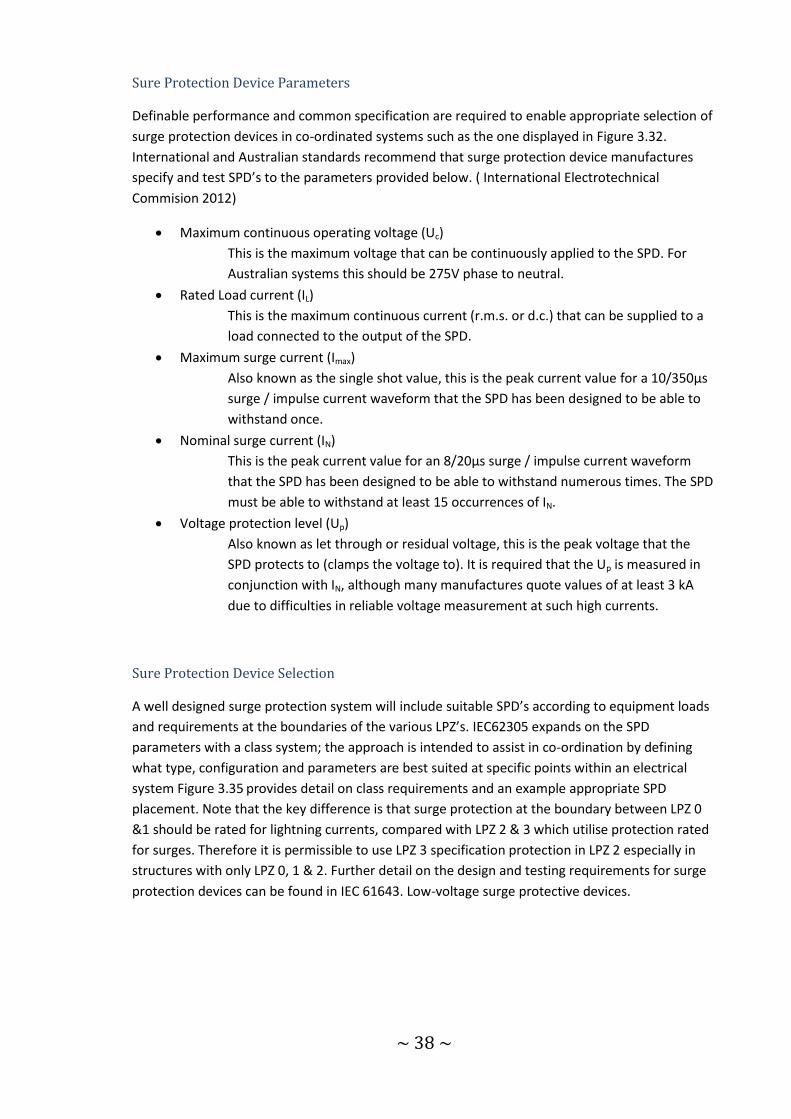
~ 38 ~
Sure Protection Device Parameters
Definable performance and common specification are required to enable appropriate selection of
surge protection devices in co-ordinated systems such as the one displayed in Figure 3.32.
International and Australian standards recommend that surge protection device manufactures
specify and test SPD’s to the parameters provided below. ( International Electrotechnical
Commision 2012)
Maximum continuous operating voltage (Uc)
This is the maximum voltage that can be continuously applied to the SPD. For
Australian systems this should be 275V phase to neutral.
Rated Load current (IL)
This is the maximum continuous current (r.m.s. or d.c.) that can be supplied to a
load connected to the output of the SPD.
Maximum surge current (Imax)
Also known as the single shot value, this is the peak current value for a 10/350μs
surge / impulse current waveform that the SPD has been designed to be able to
withstand once.
Nominal surge current (IN)
This is the peak current value for an 8/20μs surge / impulse current waveform
that the SPD has been designed to be able to withstand numerous times. The SPD
must be able to withstand at least 15 occurrences of IN.
Voltage protection level (Up)
Also known as let through or residual voltage, this is the peak voltage that the
SPD protects to (clamps the voltage to). It is required that the Up is measured in
conjunction with IN, although many manufactures quote values of at least 3 kA
due to difficulties in reliable voltage measurement at such high currents.
Sure Protection Device Selection
A well designed surge protection system will include suitable SPD’s according to equipment loads
and requirements at the boundaries of the various LPZ’s. IEC62305 expands on the SPD
parameters with a class system; the approach is intended to assist in co-ordination by defining
what type, configuration and parameters are best suited at specific points within an electrical
system Figure 3.35 provides detail on class requirements and an example appropriate SPD
placement. Note that the key difference is that surge protection at the boundary between LPZ 0
&1 should be rated for lightning currents, compared with LPZ 2 & 3 which utilise protection rated
for surges. Therefore it is permissible to use LPZ 3 specification protection in LPZ 2 especially in
structures with only LPZ 0, 1 & 2. Further detail on the design and testing requirements for surge
protection devices can be found in IEC 61643. Low-voltage surge protective devices.
~ 39 ~
Figure 3.35 Selection and placement of SPD’s for Lightning protection (schematic diagram). Adapted from IEC 62305-4
~ 40 ~
3.5.2.3 Isolating Interfaces
Isolating interfaces are devices that prevent the flow of current from one circuit into another.
Both standards recognise HV/LV transformers in this regard, delta to star transformer prevent the
flow of faults currents associated with lightning strike from being induced into the secondary side.
3.5.2.4 Magnetic shielding, separation and line routing
Magnetic shielding is a preventative measure, where earthing and surge protection control the
flow of LEMP energy, magnetic shielding attempts to prevent it from impacting conductors and
susceptible equipment.
Spatial shielding is the practise of placing susceptible equipment and conductors with an enclosed
zone of protection. The enclosing shield may be grid like, continuous metal or comprise of natural
elements. Connecting equipotential bonding to the steel re-enforcing mesh used in concrete
structures is good example of how natural elements can be utilised to provide protection.
Shielding of conductors can be achieved through the use of metallic cable support systems such
as conduit and trucking, alternatively the effects of LEMP can be reduced by the use of armoured
or screened cabling on sensitive equipment circuits.
Suitable grouping and routing of conductors reduce induced surge voltages can be reduced
through minimising induction loops and ensuring that lightning conductors are separated from
other conductors.
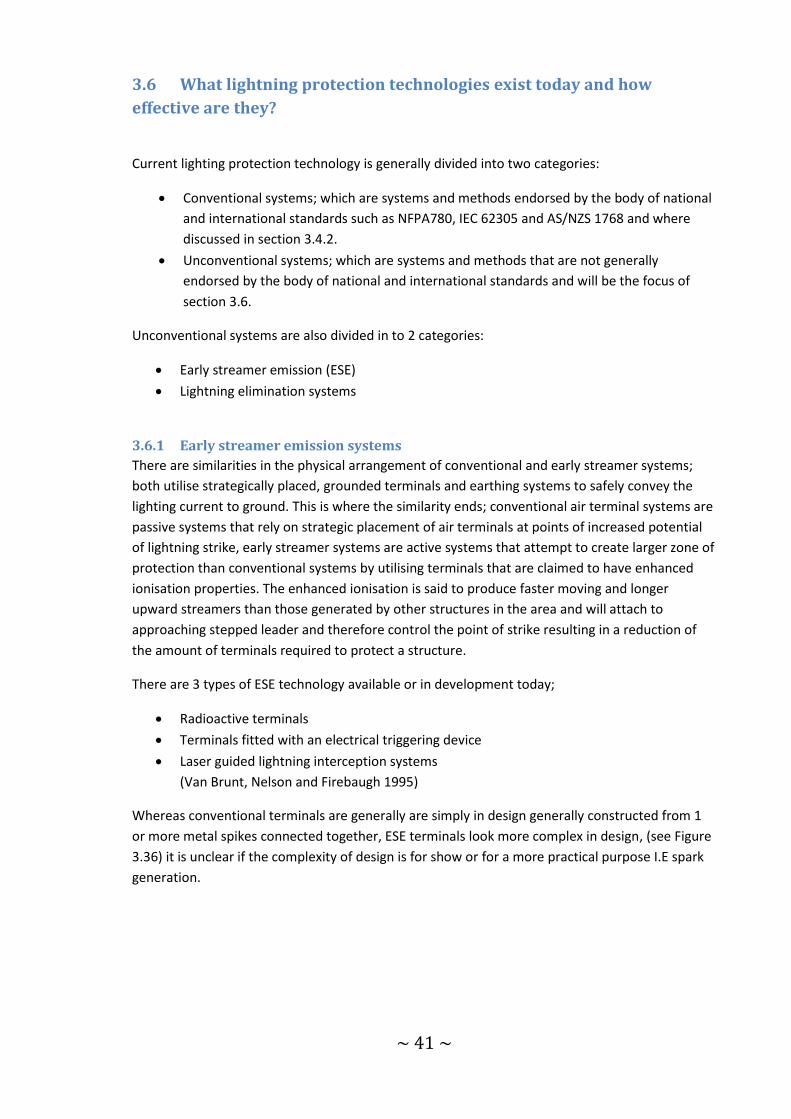
~ 41 ~
3.6 What lightning protection technologies exist today and how
effective are they?
Current lighting protection technology is generally divided into two categories:
Conventional systems; which are systems and methods endorsed by the body of national
and international standards such as NFPA780, IEC 62305 and AS/NZS 1768 and where
discussed in section 3.4.2.
Unconventional systems; which are systems and methods that are not generally
endorsed by the body of national and international standards and will be the focus of
section 3.6.
Unconventional systems are also divided in to 2 categories:
Early streamer emission (ESE)
Lightning elimination systems
3.6.1 Early streamer emission systems
There are similarities in the physical arrangement of conventional and early streamer systems;
both utilise strategically placed, grounded terminals and earthing systems to safely convey the
lighting current to ground. This is where the similarity ends; conventional air terminal systems are
passive systems that rely on strategic placement of air terminals at points of increased potential
of lightning strike, early streamer systems are active systems that attempt to create larger zone of
protection than conventional systems by utilising terminals that are claimed to have enhanced
ionisation properties. The enhanced ionisation is said to produce faster moving and longer
upward streamers than those generated by other structures in the area and will attach to
approaching stepped leader and therefore control the point of strike resulting in a reduction of
the amount of terminals required to protect a structure.
There are 3 types of ESE technology available or in development today;
Radioactive terminals
Terminals fitted with an electrical triggering device
Laser guided lightning interception systems
(Van Brunt, Nelson and Firebaugh 1995)
Whereas conventional terminals are generally are simply in design generally constructed from 1
or more metal spikes connected together, ESE terminals look more complex in design, (see Figure
3.36) it is unclear if the complexity of design is for show or for a more practical purpose I.E spark
generation.
~ 42 ~
Figure 3.36 Images of different air terminals, the image to left portrays a conventional air terminal while the 4 right images are representative of ESE air terminals. Images adapted from various internet LPS advertisements.
Radioactive terminals
Radioactive ESE terminals utilise radioactive materials to ionize the in the vicinity of the terminal
(generally for a radius of up to 3cm). In 1987 the devices became subject to a worldwide ban due
to concerns for human safety. Additionally the terminal effectiveness was under pressure due to a
1985 study that investigated several lightning impacted buildings fitted with the devices in
Singapore. The buildings had been damaged by lightning strikes that had occurred within the
protection zone of the installed radioactive ESE terminals.
Electrically triggered ESE terminals
Shortly after the ban of radioactive ESE terminals, electrically triggered ESE terminals were
introduced to the market. The basis of operation appears to be the same as the radioactive
terminals. The difference being that instead of constant ionisation due to a radioactive source,
these terminals utilise high voltage pulse generated sparking to generate the required ionisation.
It is difficult to accurately determine the effectiveness of the electrically triggered ESE terminals
due to a lack of quantitative data or results that display the effectiveness, on the reverse side
there is an overwhelming amount of literature available that identifies situations where an ESE
device have proven ineffective at worst or comparable to conventional systems at best, some of
these are listed below;
“A critical Review of non-conventional approaches to lightning protection” by M.A.
Uman and VA Rakov.
“Conventional Lightning Air Terminals: An Overview” by Z.A. Hartono and I Robiah
“ A database of lightning damage caused by bypasses of air terminals in Kula Lumpur,
Malaysia” By Z.A Hartono, I. Robiah and M Darveniz
“Early streamer emission air terminals lightning protection “ by R.J. Van Brunt, T.L Nelson
and S.L. Firebaugh
~ 43 ~
3.6.2 Laser guided lightning interception systems
Currently laser guided lightning protection systems are not commercially available although there
have been recent breakthroughs in technology that may change this in the future. The theory is to
use a laser beam to create a plasma channel between an electrically charged cloud and suitable
earthing system. The premise being that the plasma channel will act like a first strike and will
define the path and location of potential lightning strikes, therefore emptying the cloud of charge
and eliminating the risk in a given area. In February 2012 the scientific community journal AIP
Advances published “Triggering, guiding and deviation of long spark discharges with femtosecond
laser filament”, which documented research conducted at Ecole Polytechnique, Paris, France. The
paper explains how a laser was consistently used to guide a long spark along a given path even
after adjacent streamer development has begun (Forestier, et al. 2012). Although this is
potentially a great step forward for active lightning protection, the research has a long way to go
before a commercial system could be developed.
3.6.3 Lightning elimination systems
Lightning elimination theory presupposes that it is possible to prevent lightning from occurring by
equalising the cloud electrical charge. There appears to be 2 descriptions for what appears to be
one lighting elimination systems
Charge transfer system (CTS)
Dissipation array System (DAS)
Charge transfer systems prevent lightning strikes form occurring within a specified area or a “zone
of protection”. The CTS collects ground electrical charge induced by approaching thunderstorms
and redirects into the atmosphere through one or more multi pointed ioniser terminals. The
ionisation process is said to generate an area of space charge that acts like a barrier between the
storm cloud and the “zone of protection”. (Carpenter and Drabkin Unknown)
Similar to ESE technology there appears to be a lack of quantitative data and peer reviewed
literature available to support the effectiveness of the named systems. Conversely it easy to find
white papers that dismiss the technology as not effective, additionally there is well documented
evidence of lightning strikes to towers at Kennedy space centre fitted with dissipation array
systems in the late 1970’s. Further indication of the lack of support for the effectiveness of the
technology has been displayed by the closure of the IEE and NFPA projects to develop standards
for the CTS systems. (Mousa 1998) (Lightning Protection Institute 2005)
~ 44 ~
4 Identification of typical Australian installations
An internet search was completed to determine the common characteristics of typical Australian
PV installations. The search identified 2 websites (Warick Johnston 2012) (Wikpedia 2012) that
contain lists of commercial scale PV installations larger than 30kW. Consolidation of the 2 lists
identified 120 installations with a total capacity of approximately 35MW An extract from the
combined table has been provided in Appendix A. The Clean Energy Council website (Clean Energy
Council 2013) identifies Australian PV installed Capacity at approximately 2.1GW, this figure
implies that the lists do not provide a comprehensive list of PV installations. However the lists
provided sufficient information to be able to determine the characteristics of typical Australian
installations identified below.
Standalone frame mounted panels (with or without designated building for Power
convertors)
Pitched roof mounted panels
Frame mounted panels installed on a roof top (roof profile: flat or contoured)
Typical characteristics associated with system capacity were initially investigated and then
disregarded, it was identified that both Australian and IEC Lightning protection standards did not
contain any requirement for system capacity to be considered in the assessment or solution of
lighting protection for structures.
~ 45 ~
5 Lightning protection standards gap analysis
5.1 Purpose
The purpose of completing the gap analysis is to;
identify material differences between Standards IEC 62305 & AS/ NZS 1768
evaluate the impact of any material differences
5.2 Method
The following methods were used to complete the gap analysis;
Comparison of Structure and content of the standards:
The analysis details are presented in Appendix B.1
o Step 1: Document IEC 62305 content by section
o Step 2: Document section number for equivalent content in AS/NZS 1768
o Step 3: Document material differences between content
o Step 4: Document content Present in AS /NZS 1768 and not present in IEC 62305
Comparison of methods to determine requirement for lightning protection
The analysis details are presented in Appendix B.2
o Step 1: Document models used to identify requirements
o Step 2: Document requirement identification process flow map
o Step 3: Document differences in previous steps
Comparison of risk assessment tools provided by the standards
The analysis details are presented in Appendix B.3
o Step 1: Document tools provided by the standards
o Step 2: Document differences
Comparison of recommended protection methods
The analysis details are presented in Appendix B.4
In addition;
o LPS was Discussed in section 3.4.2
o Surge protection was Discussed in 3.5.2
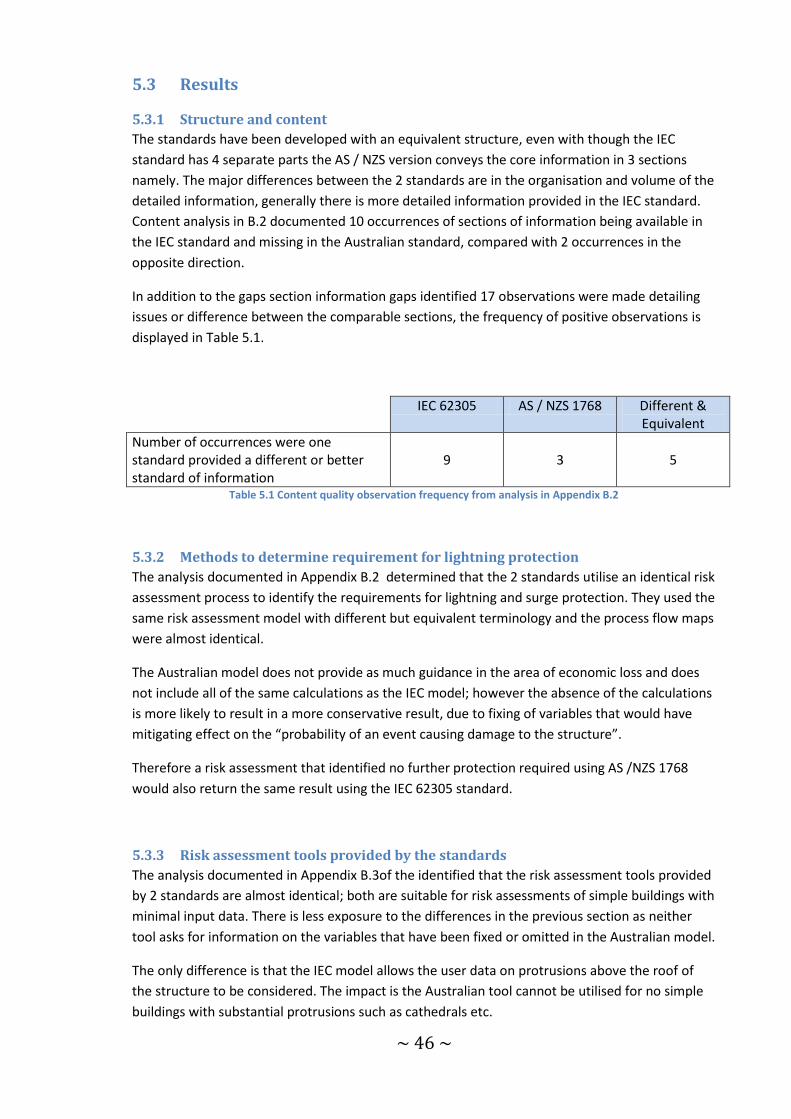
~ 46 ~
5.3 Results
5.3.1 Structure and content
The standards have been developed with an equivalent structure, even with though the IEC
standard has 4 separate parts the AS / NZS version conveys the core information in 3 sections
namely. The major differences between the 2 standards are in the organisation and volume of the
detailed information, generally there is more detailed information provided in the IEC standard.
Content analysis in B.2 documented 10 occurrences of sections of information being available in
the IEC standard and missing in the Australian standard, compared with 2 occurrences in the
opposite direction.
In addition to the gaps section information gaps identified 17 observations were made detailing
issues or difference between the comparable sections, the frequency of positive observations is
displayed in Table 5.1.
IEC 62305 AS / NZS 1768 Different & Equivalent
Number of occurrences were one standard provided a different or better standard of information
9 3 5
Table 5.1 Content quality observation frequency from analysis in Appendix B.2
5.3.2 Methods to determine requirement for lightning protection
The analysis documented in Appendix B.2 determined that the 2 standards utilise an identical risk
assessment process to identify the requirements for lightning and surge protection. They used the
same risk assessment model with different but equivalent terminology and the process flow maps
were almost identical.
The Australian model does not provide as much guidance in the area of economic loss and does
not include all of the same calculations as the IEC model; however the absence of the calculations
is more likely to result in a more conservative result, due to fixing of variables that would have
mitigating effect on the “probability of an event causing damage to the structure”.
Therefore a risk assessment that identified no further protection required using AS /NZS 1768
would also return the same result using the IEC 62305 standard.
5.3.3 Risk assessment tools provided by the standards
The analysis documented in Appendix B.3of the identified that the risk assessment tools provided
by 2 standards are almost identical; both are suitable for risk assessments of simple buildings with
minimal input data. There is less exposure to the differences in the previous section as neither
tool asks for information on the variables that have been fixed or omitted in the Australian model.
The only difference is that the IEC model allows the user data on protrusions above the roof of
the structure to be considered. The impact is the Australian tool cannot be utilised for no simple
buildings with substantial protrusions such as cathedrals etc.

~ 47 ~
5.3.4 Recommended protection methods
The recommended methods table provided in Appendix B.4 supports the information that has
been presented in Sections 3.4.2 & 3.5.2. There are some differences in the recommended
methodologies between the two standards, the most materials of these being
the method to identify placement of air termination devices
the lack of structure to identify lightning protection zones in AS /NZS 1768
The strategic placement of air termination devices is critical to the effectiveness of any LPS system
and the positioning of air terminals is potentially a significant difference between the 2 standards.
On the surface IEC 62305 allow 3 different methods compared with 1 for AS /NZS 1768. From an
Australian perspective the placement of an air terminal utilising the RSM method will comply with
both the Australian an IEC standards. The issue is that the IEC standard provides the system
designer with a choice and RSM may not be the most conservative approach. This discrepancy is
unlikely to have a material impact on Australian LPS effectiveness given that all of the methods
are derived from the geometric model with the associated assumptions discussed in section 3.4.2.
The lack of a structured approach to identify lightning protection zones is another example of a
potentially significant difference between the 2 standards. The lack structure provided by AS /
NZS 1768 impacts on ability of a new designer to miss some detail that can result in a less than
optimal design to protect against effects of LEMP, Figure 3.32 provides an excellent example of
the attention to detail that is required to successful protect against eh impacts of LEMP.
Even with this issue the AS / NZS standard does provide enough information to ensure that a
competent designer considers and includes all of the elements required to develop an effective
design to protect against the effects of LEMP.
~ 48 ~
6 Audit sheet development
6.1 Purpose
Designing or assessing lightning protection systems involves assessing many elements in detail;
the audit worksheet is intended to address this by providing a document that will guide a person
through the various elements in a consistent manner. In addition it deliberately prompts thought
along a path with the intent to align the information gathered with the information required to
complete a risk assessment using the tool developed as part of this project.
6.2 Method
The development of the audit sheet was completed in the following nine steps;
1. Read, digest and understand the methodologies and requirements of the IEC standard.
2. Compile a 1st draft excel tool to evaluate requirements for lightning protection against the
IEC standard.
3. Develop 1st draft audit sheet
4. Conduct bench top risk assessment of a suitable structure.
5. Enter information into risk assessment tool
6. Amend audit sheet with improvements.
7. Conduct field audit of Murdoch Engineering Building roof inclusive of PV system.
8. Enter information into improved excel tool.
9. Modify audit sheet to improve alignment and missing content.
6.3 Results
The audit sheet used to document the information applicable to the Murdoch Engineering
building assessment (step 7) has been included in Appendix C.2.3, the sheet was successful in
steering the information collection process. The following self-observations were made during the
audit and are considered to highlight the benefit of a document of this style;
The bench top exercise completed prior to the field visit addressed 80% of the
information required and focused the field visit to obtain missing information and validate
assumptions
The worksheet forced the consideration of all aspects required to collect the data to enter
into the risk assessment tool, no second trip or missing information
The worksheet could be improved with guidance on details to assist with auditing in the
field.
Entry of data into the excel risk assessment was simple due to aligned format.
An additional benefit to the development of the worksheet was the increased understanding that
was developed by through documenting all of the variations available for particular variable.

~ 49 ~
7 Lightning protection requirements tool
7.1 Purpose
Risk assessment processes involve considering many elements, it is important that all of the
elements are considered in a consistent and repeatable manner. Excel tools area available for
purchase from providers of the IEC and AS/NZS standards to meet this requirement. However
they are simplified versions of the risk assessment process and do not consider many of the
elements required. Therefore the excel tool development included all elements of the risk
assessment process detailed in IEC 62305-2, in addition a RSM assessment spread sheet has been
included to assist in assessing the placement of air termination devices
7.2 Method
The development of the risk assessment tool was completed in the following steps
1. Develop matrix for risk determination
2. Document risk components
3. Document IEC calculations required to calculate risk for each loss type
4. Source, validate and include Australian ground flash density data into the calculations
5. Complete assessment with developed tool and AS /NZS tool and compare to results to
establish validity
6. Develop RSM assessment spread sheet
7. Develop front screen to align with audit sheet
8. Complete risk assessment tool by use front screen to manipulate calculations and risk
determination matrix
9. Repeat validation against AS /NZS model
7.3 Excel tool overview
The excel tool consists of the following 7 pages;
Instructions
Summary & Data Entry
RSM Chart Data Entry
RSM Chart
Risk Determination Matrix
Risk Calculations
Ng Ground Flash Density
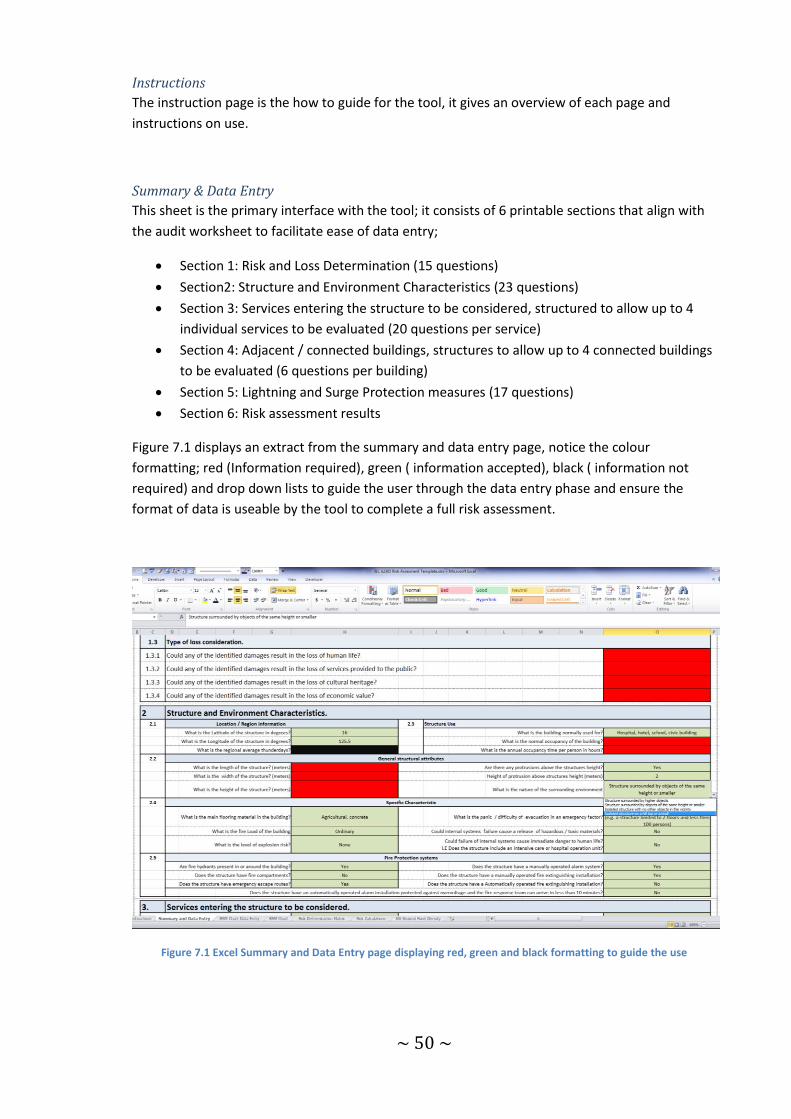
~ 50 ~
Instructions
The instruction page is the how to guide for the tool, it gives an overview of each page and
instructions on use.
Summary & Data Entry
This sheet is the primary interface with the tool; it consists of 6 printable sections that align with
the audit worksheet to facilitate ease of data entry;
Section 1: Risk and Loss Determination (15 questions)
Section2: Structure and Environment Characteristics (23 questions)
Section 3: Services entering the structure to be considered, structured to allow up to 4
individual services to be evaluated (20 questions per service)
Section 4: Adjacent / connected buildings, structures to allow up to 4 connected buildings
to be evaluated (6 questions per building)
Section 5: Lightning and Surge Protection measures (17 questions)
Section 6: Risk assessment results
Figure 7.1 displays an extract from the summary and data entry page, notice the colour
formatting; red (Information required), green ( information accepted), black ( information not
required) and drop down lists to guide the user through the data entry phase and ensure the
format of data is useable by the tool to complete a full risk assessment.
Figure 7.1 Excel Summary and Data Entry page displaying red, green and black formatting to guide the use
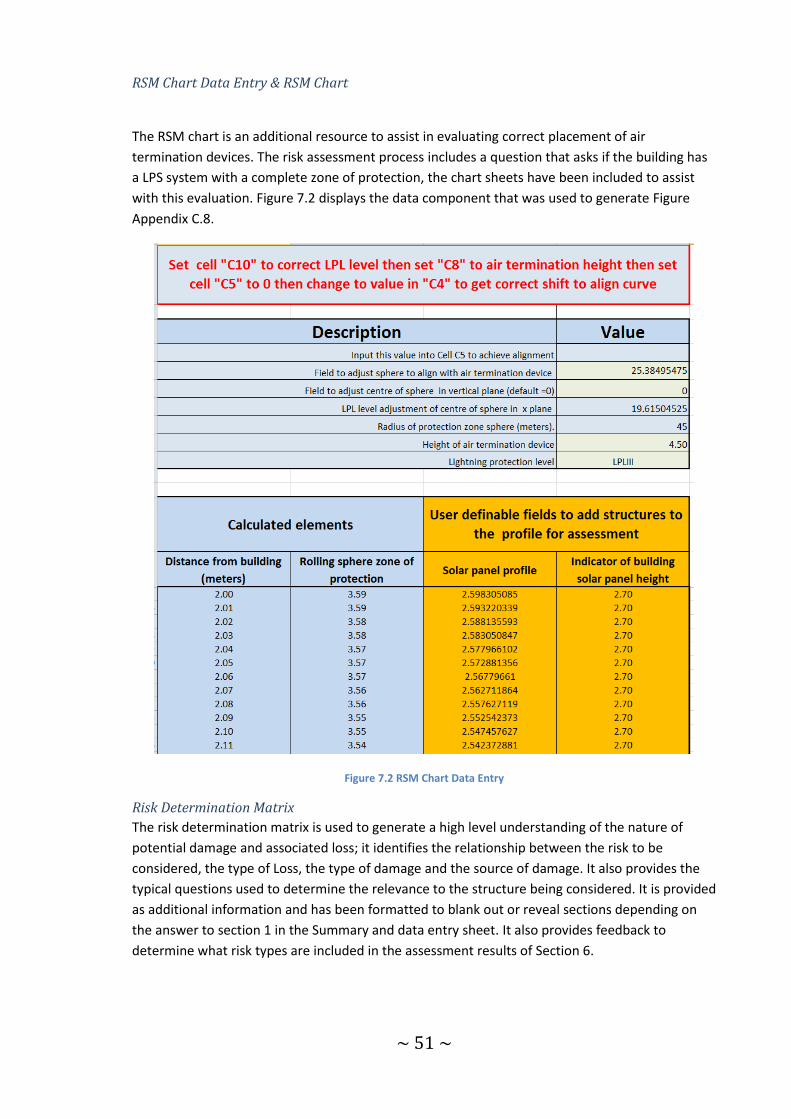
~ 51 ~
RSM Chart Data Entry & RSM Chart
The RSM chart is an additional resource to assist in evaluating correct placement of air
termination devices. The risk assessment process includes a question that asks if the building has
a LPS system with a complete zone of protection, the chart sheets have been included to assist
with this evaluation. Figure 7.2 displays the data component that was used to generate Figure
Appendix C.8.
Figure 7.2 RSM Chart Data Entry
Risk Determination Matrix
The risk determination matrix is used to generate a high level understanding of the nature of
potential damage and associated loss; it identifies the relationship between the risk to be
considered, the type of Loss, the type of damage and the source of damage. It also provides the
typical questions used to determine the relevance to the structure being considered. It is provided
as additional information and has been formatted to blank out or reveal sections depending on
the answer to section 1 in the Summary and data entry sheet. It also provides feedback to
determine what risk types are included in the assessment results of Section 6.
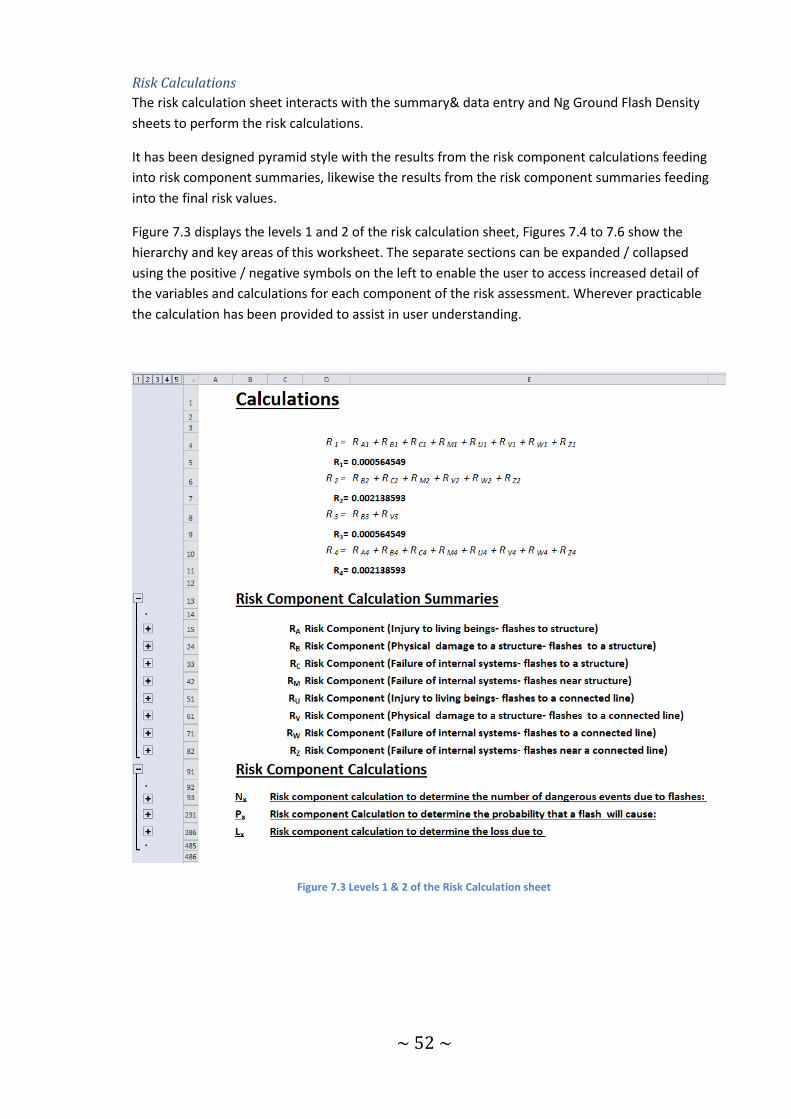
~ 52 ~
Risk Calculations
The risk calculation sheet interacts with the summary& data entry and Ng Ground Flash Density
sheets to perform the risk calculations.
It has been designed pyramid style with the results from the risk component calculations feeding
into risk component summaries, likewise the results from the risk component summaries feeding
into the final risk values.
Figure 7.3 displays the levels 1 and 2 of the risk calculation sheet, Figures 7.4 to 7.6 show the
hierarchy and key areas of this worksheet. The separate sections can be expanded / collapsed
using the positive / negative symbols on the left to enable the user to access increased detail of
the variables and calculations for each component of the risk assessment. Wherever practicable
the calculation has been provided to assist in user understanding.
Figure 7.3 Levels 1 & 2 of the Risk Calculation sheet
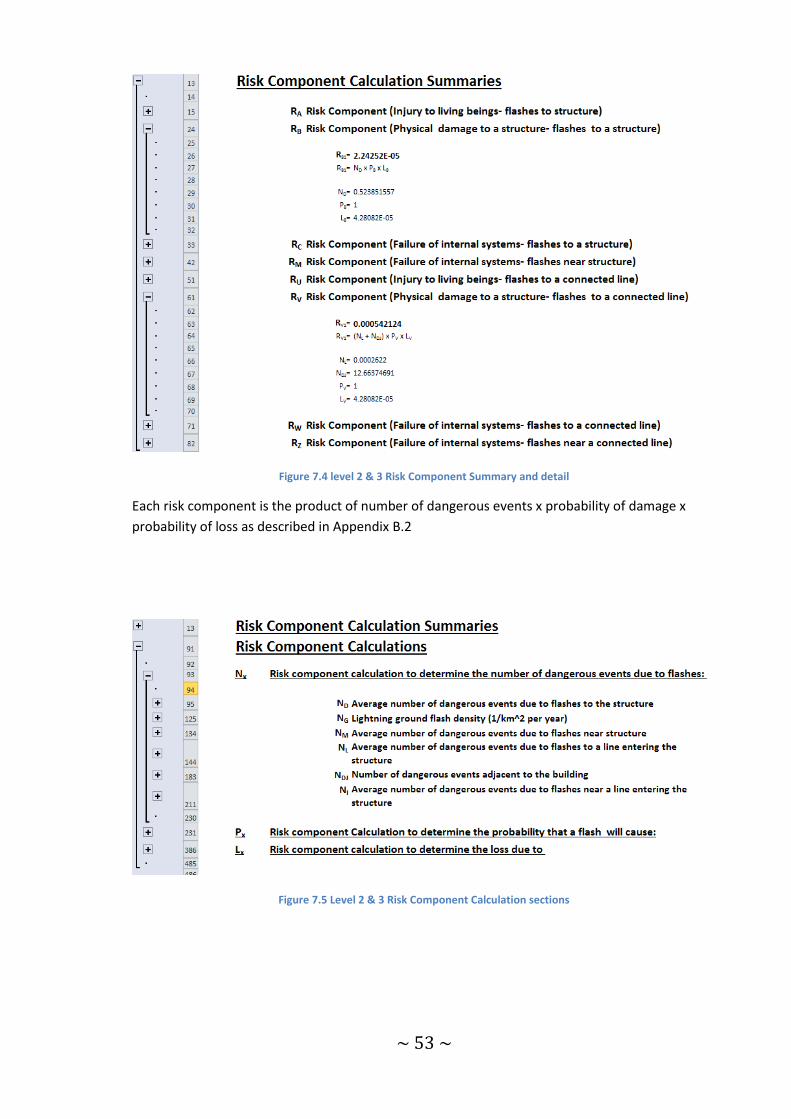
~ 53 ~
Figure 7.4 level 2 & 3 Risk Component Summary and detail
Each risk component is the product of number of dangerous events x probability of damage x
probability of loss as described in Appendix B.2
Figure 7.5 Level 2 & 3 Risk Component Calculation sections
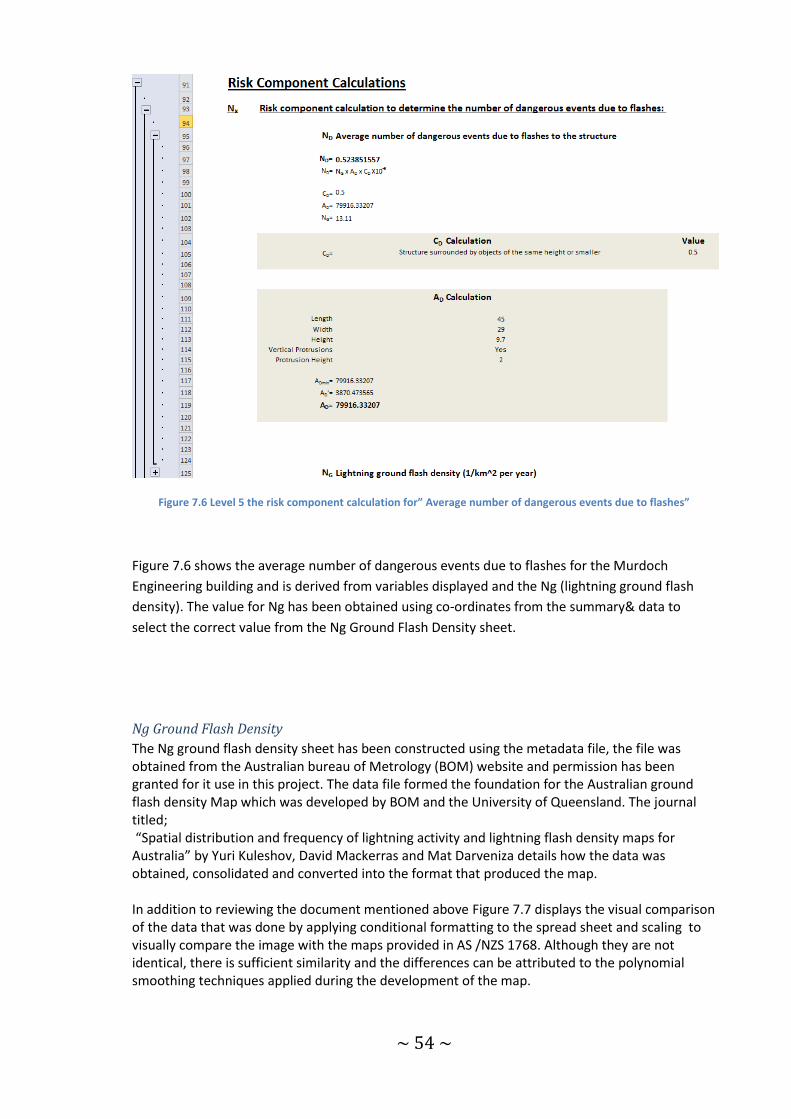
~ 54 ~
Figure 7.6 Level 5 the risk component calculation for” Average number of dangerous events due to flashes”
Figure 7.6 shows the average number of dangerous events due to flashes for the Murdoch
Engineering building and is derived from variables displayed and the Ng (lightning ground flash
density). The value for Ng has been obtained using co-ordinates from the summary& data to
select the correct value from the Ng Ground Flash Density sheet.
Ng Ground Flash Density
The Ng ground flash density sheet has been constructed using the metadata file, the file was obtained from the Australian bureau of Metrology (BOM) website and permission has been granted for it use in this project. The data file formed the foundation for the Australian ground flash density Map which was developed by BOM and the University of Queensland. The journal titled; “Spatial distribution and frequency of lightning activity and lightning flash density maps for Australia” by Yuri Kuleshov, David Mackerras and Mat Darveniza details how the data was obtained, consolidated and converted into the format that produced the map. In addition to reviewing the document mentioned above Figure 7.7 displays the visual comparison of the data that was done by applying conditional formatting to the spread sheet and scaling to visually compare the image with the maps provided in AS /NZS 1768. Although they are not identical, there is sufficient similarity and the differences can be attributed to the polynomial smoothing techniques applied during the development of the map.
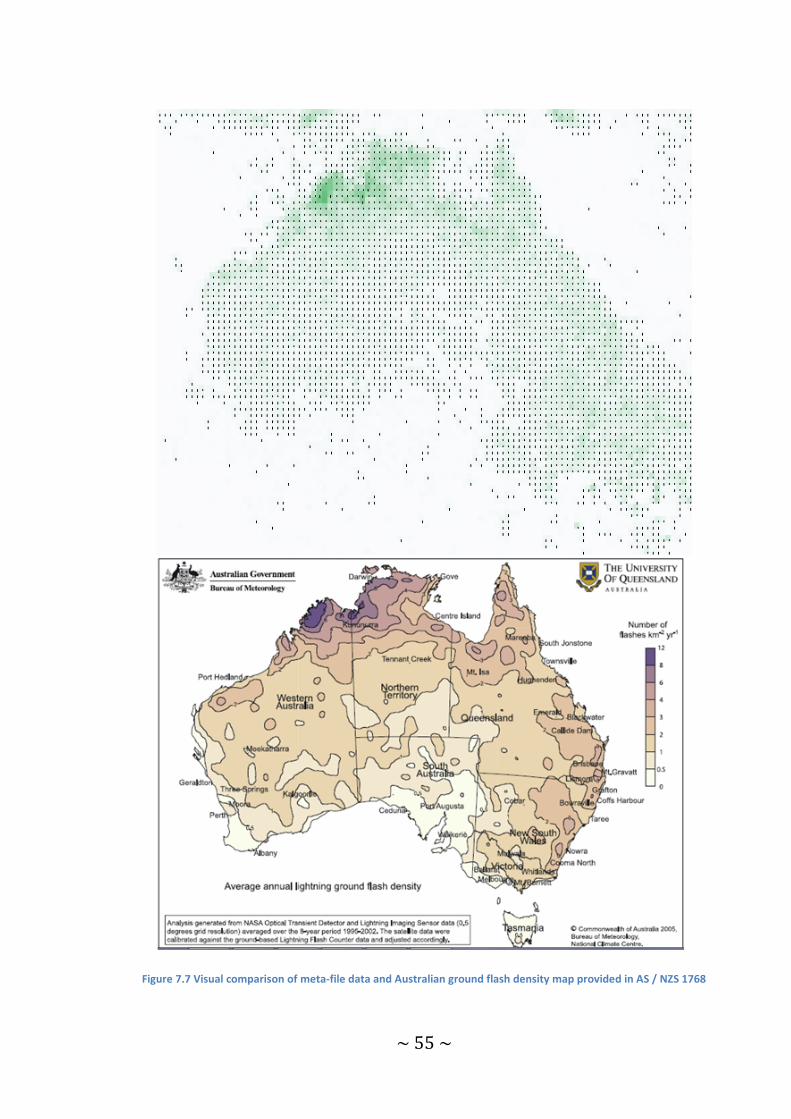
~ 55 ~
Figure 7.7 Visual comparison of meta-file data and Australian ground flash density map provided in AS / NZS 1768
~ 56 ~
8 Case study
8.1 Purpose The purpose of the case study is to:
Demonstrate the practical application of audit sheet and excel tool developed as part this
thesis project
Validate the risk assessment tool
Demonstrate the practical application of lightning protection standards and with a particular
focus on design impacts to PV systems.
8.2 Method
The case study will use the audit sheet, risk assessment and RSM calculator developed as part of
this project, to complete a lightning protection requirements assessment on the Murdoch
Engineering Building inclusive of the roof top PV system.
The assessment will document any shortfall against the standards and make recommendations
for corrective actions where necessary.
8.3 Results
The details of the case study are provided in Appendix C and indicate that the risk profile of the
Murdoch Engineering building inclusive of lightning protection does not require any action to be
taken with regard to lightning protection standards IEC 62305 or AS NZS 1768.
The audit work sheet and excel risk assessment tool provide good process to complete the
assessment in a repeatable manner. The excel tool facilitated an easy assessment to identify extra
requirements for the building in different locations (see Table Appendix C.2), this feature is
beneficial to designers of transportable of systems and buildings I.E Remote medical / education
centres, mining camps or research units.
The audit worksheet tool provided a repeatable process for gathering the information required to
complete a quality assessment.
The case study highlighted the following issues with the lightning protection installation;
A majority of the PV arrays are not within the zone of protection offered by the existing
horizontal lightning termination strip or the conductive natural components of the
building.
There is complete lack of surge protection for the sensitive components in the building
such as, PV system power electronics, array by pass diodes and computer system
contained in the Engineering building.
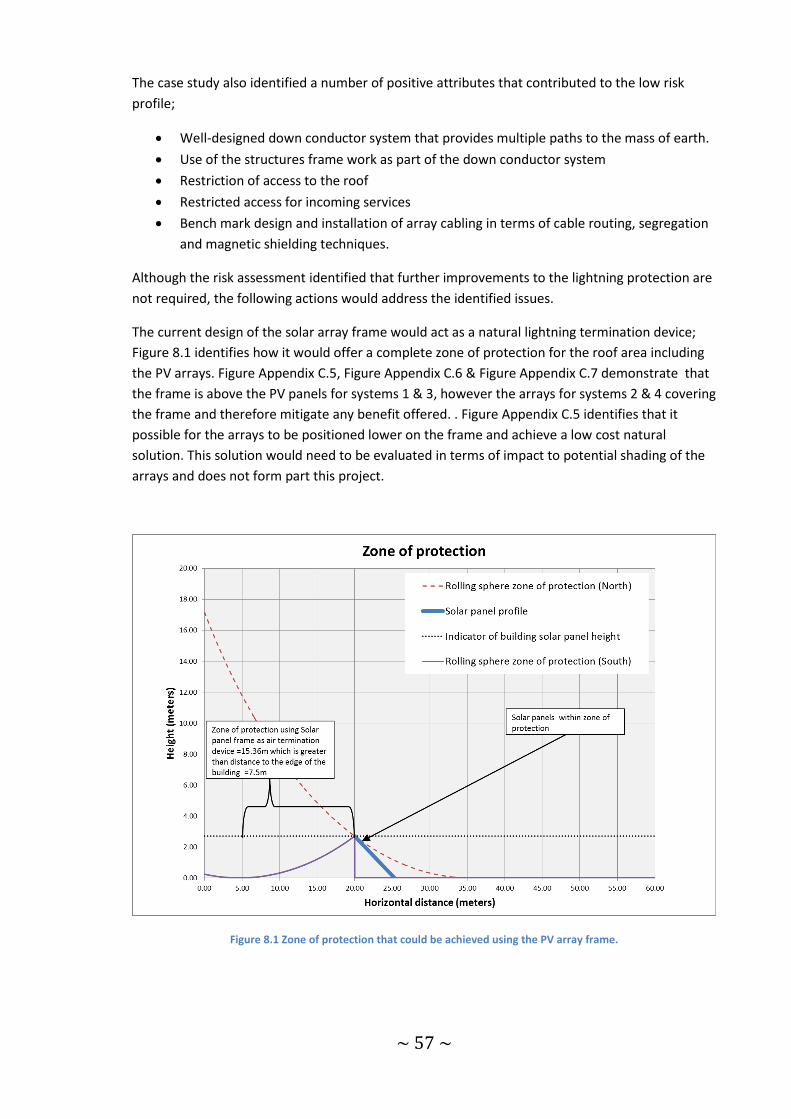
~ 57 ~
The case study also identified a number of positive attributes that contributed to the low risk
profile;
Well-designed down conductor system that provides multiple paths to the mass of earth.
Use of the structures frame work as part of the down conductor system
Restriction of access to the roof
Restricted access for incoming services
Bench mark design and installation of array cabling in terms of cable routing, segregation
and magnetic shielding techniques.
Although the risk assessment identified that further improvements to the lightning protection are
not required, the following actions would address the identified issues.
The current design of the solar array frame would act as a natural lightning termination device;
Figure 8.1 identifies how it would offer a complete zone of protection for the roof area including
the PV arrays. Figure Appendix C.5, Figure Appendix C.6 & Figure Appendix C.7 demonstrate that
the frame is above the PV panels for systems 1 & 3, however the arrays for systems 2 & 4 covering
the frame and therefore mitigate any benefit offered. . Figure Appendix C.5 identifies that it
possible for the arrays to be positioned lower on the frame and achieve a low cost natural
solution. This solution would need to be evaluated in terms of impact to potential shading of the
arrays and does not form part this project.
Figure 8.1 Zone of protection that could be achieved using the PV array frame.

~ 58 ~
The second action would be to install suitable surge protection devices in the following locations;
Array to inverter cabling:
A suggested location would be at JB1 mounted on the array frame. The close proximity to
the down conductor network would facilitate good earthing and the metallic ducting
offers good protection against the effects of LEMP. The purpose of this surge protection is
to mitigate the effects of lightning current impacting on the bypass diodes and
introducing surge currents in to the power electronics or Murdoch Engineering Electrical
system.
Inverter to distribution board cabling:
A suggested location would be in the Level 3 distribution board; this would be consistent
with the methodology provided in Figure 3.35.
~ 59 ~
9 Conclusion
This thesis project documents completion of 6 out of the 7 criteria identified as the objectives that
would determine the success of the project, therefore is considered to be a success.
Section 3 answered all 6 questions and provided sufficient information to develop an
understanding of the nature of lightning and what effective methods of protection are available.
It documented conventional and unconventional methods of protection; in addition it
documented methods used to predict lightning activity which is used as a method of protection
for events rather than structures. The frequent reference of the standards throughout the section
was completed to provide the reader with an understanding of areas of consensus or
disagreement between the standards.
Section 4 identified the standard PV installations that the assessments tools should target. The
primary deliverable of the this section was to confirm that Australian PV installations are
consistent with other areas of the world, therefore the standards and assessment tools do not
need to consider variable specific to the Australian application.
Section 5 documents the strong alignment between the AS 1768 & IEC 62305, it is clear they are
based on the same principles and methodologies. There are some differences in the quantity and
quality of information available; IEC 62305 provides more information to a higher standard than
AS1768, although there elements in the Australian standard missing in the IEC version. The use of
both standards as reference materials during the design of lightning protection systems would
provide benefit to any designer.
Section 6 documents the development of the audit worksheet, the work sheet proved to be a
valuable deliverable in the thesis, it helped to focus attention and effort on the elements required
to complete a risk assessment in an efficient repeatable manner to a high standard and drove the
format of the data entry page of the IEC 62305 risk assessment tool.
Section 7 documents the development of the IEC risk assessment tool and RSM chart, the
proliferation of excel tools available from electrical consultancy firms on the internet highlights
the need for simple assessment tools. This arrangement of an audit sheet aligned with a risk
assessment tool and RSM Chart appear to be unique and is considered to be a very successful
component of this thesis. The transparent construction of the assessment tool provide the
possibility of further development, suggestions include an ability to complete range analysis for
values such location or building characteristics which may be applicable to feasibility and options
studies.
Section 8 documents the case study of the engineering building which demonstrates the
successful application of the knowledge gained in sections 3, 4 & 5 and tools developed in
sections 6 & 7. It also highlights some of the elements of confusion that apply to companies
evaluating the lightning risk in Australia today.
The thesis did not develop a range of cost effective designs for Australian PV installations, which
could be considered to be the only flaw in the otherwise successful completion of the this thesis
project. The flaw is offset to some degree by the amount of information and diagrams available in
IEC 62305.
~ 60 ~
10 Recommendations for further work
The development of a range of cost effective designs still has the potential to provide benefits to
Australian designers and could require the calculation of clearance distances to prevent damage
due to LEMP associated with a direct strike;
Enhancement of the risk assessment tool and RSM Chart to include;
1. Development of a 3D modelling tool that can evaluate / display the zone of protection
for a building or structure based on the placement of air termination devices.
2. The model in point 1 could include the leader inception model in addition to RSM
(Becerra and Cooray 2006)
3. Conduct range or sensitivity analysis on lightning protection requirements
4. Structured methods to include cost / benefit in the risk assessment process
~ 61 ~
11 Bibliography International Electrotechnical Commision. “IEC 62305-1 Protection against Lightning - Part 1
General Priniciples.” Geneva, Geneva: International Electrotechnical Commision, 2012.
—. “IEC 62305-2 Protection against Lightning - Part 2 Risk Managment.” Geneva, Geneva:
International Electrotechnical Commision, 2012.
—. “IEC 62305-3 Protection against Lightning - Part 3 Physical damage to structure and life
hazard.” Geneva, Geneva: International Electrotechnical Commision, 2012.
—. “IEC 62305-4 Protection against Lightning - Part 4 Electrical and Electronic systems within
structures.” Geneva, Geneva: International Electrotechnical Commision, 2012.
Abidin, Hartono Zainal, and Robiah Ibrahim. “Conventional and Unconventional Lightning Air
Terminals: An overview.” Forum On Lightning Protection. Petaling Jaya: Lightning Safety
Alliance, 2004. 39.
Alltec Corporation. Lightning Protection. grounding. Power quaility. 2007.
http://www.allteccorp.com/resources/articles/aboutlightning.php (accessed august 12,
2012).
Australian Bureau of Statistics. 4102.0 - Australian Social Trends,Sep 2012. 26 09 2012.
http://www.abs.gov.au/AUSSTATS/[email protected]/Lookup/4102.0Main+Features10Sep+2012
(accessed 10 12, 2013).
Australian Govement Bureau of Meteorology. Average annual thunder-day and lightning flash
density. 12 February 2012. http://www.bom.gov.au/jsp/ncc/climate_averages/thunder-
lightning/index.jsp (accessed September 2012).
Australian Goverment Bureau of Meteorology. Australian lightning ground flash density gid data.
2007.
Australian Institute of Family Studies. Family Facts and Figures. 22 04 2013.
http://www.aifs.gov.au/institute/info/charts/households/ (accessed 10 12, 2013).
Bazelyan, Eduard M, and Yuri P Raizer. Lightning Physics and Lightning Protection. London,
London: Institute of Physics Publishing, 2000.
Becerra, Marley, and Veron Cooray. “Striking Distance os Vulnerable Points to be struck by
Lighning in Complex structures.” 28th International Confernace on Lightning Protection.
Bogata: National University of Colombia, 2006. 6.
Berger, K, R B Anderson, and H Kroieninger. “Parameters of Lightning.” Electra,Vol.41, 1975: 23-
37.
Bothwell, Phillip D. “Advances in the predication of cloud to ground lightning events at the storm
prediction center.” 19th International Lighting Detection Conference. Tuscon, Arizona,
USA, 2006. 8.
~ 62 ~
Carpenter, Roy B., and Mark N. Drabkin. Lightning Strike Protection. Boulder Colorado: Lightning
Eliminators and Consultants Inc, Unknown.
Clean Energy Council. Solar PV. 2013.
http://www.cleanenergycouncil.org.au/technologies/solarpv.html (accessed March
2013).
DEHN + SOHNE. Lightning Protection Guide 2nd Update. Technincal Guide / Manual, Neumarkt:
DEHN + SOHNE, 2007.
electrical fun. electricalfun - Lightning. unknown. http://www.electricalfun.com/lightning.htm
(accessed September 02, 2012).
Forestier, B., et al. “Triggering, guiding and deviation of long air spark discharges with femtoscond
laser filament.” AIP Advances 2, 2012: 14.
Global Hydrology Resource Centre. Lightning Imaging Sensor (LIS). Unknown Unknown Unknown.
http://ghrc.nsstc.nasa.gov/uso/ds_docs/lis/lis_dataset.html (accessed September 09,
2013).
—. Optical Transient Detector. Unknown Unknown Unknown. http://thunder.msfc.nasa.gov/otd/
(accessed September 21, 2013).
Haeberlin, Heinrich. “Chapter 6 Protecting PV Installations Against Lightning.” In Photovoltaics:
System Design, by Heinrich Haeberlin. Chichester: John Wiley and Sons Ltd, 2012.
—. “Damages at Bypass Diodes by induced Voltages and Currents in PV modules Caused by nearby
Lightning Currents.” 22nd European Photovoltaic Solar Energy Confernce. Milano: Berne
University of Applied Sciences, 2007. 6.
Hangzhou Amplesun Solar Technology Co. Ltd. “Photovoltaic Module ASF100.” Installation
Manual . Hangzhou, China: Hangzhou Amplesun Solar Technology Co. Ltd, 10 08 2009.
Hartano, Z A, I Robiah, and M Darveniza. “A database of lighting damage caused bybypasses of air
terminals on buildings in Kular Lumpur.” 25 ICLP. Rhodes, 2000.
Heilder, F., W. Zinschank, Z. Flisowski, Ch. Bouquegneau, and C. Mazzetti. “Parameters of
Lightning Current givenin IEC 62305-Background, experience and outlook.” 29th
International Conference on Lightning Protection. Uppsala, Sweden: University of Armed
Forces Munich, 2008. 22.
International Electrotechnical Commision. “IEC 62109-1 Safety of Power convertors for use in
photovoltaic power systems- Part 1 General Requirements.” Geneva, Geneva:
International Electrotechnical Commision, 2011.
—. “IEC 62109-2 Safety of Power convertors for use in photovoltaic power systems- Part 2
Particular requirements for inverters.” Geneva, Geneva: International Electrotechnical
Commision, 2011.

~ 63 ~
Kuleshov, Yuriy, David Mackerras, and Mat Daveniza. “Spatial distribribution and frequency of
lightning activity and lightning flash maps for Australia.” Journal of Geophysical Reasearch
111 (2006): 14.
Lightning Protection Institute. “IEEE terminates project P1576 on CTS lightning protection.” LPI
Tech Letter Volume 4, number 4, 2005: 1.
Linhart, Freidrich. Lightning Protection for photovoltaic (PV) systems. University Project, Murdoch:
Murdoch University, 2006.
Markiewicz, Henryk, and Antoni Klajn. “Earthing adn EMC: Earthing Systems - Fundementals of
calculations and design.” Power Quaility Guide Application. European Copper Insitiute,
Worclaw University of Technology and Copper Development, June 2003.
McEachron, K.B. “Lighting to the Empire State Building.” Journal of the Franklin Institute, Vol 227,
no.2, 1939: 149-217.
Moine, Gerad, Jean-Christan Marcel, and Alain Charoy. Report IEA PVPS T3-14: 2003:- Common
practices for protection against the effects of lightning on stand-alone photovoltaic
systems. Paris: International Energy Agency, 2003.
Mousa, Abdul M. “The applicability of lightnign elimination devices to substations and power
lines.” IEE Transactions on Power Delivery , VOl 13 No 4, 1998: 8.
NASA. Surface Meterolgy and SolarEnergy. Atmospheric Science Data Centre. 9th June 2011.
http://eosweb.larc.nasa.gov/sse/ (accessed October 10, 2011).
NASA Earth Observatory. Images. 23 June 2006.
http://earthobservatory.nasa.gov/IOTD/view.php?id=6679 (accessed September 08,
2013).
National Oceanic and Atmospheric Administration. “National Weather Service forecast maps .”
National Weather Service. 15 09 2013. http://www.weather.gov/ (accessed 09 15, 2013).
National Weather Service. JetStream - Online School for Weather. 05 January 2010.
http://www.srh.weather.gov/jetstream/tstorms/life.htm (accessed June 23, 2013).
Oxford Unversity Press. Oxford Dictionaries. 2012.
http://oxforddictionaries.com/definition/english/lightning (accessed September 01,
2012).
Rakov, M.A. Uman and V.A. A critical review of non conventional approaches to lighning
protection. critical review, Department of Electrical and computer engineering, ,
University of Florida, Gainesville: Amercian Meteorological Society, 2002.
Rakov, V A. “Lightning Phenomonology and Parameters important for Lighting protection.” IX
International Symposium on Lighting Protection, 2007: 24.
Rakov, Vladiir A. “Fundamentals of Lightning.” International Symposium on Lightning Protection,
Kathmandu, Nepal, October 12-14, 2011. Katmandu: University of Florida, Gainesville
FL,USA, 2011. 61.
~ 64 ~
Reece, WJ. Storms. n.d. http://kcstorm.org/storms.htm (accessed august 12, 2012).
SAI GLobal. SAI GLobal - Standards On-line. Septmeber 2012. http://0-
www.saiglobal.com.prospero.murdoch.edu.au/online/autologin.asp (accessed September
02, 2012).
Standards Australia. AS/NZS 3000:2007 Electrical installations (known as Australian / New Zealand
Wiring Rules). Standard, Sydney: Standards Australia, 2007.
Standards Australia. AS/NZS 5033:2012 Installationand safety requirements for photoltaic arrays.
Standards Australia, 2012.
Standards Australia. AS/NZS1768:2007 Lightning Protrection. Standards Australia, 2007.
Surge Protection Devices Ltd. Surge Protection Devies Ltd. 2012.
http://www.surgedevices.co.uk/solar.html (accessed September 08, 2013).
Tercel. Lightning protection system inspection and report. Conformance report, Perth WA: Tercel,
23/04/2013.
Uman, Martin A., and Vladimir A. Rakov. “Lightning Physics and Effects.” In Lightning Physics and
Effects, by Martin A. Uman and Vladimir A Rakov, 687. New York: Cambridge University
Press, 2003.
Van Brunt, Richard J., Thomas L. Nelson, and Samara L. Firebaugh. Early Streamer Emission Air
Terminals Lightning Protection Systems. Literature Review and Technical Analysis, Quincy,
Massachusetts, USA: National Fire Protection Research Foundation, 1995.
Warick Johnston. List of Austrlia Large scale Solar PV, Commerical Solar PV, Utility scale Solar PV
projects. 2012. http://www.sunwiz.com.au/index.php/large-system-list.html (accessed
Septemeber 23, 2012).
wikipedia. Wikipedia- Lightning. 2012 August 2012. http://en.wikipedia.org/wiki/Lightning
(accessed September 02, 2012).
Wikipedia. Wikipedia- Lightning. 2012 August 2012. http://en.wikipedia.org/wiki/Lightning
(accessed September 02, 2012).
Wikpedia. Solar Power in Australia. 10 August 2012.
http://en.wikipedia.org/wiki/Solar_power_in_Australia (accessed September 23, 2012).
Zuercher-Martinson, Michael, and Robert Schlesinger. “Protecting Electrical PV Systems from the
Effects of Lightning.” Lawrence, MA 01843: Solectra Renewables, n.d.
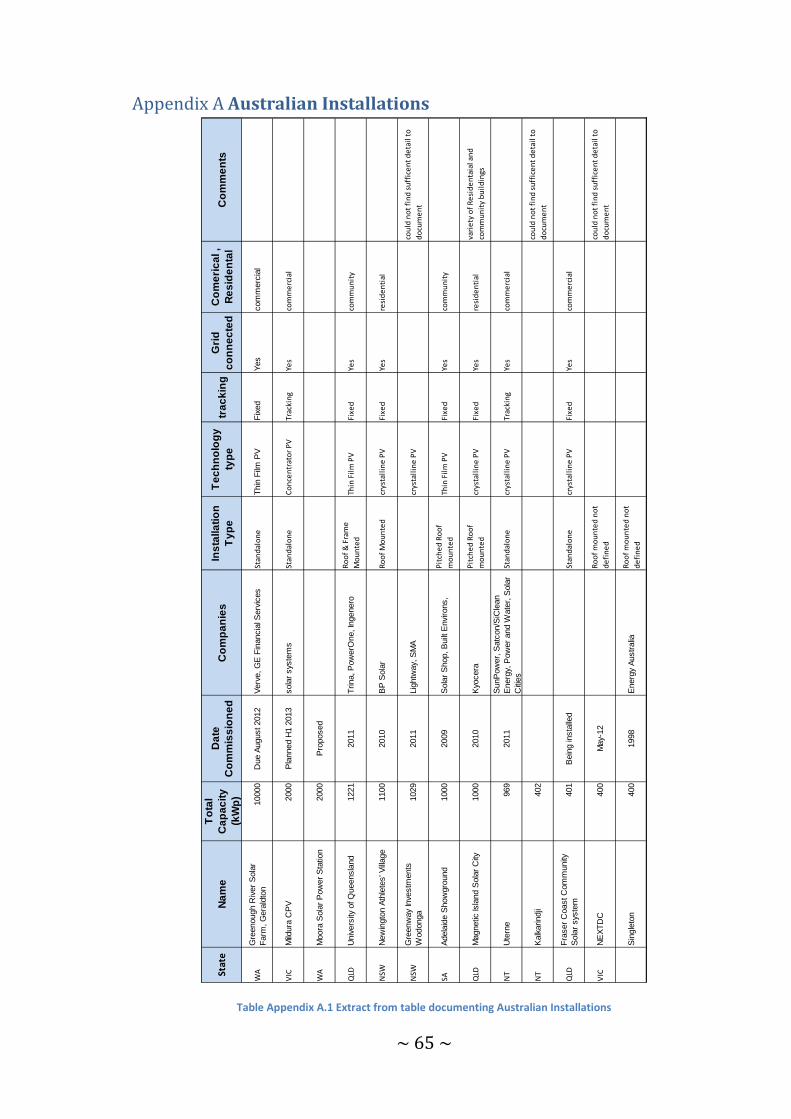
~ 65 ~
Australian Installations Appendix A
Table Appendix A.1 Extract from table documenting Australian Installations
Stat
eN
am
e
To
tal
Ca
pa
cit
y
(kW
p)
Da
te
Co
mm
iss
ion
ed
Co
mp
an
ies
Ins
talla
tio
n
Ty
pe
Te
ch
no
log
y
typ
etr
ac
kin
gG
rid
co
nn
ec
ted
Co
me
ric
al ,
Re
sid
en
tal
Co
mm
en
ts
WA
Gre
enough R
iver
Sola
r
Farm
, G
era
ldto
n10000
Due A
ugust 2012
Verv
e, G
E F
inancia
l Serv
ices
Stan
dal
on
eT
hin
Film
PV
Fix
ed
Yes
com
merc
ial
VIC
Mild
ura
CP
V2000
Pla
nned H
1 2
013
sola
r sys
tem
sSt
and
alo
ne
Co
nce
ntr
ato
r P
VTr
acki
ng
Yes
com
me
rcia
l
WA
Moora
Sola
r P
ow
er
Sta
tion
2000
Pro
posed
QLD
Univ
ers
ity o
f Q
ueensla
nd
1221
2011
Trina, P
ow
erO
ne, In
genero
Ro
of
& F
ram
e
Mo
un
ted
Thin
Fil
m P
VFi
xed
Ye
s co
mm
un
ity
NSW
New
ingto
n A
thle
tes' V
illage
1100
2010
BP
Sola
rR
oo
f M
ou
nte
dcr
ysta
llin
e P
VFi
xed
Ye
s re
sid
en
tial
NSW
Gre
enw
ay
Inve
stm
ents
Wodonga
1029
2011
Lig
htw
ay,
SM
Acr
ysta
llin
e P
Vco
uld
no
t fi
nd
su
ffic
en
t d
eta
il t
o
do
cum
en
t
SAA
dela
ide S
how
gro
und
1000
2009
Sola
r S
hop, B
uilt
Envi
rons,
Pit
che
d R
oo
f
mo
un
ted
Th
in F
ilm
PV
Fixe
d
Yes
com
mu
nit
y
QLD
Magnetic
Isla
nd S
ola
r C
ity1000
2010
Kyo
cera
Pit
che
d R
oo
f
mo
un
ted
cr
ysta
llin
e P
VFi
xed
Ye
s re
sid
en
tial
vari
ety
of
Re
sid
en
taia
l an
d
com
mu
nit
y b
uil
din
gs
NT
Ute
rne
969
2011
SunP
ow
er,
Satc
on/S
iCle
an
Energ
y, P
ow
er
and W
ate
r, S
ola
r
Citi
es
Stan
dal
on
ecr
ysta
llin
e P
VTr
acki
ng
Yes
com
me
rcia
l
NT
Kalk
arindji
402
cou
ld n
ot
fin
d s
uff
ice
nt
de
tail
to
do
cum
en
t
QLD
Fra
ser
Coast C
om
munity
Sola
r sys
tem
401
Bein
g in
sta
lled
Stan
dal
on
ecr
ysta
llin
e P
VFi
xed
Ye
s co
mm
erc
ial
VIC
NE
XT
DC
400
May-
12
Ro
of
mo
un
ted
no
t
de
fin
ed
cou
ld n
ot
fin
d s
uff
ice
nt
de
tail
to
do
cum
en
t
Sin
gle
ton
400
1998
Energ
y A
ustr
alia
Ro
of
mo
un
ted
no
t
de
fin
ed

~ 66 ~
Appendix B
Structure and Content of Standard B.1
B.1.1 Comparison of IEC 62305-1 and AS / NZS 1768
IEC 62305-1 AS/NZS 1768 Introduction: Preface:
Provides overview of the 4 parts of IEC 62305
Provides description on 8 sections and appendices of AS / NZS 1768
Section 1: Section 1:
Scope and exclusions of part 1 Scope and exclusions
References; Refers to Appendix G- Referenced documents and papers
Definitions
Section2:
References I.E 62305-2, 3 & 4 See this table Section1
Section 3:
Terms and definitions See this table Section 1
Section 4: Lightning current parameters; 4 paragraphs that refers to the following annex’s
Annex A- Parameters of lightning current Appendix B & F(see observation 4)
Annex B- Time function of lightning current No equivalent information
Annex C- Simulation Lightning for test purposes
No equivalent information
Annex D- Parameters used in labs to simulate the effects of lightning on LPS components and discussion on effects
No equivalent information
Annex E- Surges in a systems Appendix D
Section 5: Section 2
Types and source of damage Type and source of Damage
Types of loss Type and consequence of loss Types of risk (aligned to types of loss) Types of risk components
Section 6:
Types of risk (aligned to types of loss) See Section 2
Section 7:
Protection measures (living beings) Section 3 & Section 5.5
Protection measures (physical damage) Section 4 & Section 5.6
Protection measures (Electrical systems) Section 5.6
Section 8:
Lightning protection levels Section 4.2 (see observation 2)
Lightning protection zones Section 5.6.5 (see observations 3)
Protection of Structures Section 4
Protection of internal systems Section 5 Table Appendix B.1 Content Comparison IEC 62305-1 & AS/NZS 1768
B.1.2 Observations
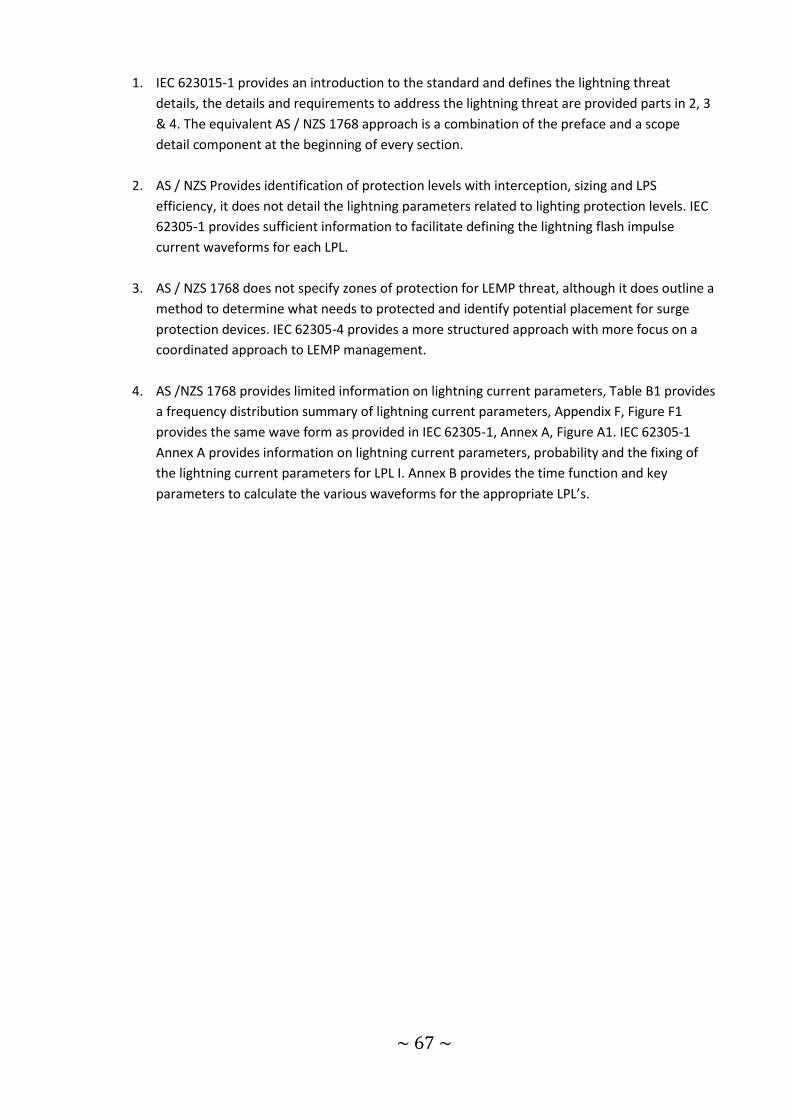
~ 67 ~
1. IEC 623015-1 provides an introduction to the standard and defines the lightning threat
details, the details and requirements to address the lightning threat are provided parts in 2, 3
& 4. The equivalent AS / NZS 1768 approach is a combination of the preface and a scope
detail component at the beginning of every section.
2. AS / NZS Provides identification of protection levels with interception, sizing and LPS
efficiency, it does not detail the lightning parameters related to lighting protection levels. IEC
62305-1 provides sufficient information to facilitate defining the lightning flash impulse
current waveforms for each LPL.
3. AS / NZS 1768 does not specify zones of protection for LEMP threat, although it does outline a
method to determine what needs to protected and identify potential placement for surge
protection devices. IEC 62305-4 provides a more structured approach with more focus on a
coordinated approach to LEMP management.
4. AS /NZS 1768 provides limited information on lightning current parameters, Table B1 provides
a frequency distribution summary of lightning current parameters, Appendix F, Figure F1
provides the same wave form as provided in IEC 62305-1, Annex A, Figure A1. IEC 62305-1
Annex A provides information on lightning current parameters, probability and the fixing of
the lightning current parameters for LPL I. Annex B provides the time function and key
parameters to calculate the various waveforms for the appropriate LPL’s.
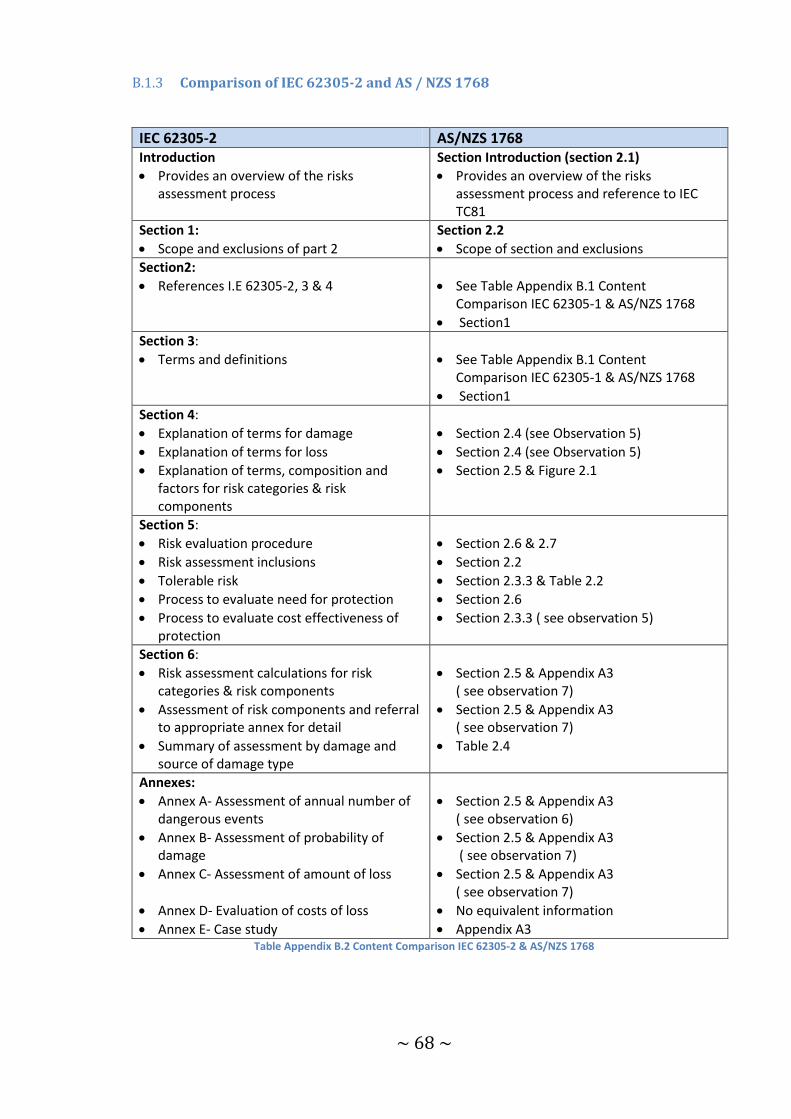
~ 68 ~
B.1.3 Comparison of IEC 62305-2 and AS / NZS 1768
IEC 62305-2 AS/NZS 1768 Introduction Section Introduction (section 2.1)
Provides an overview of the risks assessment process
Provides an overview of the risks assessment process and reference to IEC TC81
Section 1: Section 2.2
Scope and exclusions of part 2 Scope of section and exclusions
Section2:
References I.E 62305-2, 3 & 4 See Table Appendix B.1 Content Comparison IEC 62305-1 & AS/NZS 1768
Section1 Section 3:
Terms and definitions See Table Appendix B.1 Content Comparison IEC 62305-1 & AS/NZS 1768
Section1
Section 4:
Explanation of terms for damage Section 2.4 (see Observation 5)
Explanation of terms for loss Section 2.4 (see Observation 5)
Explanation of terms, composition and factors for risk categories & risk components
Section 2.5 & Figure 2.1
Section 5:
Risk evaluation procedure Section 2.6 & 2.7
Risk assessment inclusions Section 2.2
Tolerable risk Section 2.3.3 & Table 2.2
Process to evaluate need for protection Section 2.6
Process to evaluate cost effectiveness of protection
Section 2.3.3 ( see observation 5)
Section 6:
Risk assessment calculations for risk categories & risk components
Section 2.5 & Appendix A3 ( see observation 7)
Assessment of risk components and referral to appropriate annex for detail
Section 2.5 & Appendix A3 ( see observation 7)
Summary of assessment by damage and source of damage type
Table 2.4
Annexes:
Annex A- Assessment of annual number of dangerous events
Section 2.5 & Appendix A3 ( see observation 6)
Annex B- Assessment of probability of damage
Section 2.5 & Appendix A3 ( see observation 7)
Annex C- Assessment of amount of loss Section 2.5 & Appendix A3 ( see observation 7)
Annex D- Evaluation of costs of loss No equivalent information
Annex E- Case study Appendix A3 Table Appendix B.2 Content Comparison IEC 62305-2 & AS/NZS 1768
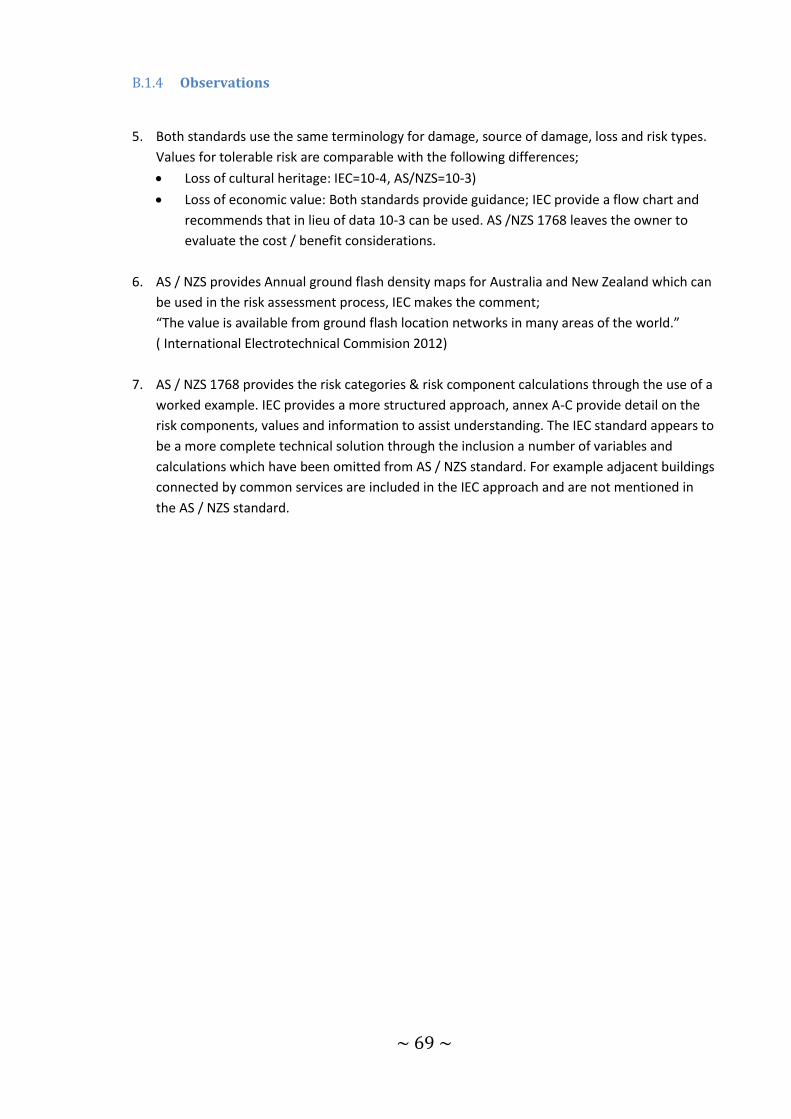
~ 69 ~
B.1.4 Observations
5. Both standards use the same terminology for damage, source of damage, loss and risk types.
Values for tolerable risk are comparable with the following differences;
Loss of cultural heritage: IEC=10-4, AS/NZS=10-3)
Loss of economic value: Both standards provide guidance; IEC provide a flow chart and
recommends that in lieu of data 10-3 can be used. AS /NZS 1768 leaves the owner to
evaluate the cost / benefit considerations.
6. AS / NZS provides Annual ground flash density maps for Australia and New Zealand which can
be used in the risk assessment process, IEC makes the comment;
“The value is available from ground flash location networks in many areas of the world.”
( International Electrotechnical Commision 2012)
7. AS / NZS 1768 provides the risk categories & risk component calculations through the use of a
worked example. IEC provides a more structured approach, annex A-C provide detail on the
risk components, values and information to assist understanding. The IEC standard appears to
be a more complete technical solution through the inclusion a number of variables and
calculations which have been omitted from AS / NZS standard. For example adjacent buildings
connected by common services are included in the IEC approach and are not mentioned in
the AS / NZS standard.
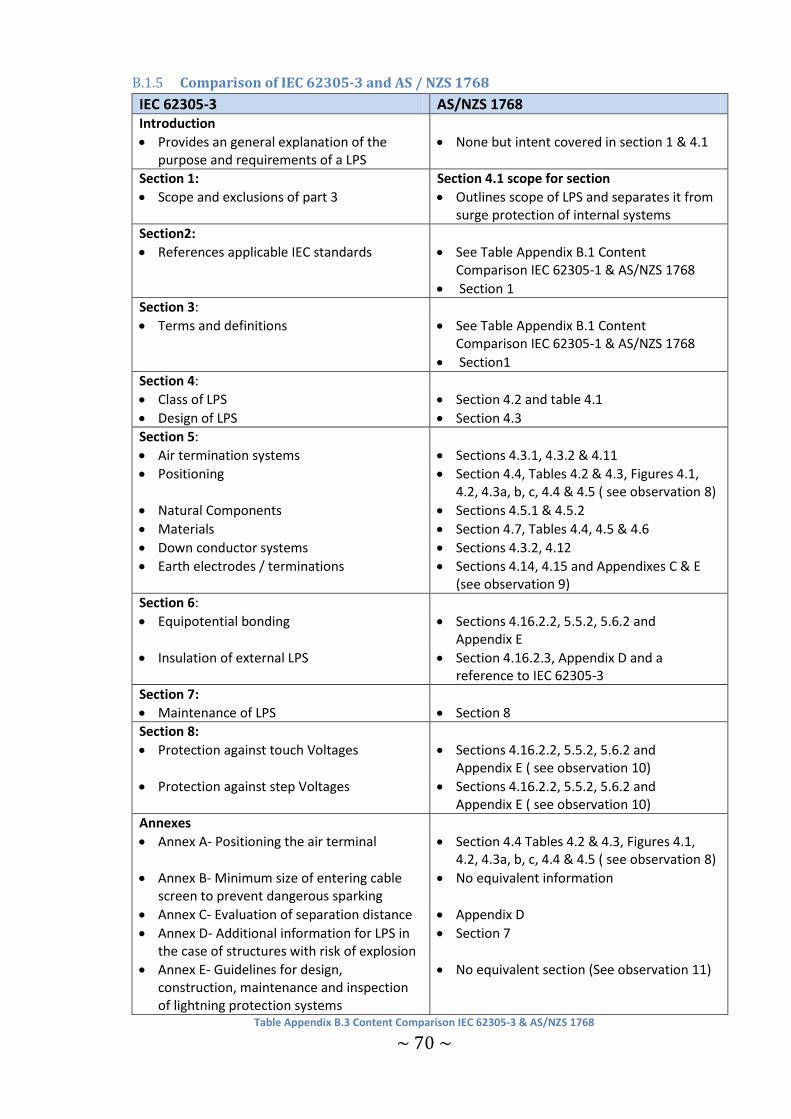
~ 70 ~
B.1.5 Comparison of IEC 62305-3 and AS / NZS 1768
IEC 62305-3 AS/NZS 1768 Introduction
Provides an general explanation of the purpose and requirements of a LPS
None but intent covered in section 1 & 4.1
Section 1: Section 4.1 scope for section
Scope and exclusions of part 3 Outlines scope of LPS and separates it from surge protection of internal systems
Section2:
References applicable IEC standards See Table Appendix B.1 Content Comparison IEC 62305-1 & AS/NZS 1768
Section 1 Section 3:
Terms and definitions See Table Appendix B.1 Content Comparison IEC 62305-1 & AS/NZS 1768
Section1
Section 4:
Class of LPS Section 4.2 and table 4.1
Design of LPS Section 4.3
Section 5:
Air termination systems Sections 4.3.1, 4.3.2 & 4.11
Positioning Section 4.4, Tables 4.2 & 4.3, Figures 4.1, 4.2, 4.3a, b, c, 4.4 & 4.5 ( see observation 8)
Natural Components Sections 4.5.1 & 4.5.2
Materials Section 4.7, Tables 4.4, 4.5 & 4.6
Down conductor systems Sections 4.3.2, 4.12
Earth electrodes / terminations Sections 4.14, 4.15 and Appendixes C & E (see observation 9)
Section 6:
Equipotential bonding Sections 4.16.2.2, 5.5.2, 5.6.2 and Appendix E
Insulation of external LPS Section 4.16.2.3, Appendix D and a reference to IEC 62305-3
Section 7:
Maintenance of LPS Section 8
Section 8:
Protection against touch Voltages Sections 4.16.2.2, 5.5.2, 5.6.2 and Appendix E ( see observation 10)
Protection against step Voltages Sections 4.16.2.2, 5.5.2, 5.6.2 and Appendix E ( see observation 10)
Annexes
Annex A- Positioning the air terminal Section 4.4 Tables 4.2 & 4.3, Figures 4.1, 4.2, 4.3a, b, c, 4.4 & 4.5 ( see observation 8)
Annex B- Minimum size of entering cable screen to prevent dangerous sparking
No equivalent information
Annex C- Evaluation of separation distance Appendix D
Annex D- Additional information for LPS in the case of structures with risk of explosion
Section 7
Annex E- Guidelines for design, construction, maintenance and inspection of lightning protection systems
No equivalent section (See observation 11)
Table Appendix B.3 Content Comparison IEC 62305-3 & AS/NZS 1768
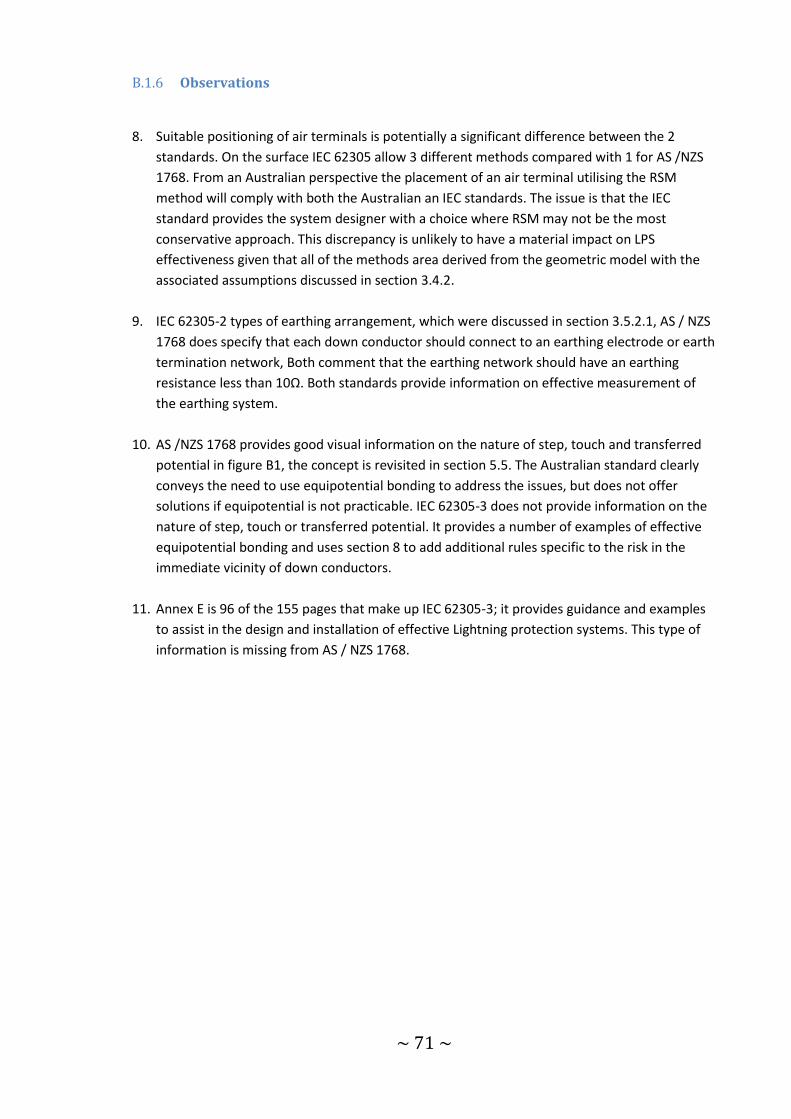
~ 71 ~
B.1.6 Observations
8. Suitable positioning of air terminals is potentially a significant difference between the 2
standards. On the surface IEC 62305 allow 3 different methods compared with 1 for AS /NZS
1768. From an Australian perspective the placement of an air terminal utilising the RSM
method will comply with both the Australian an IEC standards. The issue is that the IEC
standard provides the system designer with a choice where RSM may not be the most
conservative approach. This discrepancy is unlikely to have a material impact on LPS
effectiveness given that all of the methods area derived from the geometric model with the
associated assumptions discussed in section 3.4.2.
9. IEC 62305-2 types of earthing arrangement, which were discussed in section 3.5.2.1, AS / NZS
1768 does specify that each down conductor should connect to an earthing electrode or earth
termination network, Both comment that the earthing network should have an earthing
resistance less than 10Ω. Both standards provide information on effective measurement of
the earthing system.
10. AS /NZS 1768 provides good visual information on the nature of step, touch and transferred
potential in figure B1, the concept is revisited in section 5.5. The Australian standard clearly
conveys the need to use equipotential bonding to address the issues, but does not offer
solutions if equipotential is not practicable. IEC 62305-3 does not provide information on the
nature of step, touch or transferred potential. It provides a number of examples of effective
equipotential bonding and uses section 8 to add additional rules specific to the risk in the
immediate vicinity of down conductors.
11. Annex E is 96 of the 155 pages that make up IEC 62305-3; it provides guidance and examples
to assist in the design and installation of effective Lightning protection systems. This type of
information is missing from AS / NZS 1768.
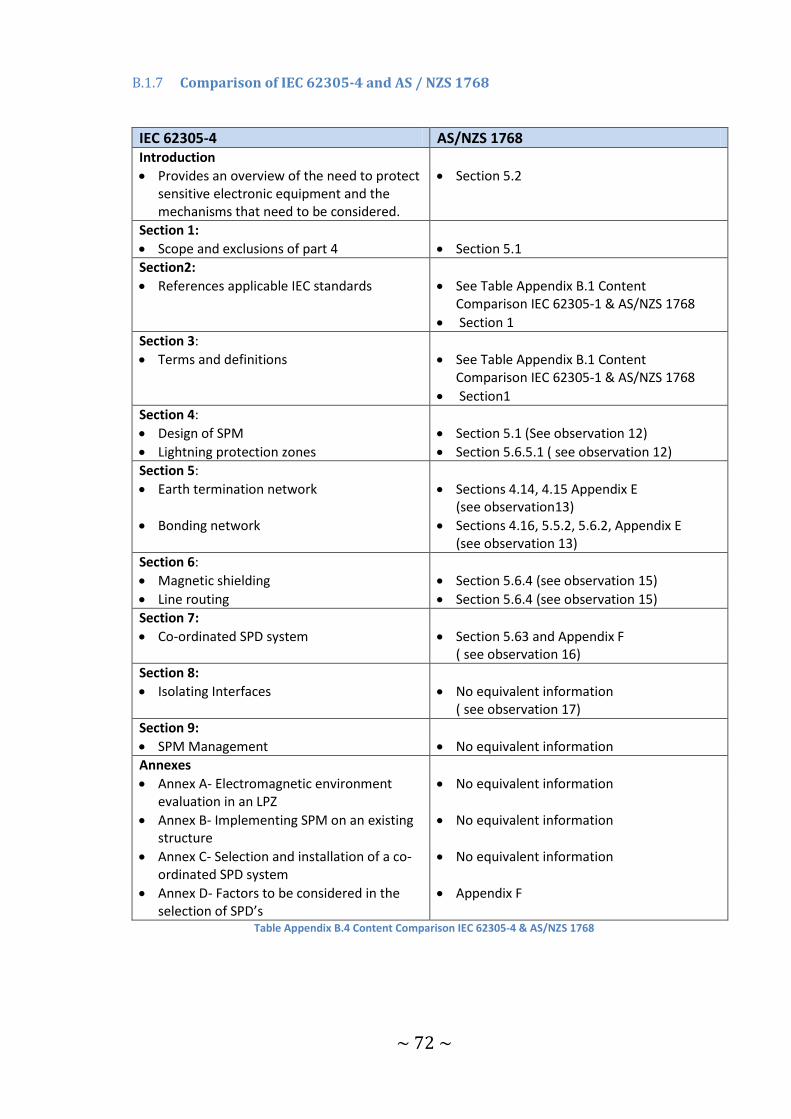
~ 72 ~
B.1.7 Comparison of IEC 62305-4 and AS / NZS 1768
IEC 62305-4 AS/NZS 1768 Introduction
Provides an overview of the need to protect sensitive electronic equipment and the mechanisms that need to be considered.
Section 5.2
Section 1:
Scope and exclusions of part 4 Section 5.1
Section2:
References applicable IEC standards See Table Appendix B.1 Content Comparison IEC 62305-1 & AS/NZS 1768
Section 1 Section 3:
Terms and definitions See Table Appendix B.1 Content Comparison IEC 62305-1 & AS/NZS 1768
Section1
Section 4:
Design of SPM Section 5.1 (See observation 12)
Lightning protection zones Section 5.6.5.1 ( see observation 12)
Section 5:
Earth termination network Sections 4.14, 4.15 Appendix E (see observation13)
Bonding network Sections 4.16, 5.5.2, 5.6.2, Appendix E (see observation 13)
Section 6:
Magnetic shielding Section 5.6.4 (see observation 15)
Line routing Section 5.6.4 (see observation 15)
Section 7:
Co-ordinated SPD system Section 5.63 and Appendix F ( see observation 16)
Section 8:
Isolating Interfaces No equivalent information ( see observation 17)
Section 9:
SPM Management No equivalent information
Annexes
Annex A- Electromagnetic environment evaluation in an LPZ
No equivalent information
Annex B- Implementing SPM on an existing structure
No equivalent information
Annex C- Selection and installation of a co-ordinated SPD system
No equivalent information
Annex D- Factors to be considered in the selection of SPD’s
Appendix F
Table Appendix B.4 Content Comparison IEC 62305-4 & AS/NZS 1768
~ 73 ~
B.1.8 Observations
12. IEC 62305-4 provides a structured approach to identify and define LPZ’s, the approach
provides a foundation for developing a structure approach to generating surge protection
measures (SPM’s).AS /NZS 1768 is not as structured in its approach, although section 5.6.5.1
describes a method that is equivalent to that used in IEC 62305-4 it is in to as structured and
does not lend itself to a coordinated SPM management plan.
13. IEC 62305-4 has dedicated sections on earthing and bonding, largely this is a duplication of
the information in IEC625305-3. Part 4 emphasises the benefits of reduced magnetic effects in
addition to the potential differences discussed in Part 3. This may be a function of the
structuring of the IEC standard rather than as need to create multiple systems. AS / NZS deals
with earthing and equipotential bonding as one topic, the example figures E1 to E5 all show
bonding connections to SPD’s, services and conductive elements as required in the IEC
standard. The Additionally the Australian standard gives little attention to spatial shielding,
therefore the benefits by utilising equipotential bonding to create spatial shielding is missed.
14. The AS/ NZS standard touched on most of the aspects covered in the IEC Design of SPM
section, however the components where communicated in the detail of various sections
making it difficult to put together without a high level of understanding of the topic an issues.
The IEC62305-4 structured approach to LPZ identification, SPM design and coordination was
more effective method to convey the required information.
15. Both standards have equivalent sections for magnetic shielding and line routing, however
utilising IEC 62305-4 as an information source would result in a better level of understanding.
The increased understanding is a result the approach used in section 5 and the extra
information conveyed in Annex A, B & C.
16. Both standards recommend surge protection coordination and provide information on how
this can be achieved. The AS / NZS standard provides extra information on surge protection
devices that enable a coordinated approach effectively, however the issues identified in
observations 13 & 15 mitigate some of the benefit achieved by this extra information.
17. IEC 62305-4 provides information on the use of isolating interfaces to remove potential
surges; this approach may take the form of isolating transformers for power circuits or linked
optical isolators for control / communication circuits. AS / NZS 1768 does not make mention
of this methodology.
~ 74 ~
B.1.9 Information gaps not identified by the one way IEC to AS / NZS Analysis
18. AS / NZS 1768 includes Section 3 “PRECAUTIONS FOR PERSONAL SAFETY” which provides
additional information on;
Need for personal protection
Personal conduct
o Outdoors
o Indoors
o In swimming pools
Effect on persons and treatment by lightning
19. AS / NZS 1768 includes Section 6 “PROTECTION OF MISCELLANEOUS STRUCTURES AND
PROPERTY” which provides additional information on;
Trees
Structures near trees
Chimneys
Metal guy wires and ropes
Mines ( above and below ground)
Boats
Boats with Masts
Fences (particularly in conjunction with animals)
Miscellaneous structures such as tents, scaffolding and travelling structures.
IEC 62305-1 specifically excludes ships but does not mention any of the other points
structures above.
~ 75 ~
Risk Assessment Process B.2Both standards utilise the same risk based approach to identify the need for lightning protection,
the process uses a structured approach to identify potential;
types of loss
types of damage
sources of damage
associated risk components
Table Appendix B.5displays the relationships between these components and demonstrates that
although the 2 standards use different risk component descriptions, the underlying process and
evaluation are the same.
Both standards require the applicable risk components for a structure are calculated, component,
the sum of the applicable risk components determine the associated category risk value.
For example;
The risk for loss of human life is RU + RA + RB + RV + RC + RM + RZ + RW
The risk for loss of human life by direct strike to a structure is RA + RB + RC
Each risk component is calculated by considering the number of events per annum, the
probability of damage to the structure and the consequence of the loss. This is achieved using
Equation 12 below.
Equation 12
Where
is the number of dangerous events per year
is the probability of damage to the structure
is the consequence of the loss
The number of dangerous events per year is affected by variables such as the ground flash density
of the area, the dimensions and surroundings of the structure, adjacent structures and connected
services.
The probability of damage to the structure is affected by the characteristics and protection
measures applied to the building and connected services.
The consequence of the loss is affected by the use of structure including the value and type of
normally present, the attendance of persons and the measures put in place to limit the
consequence of the loss I.E Automatic fire systems & escape routes.
( International Electrotechnical Commision 2012) (Standards Australia 2007)
~ 76 ~
Figure Appendix B.1 & Figure Appendix B.2 display the process flow diagrams need for lightning
protection risk assessment as provided in IEC 62305-2 and AS /NZS 1768, the diagrams re-enforce
the observation that the same process is used, the only difference of consequence is the IEC
process diagram includes a decision tree for “loss of economic value”. However as discussed in
B.1.4 the Australian leaves cost / benefit considerations to be conducted by the structures owner.
The flow diagrams essential display the iterative process of comparing the appropriate risk value
against a predefined tolerable risk value, if the calculate risk is lower than the tolerable risk no
additional measures are required. Conversely if the calculated risk is more than the tolerable risk,
the protection measures of the relevant risk components need to be reassessed and the risk
assessment calculation repeated.
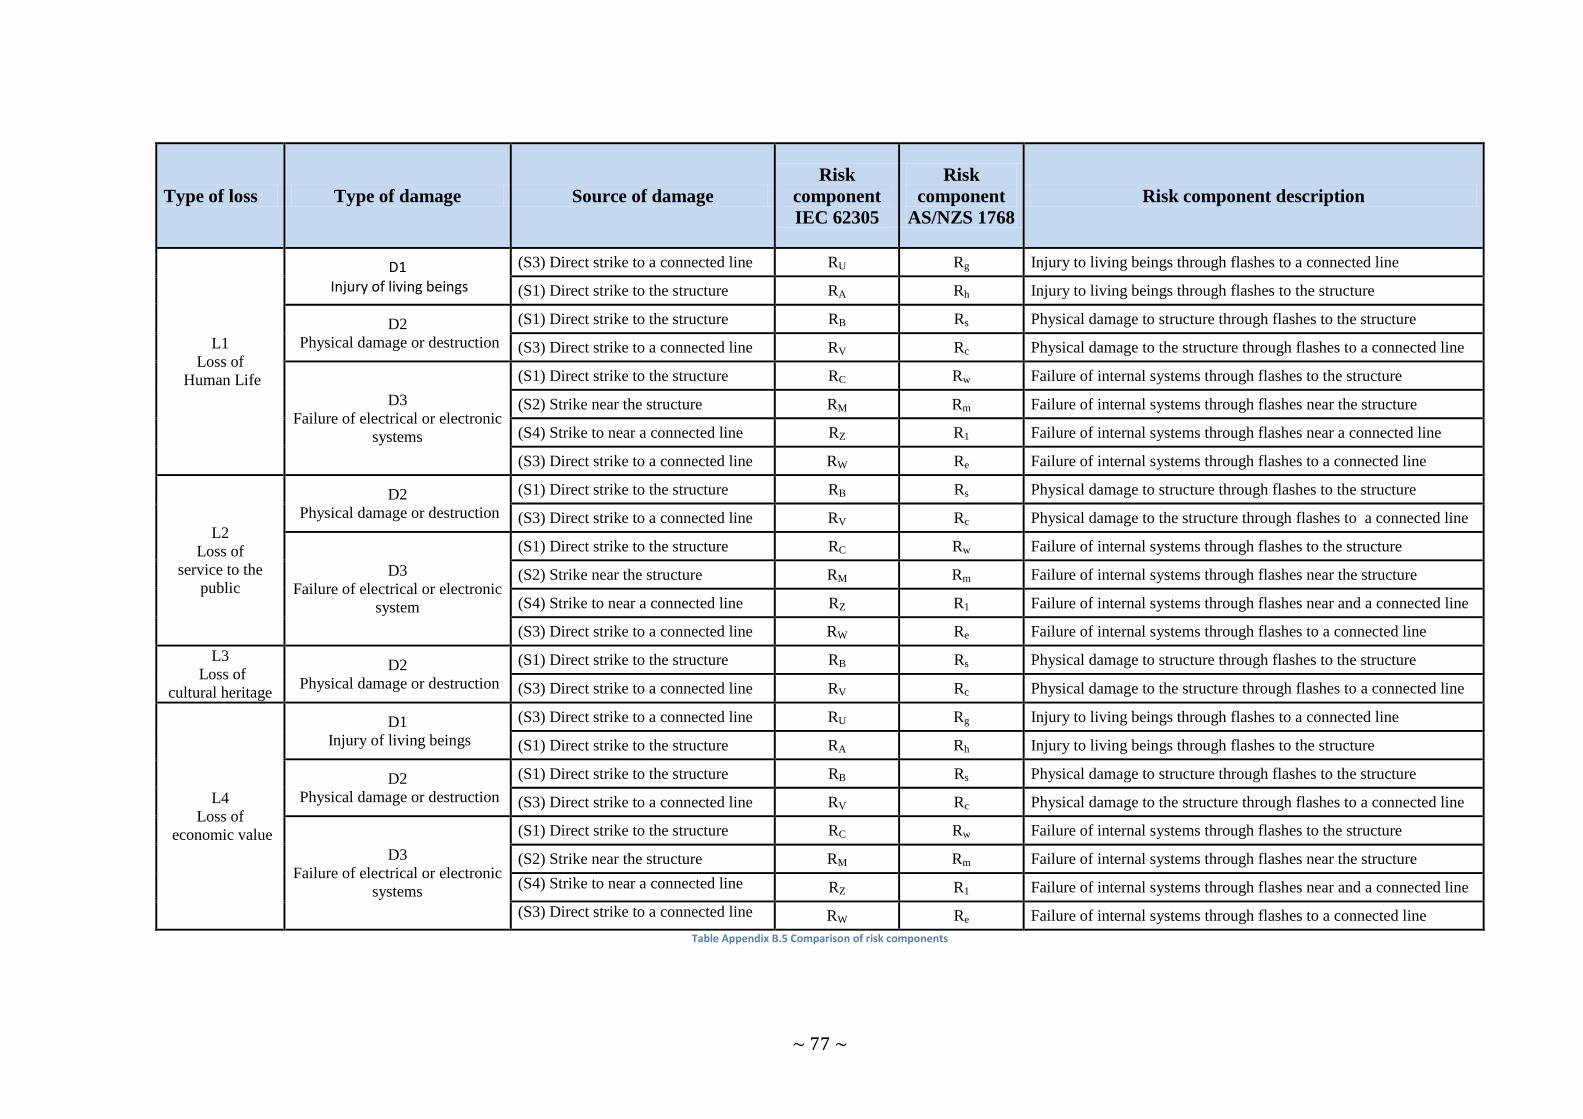
~ 77 ~
Type of loss Type of damage Source of damage
Risk
component
IEC 62305
Risk
component
AS/NZS 1768
Risk component description
L1
Loss of
Human Life
D1 Injury of living beings
(S3) Direct strike to a connected line RU Rg Injury to living beings through flashes to a connected line
(S1) Direct strike to the structure RA Rh Injury to living beings through flashes to the structure
D2
Physical damage or destruction
(S1) Direct strike to the structure RB Rs Physical damage to structure through flashes to the structure
(S3) Direct strike to a connected line RV Rc Physical damage to the structure through flashes to a connected line
D3
Failure of electrical or electronic
systems
(S1) Direct strike to the structure RC Rw Failure of internal systems through flashes to the structure
(S2) Strike near the structure RM Rm Failure of internal systems through flashes near the structure
(S4) Strike to near a connected line RZ R1 Failure of internal systems through flashes near a connected line
(S3) Direct strike to a connected line RW Re Failure of internal systems through flashes to a connected line
L2
Loss of
service to the
public
D2
Physical damage or destruction
(S1) Direct strike to the structure RB Rs Physical damage to structure through flashes to the structure
(S3) Direct strike to a connected line RV Rc Physical damage to the structure through flashes to a connected line
D3
Failure of electrical or electronic
system
(S1) Direct strike to the structure RC Rw Failure of internal systems through flashes to the structure
(S2) Strike near the structure RM Rm Failure of internal systems through flashes near the structure
(S4) Strike to near a connected line RZ R1 Failure of internal systems through flashes near and a connected line
(S3) Direct strike to a connected line RW Re Failure of internal systems through flashes to a connected line
L3
Loss of
cultural heritage
D2
Physical damage or destruction
(S1) Direct strike to the structure RB Rs Physical damage to structure through flashes to the structure
(S3) Direct strike to a connected line RV Rc Physical damage to the structure through flashes to a connected line
L4
Loss of
economic value
D1
Injury of living beings
(S3) Direct strike to a connected line RU Rg Injury to living beings through flashes to a connected line
(S1) Direct strike to the structure RA Rh Injury to living beings through flashes to the structure
D2
Physical damage or destruction
(S1) Direct strike to the structure RB Rs Physical damage to structure through flashes to the structure
(S3) Direct strike to a connected line RV Rc Physical damage to the structure through flashes to a connected line
D3
Failure of electrical or electronic
systems
(S1) Direct strike to the structure RC Rw Failure of internal systems through flashes to the structure
(S2) Strike near the structure RM Rm Failure of internal systems through flashes near the structure
(S4) Strike to near a connected line RZ R1 Failure of internal systems through flashes near and a connected line
(S3) Direct strike to a connected line RW Re Failure of internal systems through flashes to a connected line
Table Appendix B.5 Comparison of risk components
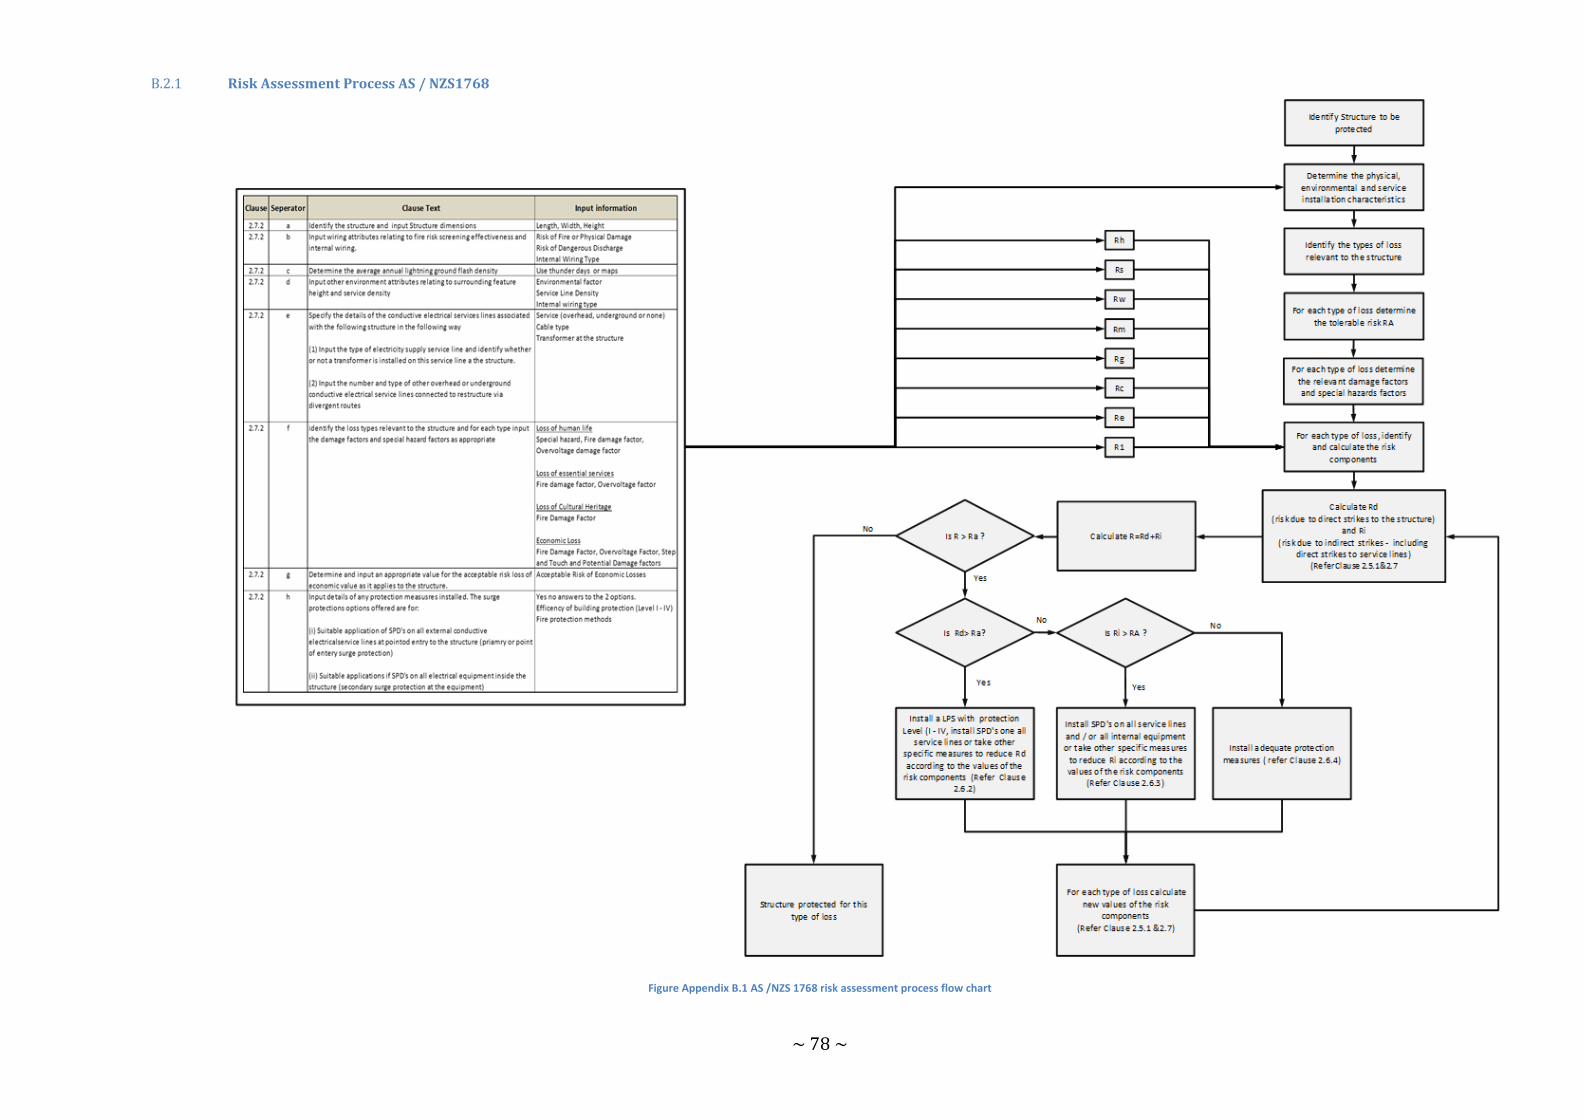
~ 78 ~
Risk Assessment Process AS / NZS1768 B.2.1
Figure Appendix B.1 AS /NZS 1768 risk assessment process flow chart
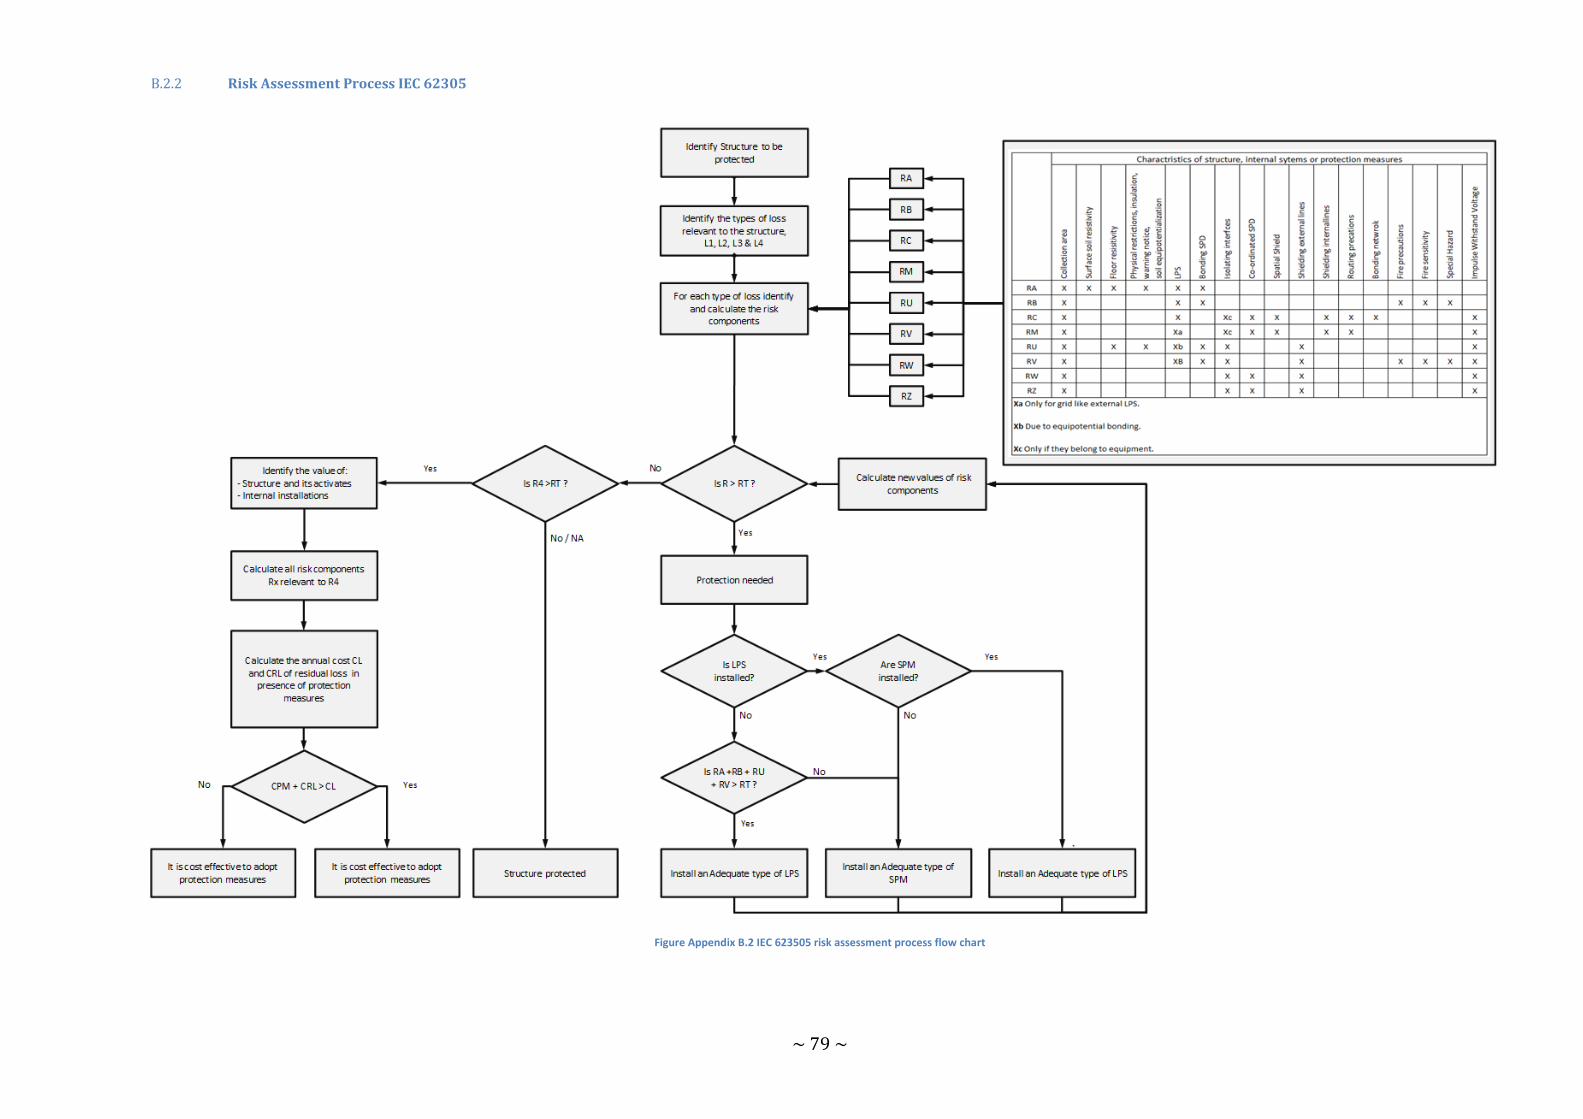
~ 79 ~
Risk Assessment Process IEC 62305 B.2.2
Figure Appendix B.2 IEC 623505 risk assessment process flow chart
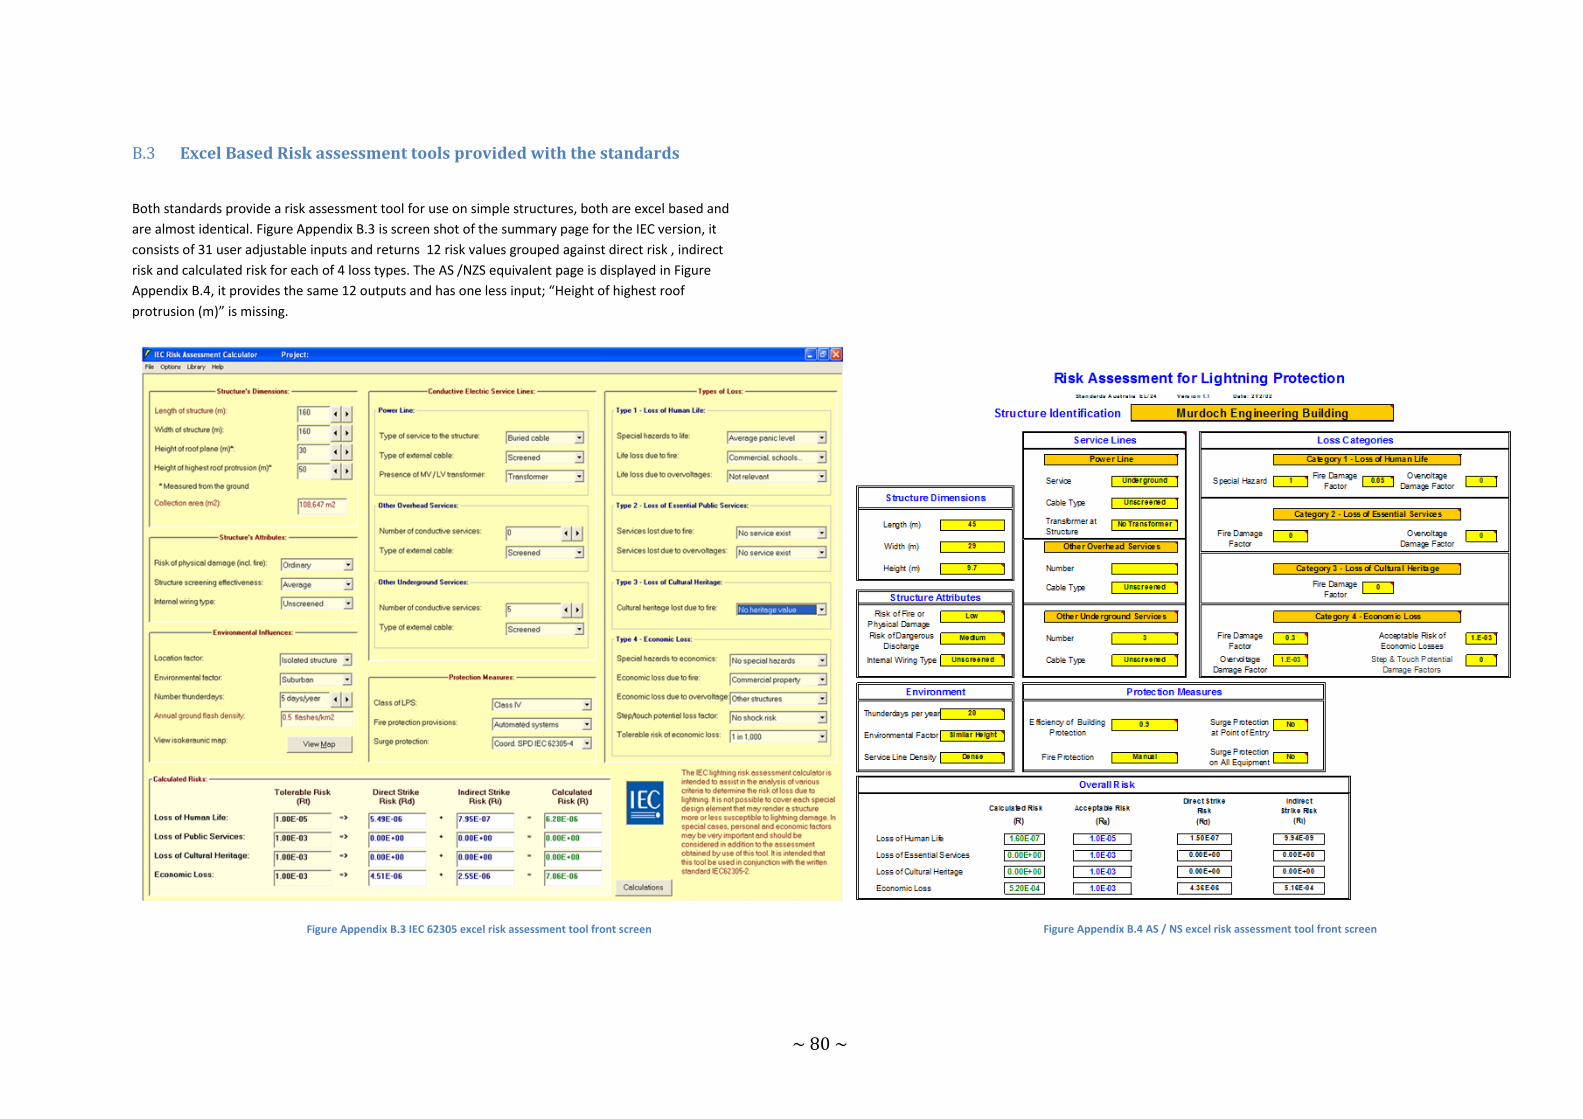
~ 80 ~
Excel Based Risk assessment tools provided with the standards B.3
Both standards provide a risk assessment tool for use on simple structures, both are excel based and
are almost identical. Figure Appendix B.3 is screen shot of the summary page for the IEC version, it
consists of 31 user adjustable inputs and returns 12 risk values grouped against direct risk , indirect
risk and calculated risk for each of 4 loss types. The AS /NZS equivalent page is displayed in Figure
Appendix B.4, it provides the same 12 outputs and has one less input; “Height of highest roof
protrusion (m)” is missing.
Figure Appendix B.3 IEC 62305 excel risk assessment tool front screen Figure Appendix B.4 AS / NS excel risk assessment tool front screen

~ 81 ~
The AS /NZS standard Introduction explain that the Australian standard is based on work
completed by IEC Committee TC 81 who develop the IEC 62305 standard and simplified for the
Australian situation. This is demonstrated in Figure Appendix B.5, which is a screen shot of the
input data and calculations page for the AS / NZS excel tool. The variables with the “(fixed)”
notation are simplifications that have been applied to the Australian version.
Figure Appendix B.5 AS / NZS Excel risk assessment tool data and calculations screen
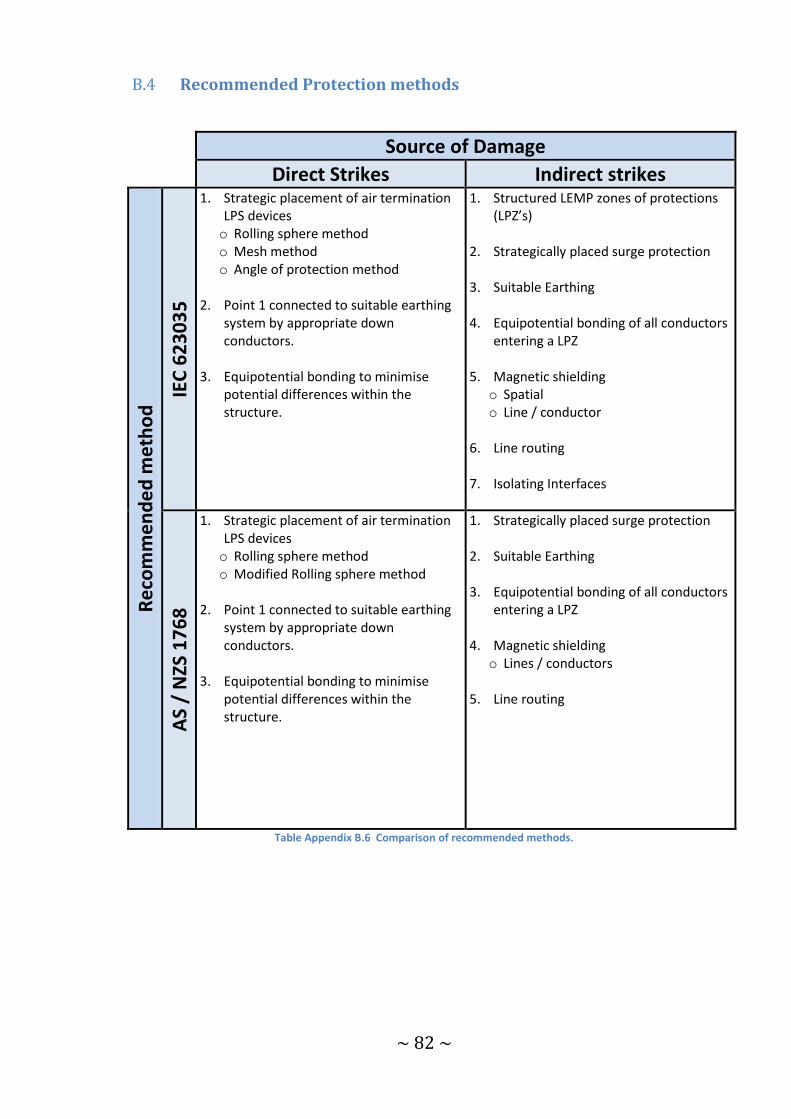
~ 82 ~
Recommended Protection methods B.4
Source of Damage Direct Strikes Indirect strikes
Re
com
me
nd
ed
me
tho
d IE
C 6
23
03
5
1. Strategic placement of air termination LPS devices o Rolling sphere method o Mesh method o Angle of protection method
2. Point 1 connected to suitable earthing
system by appropriate down conductors.
3. Equipotential bonding to minimise potential differences within the structure.
1. Structured LEMP zones of protections (LPZ’s)
2. Strategically placed surge protection
3. Suitable Earthing
4. Equipotential bonding of all conductors entering a LPZ
5. Magnetic shielding
o Spatial o Line / conductor
6. Line routing
7. Isolating Interfaces
AS
/ N
ZS 1
76
8
1. Strategic placement of air termination LPS devices o Rolling sphere method o Modified Rolling sphere method
2. Point 1 connected to suitable earthing
system by appropriate down conductors.
3. Equipotential bonding to minimise potential differences within the structure.
1. Strategically placed surge protection
2. Suitable Earthing
3. Equipotential bonding of all conductors entering a LPZ
4. Magnetic shielding
o Lines / conductors
5. Line routing
Table Appendix B.6 Comparison of recommended methods.
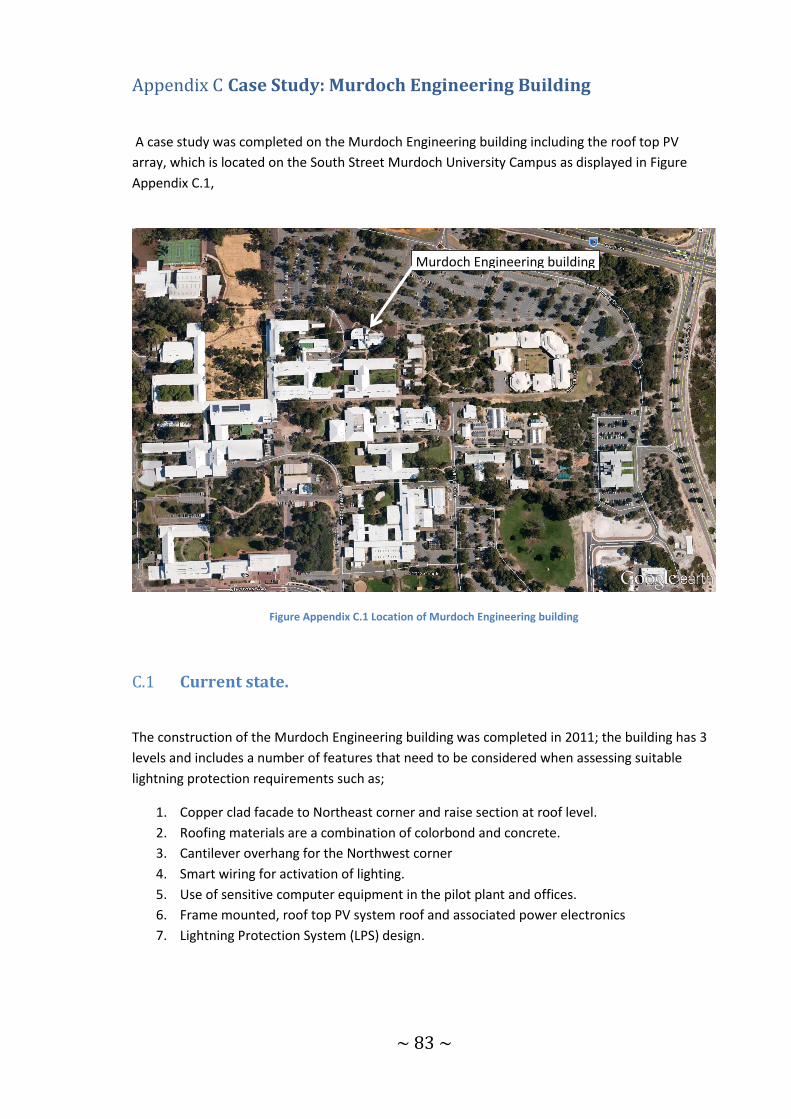
~ 83 ~
Case Study: Murdoch Engineering Building Appendix C
A case study was completed on the Murdoch Engineering building including the roof top PV
array, which is located on the South Street Murdoch University Campus as displayed in Figure
Appendix C.1,
Figure Appendix C.1 Location of Murdoch Engineering building
Current state. C.1
The construction of the Murdoch Engineering building was completed in 2011; the building has 3
levels and includes a number of features that need to be considered when assessing suitable
lightning protection requirements such as;
1. Copper clad facade to Northeast corner and raise section at roof level.
2. Roofing materials are a combination of colorbond and concrete.
3. Cantilever overhang for the Northwest corner
4. Smart wiring for activation of lighting.
5. Use of sensitive computer equipment in the pilot plant and offices.
6. Frame mounted, roof top PV system roof and associated power electronics
7. Lightning Protection System (LPS) design.
Murdoch Engineering building
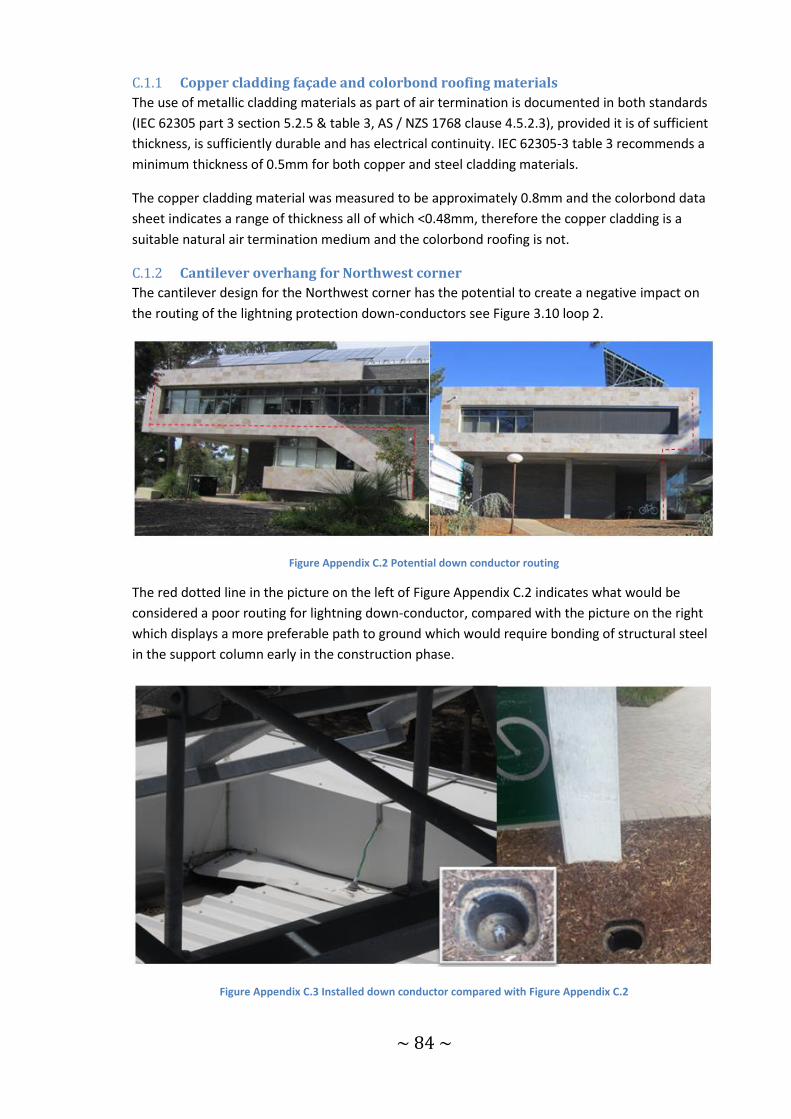
~ 84 ~
C.1.1 Copper cladding façade and colorbond roofing materials
The use of metallic cladding materials as part of air termination is documented in both standards
(IEC 62305 part 3 section 5.2.5 & table 3, AS / NZS 1768 clause 4.5.2.3), provided it is of sufficient
thickness, is sufficiently durable and has electrical continuity. IEC 62305-3 table 3 recommends a
minimum thickness of 0.5mm for both copper and steel cladding materials.
The copper cladding material was measured to be approximately 0.8mm and the colorbond data
sheet indicates a range of thickness all of which <0.48mm, therefore the copper cladding is a
suitable natural air termination medium and the colorbond roofing is not.
C.1.2 Cantilever overhang for Northwest corner
The cantilever design for the Northwest corner has the potential to create a negative impact on
the routing of the lightning protection down-conductors see Figure 3.10 loop 2.
Figure Appendix C.2 Potential down conductor routing
The red dotted line in the picture on the left of Figure Appendix C.2 indicates what would be
considered a poor routing for lightning down-conductor, compared with the picture on the right
which displays a more preferable path to ground which would require bonding of structural steel
in the support column early in the construction phase.
Figure Appendix C.3 Installed down conductor compared with Figure Appendix C.2
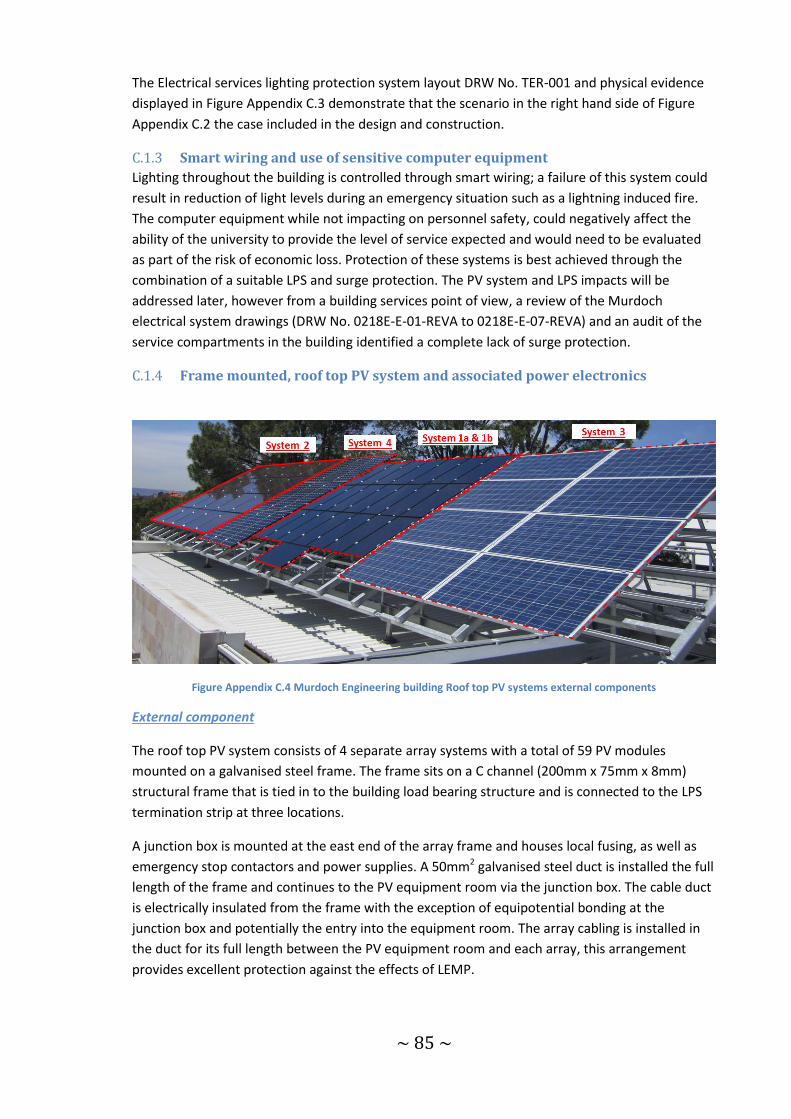
~ 85 ~
The Electrical services lighting protection system layout DRW No. TER-001 and physical evidence
displayed in Figure Appendix C.3 demonstrate that the scenario in the right hand side of Figure
Appendix C.2 the case included in the design and construction.
C.1.3 Smart wiring and use of sensitive computer equipment
Lighting throughout the building is controlled through smart wiring; a failure of this system could
result in reduction of light levels during an emergency situation such as a lightning induced fire.
The computer equipment while not impacting on personnel safety, could negatively affect the
ability of the university to provide the level of service expected and would need to be evaluated
as part of the risk of economic loss. Protection of these systems is best achieved through the
combination of a suitable LPS and surge protection. The PV system and LPS impacts will be
addressed later, however from a building services point of view, a review of the Murdoch
electrical system drawings (DRW No. 0218E-E-01-REVA to 0218E-E-07-REVA) and an audit of the
service compartments in the building identified a complete lack of surge protection.
C.1.4 Frame mounted, roof top PV system and associated power electronics
Figure Appendix C.4 Murdoch Engineering building Roof top PV systems external components
External component
The roof top PV system consists of 4 separate array systems with a total of 59 PV modules
mounted on a galvanised steel frame. The frame sits on a C channel (200mm x 75mm x 8mm)
structural frame that is tied in to the building load bearing structure and is connected to the LPS
termination strip at three locations.
A junction box is mounted at the east end of the array frame and houses local fusing, as well as
emergency stop contactors and power supplies. A 50mm2 galvanised steel duct is installed the full
length of the frame and continues to the PV equipment room via the junction box. The cable duct
is electrically insulated from the frame with the exception of equipotential bonding at the
junction box and potentially the entry into the equipment room. The array cabling is installed in
the duct for its full length between the PV equipment room and each array, this arrangement
provides excellent protection against the effects of LEMP.
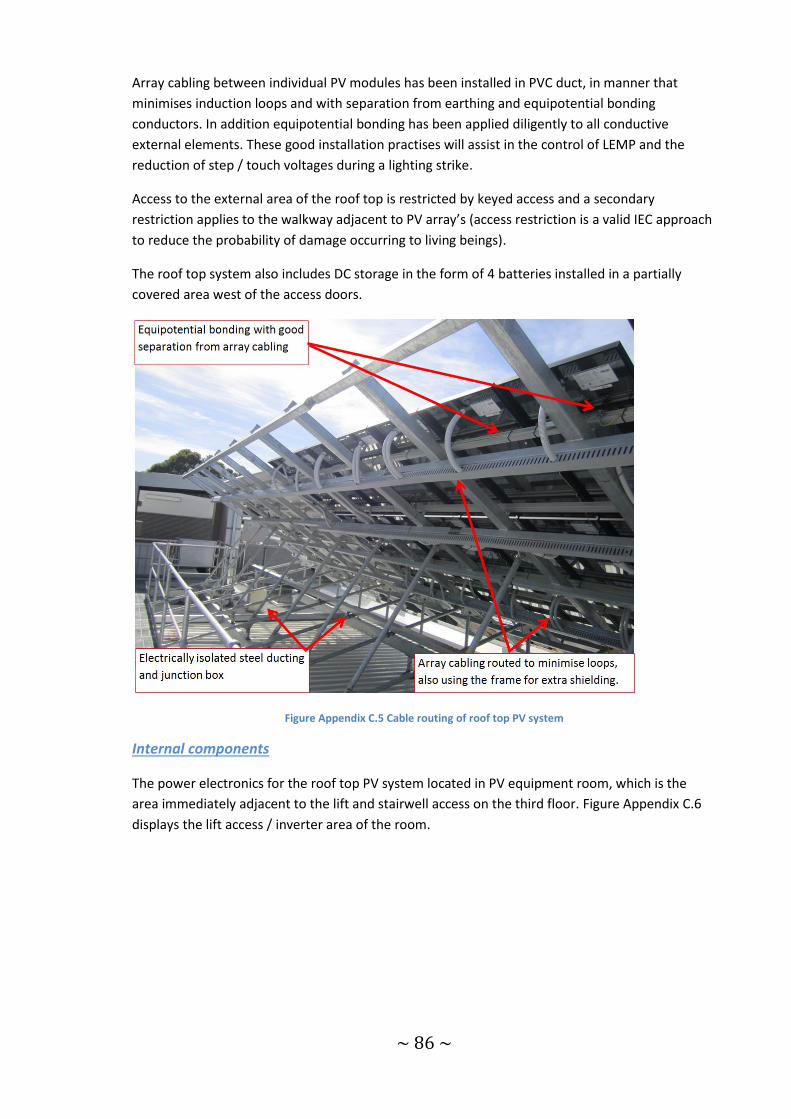
~ 86 ~
Array cabling between individual PV modules has been installed in PVC duct, in manner that
minimises induction loops and with separation from earthing and equipotential bonding
conductors. In addition equipotential bonding has been applied diligently to all conductive
external elements. These good installation practises will assist in the control of LEMP and the
reduction of step / touch voltages during a lighting strike.
Access to the external area of the roof top is restricted by keyed access and a secondary
restriction applies to the walkway adjacent to PV array’s (access restriction is a valid IEC approach
to reduce the probability of damage occurring to living beings).
The roof top system also includes DC storage in the form of 4 batteries installed in a partially
covered area west of the access doors.
Figure Appendix C.5 Cable routing of roof top PV system
Internal components
The power electronics for the roof top PV system located in PV equipment room, which is the
area immediately adjacent to the lift and stairwell access on the third floor. Figure Appendix C.6
displays the lift access / inverter area of the room.
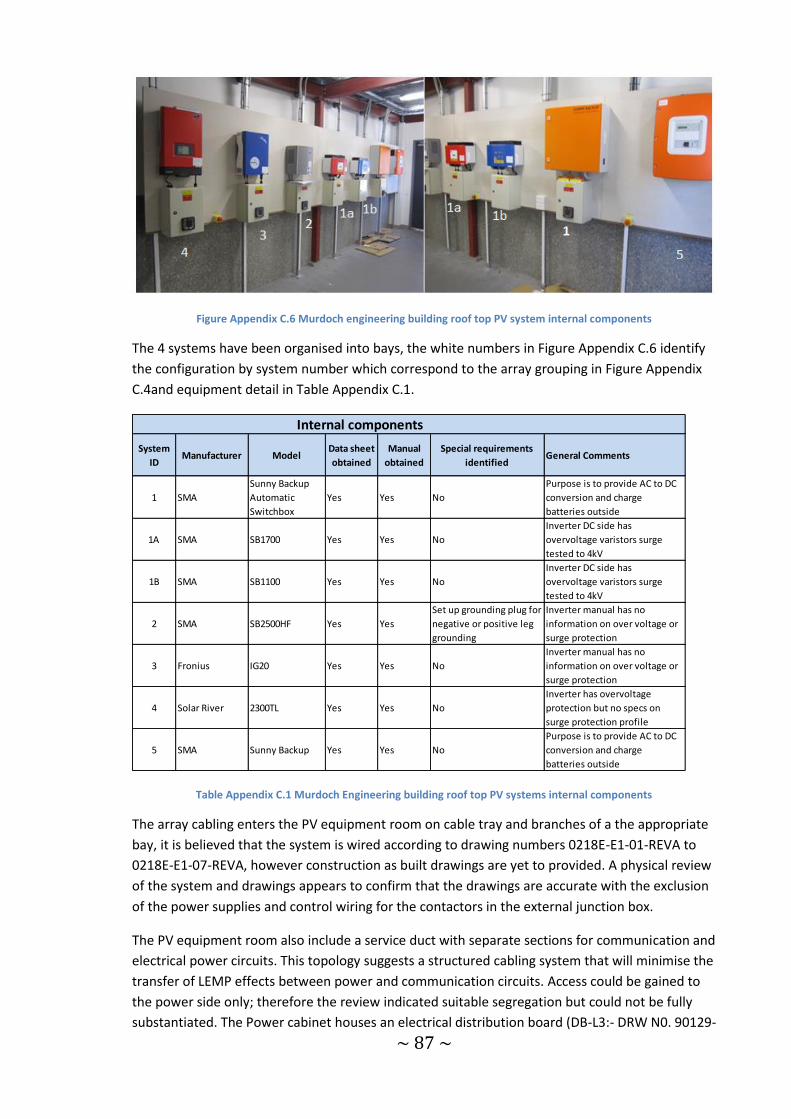
~ 87 ~
Figure Appendix C.6 Murdoch engineering building roof top PV system internal components
The 4 systems have been organised into bays, the white numbers in Figure Appendix C.6 identify
the configuration by system number which correspond to the array grouping in Figure Appendix
C.4and equipment detail in Table Appendix C.1.
Table Appendix C.1 Murdoch Engineering building roof top PV systems internal components
The array cabling enters the PV equipment room on cable tray and branches of a the appropriate
bay, it is believed that the system is wired according to drawing numbers 0218E-E1-01-REVA to
0218E-E1-07-REVA, however construction as built drawings are yet to provided. A physical review
of the system and drawings appears to confirm that the drawings are accurate with the exclusion
of the power supplies and control wiring for the contactors in the external junction box.
The PV equipment room also include a service duct with separate sections for communication and
electrical power circuits. This topology suggests a structured cabling system that will minimise the
transfer of LEMP effects between power and communication circuits. Access could be gained to
the power side only; therefore the review indicated suitable segregation but could not be fully
substantiated. The Power cabinet houses an electrical distribution board (DB-L3:- DRW N0. 90129-
System
IDManufacturer Model
Data sheet
obtained
Manual
obtained
Special requirements
identifiedGeneral Comments
1 SMA
Sunny Backup
Automatic
Switchbox
Yes Yes No
Purpose is to provide AC to DC
conversion and charge
batteries outside
1A SMA SB1700 Yes Yes No
Inverter DC side has
overvoltage varistors surge
tested to 4kV
1B SMA SB1100 Yes Yes No
Inverter DC side has
overvoltage varistors surge
tested to 4kV
2 SMA SB2500HF Yes Yes
Set up grounding plug for
negative or positive leg
grounding
Inverter manual has no
information on over voltage or
surge protection
3 Fronius IG20 Yes Yes No
Inverter manual has no
information on over voltage or
surge protection
4 Solar River 2300TL Yes Yes No
Inverter has overvoltage
protection but no specs on
surge protection profile
5 SMA Sunny Backup Yes Yes No
Purpose is to provide AC to DC
conversion and charge
batteries outside
Internal components
~ 88 ~
E09 Single line diagrams) as the source of supply for all circuits on the 3rd level including the roof
area. The roof top PV system is connected to DB-L3 via the “Solar control cabinet: - SE.01 DRW
No. 0218E-E-02” which is also located in the electrical power side of the service duct. The control
cabinet provides marshalling for the PV system AC power circuits, emergency stop contactors and
power monitoring for the display units mounted on the tan boxes in Figure Appendix C.6 system.
A review of the drawings, equipment manuals and all PV system electrical cabinets indicated a
complete absence of surge protection suitable for a lighting related LEMP event.
C.1.5 Lightning Protection System (LPS) design
The design and construction for the Murdoch Engineering building included a lightning protection
system; this has been documented on DRW No. TER-001 “Electrical Services lightning protection
system layout.”, Figure Appendix C.9 displays an extract from the drawing which has been
adapted to show the PV cells, frame, walkway and horizontal conductor. Additionally the drawing
includes the following notes;
1. The lightning protection system has been installed to comply with the requirements of AS1768-2007.
2. Materials used throughout the system comply with Section 4.7 of AS1768. Dimensions shall be in accordance with Table 4.6 of AS1768. Fixings, joints and bends shall comply with Section 4.9 and 4.10 of AS1768.
3. The air termination system combines 25x3mm gr316 stainless strap horizontal conductor with structural metal roof elements to provide a complete ‘zone of protection’ for the roof area (refer to as built drawing TER-001 Rev 2 for layout details).
4. All exposed and isolated metallic objects at roof levels including copper facade walls, metallic screens and rails, roofing steel, ladders, etc. are bonded to the air termination system.
5. All roofing penetrations are made waterproof using weatherproofing membrane, Dektites and roofing silicon.
6. The steel reinforcing within in-situ concrete columns, lift shafts and stair wells, plus 35mm sq. copper cable serve as the down conductor network.
7. The down conductor network is connected to the air termination system and roofing steelwork by IB35/10 welded connections at various across the roof levels.
8. A combination of building foundations and 6m x 15mm diameter stainless steel grade 304 earth electrodes are utilised as the earthing system. Electrodes are protected by a lockable HD PVC pit, finished to surrounding floor/ground/garden levels.
9. The resistance to earth of the complete lightning protection system when isolated from other earths is less than 10 ohms (as per AS1768-2007) – refer to the Final Earth Test report for details of testing).
10. At ground level metal based incoming services to the building eg. water mains, fire services and electrical earthing system are equipotential bonded by 35mm2 PVC cable to the nearest point of the lightning protection system.
11. All parts of the lightning protection system are installed in discrete or concealed positions using conduits, cavities, expansion joints, etc. where practical.
~ 89 ~
The results of a lightning protection assessment conducted by “Tercel” an Australian lightning
protection and earthing company in April 2013 reported (Tercel 23/04/2013);
A reinforcement of drawing notes 1, 3,4, 6, 7 & 8
“The new solar panels and walkway (behind) have recently been bonded directly to the
horizontal conductor to ensure electrical continuity across the array of panels.”
Earth testing was completed using an AMEC CA 6470-B Multifunction earth tester, to
complete a three pin fall of potential as outlined in appendix C AS / NZS 1768/2007. The
test was conducted at 2 points on the horizontal conductor the following readings were
obtained;
o Grid reference B/5=7.24Ω
o Gris reference B/9=7.56Ω
Based on the bullet points above the report concluded “In overall terms the recently installed
lightning protection system is considered to be in good working order and compliant with AS
1768-2007 recommendations”.
Although the Tercel report identifies that the installed LPS system provides a full zone of
protection, Figure Appendix C.8 identifies that the majority of the PV arrays are outside of any
zone of protection provided by the horizontal lightning termination strip or the natural conductive
components of the building.
However the solar panel frame has the potential to be a suitable candidate to provide a full zone
of protection for the roof and arrays. The need for additional actions that address short comings
in the lightning protection system are discussed in Section 8.3 and include reference to the results
of the risk assessment tools.
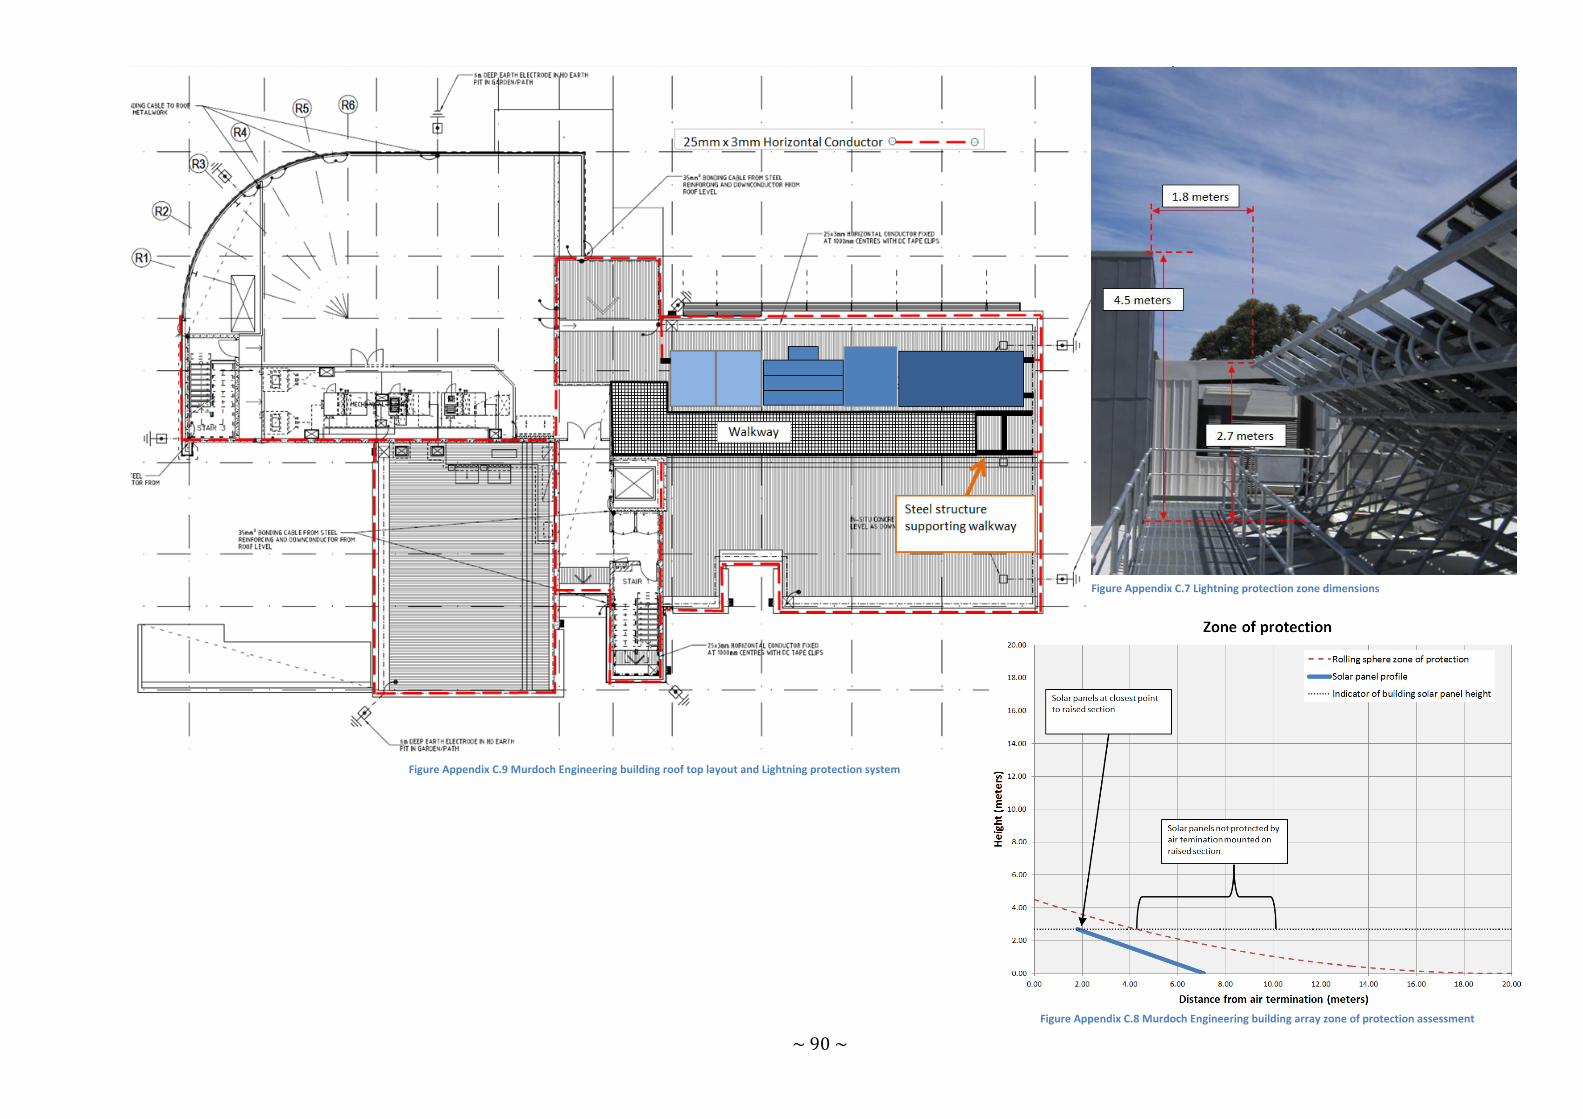
~ 90 ~
Figure Appendix C.9 Murdoch Engineering building roof top layout and Lightning protection system
Figure Appendix C.7 Lightning protection zone dimensions
Figure Appendix C.8 Murdoch Engineering building array zone of protection assessment
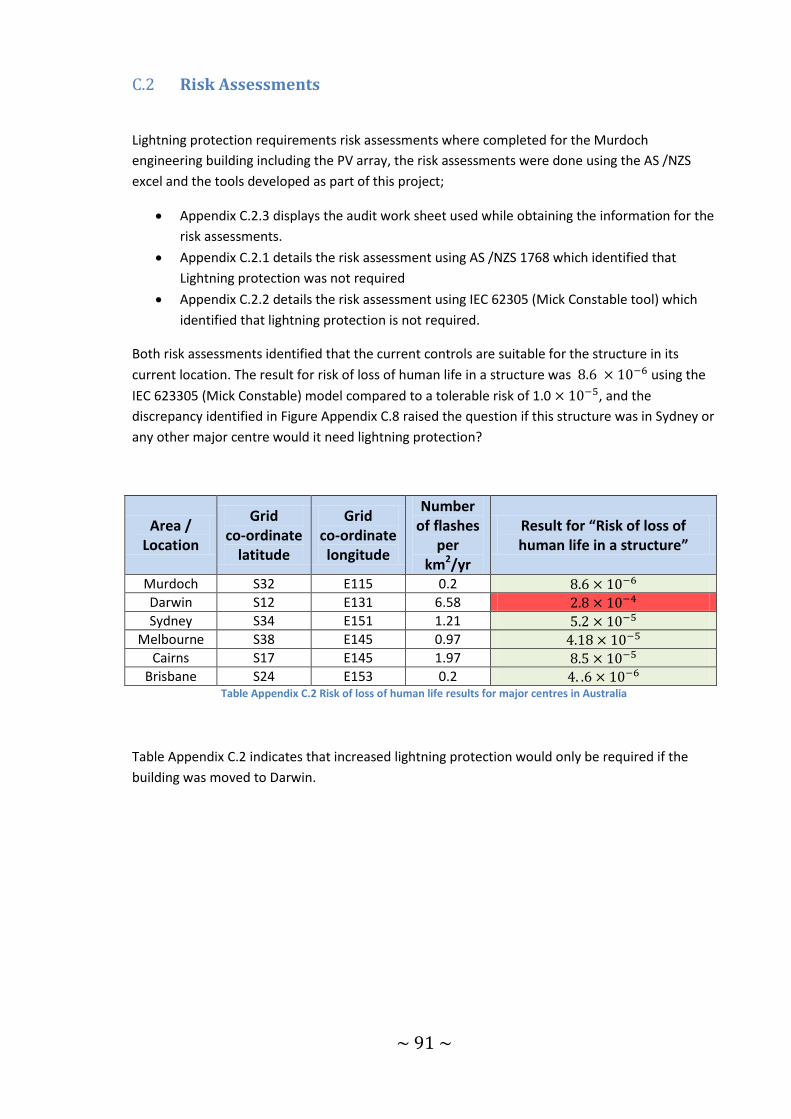
~ 91 ~
Risk Assessments C.2
Lightning protection requirements risk assessments where completed for the Murdoch
engineering building including the PV array, the risk assessments were done using the AS /NZS
excel and the tools developed as part of this project;
Appendix C.2.3 displays the audit work sheet used while obtaining the information for the
risk assessments.
Appendix C.2.1 details the risk assessment using AS /NZS 1768 which identified that
Lightning protection was not required
Appendix C.2.2 details the risk assessment using IEC 62305 (Mick Constable tool) which
identified that lightning protection is not required.
Both risk assessments identified that the current controls are suitable for the structure in its
current location. The result for risk of loss of human life in a structure was 8 using the
IEC 623305 (Mick Constable) model compared to a tolerable risk of 1.0 , and the
discrepancy identified in Figure Appendix C.8 raised the question if this structure was in Sydney or
any other major centre would it need lightning protection?
Area / Location
Grid co-ordinate
latitude
Grid co-ordinate longitude
Number of flashes
per km2/yr
Result for “Risk of loss of human life in a structure”
Murdoch S32 E115 0.2 8 Darwin S12 E131 6.58 8 Sydney S34 E151 1.21
Melbourne S38 E145 0.97 4 8 Cairns S17 E145 1.97 8
Brisbane S24 E153 0.2 4 Table Appendix C.2 Risk of loss of human life results for major centres in Australia
Table Appendix C.2 indicates that increased lightning protection would only be required if the
building was moved to Darwin.
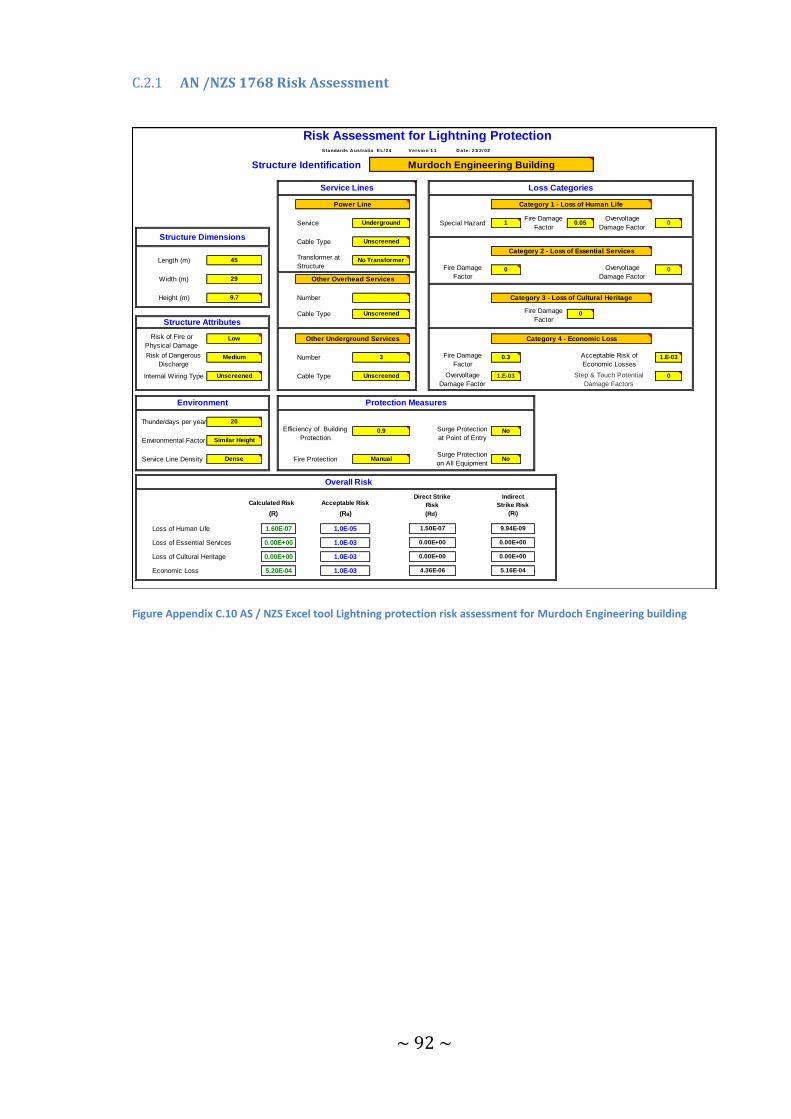
~ 92 ~
C.2.1 AN /NZS 1768 Risk Assessment
Figure Appendix C.10 AS / NZS Excel tool Lightning protection risk assessment for Murdoch Engineering building
Standards A ustralia EL/ 24 Versio n 1.1 D ate: 21/ 2/ 02
(R) (Ra) (Rd)
Structure DimensionsCable Type
Other Underground Services
Unscreened
No Transformer
Number
Cable Type
Fire Protection
0
1.E-03
Risk Assessment for Lightning Protection
Other Overhead Services
Low
45
29
9.7
Category 4 - Economic Loss
Height (m)
NoSurge Protection
at Point of Entry
Fire Damage
Factor
Fire Damage
Factor
Overvoltage
Damage Factor
1.E-03
0
Unscreened
3Medium
Unscreened
Length (m)
Width (m)
Structure Attributes
Risk of Fire or
Physical Damage
0.3
Category 3 - Loss of Cultural Heritage
Fire Damage
Factor
No
Transformer at
Structure
Murdoch Engineering BuildingStructure Identification
0
Acceptable Risk of
Economic Losses
Step & Touch Potential
Damage Factors
0Fire Damage
FactorSpecial HazardService
Number
Cable Type
Category 2 - Loss of Essential Services
Overvoltage
Damage Factor
Overvoltage
Damage Factor
0.051
Service Lines
Power Line Category 1 - Loss of Human Life
Underground
Loss Categories
0
Surge Protection
on All Equipment
Unscreened
Economic Loss
1.0E-03
1.0E-03
Calculated Risk
0.00E+00
5.20E-04 1.0E-03
Dense
0.9
ManualService Line Density
Environmental Factor
Risk of Dangerous
Discharge
Internal Wiring Type
Efficiency of Building
Protection
20
Similar Height
Environment Protection Measures
5.16E-04
Thunderdays per year
Loss of Cultural Heritage
Acceptable Risk
1.0E-05
4.36E-06
Overall Risk
Loss of Human Life
Loss of Essential Services 0.00E+00
1.60E-07
0.00E+00
Indirect
Strike Risk
(Ri)
9.94E-09
0.00E+00
1.50E-07
0.00E+00
0.00E+00
Direct Strike
Risk
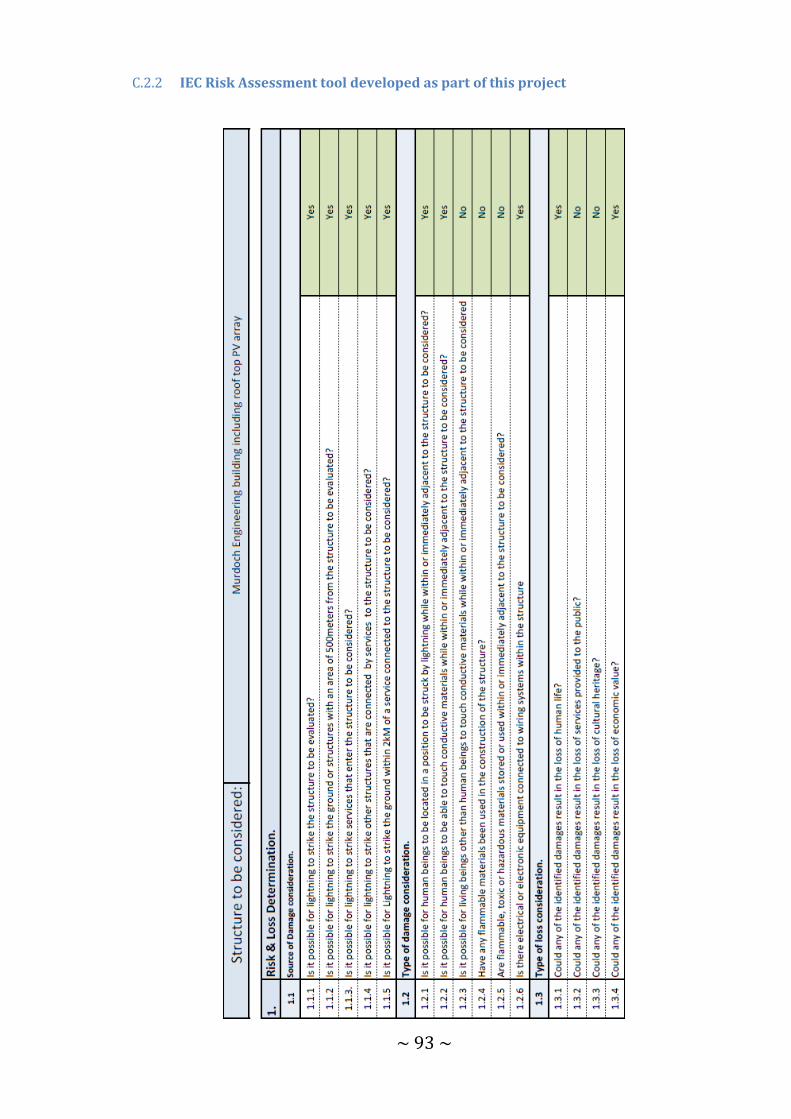
~ 93 ~
C.2.2 IEC Risk Assessment tool developed as part of this project
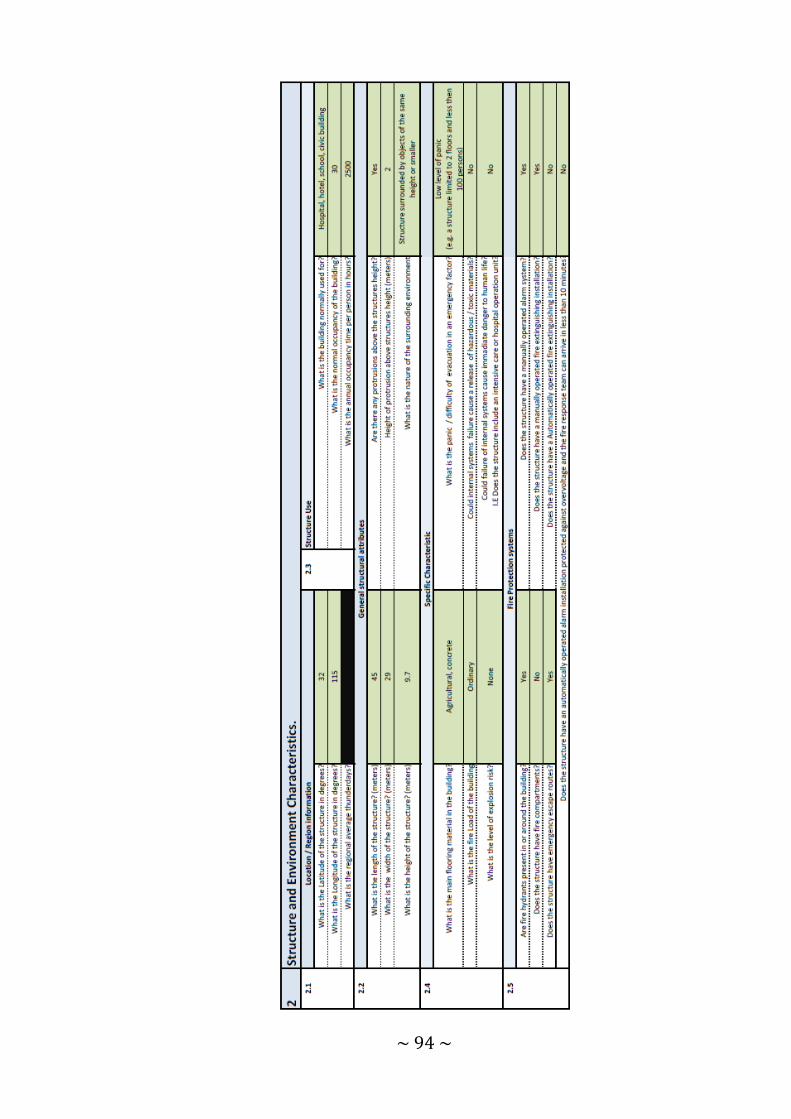
~ 94 ~
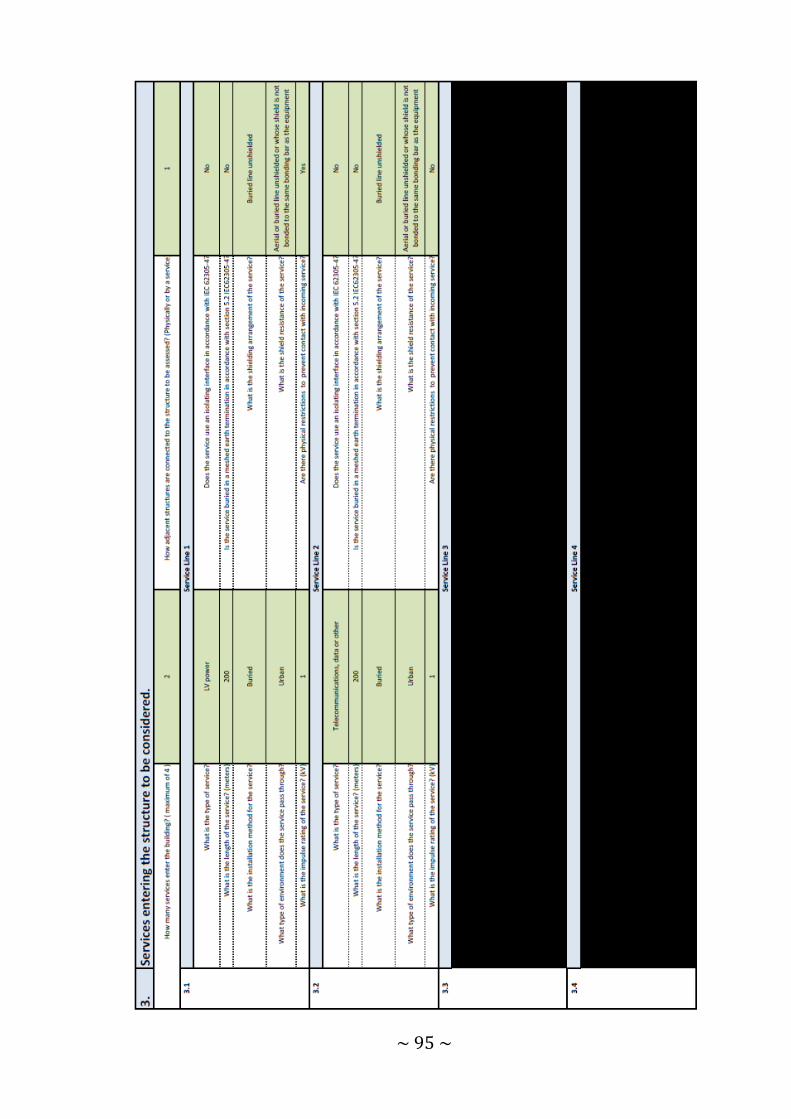
~ 95 ~
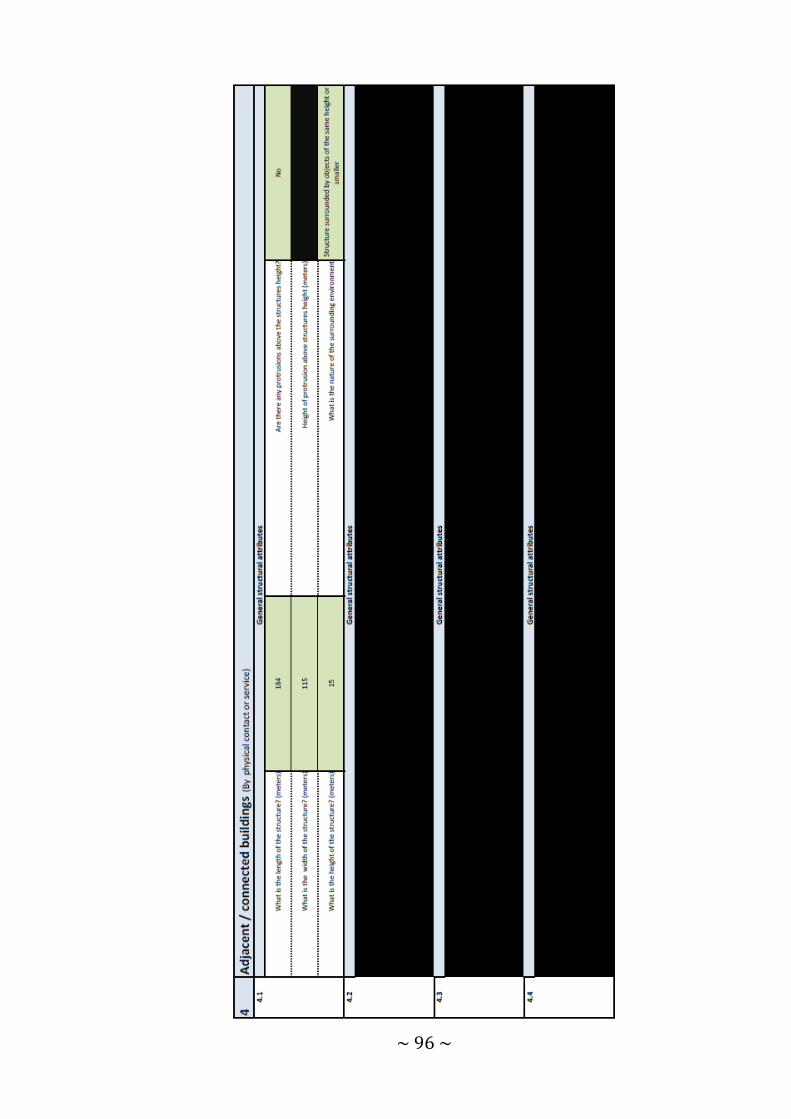
~ 96 ~
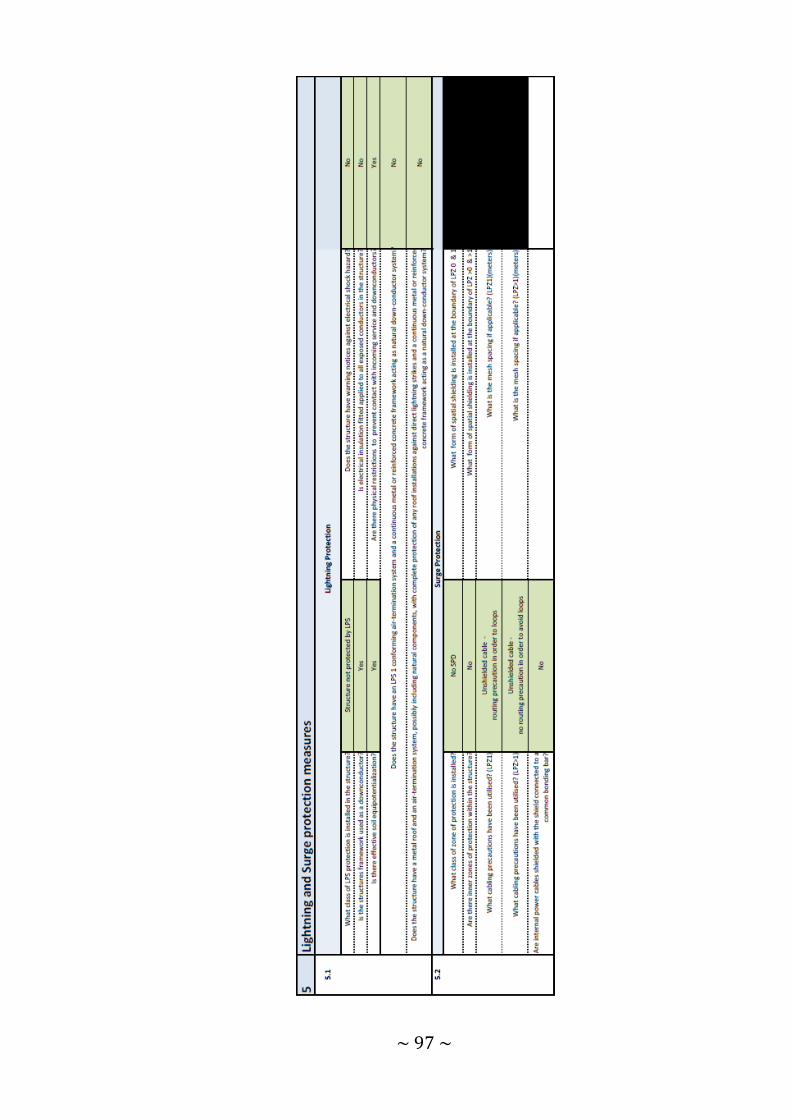
~ 97 ~
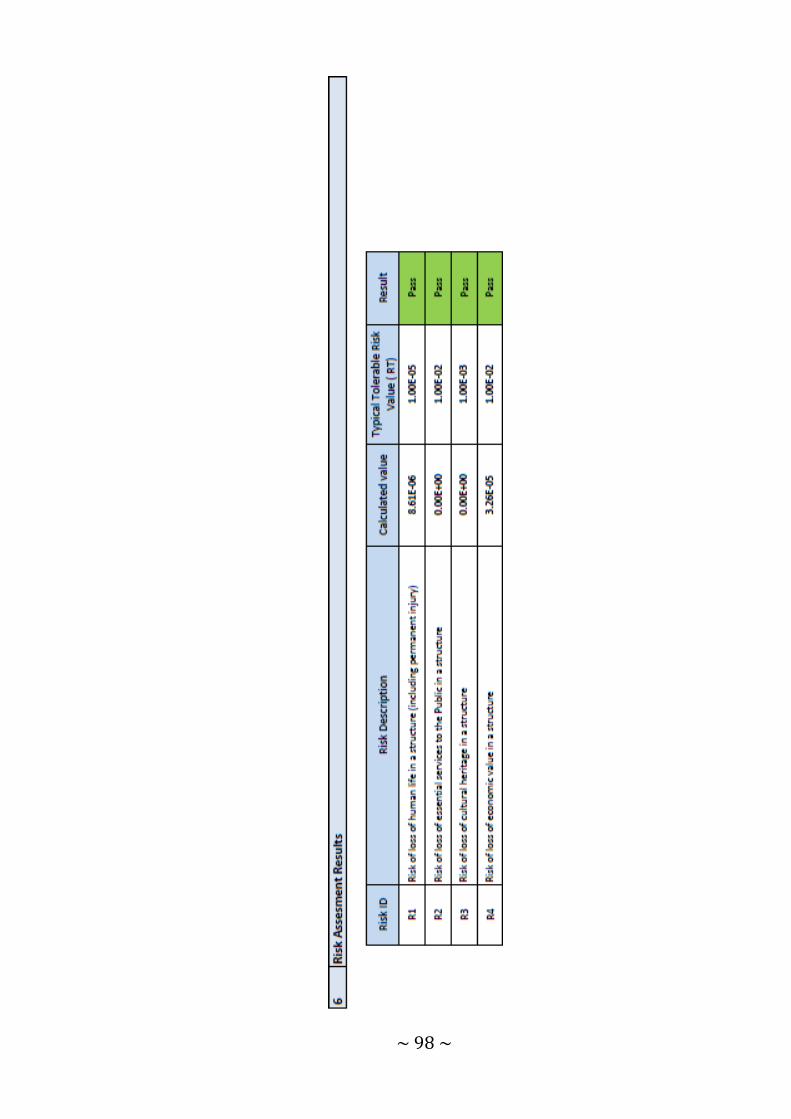
~ 98 ~
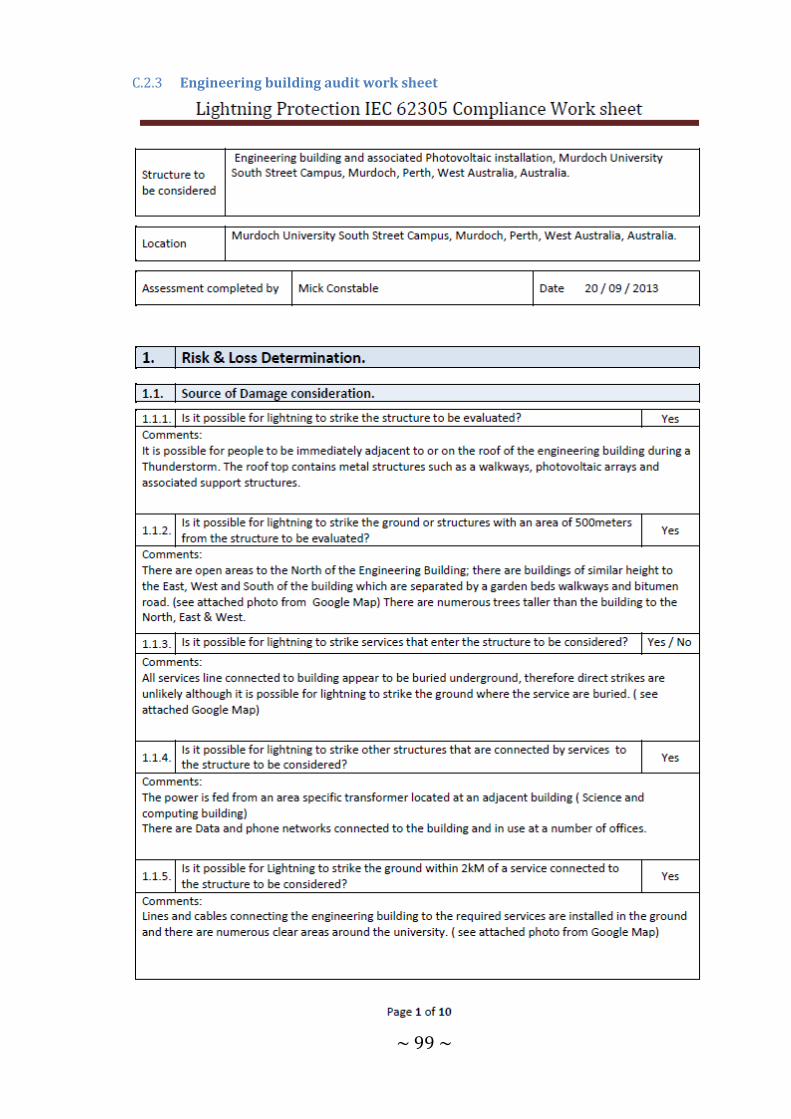
~ 99 ~
C.2.3 Engineering building audit work sheet
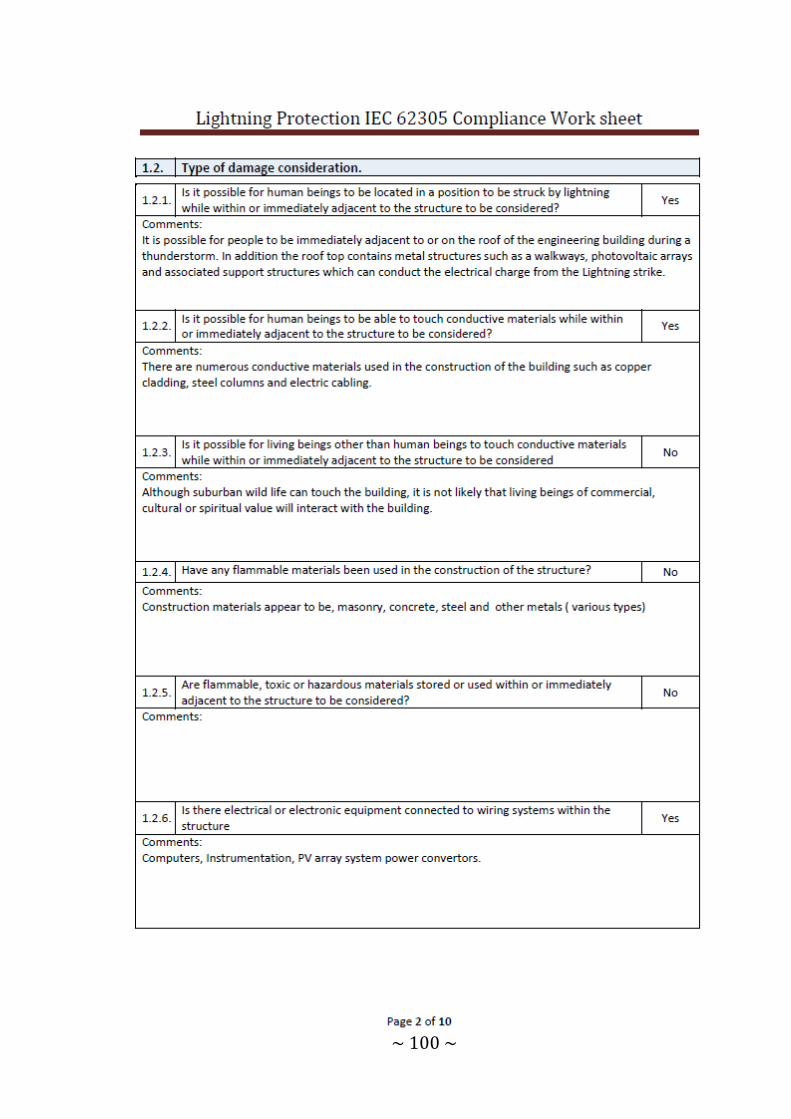
~ 100 ~
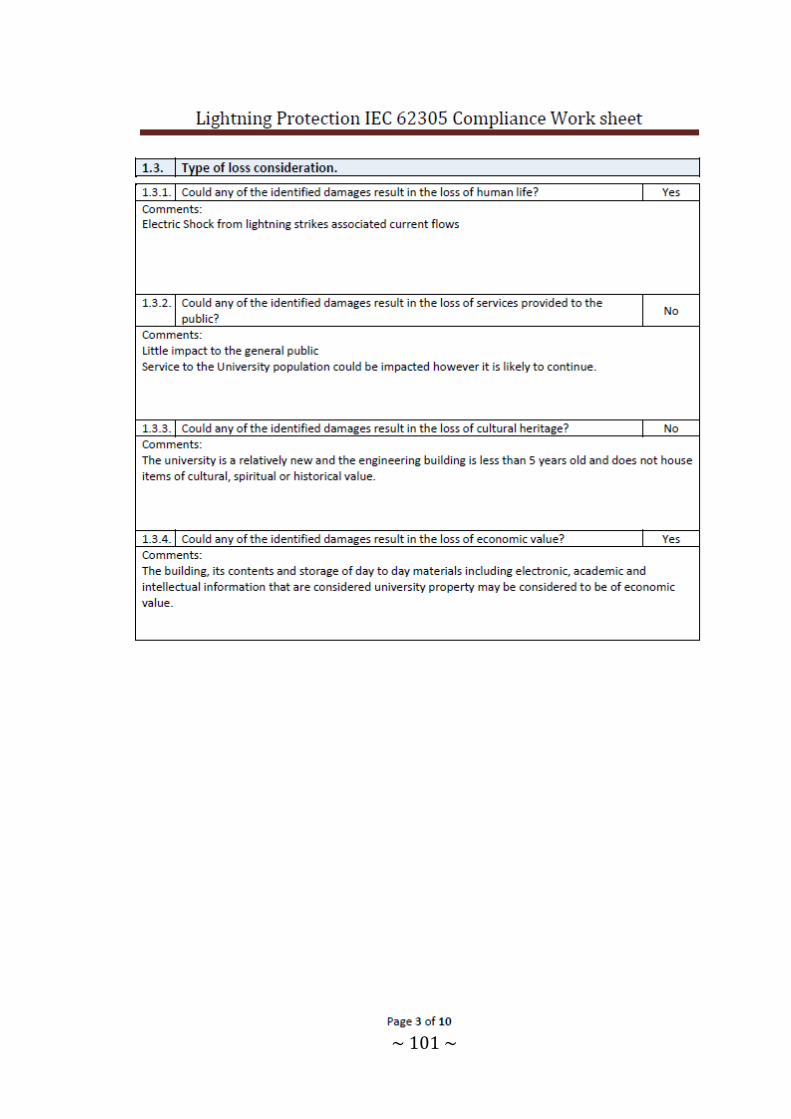
~ 101 ~
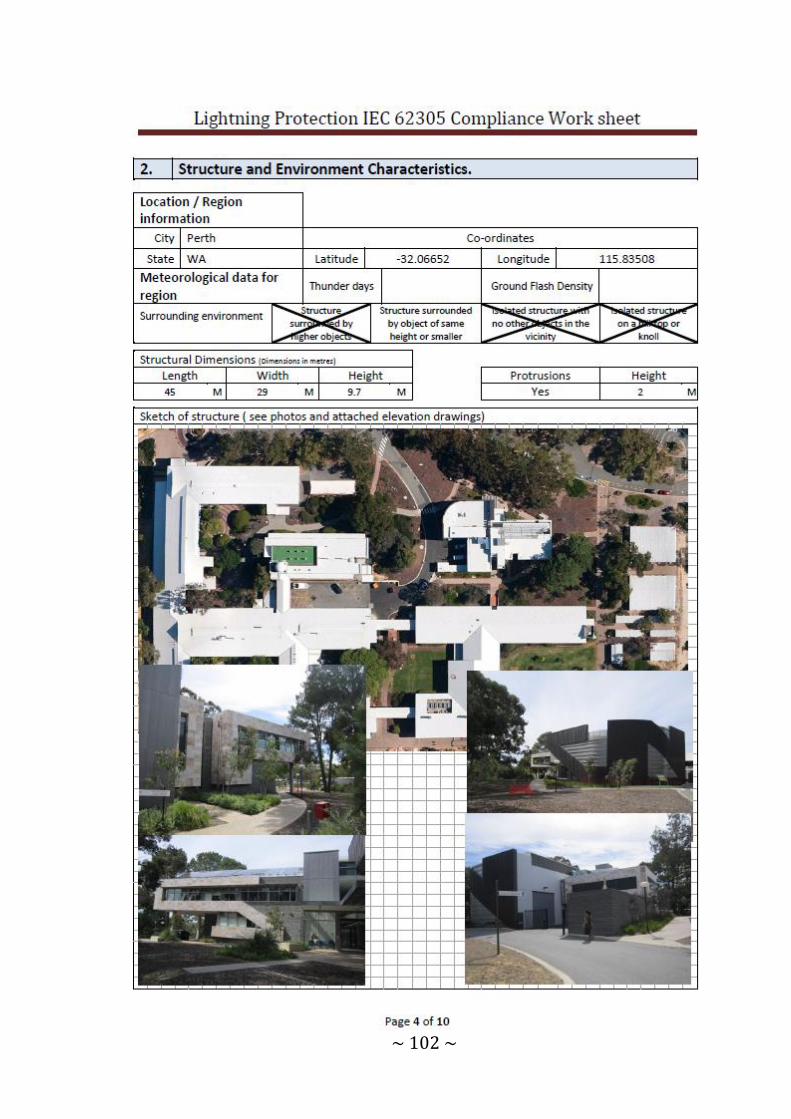
~ 102 ~
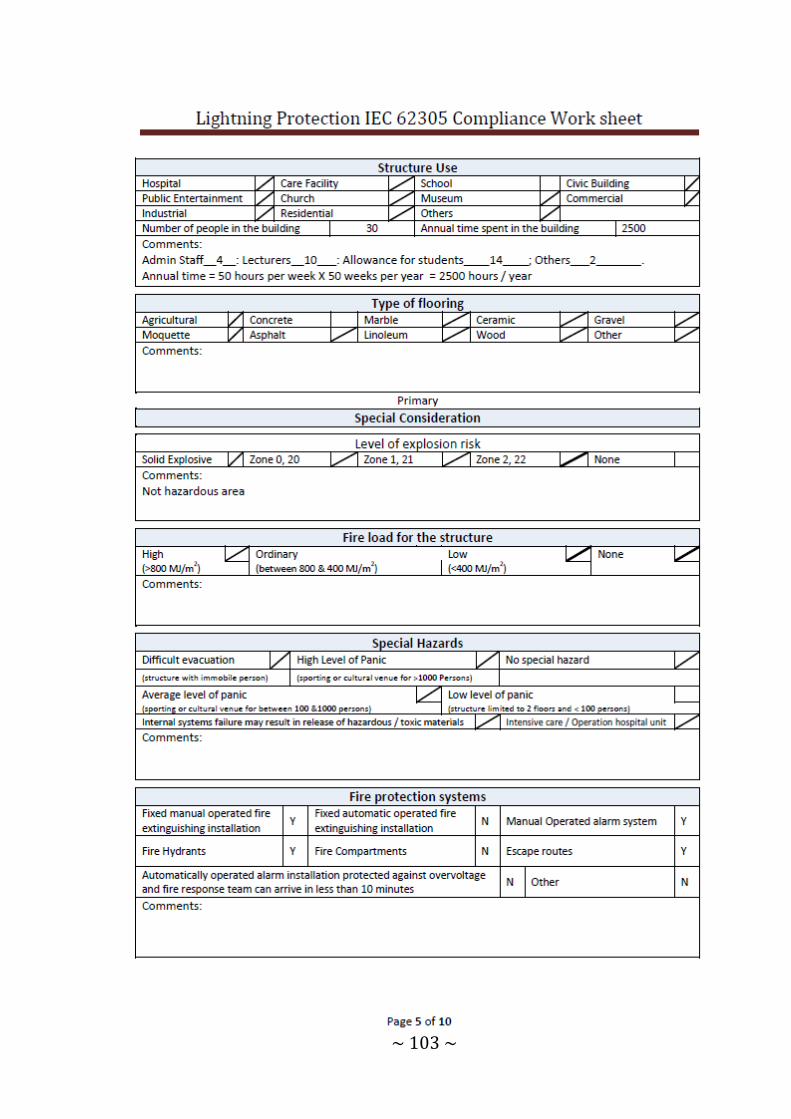
~ 103 ~
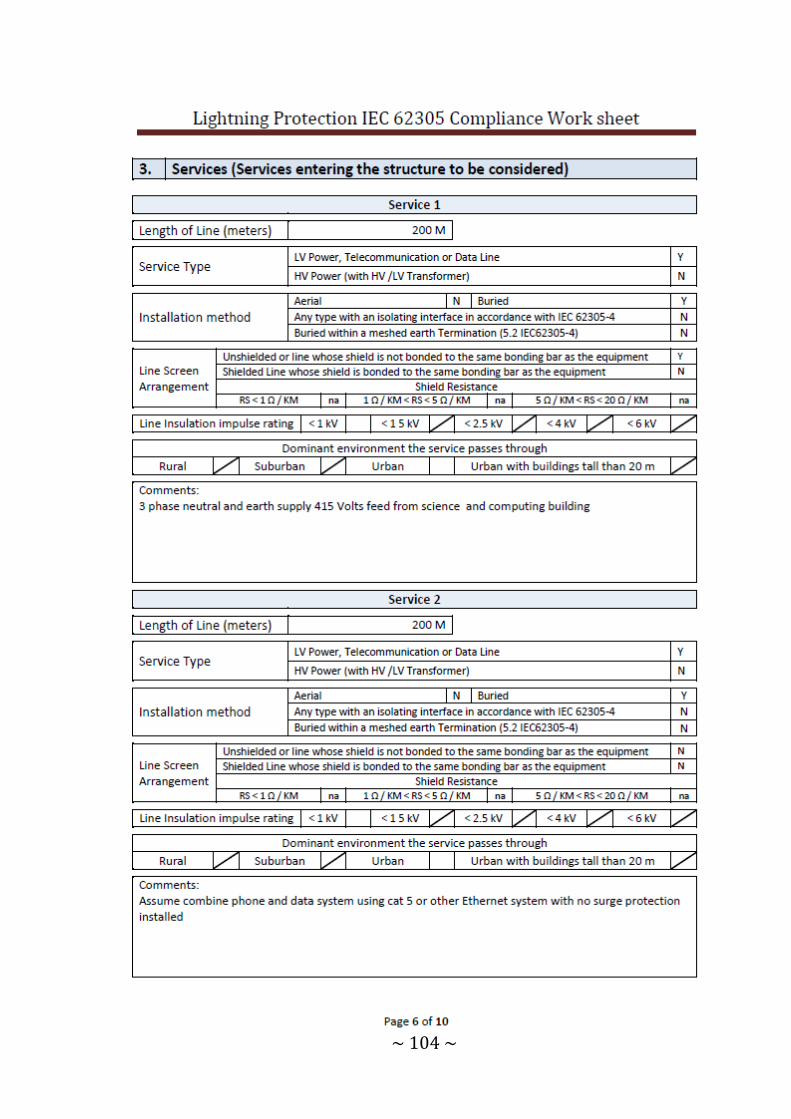
~ 104 ~
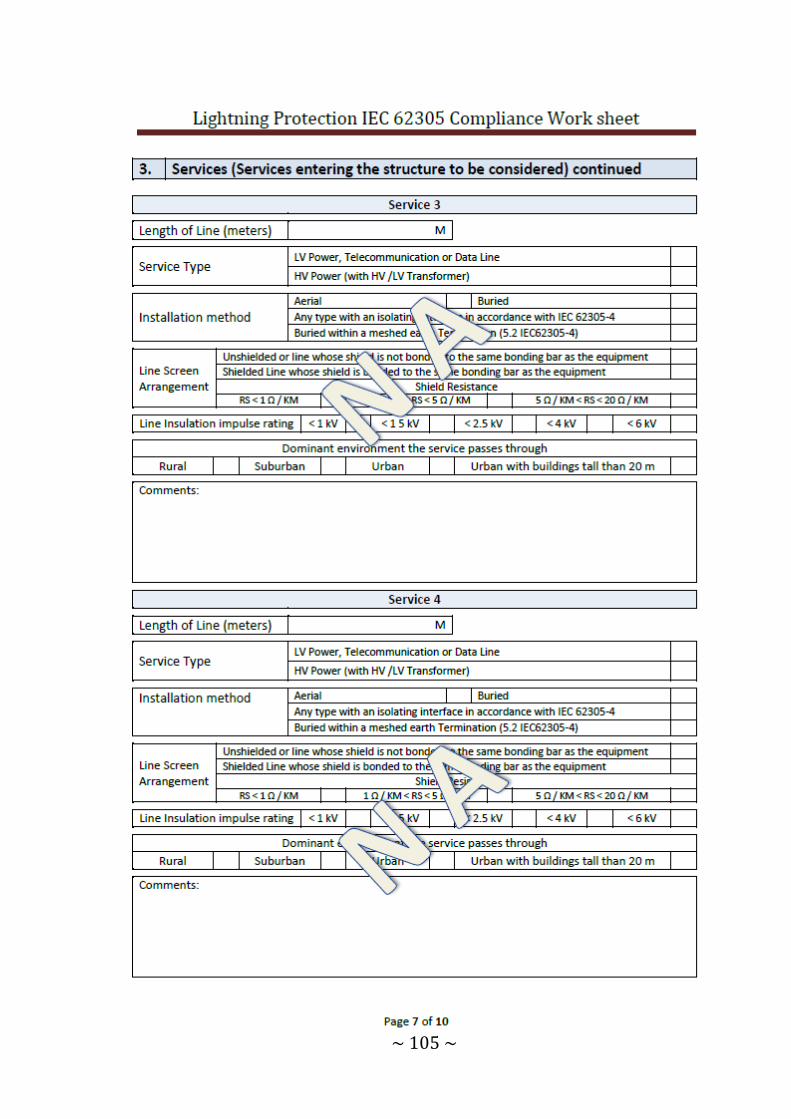
~ 105 ~

~ 106 ~
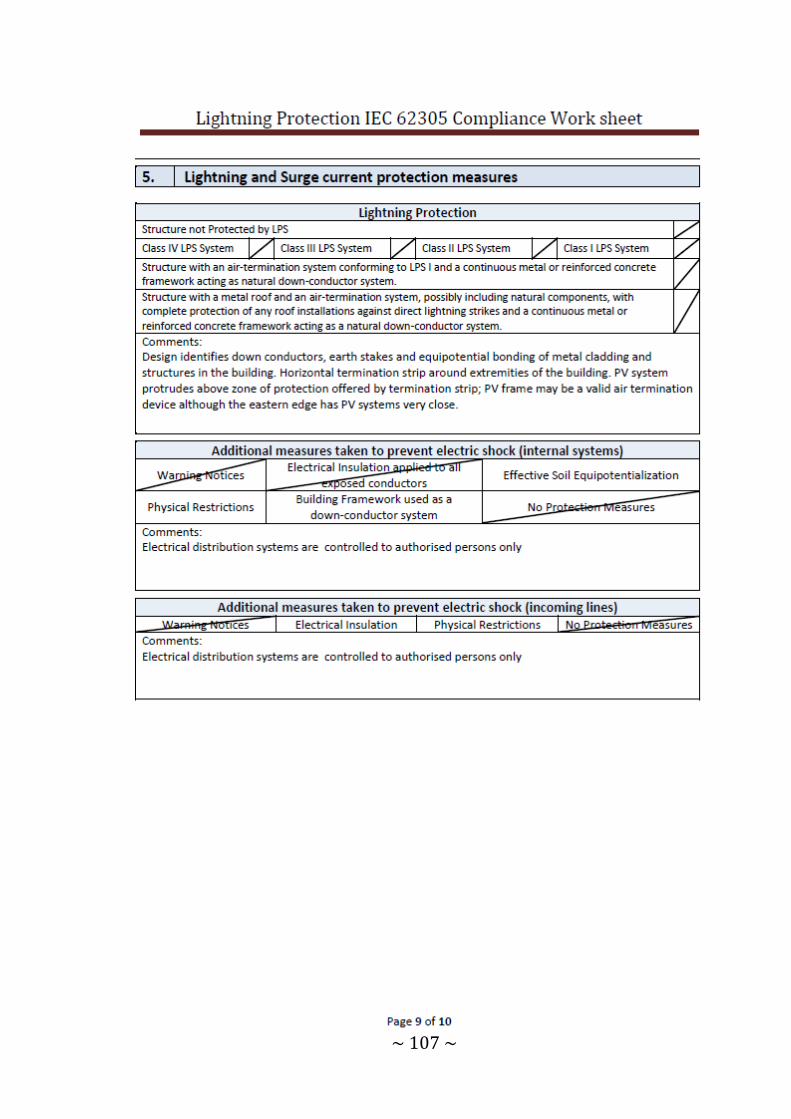
~ 107 ~
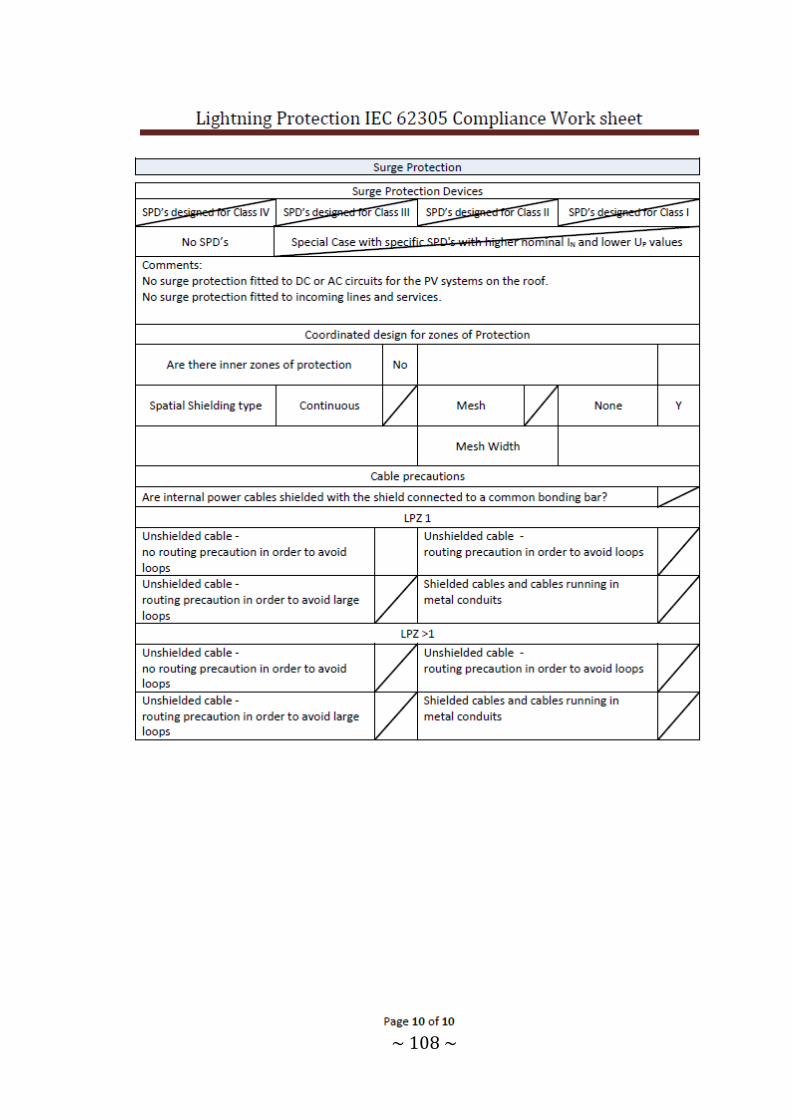
~ 108 ~