Design for Serviceability - A probabilistic approach Honfi ... · Design for Serviceability A...
144
Design for Serviceability - A probabilistic approach Honfi, Daniel 2013 Link to publication Citation for published version (APA): Honfi, D. (2013). Design for Serviceability - A probabilistic approach. Lund University. General rights Unless other specific re-use rights are stated the following general rights apply: Copyright and moral rights for the publications made accessible in the public portal are retained by the authors and/or other copyright owners and it is a condition of accessing publications that users recognise and abide by the legal requirements associated with these rights. • Users may download and print one copy of any publication from the public portal for the purpose of private study or research. • You may not further distribute the material or use it for any profit-making activity or commercial gain • You may freely distribute the URL identifying the publication in the public portal Read more about Creative commons licenses: https://creativecommons.org/licenses/ Take down policy If you believe that this document breaches copyright please contact us providing details, and we will remove access to the work immediately and investigate your claim.
Transcript of Design for Serviceability - A probabilistic approach Honfi ... · Design for Serviceability A...

LUND UNIVERSITY
PO Box 117221 00 Lund+46 46-222 00 00
Design for Serviceability - A probabilistic approach
Honfi, Daniel
2013
Link to publication
Citation for published version (APA):Honfi, D. (2013). Design for Serviceability - A probabilistic approach. Lund University.
General rightsUnless other specific re-use rights are stated the following general rights apply:Copyright and moral rights for the publications made accessible in the public portal are retained by the authorsand/or other copyright owners and it is a condition of accessing publications that users recognise and abide by thelegal requirements associated with these rights. • Users may download and print one copy of any publication from the public portal for the purpose of private studyor research. • You may not further distribute the material or use it for any profit-making activity or commercial gain • You may freely distribute the URL identifying the publication in the public portal
Read more about Creative commons licenses: https://creativecommons.org/licenses/Take down policyIf you believe that this document breaches copyright please contact us providing details, and we will removeaccess to the work immediately and investigate your claim.

Design for serviceability A probabilistic approachDÁNIEL HONFI
FACULTY OF ENGINEERING | LUND UNIVERSITY 2013
LUND UNIVERSITYFaculty of Engineering,
Division of Structural EngineeringReport TVBK-1044
ISSN 0349-4969ISRN LUTVDG/TVBK-1044/13-SE(p)
ISBN 978-91-979543-7-2
Print by Media-Tryck | Lund U
niversity 2013
DÁ
NIEL H
ON
FI
Design for serviceability – A probabilistic approach
9789197
954372
Dániel Honfi is a structural engineer from Budapest, Hungary. He graduated from the Budapest University of Technology and Economics with a masters degree in Civil Engineering in 2001. Besides being active in research and teaching, he worked as a consultant for several years. In 2008 he moved to Lund, Sweden and started working on the present the-sis. His main research interests are structural optimisation, reliability, robustness and serviceability. However, he thinks that the human factor is the most important in engineering. Therefore his creativity and interpersonal skills are constantly being tested by playing board games. He loves sports and has a black belt in judo. So better start reading!
About the author

Design for Serviceability A Probabilistic Approach
Dániel Honfi
DOCTORAL DISSERTATION by due permission of the Faculty of Engineering, Lund University, Sweden.
To be defended at Lecture Hall C, V-Building, John Ericssons väg 1 Lund on the 23rd of January 2014 at 13:15.
Faculty opponent
Professor John Dalsgaard Sørensen Aalborg University, Denmark

Organization
LUND UNIVERSITY
Document name
DOCTORAL DISSERTATION
Division of Structural Engineering Date of issue
Author(s): Dániel Honfi Sponsoring organization: FORMAS
Title and subtitle: Design for serviceability: A probabilistic approach
Abstract
In many design situations the acceptable performance of structures is defined by serviceability requirements. To estimate the probability of serviceability failure three main design aspects should be considered: (1) the relevant exposures, (2) the structural response and (3) the performance criteria. This thesis presents background information and new findings on structural serviceability related to all three aforementioned aspects. To study current practice concerning serviceability design two surveys with experts are presented: (1) serviceability issues in present Swedish design practice and (2) research interviews with international experts working with glass structures. The main conclusion of the two surveys is the general need for better understanding and guidance about serviceability, both in education and design codes. Since load history and long-term deformations may have a large influence on serviceability, an advanced finite element model has been developed to estimate the deflections of structural sized timber beams in natural environment. The model is capable to take into account the combined effect of the variations of relative humidity in the surrounding environment and the time-variant mechanical loading. Based on the results of the model, possibilities of simplified modelling are investigated to predict long-term deflections of timber structures. The reliability of serviceability limit states in current design codes is investigated mainly focusing on static deflections. Simple models are used to compare various construction materials – steel, concrete and timer – in terms of serviceability reliability, based on design according to Eurocode prescriptions using second order reliability methods. It is shown that the reliability of Eurocodes is not consistent. The inconsistency exists among different materials, variable to total load ratios and loaded areas. The proposed method may provide a basis for code calibration with regard to serviceability. As a final step the time-dependent reliability for serviceability design for beams is estimated using Monte Carlo simulation. The study presented in the time-variant analysis is restricted to timber floor beams in offices and residential buildings. However, the presented method provides a framework to calibrate proper deflection limits, load factors and creep coefficients based on a probabilistic investigation involving uncertainties in all important aspects of structural serviceability. Key words: serviceability, structural reliability, long-term deflections
Classification system and/or index terms (if any)
Supplementary bibliographical information Language: English
ISRN LUTVDG/TVBK-1044/13-SE(p)
ISSN and key title: 0349-4969, Report TVBK-1044 ISBN 978-91-979543-7-2
Recipient’s notes Number of pages Price
Security classification
I, the undersigned, being the copyright owner of the abstract of the above-mentioned dissertation, hereby grant to all
reference sources permission to publish and disseminate the abstract of the above-mentioned dissertation.
Signature Date
Design for Serviceability
A Probabilistic Approach
Dániel Honfi

Copyright © Dániel Honfi
Faculty of Engineering, Division of Structural Engineering P.O. Box 118, SE-221 00 Lund, Sweden Report TVBK-1044 ISSN 0349-4969 ISRN LUTVDG/TVBK-1044/13-SE(244p) ISBN 978-91-979543-7-2 Printed in Sweden by Media-Tryck, Lund University Lund 2013
En del av Förpacknings- och Tidningsinsamlingen (FTI)

i
Preface
“For beauty after all is distinctly associated with fitness, with serviceability, and the sooner it is so understood the sooner will it find acceptance.”
The above words are written in the journal Art and Progress in 1910 and refer to city planning (Beauty in Serviceability, 1910). The “City Beautiful” movement at the turn of the last century promoted the idea to improve cities through beautification. Followers believed that if form is improved, function will follow. However, according to the referred article “a city built without regard for the comfort and convenience of those who dwell within its boundaries could scarcely be declared to have genuine beauty”.
Is that true for structures? Is serviceability associated with beauty? In some aspects yes, since aesthetics is one of the performance indicators of structural serviceability. However, in a broader sense serviceability will define the quality of a structure. Safety is essential, but serviceability makes the difference. Good design for serviceability will result less cracks, less deformations, more comfort, more tightness and slenderness at the same level of safety.
In the present thesis structural serviceability is studied from a probabilistic point of view. The simple question is asked: What is the probability of serviceability failure?
The thesis is a summary of the work that has been carried out by the author at the Division of Structural Engineering at Lund University from 2008 to 2013.
Dániel Honfi
Lund, November 2013


iii
Abstract
In many design situations the acceptable performance of structures is defined by serviceability requirements. To estimate the probability of serviceability failure three main design aspects should be considered: (1) the relevant exposures, (2) the structural response and (3) the performance criteria. This thesis presents background information and new findings on structural serviceability related to all three aforementioned aspects.
To study current practice concerning serviceability design two surveys with experts are presented: (1) serviceability issues in present Swedish design practice and (2) research interviews with international experts working with glass structures. The main conclusion of the two surveys is the general need for better understanding and guidance about serviceability, both in education and design codes.
Since load history and long-term deformations may have a large influence on serviceability, an advanced finite element model has been developed to estimate the deflections of structural sized timber beams in natural environment. The model is capable to take into account the combined effect of the variations of relative humidity in the surrounding environment and the time-variant mechanical loading. Based on the results of the model, possibilities of simplified modelling are investigated to predict long-term deflections of timber structures.
The reliability of serviceability limit states in current design codes is investigated mainly focusing on static deflections. Simple models are used to compare various construction materials – steel, concrete and timer – in terms of serviceability reliability, based on design according to Eurocode prescriptions using second order reliability methods. It is shown that the reliability of Eurocodes is not consistent. The inconsistency exists among different materials, variable to total load ratios and loaded areas. The proposed method may provide a basis for code calibration with regard to serviceability.
As a final step the time-dependent reliability for serviceability design for beams is estimated using Monte Carlo simulation. The study presented in the time-variant analysis is restricted to timber floor beams in offices and residential buildings. However, the presented method provides a framework to calibrate proper deflection limits, load factors and creep coefficients based on a probabilistic investigation involving uncertainties in all important aspects of structural serviceability.

v
Papers
This thesis is based on the following papers, which will be referred to in the text by their Roman numerals. The papers are appended at the end of the thesis.
I Reliability of beams according to Eurocodes in serviceability limit state Honfi, D., Mårtensson, A. & Thelandersson, S. Engineering Structures, Vol. 35, pp. 48-54 (2012)
II Modelling of bending creep of low- and high-temperature-dried spruce timber Honfi, D., Mårtensson, A., Thelandersson, S. & Kliger, R. Wood Science and Technology, DOI:10.1007/s00226-013-0581-4 (2013)
III Survey on structural serviceability: What can we expect when no rules are given? Honfi, D. & Mårtensson, A. Journal of Engineering Design and Technology, submitted for publication (2013)
IV Glass structures – learning from experts Honfi, D. & Overend, M. In Belis, J., Louter, C. and Mocibob, D. (Eds.) COST Action TU0905 Mid-term Conference on Structural Glass, CRC Press, pp. 527–535 (2013)
V Serviceability floor loads Honfi, D. Structural Safety, submitted for publication (2013)
VI Time-variant reliability of timber beams according to Eurocodes considering long-term deflections Honfi, D. Wood Science and Technology, submitted for publication (2013)
In Paper I the calculations were performed by Dániel Honfi. In Paper II the development of the numerical model and the simulations were carried out by Dániel Honfi, while the test data was provided by Robert Kliger.
In Paper III and IV the interviews were conducted by Dániel Honfi, the planning of the interviews was made together with the co-authors.
In Paper I-IV the analysis of the results and writing was done by Dániel Honfi with valuable contributions and comments from the co-authors.


vii
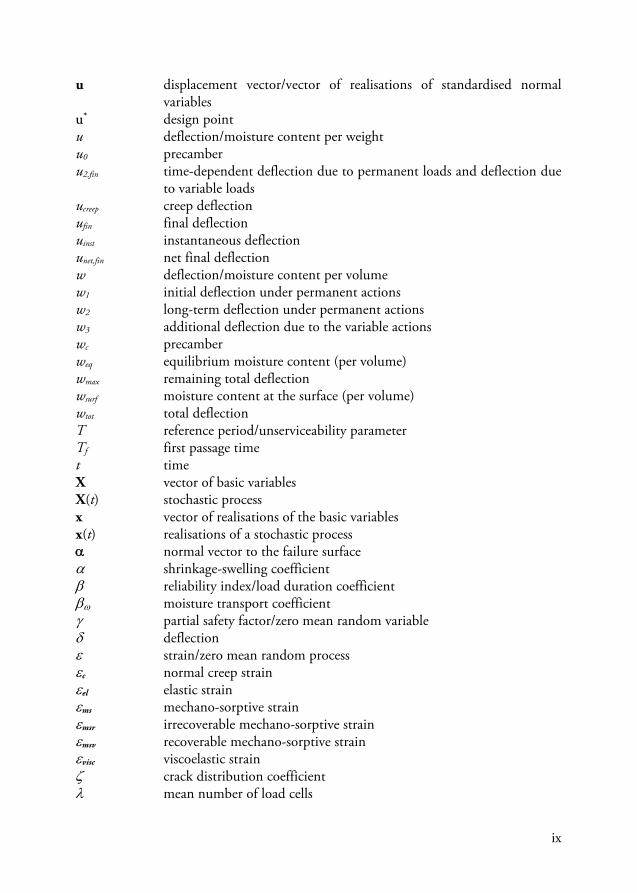
Abbreviations and symbols
Some of the most important abbreviations and symbols used in the thesis are listed below.
Abbreviations
ANSI American National Standards Institute ASCE American Society of Civil Engineers ASTM American Society for Testing and Materials BKR Swedish Structural Design Code (from Swedish: Boverkets
Konstruktionsregler) BRE Building Research Establishment CDF Cumulative Distribution Function CEN European Committee for Standardization (from French: Comité
Européen de Normalisation) CIB International Council for Research and Innovation in Building and
Construction (from French: Conseil International du Bâtiment) COST European Cooperation in Science and Technology COV Coefficient Of Variation EC Eurocode EN European Norm (from German: Europäische Norm) ENV European Pre-Standard (from German: Europäischer Normvorschlag) EUDL Equivalent Uniformly Distributed Load FE Finite Element FORM First Order Reliability Method HT High-Temperature-Dried IGU Insulated Glass Unit ISO International Organization for Standardization JCSS Joint Committee of Structural Safety LoP Limit of Proportionality LSF Limit State Function LRFD Load and Resistance Factor Design LT Low-Temperature-Dried LVL Laminated Veneer Lumber MC Moisture Content MCS Monte Carlo Simulation

viii
NA National Annex PDF Probability Density Function PSFM Partial Safety Factor Method RC Reinforced Concrete RH Relative Humidity SLS Serviceability Limit State SAKO Joint Nordic Group of Structural Matters SORM Second Order Reliability Method ULS Ultimate Limit State
Symbols
b width of cross-section/mechano-sorptive material parameter c spacing between beams Dw diffusion coefficient Df number of violated years in a reference period E modulus of elasticity/expected value Gk characteristic value of a permanent action F cumulative distribution function f probability density function g() limit state function h height of cross-section I second moment of inertia I() indicator function/influence surface function J compliance kdef creep factor for structural timber K stiffness matrix L span of structural member/live load LS sustained live load LE intermittent live load M safety margin m mean value P external load vector P() probability pf probability of failure Qk characteristic value of a variable action q uniformly distributed load/surface flux R resistance S load effect U vector of standardised normal variables U complaint threshold
ix
u displacement vector/vector of realisations of standardised normal variables
u* design point u deflection/moisture content per weight u0 precamber u2,fin time-dependent deflection due to permanent loads and deflection due
to variable loads ucreep creep deflection ufin final deflection uinst instantaneous deflection unet,fin net final deflection w deflection/moisture content per volume w1 initial deflection under permanent actions w2 long-term deflection under permanent actions w3 additional deflection due to the variable actions wc precamber weq equilibrium moisture content (per volume) wmax remaining total deflection wsurf moisture content at the surface (per volume) wtot total deflection T reference period/unserviceability parameter Tf first passage time t time X vector of basic variables X(t) stochastic process x vector of realisations of the basic variables x(t) realisations of a stochastic process normal vector to the failure surface shrinkage-swelling coefficient reliability index/load duration coefficient moisture transport coefficient partial safety factor/zero mean random variable deflection strain/zero mean random processc normal creep strainel elastic strainms mechano-sorptive strainmsr irrecoverable mechano-sorptive strain msv recoverable mechano-sorptive strain visc viscoelastic strain crack distribution coefficient mean number of load cells

x
mean value occurrence rate/out-crossing rate out-crossing threshold reinforcement ratio stress/standard deviation relaxation parameter standard normal distribution φ creep coefficient/performance factor c resistance factor variable to total load ratio load reduction factor combination factor reduction factor for the frequent value of actions reduction factor for the quasi-permanent value of actions

Contents
Preface i
Abstract iii
Papers v
Abbreviations and symbols vii
1 Introduction 1 1.1 Background 1 1.2 Objectives 2 1.3 Limitations 2 1.4 New findings 3 1.5 Outline of the thesis 4
2 Structural serviceability 5 2.1 General 5 2.2 Deflections 9
2.2.1 Limiting deflections 11 2.2.2 Design according to Eurocode 12
2.3 Vibrations 23 2.4 Cracks 24
3 Serviceability issues in current design practice 25 3.1 Previous surveys involving experts 25 3.2 Serviceability issues of traditional structural materials 27 3.3 Serviceability issues of glass structures 31
4 Structural reliability 39 4.1 Fundamentals 39 4.2 Reliability methods 44
4.2.1 Levels of reliability methods 44

4.2.2 First Order Reliability Method (FORM) 45 4.2.3 Second Order Reliability Method (SORM) 46 4.2.4 Monte Carlo Simulation (MCS) 46
4.3 Time-variant reliability 48 4.4 Load models 49 4.5 Resistance models 51 4.6 Design criteria for serviceability 52 4.7 Target reliabilities 55
5 Live loads in buildings 57 5.1 General concept 57 5.2 Sustained load 58
5.2.1 Intensity of the sustained load 58 5.2.2 Equivalent uniformly distributed load 59 5.2.3 Maximum sustained load 59
5.3 Intermittent load 60 5.4 Serviceability loads 61
6 Long-term deformation of timber 67 6.1 Long-term deformation of timber 67
6.1.1 Elastic deformation 68 6.1.2 Viscoelastic deformation 68 6.1.3 Mechano-sorption 70 6.1.4 Hygroexpansion 70
6.2 Constitutive modelling 71 6.2.1 Viscoelastic creep 71 6.2.2 Mechano-sorptive creep 72 6.2.3 Shrinkage and swelling 72
6.3 Moisture transport 73 6.4 Long-term deflections in Eurocode 73 6.5 Model calibration 74
6.5.1 Tests by Bengtsson and Kliger (2003) 74 6.5.2 Tests by Leivo (1991) 75 6.5.3 Tests by Ranta-Maunus (1975) 77 6.5.4 Tests by Ranta-Maunus (2007) 79 6.5.5 Summary of the modelling 80
7 Reliability in the serviceability limit state 83

7.1 Time-invariant reliability of beams in the serviceability limit state 83 7.1.1 Reliability in ULS 83 7.1.2 Reliability in SLS 85
7.2 Time-variant reliability of beams in the serviceability limit state 89 7.2.1 Variation of deflections in time 89 7.2.2 Previous studies 90 7.2.3 Reliability according to EC 91
8 Other Publications 95
9 Summary of appended papers 97
10 Conclusions and future work 99 10.1 Summary and conclusions 99 10.2 Future research 100
Acknowledgements 101
References 103
Appendix A 111
Appendix B 113 B.1 Office floors – appearance 113 B.2 Office floors – damage 116 B.3 Residential floors – appearance 119 B.4 Residential floors – damage 122


1
1 Introduction
This chapter gives a brief introduction about the thesis. The background of the research is explained, the main objectives and the limitations of the thesis are presented. After that the new findings are highlighted and finally the outline of the thesis is given.
1.1 Background
In the structural design process normally two types of limit states are considered: ultimate limit states (ULS) and serviceability limit states (SLS). In many design situations, particularly in systems like houses and medium sized commercial buildings, acceptable performance of a structural system is seldom defined by ultimate limit states, but rather by serviceability requirements. To calculate the probability of serviceability failure of buildings and structures one should have a reliable stochastic model of (1) the relevant exposures (e.g. loads, temperature, relative humidity etc.), (2) factors affecting the structural response (e.g. boundary conditions. geometrical dimensions, material properties etc.) and (3) the performance criterion itself. The number of the stochastic variables depends on the complexity of the system i.e. the modelling of exposures, the structural and the material model, and the model of the performance criterion. Thus the calculated reliability of the system depends on the level of modelling i.e. uncertainties considered in the calculation. Although serviceability is in general considered less important than safety, the consequences of serviceability failure may be significant in terms of costs.
This thesis presents background information and new findings on structural serviceability related to all three aspects mentioned above.

2
1.2 Objectives
The primary aim of the work presented in this thesis is to increase knowledge about reliability of structures in serviceability limit state. The main objectives are to:
o Study current design practice concerning serviceability;
o Investigate the reliability of serviceability in current design codes;
o Provide a framework, which could be a basis for code calibration with regard to structural serviceability;
o Investigate the influence of long-term effects in serviceability;
o Increase knowledge about long-term behaviour of timber structures.
1.3 Limitations
The focus of this thesis is serviceability design and the reliability of serviceability design. Within the field of serviceability a number of phenomena are relevant to study, for instance static deflections, vibrations, cracking etc. System effects of floors are also important to consider when predictions of in-service behaviour are to be done. In addition to this the effect of varying humidity in the surrounding climate is of importance in serviceability design of both concrete and timber. One of the most important aims with the thesis was to study the application of probabilistic methods in serviceability design. Such methods are relatively complex and require sufficient data concerning relevant factors and their variation. Due to this complexity the following limitations were made: only static deflections were studied, only indoor climate was used for the climate models and only a restricted number of load situations were applied in the calculations.
3
1.4 New findings
The most important new research findings in this thesis are as follows:
o Two surveys were carried with regard to serviceability issues. One in Sweden in relation to traditional structural materials and another one on an international level concerning serviceability questions in the design of glass structures. The analysis of these surveys highlights the importance of structural serviceability and a need for better guidelines and regulations in this area.
o An advanced finite element (FE) model was developed to estimate the deflections of structural sized timber beams. The constitutive equations of the FE-model are capable to take into account the combined effect of the variations of relative humidity in the surrounding environment and the time-variant mechanical loading. Based on the results of the FE-model a simple model was selected to calculate the long-term deformations of timber beams.
o The serviceability loads for floors were investigated in detail using stochastic load models. It was found that the serviceability load combinations in structural design codes should be revisited. Proposal for changes are suggested. However, the stochastic models for live loads should be improved first to provide a more solid basis for such proposals.
o It was shown that the reliability of Eurocodes (EC) related to serviceability is not consistent. The inconsistency exists among different materials, variable to total load ratios and loaded areas. Although the investigation was carried out using the prescriptions of the European structural codes, due to similarities in the design format, it is reasonable to assume that the same applies for other standards.
o Time-variant reliability of timber floors beams was investigated considering long-term deflections. Based on the results a change of the creep factor and the recommended deflection limits in Eurocode 5 (CEN, 2004b) was proposed.
o Different stochastic load models were compared and their effect on reliability in SLS was investigated.

4
1.5 Outline of the thesis
The main part of this thesis contains six academic research papers, appended to the end of the kappa. Two of the papers are peer-reviewed and published journal papers, one is a peer-reviewed and published conference paper and three are submitted for publication.
In addition to the research papers, the thesis starts with ten numbered chapters to present background information and state of the art. Chapter 1 serves as an introduction of the thesis. Chapter 2 discusses serviceability of structures in general and deflections in detail. Other important aspects of structural serviceability (e.g. vibrations, cracking) are briefly introduced. Chapter 3 contains a discussion about some serviceability issues in current design practice, related to traditional construction materials and structures made of glass, based on interviews with experts. Chapter 4 gives an overview about structural reliability. The general concept of reliability is described, and the methods of reliability are briefly presented. Chapter 5 gives a detailed description about live loads in buildings with respect to serviceability. Chapter 6 describes long-term deflections of timber structures in variable environment and their modelling. Chapter 7 presents results about both time-invariant and time-variant reliability of beams in serviceability limit state. After that a list of other publications by the author are given in relation to the thesis (Chapter 8). At the end of the kappa a summary of the appended papers is included (Chapter 9), followed by conclusions and future research needs in Chapter 10. The thesis ends with acknowledgements, a list of the referred works and two appendices.

5
2 Structural serviceability
In the following chapter the general aspects of structural serviceability are discussed. An overview of the concept of serviceability, the state-of-the-art and historical perspective are given. Then the current serviceability design prescriptions for different structural materials are briefly introduced considering excessive deflections. Other important aspects, such as vibrations and cracks are shortly discussed.
2.1 General
Structural serviceability means the ability of a structure to serve as it is intended, i.e. to fulfil its function. Structures on the first place are required to be safe. However, even if a structure is safe, it may not fulfil its original design purpose. For example, if the vibrations of an office floor make it impossible to work there, then that floor is obviously not serviceable and therefore cannot be accepted. Similarly, if the deflections of the floor are too excessive people may be disturbed or feel unsafe and refuse to work in that environment. Another example of serviceability problems is wide cracks in reinforced concrete that could increase the risk of corrosion.
Some common serviceability problems, according to Galambos and Ellingwood (1986), are:
o Local damage to non-structural elements due to deflections;
o Impairment of normal functions of furniture or equipment due to deflection under load;
o Noticeable deflections causing distress to occupants;
o Extensive damage to non-structural elements due to extreme natural events;
o Deterioration of the structure due to age and use;
o Physical or psychological discomfort or sickness of occupants due to building motion caused by normal usage/wind/earthquake;
o Connection distortion under service loading.

6
However, the list is incomplete and could easily be extended by cracking, local buckling, fatigue etc.
According to Reid (1981) there are 5 fundamental differences between structural safety and serviceability:
1. Considering safety problems the failure is usually clearly defined. However, definition of serviceability failure is not always straightforward, since there could be a progressive transition between satisfactory and unsatisfactory behaviour.
2. The failure boundary might not be only fuzzy, but often subjective, i.e. could depend on the user.
3. Safety problems are usually irreversible, whereas serviceability problems might be reversible.
4. The design purpose with regard to safety is to ensure sufficiently small probabilities of failure, while the objective of designing for serviceability is to achieve an economic structure i.e. to minimise the total costs over the design lifetime.
5. The last difference is of legal nature. Safety regulations are often mandatory and serve to protect both the designer and the client or the public. If the engineer has carried out everything according to the relevant codes and regulations he or she is not responsible for a possible failure. In turn, serviceability criteria in the codes are usually only suggestions and are free to be modified by the designer in agreement with the client.
Serviceability problems can generally be avoided during the design process by:
1. Conceptual design;
2. Good detailing;
3. Limiting load effects;
4. Applying allowable slenderness ratios.
The last three were identified by Magnusson (1987); however, it may be reasonable to add the first one as well.
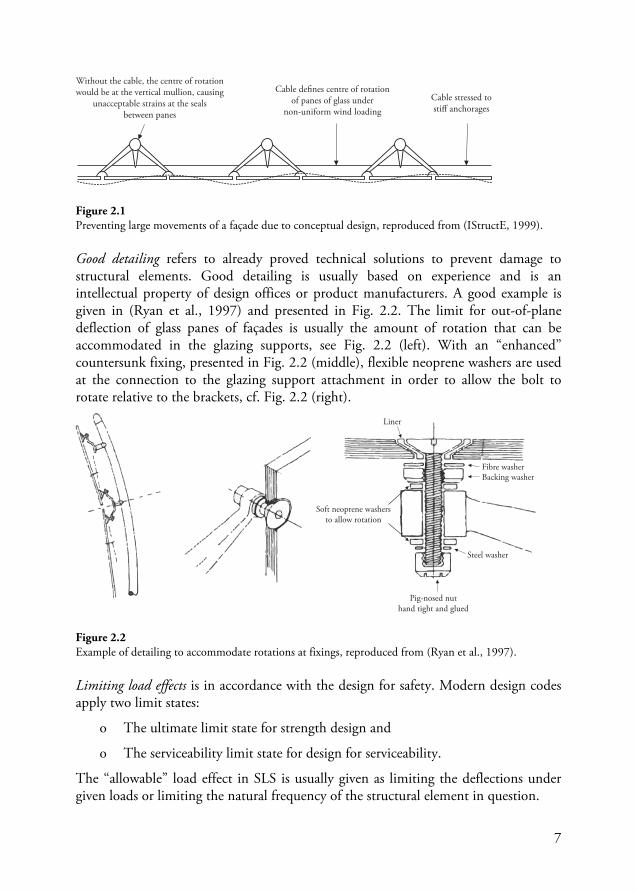
As an example to conceptual design a reference is given here to (IStructE, 1999), where a glass façade is presented, see Fig. 2.1. With the addition of a stressing cable the centre of rotation of the panes could be modified under non-uniform wind loading to reduce the strains at the seals between the glass panes.
7
Figure 2.1 Preventing large movements of a façade due to conceptual design, reproduced from (IStructE, 1999).
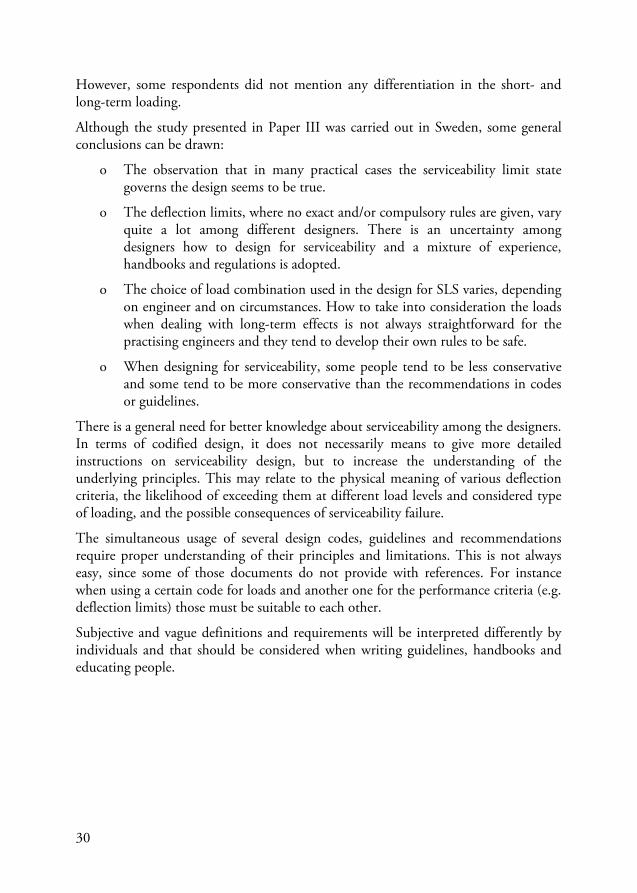
Good detailing refers to already proved technical solutions to prevent damage to structural elements. Good detailing is usually based on experience and is an intellectual property of design offices or product manufacturers. A good example is given in (Ryan et al., 1997) and presented in Fig. 2.2. The limit for out-of-plane deflection of glass panes of façades is usually the amount of rotation that can be accommodated in the glazing supports, see Fig. 2.2 (left). With an “enhanced” countersunk fixing, presented in Fig. 2.2 (middle), flexible neoprene washers are used at the connection to the glazing support attachment in order to allow the bolt to rotate relative to the brackets, cf. Fig. 2.2 (right).
Figure 2.2 Example of detailing to accommodate rotations at fixings, reproduced from (Ryan et al., 1997).
Limiting load effects is in accordance with the design for safety. Modern design codes apply two limit states:
o The ultimate limit state for strength design and
o The serviceability limit state for design for serviceability.
The “allowable” load effect in SLS is usually given as limiting the deflections under given loads or limiting the natural frequency of the structural element in question.
Without the cable, the centre of rotationwould be at the vertical mullion, causing
unacceptable strains at the sealsbetween panes
Cable defines centre of rotationof panes of glass under
non-uniform wind loading
Cable stressed tostiff anchorages
Liner
Fibre washerBacking washer
Pig-nosed nuthand tight and glued
Steel washer
Soft neoprene washersto allow rotation

8
Applying allowable slenderness ratios in design charts is a simple tool to ensure that the serviceability limit states be not critical over the strength criteria. As an example EN 1992 (EC2) provides span/depth ratios for reinforced concrete beams and slabs, which are adequate for avoiding deflection problems in normal circumstances (CEN, 2004a).
Serviceability limit states can be grouped into three major categories: (1) deformation, (2) motion perception and (3) deterioration (Griffis, 1993). These categories cover the fundamental requirements associated to serviceability, such as:
o Functionality;
o User comfort and
o Appearance.
However, the above requirements cannot be verified directly. Therefore performance criteria are defined, which most commonly relate to (Lüchinger, 1996):
1. Deflections and displacements;
2. Vibrations;
3. Cracking.
In some cases the stresses might also be limited e.g. pre-stressed concrete structures, composite structures etc.
The current thesis has a main focus on deflections; other aspects of serviceability are only briefly discussed. However, even deflection of structures is a very complex topic and can be further divided into (Magnusson, 1987):
o Deflections and rotation of horizontal members;
o Lateral deflection of vertical members;
o Differential movement of adjacent components;
o Differential settlement of foundations;
In this thesis serviceability is mainly investigated through deflection of horizontal structural members.

9
2.2 Deflections
Structural deflections can be divided into different categories, the primary categories are static and dynamic deflections (Galambos et al., 1973). The classification and their effects on occupants and the structural subsystem are shown in Fig. 2.3.
Figure 2.3 Categorisation of structural deflections after Galambos et al. (1973).
Traditionally dynamic problems were often treated using equivalent static loads, thus many dynamic deflection problems were reduced to static problems. However, as technology has advanced, the actual consideration of dynamic structural problems was permitted. The main difference between the static and dynamic problem is the consideration of time. A static load, causing a static deflection, is slowly applied and released. Therefore a time-variant analysis is usually not necessary for static deflections. Slow application of loads refers to a time period comparable to the natural period of the structure. If the duration of load application or release is large, compared to the natural period of the structure, then the load and the corresponding deflection can be considered static. In contrast, if the duration of load application or release is small compared to the natural period, then the load and the deflection are dynamic and the dimension of time has to be considered in the analysis. Dynamic

10
loads are usually applied and released in the order of seconds or less, whereas static loads are applied and released in the order of minutes or longer.
Another type of time-dependent deflections is long-term deflections due to sustained (static) loading caused by time-dependent material response. Long-term in a structural sense often refers to months or years. This type of deflections can be analysed by the use of constitutive material models.
The static deflection problem in general can be defined by the static equilibrium:
KuP (2.1)
where P is the vector of external loads, K is stiffness matrix of the structure and u is the displacement vector. Thus if the structural characteristics of the system and the load is known, the deflections can be determined. However, there is a fourth component to be considered when designing for serviceability, namely the interaction with the occupants and the subsystem of the structure, i.e. the design criterion (Fig. 2.3). Unfortunately this interaction is perhaps the most complex one of the four components. The interaction with the occupants i.e. the human response is often expressed in subjective terms, thus it is difficult to define an engineering design criterion. The subsystems considered are the structural or non-structural elements attached to the structure, such as cladding elements, partition walls, doors, windows, installations, equipment etc. Therefore the design requirements might be very much dependent on factors that are beyond the boundaries of the structural system usually considered by the structural engineer.
Galambos et al. (1973) give a detailed state-of-the-art overview on static and dynamic deflections. However, the long-term deflections are not covered in the study. Concerning static deflections, first the effect of deflections on structures is discussed. A reference is made to Allen (1970) identifying the effects of excessive deflections as:
1. Cracking of primary structural members;
2. Cracking or crushing of non-structural components;
3. Lack of fit of doors and windows;
4. Walls out of plumb;
5. Eccentricity of loading due to rotation;
6. Unsightly droopiness;
7. Ponding of water.
It is also suggested that many deflection caused problems can be reduced by alternate design solutions e.g. flexible joints (see Fig. 2.2).

11
The report also presents a detailed summary of deflection limits from different design codes and standards from several countries with respect to various structural materials. Effects related to human interaction are also mentioned, such as psychological effects, aesthetics and discomfort.
It is recognised by Galambos et al. (1973) that in order to reflect to a specified design criteria, it is preferable to have a rational and standardised basis of computation. It is especially important how the restraint, cracking, non-linear material behaviour and time-dependent properties are considered.
To obtain reasonable deflection limits, especially with a statistical basis for probabilistic calculations, field observations are extremely important. A reference is made to the work by Skempton and MacDonald (1956). From their findings on frame buildings with infill panels it appears that a limiting value of L/300 is reasonable for differential settlements to avoid damage to non-structural elements. It is also concluded that non-structural damage (e.g. cracking of wall panels, floors or finishes) is caused by distortions smaller than those, which cause structural damage (i.e. damage to the structural frame itself).
An important note from Tichý (1993) is that deflections should usually be checked for various stages of the construction process and time-dependencies must be considered: both related to loads and material behaviour, but also for the performance criteria. The latter is usually underestimated.
2.2.1 Limiting deflections
Fleming (1941) gives a brief historical overview about the deflection limits for steel girders. It was recognised a long-time ago that “In the design of beams stiffness as well as strength must be considered. The limits of deflection are often given in specifications and may determine the size of beams.” To ensure sufficient stiffness the span-to-depth ratio of beams were often limited. For example the London Building Act from 1930 (Sophian, 1930) requires that the span of a girder shall not exceed 24 times the depth of the girder unless the calculated deflection of such a girder is less than 1/400 of the span. Fleming refers to (Ketchum, 1916) who states that the depth of rolled beams in floors shall not be less than 1/20 of the span, whereas rolled beams or channels used as roof purlins the depths shall not be less than 1/40 of the span. It is necessary for the supports of certain types of machinery that the deflection be limited to a very small amount, sometimes to 1/2000 the span. Another common value when supporting machinery is 0.02 in (0.5 mm).
Percival (1979) historically overviews the deflection limits for wooden beams. The deflection limit in the beginning of the 19th century was 1/480 of the span based on the experience of carpenters and some experiments by engineers (Tredgold, 1885). At

12
the end of the century the limit was increased to 1/360. In the next century the criterion was further refined. Distinction was made depending on the function of the structural element and deflections caused by dead and live loading.
Verification of traditional deflection limits is often believed to ensure satisfactory service performance throughout the entire lifetime of the structure (Galambos and Ellingwood, 1986). Since most structures in the past performed satisfactory, it seems that there is no reason not to think that a simple check of deflections will not avoid more complicated serviceability problems. However, according to the referred paper, there are two problems with this approach: (1) when it fails, the consequences may be significant in terms of costs; (2) it does not seem to be rational that e.g. unacceptable vibrations are controlled by limiting static deflections.
A review of deflection limits for serviceability design is given by Saidani and Nethercot (1993). It was found that design criteria spread diversely throughout codes, papers, reports, standards or are simply the customary practice of individual engineers. It is also noted that there is a significant difference in loading and modelling, not only in the limiting criteria.
It is important to understand that deflection limits should reflect to a given loading situation, therefore the deflection limit is related to the design format. Thus a deflection limit sufficient according to a design code might be completely inappropriate according to another one.
2.2.2 Design according to Eurocode
One aim of this thesis is to evaluate the reliability level of current serviceability design. In order to do so, the European standard family (Eurocode) is investigated focusing on vertical deflection of beams. Eurocode applies the principle of limit state design (LSD), i.e. limits states are defined beyond that the structure no longer fulfils the relevant design criteria. Limits states related to serviceability are distinguished as irreversible and reversible limit states. At irreversible limit states some consequences of actions exceeding the specified service requirements will remain when the actions are removed, whereas at reversible limit states no consequences of actions exceeding the specified service requirements will remain when the actions are removed (CEN, 2002).
2.2.2.1 Load combinations EN 1990 (CEN, 2002), also referred as EC0, defines the combinations of actions to be taken into account in the relevant design situations. Three different load combinations are defined for the serviceability limit states, which should be appropriate for the serviceability requirements and performance.

13
o Characteristic (or rare) combination:
1>
,,01
1,,i
ikij
kjk QQG (2.2)
where Gk,j denotes the characteristic value of the jth permanent action, Qk,1 is the characteristic value of the leading variable action, Qk,i is the characteristic value of the ith variable action and ψ0,i is the factor for combination value of a ith variable action. The characteristic combination is normally used for irreversible limit states.
o Frequent combination:
1>
,,21
1,1,1,i
ikij
kjk QQG
(2.3)
where ψ1,1 denotes the factor for frequent value of a leading variable action and ψ2,i is the factor for quasi-permanent value of the ith variable action. The frequent combination is normally used for reversible limit states.
o Quasi-permanent combination:
1
,,21
,i
ikij
jk QG
(2.4)
The quasi-permanent combination is normally used for long-term effects and the appearance of the structure.
2.2.2.2 Definition of deflections The vertical deflections of horizontal structural elements should be limited to avoid deformations affecting appearance/comfort/functioning of the structure or causing damage to finishes or non-structural members.
Figure 2.4 Definition of vertical deflections of beams (CEN, 2002).
The definition of vertical deflections according to EN 1990 (CEN, 2002) is shown in Fig. 2.4, where wc is the precamber when the beam is unloaded; w1 is the initial part of the deflection under permanent loads; w2 is the long-term part of the deflection under permanent loads; w3 is the additional part of the deflection due to the variable
wc
wmax
w2wtot
w1
w3
L

14
actions; wtot is the total deflection as the sum of w1, w2, w3; finally wmax is the remaining total deflection taking into account the precamber.
EN 1990 (CEN, 2002) also gives a detailed description about how the different serviceability requirements should be treated.
If the functioning or damage of the structural or non-structural members (e.g. partition walls, claddings, finishes) is being considered, the verification for deflections should take account of those effects of permanent and variable actions that occur after execution of the structural member. This would mean a limitation of the incremental deflections w2+w3.
If the comfort of the user, or the functioning of machinery are being considered, the verification should take account of the effects of the relevant variable actions, i.e. w3 should be limited.
If the appearance of the structure is being investigated, the quasi-permanent combination should be used. Although it is not explicitly stated, the investigation is usually carried out for the remaining total deflection wmax. Long term deformations due to shrinkage, relaxation or creep should be considered where relevant, and calculated by using the quasi-permanent combination.
Despite of the above definitions, their implementation is not always straightforward. In the Manual for the design of building structures to Eurocode 1 and Basis of structural design (IStructE, 2010) recommendations for deflection limits together with the appropriate combination of actions are given. Suggested values for beams are presented in Table 2.1.
Table 2.1 Recommended deflection limits for beams from IStructE (2010).
Requirement Irreversible SLS Reversible SLS
Characteristic combination wtot or wmax
Frequent combination wmax
Quasi-permanent combination wmax
Function and damage to Non-structural elements
Brittle Non-brittle
Structural elements
L/360-L/500 L/200-L/300 L/200-L/300
Avoidance of ponding water L/250User comfort/functioning of machinery
L/300
Appearance L/250

15
It should be noted that for instance the criteria used for the different requirements in Table 2.1 do not completely agree with the ones requested in EN1990, since no limitation for w3 or w2+w3 are given.
A different, more detailed recommendation can be found in Designers’ guide to EN1990 Eurocode: Basis of structural design (Gulvanessian et al., 2002). An extract from the suggested limits is presented in Table 2.2.
Table 2.2 Recommended deflection limits for beams from Gulvanessian et al. (2002).
Requirement
Irreversible SLS Reversible SLS
Characteristic combination wtot
Frequent combination wmax
Quasi-permanent combination wmax
Damage Elements supporting bearing walls Elements supporting partition walls
Brittle Reinforced/Removable
Ceilings Flooring
Rigid Flexible
L/300 L/500 L/300 L/250 L/500 L/250
Avoidance of ponding water Rigid roof covering Flexible roof covering
L/250 L/125
Functioning Wheeled furniture or equipment Overhead cranes and tracks
L/300 L/600
Appearance L/300
It is clear, that it is not straightforward to decide on the actual value of the deflection limits. In addition, the type of deflection and the applied load combinations could also be argued. Other suggested deflection limits can be found e.g. in ISO 4356:1977 (ISO, 2009) whereas a detailed collection of limiting deflections is given by Cooney and King (1988).

16
2.2.2.3 Deflection of steel members In case of steel structures EN 1993 (CEN, 2005), also referred as EC3, states that the limits for vertical deflections according to Fig. 2.4 should be specified for each project and agreed with the client and notes that the National Annexes (NA) may specify these limits. However, the values given in the NAs are only suggested values and there are no compulsory rules given.
These prescriptions are quite varying and can be different depending on the function (e.g. accessible/non-accessible roof, floor etc.), the importance (main girder, purlin), the type of the carried material (plaster, brittle finish, non-brittle finish) or other conditions of the investigated element.
The deflection limit values for a general steel floor beam not carrying brittle finish or having some special requirement given from some NAs are summarised in Table 2.3. These values are given for the characteristic combination of actions.
Table 2.3 Recommended deflection limits for beams in the NAs of some European countries (Honfi and Mårtensson, 2009).
Country wmax w3 Denmark - L/400Finland L/400 -France L/200 L/300Greece L/250 L/300Hungary L/250 L/300Spain - L/300UK - L/200
It can be seen that some countries limit the remaining total deflection wmax, others the deflections due to variable actions w3 or both of them. The former is related to the appearance and the latter to the damage criterion. However, it should be noted that the appearance can also be controlled by applying precamber. It is also worth to mention that appearance criterion is not verified using the quasi-permanent load combination, as recommended in EN1990.
Since the deflection model of a structural steel member is based on elastic behaviour, the maximum deflection max of a simply supported steel beam loaded by a uniformly distributed load is given by:
EIqL4
max 3845
(2.5)

17
where q is the uniformly distributed load (calculated from the appropriate load combination), L is the span, E is the modulus of elasticity and I is the second moment of inertia. It should be noted that deflections due to shear are usually neglected.
Honfi and Mårtensson (2011) illustrate the practical significance of the recommended deflection requirements in comparison with ultimate limit state design. Some examples are given here. It is assumed that the beam is loaded with only one variable load (e.g. imposed load) in addition to the permanent load. To investigate the effect of the variable actions a load ratio χ is defined representing the ratio of the variable load to the total load:
kk
k
QGQ
(2.6)
The partial safety factors applied in the calculations are taken from EC0 assuming an office building.
In case of simply supported steel beams the load capacity for hot rolled IPE sections is calculated and compared. In Fig. 2.5 the vertical axis represents the ratio of the characteristic values of the variable load in the serviceability and ultimate limit state QSLS/QULS, while the horizontal axis shows the span of the beam L. The assumed data for the calculation are S235 steel quality, χ=0.5 and wmax=L/250. Below the horizontal line at QSLS/QULS the deflection limit is decisive. It is obvious that for larger section sizes larger spans can be achieved and for longer spans the deflections become more decisive.
Figure 2.5 Serviceability vs. ultimate load for steel IPE beams.
0
0.5
1
1.5
2
2.5
3
0 5 10 15 20 25
QSL
S/QU
LS
L [m]
IPE 100IPE 200IPE 300IPE 400IPE 500IPE 600

18
2.2.2.4 Deflection of reinforced concrete members The deflection limits for concrete structures – recommended in EN 1992 (CEN, 2004a) – should also take into account the nature and function of the structure, as well as the, type of the finishes, partitions and fixings.
The appearance and general utility of the structure may be impaired when the calculated sag of a structural member subjected to quasi-permanent loads exceeds L/250, where the sag is considered relative to the supports. This criterion represents a limit for wmax. Precamber may be used to compensate for some or all of the deflection but any upward deflection wc should not generally exceed L/250.
Deflections that could damage adjacent parts of the structure should also be limited. For the deflection after construction, L/500 is normally an appropriate limit for quasi-permanent loads. It means that the damage criterion is considered by limiting w2+w3 here. Of course other limits may be considered, depending on the sensitivity of adjacent parts. In case of concrete the effect of creep and cracking should be taken into account. Crack members behave in a manner intermediate between the uncracked and fully cracked state. The maximum deflection then might be calculated as:
12max )1( (2.7)
where δ1 and δ2 are the deflections calculated assuming uncracked and fully cracked conditions respectively. The distribution coefficient ζ – taking account of the degree of cracking – is defined as:
2
1
sr
s
(2.8)
where β is the coefficient taking into consideration the influence of the duration of loading; σsr is the stress in the reinforcement at first cracking and σs is the stress in the reinforcement under service load.
For loads with a duration causing creep, the total deformation including creep may be calculated by using an effective modulus of elasticity Ec,eff:
),(1 0, t
EE cm
effc
(2.9)
where Ecm is the secant modulus of elasticity of concrete and φ(∞,t0) is the final creep coefficient.
Similarly to (Honfi and Mårtensson, 2011) the required height of a simply supported beam in SLS hSLS and ULS hULS are calculated assuming that the reinforcement ratio ρ is unchanged.

19
In Fig. 2.6 the ratio between hSLS and hULS is presented for different load levels qtot, for a given load ratio χ=0.5. The assumed data for the geometry of the beam are L=6 m, L/b=20, d/h=0.92 and ρ=0.01. For the material concrete C25/30 and reinforcement B500 are applied. Above the horizontal line at hSLS/hULS=1 the deflection limit is decisive. It is evident that for longer spans the deflection requirement is more critical.
Figure 2.6 Serviceability vs. ultimate required height for RC members.
2.2.2.5 Deflection of timber beams In case of timber EN 1995 (CEN, 2004b), also referred as EC5, gives a different definition of deflections than EC1990 (CEN, 2002) (see section 2.2.2.2). The components of deflection resulting from a combination of actions are shown in Fig. 2.7, where the symbols are defined as follows: u0 is the precamber; uinst is the instantaneous deflection; ucreep is the creep deflection; ufin is the final deflection and unet,fin is the net final deflection.
Figure 2.7 Definition of vertical deflections for timber beams (CEN, 2004b).
0
0.5
1
1.5
2
2.5
2 3 4 5 6 7 8 9 10
h SLS
/hU
LS
L [m]
10
15
20
25
30
qtot [kN/m]
ufinuinst
ucreep
u0
unet,fin
L

20
The deformations of timber are also time-dependent. The instantaneous deformation uinst under an action should be calculated on the basis of mean values of the appropriate stiffness moduli. According to EC5 the final deformation ucreep of timber beams under long-term load should be calculated as:
o For permanent actions:
)1( definstcreepinstfin kuuuu (2.10)
o For variable actions:
)1( 2 definstcreepinstfin kuuuu (2.11)
where kdef is the creep factor depending on the type of the wood-based material and the service class. This definition is not equivalent to calculating the deflections from the quasi-permanent load combination. For variable loads Eq. (2.10) includes the rare and the quasi-permanent part of the variable action. This leads to a significantly higher load level than in case of concrete for instance.
In case of simply supported timber beams the required depth in serviceability limit state hSLS and ultimate limit state hULS is calculated and compared for different design situations similarly to (Honfi and Mårtensson, 2011). The calculations are based on the prescriptions of EC5. Rectangular beams with width b, depth h and span L are considered. The beams are assumed to be regularly spaced with spacing c and the loads Gk and Qk are uniform and specified per unit area.
The ratio between hSLS and hULS is taken as an indicator on which of the criteria is decisive in the design of the beam. For hSLS/hULS greater than 1 the dimensions of the beam are governed by the deflection limit. The beams were assumed to be straight, i.e. no precamber is applied (u0=0).
The deflection limits applied and how they were calculated are as follow:
o Instantaneous deflection (i.e. wtot in short-term):
400)(
3845
,0
4 LQG
IEL
u kkmean
inst (2.12)
o Final deflection (i.e. wtot in long-term):
200
)1()1(384
52
,0
4 LkQkG
IEL
u defQkdefkmean
fin (2.13)

21
o Net final deflection (i.e. wmax in long-term):
300
)1()1(384
502
,0
4
,L
ukQkGIE
Lu defQkdefk
meanfinnet (2.14)
Although it is not indicated in EC5, from the EC0 prescription it seems to be logical to use an additional criterion as suggested by Thelandersson (1995). For the deflection from the time dependent part of the permanent loads and the variable loads (i.e. w2+w3 in long-term):
400
)1(384
52
,0
4
,2L
kQkGIE
Lu defQkdefk
meanfin (2.15)
In Eqs. (2.12-2.15) the shear deformations are not considered for the sake of simplicity. However, their effect for structural timber beams may be significant. Fig. 2.8 shows the ratio between the required beam height in SLS and ULS, hSLS/hULS as a function of the ratio L/hSLS. The calculations were made assuming a glulam beam GL 37 with a load ratio χ=0.5. For timber beams the dimension is also determined by the deflection requirement for moderate and by the ultimate failure for higher loads (Mårtensson and Thelandersson, 1992). With the applied deflection limits the net final deflection criterion Eq. (2.14) governs the design. However, it can be different for different limits and applying a precamber. Usually, L/hSLS is between 15 and 30 in practice which indicates that the deflection criteria are decisive in the majority of cases.
Figure 2.8 Serviceability vs. ultimate required height for timber beams.
0
0.5
1
1.5
2
10 20 30 40
h SLS
/hU
LS
L/hSLS
uinstufinunet,finu2,fin

22
Limits of deflections are also recommended in EC5; however, the suggested values are not compulsory. In Table 2.4 the EC5 recommendations are compared with suggestions from other references: ENV 1995 (CEN, 1994) i.e. the previous version of EC5, recommendation by Bainbridge and Mettem (1997), DIN 1052:2008 (DIN, 2008) and the findings from Paper VI based on a probabilistic time-variant analysis. Since deflection limits often govern the design of timber beams, it is evident that further investigation is needed in this topic.
Table 2.4 Deflection limits for timber floor beams.
Type of limit state
Criterion Def. ENV 1995
EN 1995
Bainbridge and Mettem (1997)
DIN 1052
Paper VI
Irreversible Damage u2,inst L/300 - - - - Reversible Comfort u1,inst - - - 6mm - Reversible Comfort uinst - L/300-500 L/333,
14mm- -
Irreversible Damage u2,fin L/200 - L/250 - L/600 Irreversible - ufin - L/150-300 - - - Reversible Appearance unet,fin L/200 L/250-350 - - L/150
2.2.2.6 Comparison of traditional structural materials To compare the prescriptions for different materials described in the previous sections, typical deflection limits associated with the appearance and damage criteria are collected in Table 2.5. In the table C indicates characteristic load combination, QP refers to quasi-permanent, whereas QP* denotes a description of the long-term loading different from QP. It is evident that the suggestions in the material standards (or their NAs) are do not fully comply with the general recommendations in EN 1990. This may be a source of confusion, thus should be solved by the code writers.
Table 2.5 Typical deflection limits for beams made of different materials.
Deflection Criterion Steel Concrete Timber wmax Appearance L/250 C L/250 QP L/400 C, L/300 QP*
w2+w3 Damage L/300 C L/500 QP L/400 QP*

23
2.3 Vibrations
This thesis is mainly focused on static deflections. However, dynamic deflections of structures are very important from a serviceability point of view. Dynamic loads can be transient and short in duration i.e. less than the natural period of structure or cyclical and long in duration i.e. steady-state (Galambos et al., 1973). The risks associated to vibrations are human discomfort, malfunction of equipment and machinery, and damage to structural and non-structural elements (e.g. due to fatigue).
Vibration causing human discomfort in buildings can be divided into whole-body vibrations or vibrations which influence only a part of the body. Although extensive research has been carried out in the last decades concerning vibrations in buildings (Crist and Shaver, 1976; Ohlsson, 1982; Ellingwood and Tallin, 1984; Bachmann and Ammann, 1987 and Johansson, 2009), there are no clear limits for acceptable magnitudes of vibration in buildings. However, some guidance is given in ISO 2631-2:2003 (ISO, 2013). The response of humans to vibration is highly subjective and dependent on a many factors. Different people will react differently to the same vibration (inter-subject differences), and the same person may respond differently to the same vibration under different circumstances (intra-subject differences), see Pavic and Reynolds (2002).
Relevant parameters describing vibrations are frequency, acceleration, velocity, amplitude and damping. As a simplification, dynamic deflections are often transformed into equivalent static deflections in design codes and define deflection limits for them. In the past limiting of live load deflections was used to avoid unacceptable vibrations (Percival, 1979).
Vibrations are especially important when designing modern light-weight floor systems. According to Mohr (1999) there are 3 fundamental requirements that should be satisfied to control the vibrations of timber floors:
1. Frequency requirement to avoid resonance due to repeated cyclic actions,
2. Stiffness requirement for impulses with longer duration (e.g. footfall) and
3. Mass requirement for impulses with shorter duration (e.g. heel-drop).
The frequency requirement can be interpreted as a limitation of the instantaneous deflection under quasi-permanent loads to provide a first natural frequency above 8 Hz (Hamm et al., 2010). The stiffness requirement is often investigated as the deflection under a concentrated load to avoid unacceptable accelerations due to

24
footfall action, whereas the mass requirement is expressed as a limitation of the vibration velocity (Ellingwood and Tallin, 1984).
Criteria for other type of vibrations in buildings i.e. affecting the building structure and building contents are covered by ISO 10137:2007 (ISO, 2012).
2.4 Cracks
The width of cracks in reinforced concrete and other brittle materials is usually limited, since cracks may (Tichy, 1993):
o Initiate corrosion,
o Decrease the sound-proofing of the structural element,
o Have a bad influence on the odour control of the structure,
o Be visually disturbing and
o Poorly affect the fire resistance of the structure.
However one should always keep in mind that cracks cannot be totally avoided. An effective, but expensive, technology to control cracks of reinforced concrete is pre-stress. Due to the limitations of this thesis problems associated with cracking will not be further investigated. However, concerning static deflections it is important to note that cracking due to stiffness reduction will have a direct effect on deflection of concrete structures. More information on the topic can be found e.g. in. (Gergely and Leroy, 1968; Tammo, 2009).

25
3 Serviceability issues in current design practice
This chapter contains a discussion about some serviceability issues related to current design practice based on the results of expert interviews. First previous research involving expert opinion is briefly reviewed. Then results from research interviews carried out by the author are presented. The first group of interviews is related to traditional structural materials. The second one is concerned with glass used in structures.
3.1 Previous surveys involving experts
When developing designs and guidelines it is important that they should reflect to design practice. Therefore experts’ opinion might be useful for researchers.
A good example is the update of the ANSI A58 code (ANSI, 1972) in 1972. Since the statistical models of live loading were not developed enough to provide a solid foundation to be used in the code, a survey with 25 experts was performed using Delphi Method (Corotis et al., 1981)
The method is a structured group communication characterised by anonymity of respondents from a panel of experts, controlled feedback with a statistical description of responses, and multiple iterations to reach a consensus. Using the method the most unbiased and reliable result can be obtained. As a result of the survey the nominal live loads were reduced for some floor types.
A Delphi with 20 participants was also used as a basis for estimating wind load statistics to improve ASCE 7-95 (ASCE, 1995) as presented by Ellingwood and Tekie (1999). Based on the results of the Delphi the wind probabilistic wind load model was improved and an increase of the wind load factors was proposed to achieve more consistent reliability in the LRFD design.
Expert judgment was used by Ter Haar et al. (1998) to determine distribution functions of deflection limits for industrial steel buildings. Because of lack of

26
experimental data, the subjective expertise of structural steel designers was attempted to be extracted in order to obtain statistical parameters of reliability-based serviceability performance functions. Some results from the study were used in Paper VI.
A serviceability survey of structural engineers was undertaken by Reid (1981) in 1978. The aim of the qualitative survey was to obtain a listing of serviceability failure types and causing effects. Moreover their practical significance was investigated. Tables were prepared listing a variety of structural elements and associated sets of serviceability failure modes, failure consequences and causing effects. In order to consider material dependencies, separate tables were prepared for different materials (reinforced concrete, masonry, steel and timber). The tables were distributed to selected engineers to provide information regarding additional failure modes and estimates of the significance causes. From the survey it was concluded that the most significant serviceability problems are:
o Lateral deflections of slabs and beams (RC, steel, timber) and walls (masonry);
o Axial deflections columns (RC);
o Durability of all types of construction;
o Sway deflections (RC, steel);
o Vibration of slabs (RC), beams (steel) and frames (steel);
o Cracking of slabs (RC).
The primary causes behind these problems were identified as material degradation, creep deflection, ponding, material incompatibilities and dynamic actions. The main conclusions of the survey are that: (1) time dependent phenomena are much more important than generally assumed in practice (2) more sophisticated analysis of material behaviour and interactions is required in design (Turkstra and Reid, 1993).
A second serviceability survey was carried out by Reid in 1980 (Reid, 1981). Major building developers were interviewed about the attitude of building owners towards building problems, which involve only maintenance and repair. Personal experience of structural serviceability problems amongst those interviewed were: corrosion of reinforced concrete floors in heated garages, leaking roofs, water penetration of masonry, shrinkage cracking of slabs on grade, excessive roof beam deflection under snow load, door blockage due to frost heave of a sidewalk, sagging floor, uneven floor, chalking slab and differential settlement problem. According to the building developers the risks associated with serviceability were not significant and often borne by the tenants. However, commercial real estate developers showed aversion to unserviceability.

27
A survey on safety issues with structural glass was performed by Bos (2009) in order to discover, which general premises with regard to safety are being held, how they are translated into practice, and to analyse to what extent opinions on these issues differ. The survey contained a questionnaire, which was filled out by 21 respondents. That was followed by 6 personal interviews. The interviews have shown that the safety approaches are in line with each other. However, there is no generally accepted unifying structural glass safety concept. Unfortunately, it makes practically impossible to objectively discuss the different views and develop a commonly accepted set of performance requirements.
3.2 Serviceability issues of traditional structural materials
2011 was the end of transition from BKR, the Swedish Structural Design Code, (Boverket, 2010) to the Eurocode family. This step raised several interesting questions in the Swedish engineering society.
o How will the general safety level of structures be affected by the new regulations?
o How will the senior engineers’ experience with the old codes be used with the new guidelines?
o How can the companies implement the changes?
o What will be the role of those young engineers, who have already been educated with the new code?
One question was extremely interesting for the author of this thesis. Since the Swedish code was quite liberal with the question of serviceability, how is the current design practice in Sweden compared to Eurocodes. To investigate this question, personal interviews with structural engineers were conducted. The questions and the results of the interviews are presented in Paper III. The broad and usually open-ended questions were divided in 4 groups:
o General data about the interviewee;
o Questions about the experience of the respondent;
o Questions about design considerations;
o Questions about existing structures.
The main findings of the interviews are summarised as the follows.
Originally 20 persons were interviewed. The aim of the study was to investigate serviceability in relation to buildings. Therefore, one of the responses – from a bridge

28
designer – was ignored in the analysis of the results due to the lack of significant experience with buildings. The interviewees mostly work with steel and concrete structures, some of them design timber structures as well. Almost all of them are involved in designing residential and office buildings and nearly the half of them work with industrial and long-span buildings. The average experience was more than 20 years.
A detailed analysis of the results is given in Paper III; however, some points of the discussion will be highlighted here as well. One of the questions was about deflection limits. The answers and opinions were quite different. Engineers usually use different limits for different situations depending on the function and use of the structural element. The main categories identified in the interviews were ordinary beams and slabs; cantilevers; industrial or long-span buildings and roofs. Within these categories different criteria may be applied based on the:
o The type of material used;
o Importance of the building/client;
o Loading considered.
The answers for ordinary slabs and beams are given in Table 3.1. In the table G refers to permanent load, Q to variable load and ψ to load reduction factor.
Table 3.1 Recommended deflection limits by the interviewees for ordinary beams and slabs (Paper III).
Type of the answers Deflection limit General limit L/400
L/200-300 absolute values: 10, 15, 20 mm
Different limits with different load combinations
L/400 (G+Q); L/600 (Q) L/300 (G+Q); L/400 (G+ψQ) L/600 (Q); L/600 (G); L/300 (G+Q)
Different limits based on the importance of the building/client:
L/400 (important: public buildings, big contractors) L/300 (less important: industrial, warehouse; small contractors)
Different limits for different materials: steel: L/250; L/600 concrete beams L/500 timber: L/450; L/600
It is not surprising that different designers use different deflection limits in similar design situations. Control of deflections involves engineering judgement to reflect on the fuzziness of the serviceability problem mentioned in Section 2.1. However, it is more interesting that only 4 of the 19 respondents made a distinction between

29
deflections due to the total load and deflections due to variable loads only. It means that they are perhaps not aware of the fact that different deflection limits reflect to different design criteria i.e. damage to other elements, appearance or even vibrations.
When asking about the load level applied in serviceability limit state, most of the respondents answered that they do everything according to the code. However, some of them claimed that they use reduced or increased loads, thus do not follow the design code very strictly. The different approaches they described are as follows:
o In some cases (e.g. heavy concrete structures, important elements) the ULS loads are applied even for calculating deflections.
o If more than one variable loads act at the same time, none of them are reduced, i.e. the combination factors are ψ=1.0.
o Wind action is never reduced, even if it is not the leading action, i.e. ψ=1.0.
o An extra permanent load (1 kN/m2) is always added to represent installations.
o Simply 50% of the ultimate load is taken as service load.
Deviations from codes and guidelines may indicate both confidence and insecurity. Experienced designers might have the feeling that some prescriptions are too conservative or un-conservative. Since the consequences of serviceability failure are usually less severe than in case of safety, engineers with relevant experience tend to use rules for serviceability less strictly. On the other side, inexperienced engineers may be afraid of making mistakes and tend to overestimate loads to always be on the safe side even in serviceability considerations.
Considering long-term effects the respondents were mostly reflecting to concrete structures. The effect of creep is considered using a creep factor φ=1.0-3.0 depending on the surrounding environment. Some respondents had the opinion that φ=3.0 for indoor conditions is too high and a reduced value should be used based on experience. Some others mentioned that more advanced methods are available. However, those more advanced methods are not very reliable, since usually there is not accurate information about the age at loading, especially at an early design stage. Furthermore the effect of creep can be different from element to element due to differences in time of casting. Thus it is more practical always to assume the worst case scenario i.e. φ=3.0 to be on the safe side. A comment from the author is that a similar problem applies for timber structures, where the relative creep depends on the moisture content. Since the initial moisture content depends on the production and construction circumstances, its prediction might be difficult in the design phase.
Regarding the load combination for long-term deformations a proposed approach is to check first if the concrete will crack or not, using the short-term load combination. Then the final deformations are calculated with the reduced long-term loads.
30
However, some respondents did not mention any differentiation in the short- and long-term loading.
Although the study presented in Paper III was carried out in Sweden, some general conclusions can be drawn:
o The observation that in many practical cases the serviceability limit state governs the design seems to be true.
o The deflection limits, where no exact and/or compulsory rules are given, vary quite a lot among different designers. There is an uncertainty among designers how to design for serviceability and a mixture of experience, handbooks and regulations is adopted.
o The choice of load combination used in the design for SLS varies, depending on engineer and on circumstances. How to take into consideration the loads when dealing with long-term effects is not always straightforward for the practising engineers and they tend to develop their own rules to be safe.
o When designing for serviceability, some people tend to be less conservative and some tend to be more conservative than the recommendations in codes or guidelines.
There is a general need for better knowledge about serviceability among the designers. In terms of codified design, it does not necessarily means to give more detailed instructions on serviceability design, but to increase the understanding of the underlying principles. This may relate to the physical meaning of various deflection criteria, the likelihood of exceeding them at different load levels and considered type of loading, and the possible consequences of serviceability failure.
The simultaneous usage of several design codes, guidelines and recommendations require proper understanding of their principles and limitations. This is not always easy, since some of those documents do not provide with references. For instance when using a certain code for loads and another one for the performance criteria (e.g. deflection limits) those must be suitable to each other.
Subjective and vague definitions and requirements will be interpreted differently by individuals and that should be considered when writing guidelines, handbooks and educating people.
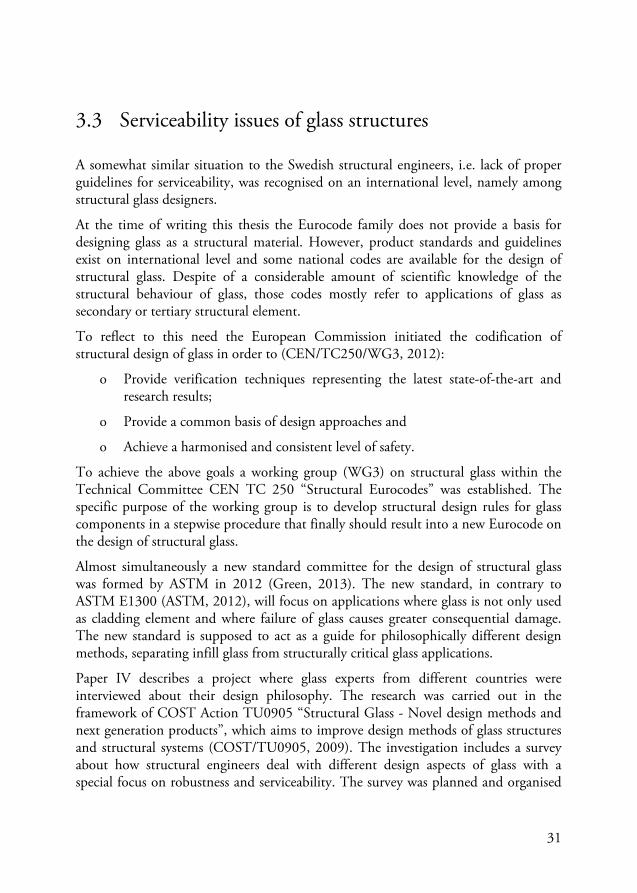
31
3.3 Serviceability issues of glass structures
A somewhat similar situation to the Swedish structural engineers, i.e. lack of proper guidelines for serviceability, was recognised on an international level, namely among structural glass designers.
At the time of writing this thesis the Eurocode family does not provide a basis for designing glass as a structural material. However, product standards and guidelines exist on international level and some national codes are available for the design of structural glass. Despite of a considerable amount of scientific knowledge of the structural behaviour of glass, those codes mostly refer to applications of glass as secondary or tertiary structural element.
To reflect to this need the European Commission initiated the codification of structural design of glass in order to (CEN/TC250/WG3, 2012):
o Provide verification techniques representing the latest state-of-the-art and research results;
o Provide a common basis of design approaches and
o Achieve a harmonised and consistent level of safety.
To achieve the above goals a working group (WG3) on structural glass within the Technical Committee CEN TC 250 “Structural Eurocodes” was established. The specific purpose of the working group is to develop structural design rules for glass components in a stepwise procedure that finally should result into a new Eurocode on the design of structural glass.
Almost simultaneously a new standard committee for the design of structural glass was formed by ASTM in 2012 (Green, 2013). The new standard, in contrary to ASTM E1300 (ASTM, 2012), will focus on applications where glass is not only used as cladding element and where failure of glass causes greater consequential damage. The new standard is supposed to act as a guide for philosophically different design methods, separating infill glass from structurally critical glass applications.
Paper IV describes a project where glass experts from different countries were interviewed about their design philosophy. The research was carried out in the framework of COST Action TU0905 “Structural Glass - Novel design methods and next generation products”, which aims to improve design methods of glass structures and structural systems (COST/TU0905, 2009). The investigation includes a survey about how structural engineers deal with different design aspects of glass with a special focus on robustness and serviceability. The survey was planned and organised

32
in a joint collaboration between the Glass and Façade Technology Research Group at the University of Cambridge and the Division of Structural Engineering at Lund University under Dr Mauro Overend’s supervision.
Since the publication of the paper the number of interviews has increased to 24. The selection criterion was to have significant experience (at least 8 years) in designing with glass structures, thus 2 interviews were omitted from the final evaluation. A detailed analysis of the answers related to serviceability questions from 22 respondents will be discussed here. The questionnaire can be found in Appendix A.
The first set of questions contains general data about the respondents. The distribution of age and position is presented in Fig. 3.1, whereas the company size and country is given in Fig. 3.2. Fig. 3.3 shows the distribution of experience and the time spent on glass related structures among the interviewees. In Fig. 3.4 the typical field of working (facades/structural glass) and the most commonly used standards and guidelines are presented.
Figure 3.1 Distribution of age (left) and position (right) of the respondents.
Figure 3.2 Distribution of company size (left) and office location (right).
1
6
10
5
Age (years)
Under 35
35-44
45-55
Above 55
4
10
6
2
Position
Structural engineer
Group leader
Company leader
Project manager
4
5
6
7
Company size
Below 10
11-100
101-1000
Above 1000
9
6
2
1
1
1
1
1
UK
The Netherlands
Austria
Germany
USA
Canada
Italy
France
Country

33
Figure 3.3 Distribution of experience (left) and percentage of working with glass (right).
Figure 3.4 Distribution of field of working (left) and codes/guidelines used in design (right).
The first part of the interviews was about structural robustness and the answers showed a more or less consistent pattern. However, concerning serviceability the responses were less uniform. There were many comments on the lack of proper design guidance in codes. On the other side everyone agreed that serviceability criteria are very project dependent.
Most designers believe that the deflection of glass itself is not really a problem, since it is very flexible. However, human perception to glass structures is probably different than to those made of traditional structural materials, since it is considered more fragile and therefore dangerous. Furthermore transparent structures catch more attention from users than ordinary structures, thus deflections limits should usually be stricter for structural glass. The main problem with deflection of glass structures is their connections. Excessive deflection of the glass panels will increase deformations at the joints and the increased strains may break the bond.
2
7
8
41
Experience (years)
0-910-1920-2930-39More than 40
5
65
6
What % of the time is spent on glass or glass-related structures?
0-24%
25-49%
50-74%
75-100%
6
214
What is the field you are working in?
Facade engineering
Structural glass
Both
131111
866
53
European (prEN 13474)American (ASTM E1300)
German (DIN 18008, TRLV/TRAV)Textbooks, scientific publications
Australian (AS 1288)Dutch (NEN 2068)
British (BS 6262, BS 6206)Own guidelines based on experience
Which design codes and/or guidelines do you use when designing glass structures?

34
With regard to vertical glass panels the following service criteria may be important:
o Damaging deflections (i.e. damage of the joints, damage to the glass due to contact with hard material);
o Appearance (i.e. aesthetics) and
o Comfort (i.e. feeling safe).
The limit for the damaging deflection depends very much on the actual structural configuration. Boundary conditions, supporting and joining material will determine when damage occurs. For the appearance no straightforward limits exist. Those should be decided based on engineering judgment and consultation with the architect or the client. The comfort criterion is mainly associated with vibrations. Limiting the deflections should ensure that movements of the panels are not annoying to the occupants, since movements and deflections of large glass panels may be scary.
A summary of the deflection limits used/recommended by the interviewees is presented in Table 3.2.
Table 3.2 Recommended deflection limits by the interviewees for glass structural elements.
Type of element Deflection limit General elements L/150-200
L/60-65 L/500-1000 (psychological comfort) No limit 25-100 mm L/300 (edges)
Barriers, balustrades
L/50-125 25 mm
Cable facades
L/30-50 (recommended) L/100-200 (used in some countries, but found too conservative)
IGUs L/50-90 L/170-175 (used in some countries, but found too conservative)
Floors L/200-360 L/500 (to control vibration)
Beams, fins L/200-360 50 mm (if supporting element)
Support structures L/175 (50 year load) L/240 (reduced load level) 60 mm

35
When deciding upon the applied deflection limit, the location of the member within the building is also important. An outer panel on a façade loaded by the wind could have stricter limit than a partition wall inside the building occasionally hit by people. Several limit values were mentioned by the respondents from L/1000 to L/30 (or even no limits) depending on the circumstances (function of the element, the structural system etc.).
In case of floors the interviewees also had quite different opinions from L/200 to L/500; however, usually they said that vibrations are more important for floors.
A general opinion is that deflection of beams is usually not an issue; since the deflections are small even at ULS and glass beams do not carry brittle finishes. However, stability problems are more critical for beams (e.g. lateral torsional buckling). Often deflection of glass supporting elements is more interesting than the deflection of the glass element itself. Sometimes during the design process the supporting elements are already there or designed by a partner. The required information should always be obtained and displacements and movements of the structure should be balanced
Fig. 3.5 shows that the majority of the interviewees think that deflection limits often govern the design. Beams, fins, cantilevers and columns (i.e. primary and secondary structural elements) are usually stress controlled and deflection limits are less important. Floors and stair treads are more deflection limit governed; however, it is probably due to vibrations control and the appropriate limits are not always clear.
Figure 3.5 Importance of deflection limits according to the respondents.
Deflections tend to govern the design where local stress concentrations do not cause problems (i.e. there are no holes in the panel). Insulated glass unites (IGU) and panels made of toughened glass are more sensitive to the deflection criterion.
The next group of questions was related to vibrations. Less than half of the respondents said that the vibrations should always be controlled, see Fig. 3.6 (left).
123
6
Do deflection limits often govern the design?
Yes
No
Depends/sometimes

36
The general method is limiting the natural frequency of the structure/structural element. Since the panels are usually regular with simple support conditions it is not often complicated at element level. The most common opinion was that the frequency should be above 4 Hz, which is related to human walking. However, more complicated criteria may be applied for horizontal vibrations of stairs, vibrations from wind and earthquakes. It should be mentioned that almost as many interviewees answered that the vibrations do not have to be controlled, since normally they do not cause any problem, see Fig. 3.6 (left). The same diversity was found, when their opinion about the importance of vibrations were asked, see Fig. 3.6 (right). The situations, where vibrations are important include staircases, floors, pedestrian bridges and sometimes external facade elements. However, vibrations for facades seem to be very rarely important, only if there is no proper wind load on the building.
Figure 3.6 Consideration of vibrations (left) and their importance (right) for glass structures.
The next set of questions was related to existing structures. The majority of the answerers claimed that they have encountered serviceability problems in existing glass structures, see Fig. 3.7. Especially if the client does not follow the operational manuals, problems arise due to deterioration.
Figure 3.7 Frequency of serviceability problems at existing structures.
10
4
8
How do you deal with the vibrations?
Always shouldbe checked
Depends on thesituation
Normally not anissue
4
68
4
Are vibrations often important in your work?
Often
Sometimes
Rarely
Never
14
8
Have you ever encountered serviceability problems in existing glass structures?
Yes
No

37
The most common serviceability problems for glass structures according to the respondents are presented in Fig. 3.8.
Figure 3.8 Examples of observed serviceability problems at glass structures.
They are as follows:
o Too flexible large vertical panels;
o Excessive deflections;
o Interface problems (seal failure, water tightness);
o Vibrations at staircases.
As a conclusion of the survey, it seems that – just like at traditional structures – there is a general need for better knowledge and guidance about serviceability and the respective criteria. Currently, several guidelines and recommendations are used simultaneously, therefore a generally accepted unifying concept for serviceability would be appreciated.
7
6
5
3
Flexible large vertical panels (e.g. doors)
Excessive deflection (e.g. roof ponding, canopies)
Seal failures, water tightness, interface problems
Human induced vibrations (e.g. staircases)

38

39
4 Structural reliability
Design of structural systems includes a number of uncertainties, such as loads, dimensions, material properties, connection behaviour, system modelling, construction and design errors etc. Structural design has traditionally been based on deterministic methods, using safety margins determined from experience and engineering judgement. However, these uncertainties should be handled in a more rational way based on probabilistic methods.
Reliability of a structural system could be defined as the probability that the structure has a satisfactory performance over its intended lifetime (i.e. it does not collapse or becomes unsafe and that it fulfils certain functional requirements). Structural reliability methods are used to estimate the probability of failure and malfunction. This chapter provides an introduction to structural reliability theory based on the works by Thoft-Christensen and Baker (1982), Melchers (1999), Nowak and Collins (2000), Sørensen (2004), Madsen et al. (2006) and Faber (2008).
4.1 Fundamentals
A fundamental concept of the reliability theory is the limit state principle. A limit state is a condition of a structure beyond which it no longer fulfils the relevant performance criteria. It is convenient to describe a limit state with the limit state function (LSF). Considering the simply case of member failure the limit state function could be written as:
SRSRg , (4.1) where R represents the resistance of the member (or more generally the capacity) and S is the effect of the actions on the member (the demand).
The limit state function in this fundamental case divides the space into two subspaces: a safe and an unsafe region (see Fig. 4.1).

40
Figure 4.1 Interpretation of the limit state function.
In the fundamental reliability case R and S are stochastic variables with certain probability density functions (PDF). The probability of failure pf can be expressed as:
0, SRgPp f (4.2)
Under the condition that R and S are statistically independent random variables with continuous probability density functions (fR and fS respectively), the probability of failure can be expressed as:
dxxfxFp SRf
(4.3)
where FR is the cumulative distribution function (CDF) of R. The integration in Eq. (4.2) is illustrated in Fig. 4.2.
Figure 4.2 Illustration of the integration to calculate the failure probability over the realisations of the resistance R and the load effect S, after Faber (2008).
SR
fR(r),fS(s)
xr,s
r,s
fpf(x)

41
Alternatively the probability of failure can be written as:
dxxfxFp RSf
1 (4.4)
where FS is the CDF of S. Eqs. (4.3) and (4.4) can only be solved analytically for some special cases. Such a case is when R and S are independent and normally distributed variables and the LSF is linear (fundamental case). Then the probability of failure can be written as:
0 MPp f (4.5)
where M is the safety margin, given as:
SRM (4.6) Since R and S are normally distributed, the mean value μM and the standard deviation σM of M can be calculated:
SRM (4.7) and
SRM (4.8) In the above equations μR and μS are the mean values, while σR and σS are the standard deviations of R and S respectively. Since M is a linear function of two normally distributed random variables, it is also normally distributed and (M-μM)/σM has a standard normal distribution (i.e. μ=0 and σ=1). Hence the probability of failure is:
M
M
M
Mfp 0
(4.9)
where Φ is the standard normal distribution and β is the Cornell reliability index defined as (Cornell, 1969):
M
M
(4.10)
A graphical interpretation of the reliability index and the probability of failure are presented in Fig. 4.3. β gives the number of standard deviations σM by which the mean value μM exceeds zero. The probability of failure pf is the area under fM (the PDF of M) in the interval [-∞≤x≤0].

42
Figure 4.3 Illustration of the reliability index β and the failure probability pf.
The reliability index β as defined in Eq. (4.9) will change, when different but equivalent limit state functions are used. For example using the following equivalent safety margin:
)/ln(lnln SRSRM (4.11) one gets:
)/ln(
)/ln(
SR
SR
(4.12)
That means that the Cornell reliability index is not invariant i.e. depends on the definition of the limit state function. To overcome this problem another definition of the reliability index was introduced by Hasofer and Lind (1973).
In general the LSF is non-linear and a function of several random variables X1,...,Xn, which are not necessarily independent and can be expressed as:
Xgxxg n ,...,1 (4.13) where X is the vector of the basic random variables. The safety margin M=g(X) is thus not necessarily normally distributed.
Realisations of the basic variables are denoted by x=(x1,.., xn ), i.e. x is a point in the n-dimensional basic variable space. Hence the limit state function can be written as:
0,...,1 nxxgg x (4.14)
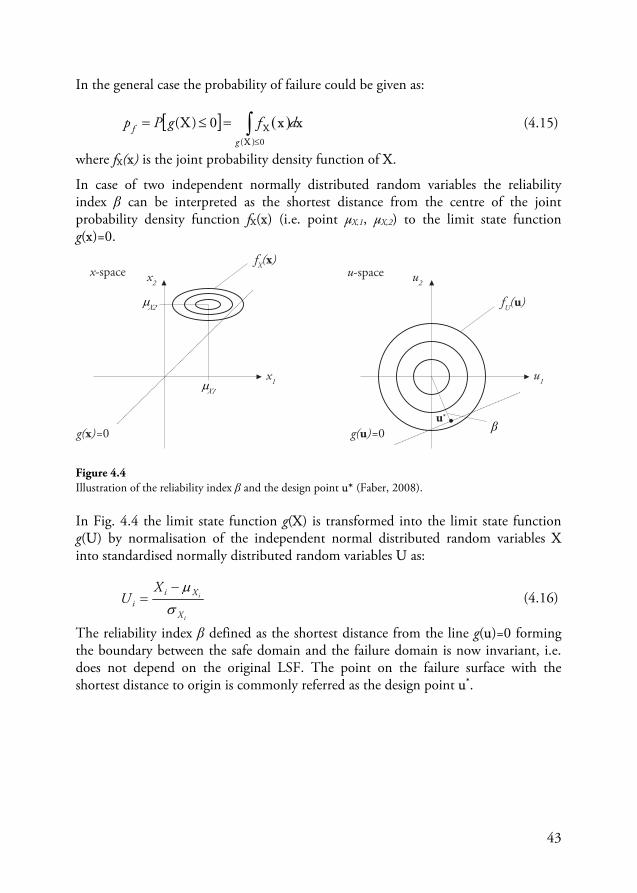
43
In the general case the probability of failure could be given as:
xxXX
X dfgPpg
f
0)(
0)( (4.15)
where fX(x) is the joint probability density function of X.
In case of two independent normally distributed random variables the reliability index β can be interpreted as the shortest distance from the centre of the joint probability density function fX(x) (i.e. point μX,1, μX,2) to the limit state function g(x)=0.
Figure 4.4 Illustration of the reliability index β and the design point u* (Faber, 2008).
In Fig. 4.4 the limit state function g(X) is transformed into the limit state function g(U) by normalisation of the independent normal distributed random variables X into standardised normally distributed random variables U as:
i
i
X
Xii
XU
(4.16)
The reliability index β defined as the shortest distance from the line g(u)=0 forming the boundary between the safe domain and the failure domain is now invariant, i.e. does not depend on the original LSF. The point on the failure surface with the shortest distance to origin is commonly referred as the design point u*.
x-space x2
x1
fX(x)
g(x)=0
u-space
fU(u)
g(u)=0
u2
u1
βu*
μX2
μX1

44
4.2 Reliability methods
4.2.1 Levels of reliability methods
Several numerical methods have been developed in the past decades to calculate the probability of failure by solving the integral in Eq. (4.3). Since there is a great variety of possible idealisations in reliability models, a categorisation among them is possible, based on the extent of information used in the model. Thus structural reliability methods are divided into different levels. Different levels of idealisation may be appropriate then to certain problems based on their importance.
Level 4 methods, go beyond the limits of classical reliability theory and are risk-based. Not only the failure probability, but the consequences of failure are considered in the analysis. Level 4 methods are appropriate for structures that are of major economic importance (e.g. nuclear power projects, transmission towers, highway bridges).
Level 3 methods are the most advanced purely reliability-based methods. The “exact” probability of failure is determined, thus a full probabilistic description of the joint occurrence of the random variables is required. Reliability is usually expressed in terms of reliability indices.
Level 2 methods involve certain approximate iterative calculation procedures to estimate the failure probability. The uncertain parameters are represented with a simplified description using two values (i.e., mean and variance) and the correlation between the parameters. The stochastic variables are implicitly assumed to be normally distributed.
Level 1 methods are semi-probabilistic methods. The uncertain parameters are modelled by one parameter only, the characteristic value. The characteristic values represent certain fractiles of the statistical distributions concerned. The uncertainty of the problem is taken into account by safety factors. The safety factors are determined to ensure appropriate levels of reliability in the design (target reliability). Examples of this method are the Load and Resistance Factor Design (LRFD) in North American standards and the Partial Safety Factor Method (PSFM) in Eurocodes.
The lowest level of modelling is the fully deterministic approach (level 0), where the safety margin is based on tradition and intuition.
In the followings a brief overview of the most important methods is given. Further information can be found in the literature e.g. (Thoft-Christensen and Baker, 1982; Melchers, 1999; Nowak and Collins, 2000; Madsen et al., 2006).

45
4.2.2 First Order Reliability Method (FORM)
As it was mentioned before the limit state function is, in general, non-linear, thus the failure probability can only be approximated. A possible way to do that is a linearization of the limit state function in the design point (in the standard normal space), see Fig. 4.5.
Figure 4.5 Illustration of the linearization of the limit state function in the design point u* (Faber, 2008).
The problem is that the design point is not known in advance, therefore it must be found using iteration. Since the reliability index is the shortest distance from the design point, the following optimisation problem is to be solved:
n
iigg
uu 1
2
0min
u (4.17)
The numerical calculation of the reliability index β can be performed in a number of ways. Given that the LSF is differentiable a simple iterative solution is:
n
j i
ii
gu
gu
1
2
(4.18)
0,,, 21 ng (4.19) First an initial guess for the design point is made u*=β and inserted into Eq. (4.18). Thus a new normal vector to the failure surface is achieved. Then the new -vector is inserted into Eq. (4.19) from which a new reliability index β is calculated.
u-space
fU(u)
g(u)=0
g’(u)=0
u2
u1
u*β
α
46
This iteration scheme will converge in a few steps and provide the design point u* and the reliability index β and the normal vector to the failure surface in the design point. The components of may be interpreted as sensitivity factors giving the relative importance of the individual random variables for the reliability index β. (Faber, 2008).
4.2.3 Second Order Reliability Method (SORM)
In FORM the limit state function is approximated by a linear function in the design point. Thus for failure functions with a high degree of non-linearity, estimation of the reliability index with FORM may be inaccurate. In those cases application of SORM is recommended, where the LSF is approximated by a 2nd order function in the design point. In this way the curvature of the limit state function is considered in the estimation of the reliability index. For small probabilities and low level of non-linearity FORM and SORM give approximately the same results.
FORM and SORM are level 2 methods, since they involve approximate iterative calculation procedures to estimate the reliability index and the stochastic variables are approximated with equivalent normal distribution functions. They cannot deal with discontinuous LSFs, multiple design points or estimate system reliability directly.
4.2.4 Monte Carlo Simulation (MCS)
Monte Carlo simulation technique is based on the generation of random numbers according to their cumulative distribution function. Thus with random sampling virtual observations can be made and the results can be statistically analysed.
The computation of failure probability according to Eq. (4.15) is equivalent to evaluating the integral:
xxXxx XX
X dfgIdfpg
f 0)(0)(
(4.20)
where I() is a so called indicator function taking a value of 1 if the condition in the bracket is true, and 0 otherwise. The integration domain in Eq. (4.20) is changed from the part of the sample space of the vector X=(X1,.., Xn) for which g(x)≤0 to the entire sample space of X.
MCS involves the generation of a large number N of realisations of random variables and counts how often the result are in the condition g(X)≤0.
If N realisations of the vector X, i.e. xi, i=1,2,..,N are sampled it follows that the failure probability is estimated as:
47
N
iif xgI
Np
1
0)(1 (4.21)
From Eq. (4.21), it is obvious that when pf is small, N has to be very large to get a reasonable estimate, which makes MCS unattractive, especially when the dimension of X is large or g(X) is not easy to evaluate (e.g. finite element method). In addition, the variance decreases slowly with N.
By using additional information to focus the simulation on the region close to the design point, both N and the variance can be significantly reduced compared to the crude MCS method described above.
Popular methods to improve the simulations are:
o Importance sampling,
o Directional simulation,
o Latin hypercube method,
o Adaptive sampling.
MCS is a level 3 method, since the probability is calculated based on the exact PDF and the exact LSF. More information on the topic can be found e.g. in (Melchers, 1999, Sørensen, 2004).

48
4.3 Time-variant reliability
Structural reliability is a function of time in many engineering situations. When a structure is subjected to a stochastic process loading (e.g. live loading) and/or the strength varies in time (e.g. due to deterioration) it might be necessary to determine the probability that a structural component enters the failure region during a given time period. The time-dependent reliability problem is illustrated in Fig. 4.6.
Figure 4.6 Illustration of the time-dependent reliability problem after Köhler (2007).
Both, the load effect and the resistance are represented as random processes and probability density functions for given times ta and tb are shown. It can be seen that the probability of failure is clearly higher at t=tb than at t=ta, i.e. the reliability of the structure decreased with time. The limit state function thus will be a function of time:
0)( tg x (4.22) where x(t) is the realisation of the stochastic process X(t). The probability of failure in the time interval [0,T] is then:
TttgPTp f ,0,01 X (4.23)
Since the evaluation of Eq. (4.23) is generally difficult, in practical situations approximations are used. Often an upper bound of the probability of failure in the time interval [0,T] is given:
s(t)
r(t)
R,S
ta tb
t
fR(r t=ta )
fS(s t=ta )
fR(r t=tb )
fS(s t=tb )

49
dttTpT
f 0
, (4.24)
where +(t,) is the out-crossing rate above the threshold and can be determined by suitable application of Rice’s formula (Rice, 1944). More information on time-variant reliability can be found e.g. in (Melchers, 1999, Rackwitz, 2001)
4.4 Load models
To assess the reliability of a structure one is especially interested in the effects of load. The magnitude of loads usually varies in time and space, therefore variable loads may be modelled as stochastic processes. Modelling of loads is very complex and the information about them is quite limited. In addition, estimation of loading means a prediction about future. Hence loading is usually the most uncertain factor in structural reliability analysis (Melchers, 1999).
It is often helpful to categorise loads based on their (Melchers, 1999; Faber, 2008):
o Origin (natural or man-made);
o Variation in space (fixed or free);
o Variation in time (permanent or variable);
o Rate of variation (static or dynamic).
A possible classification of loads after (Bachmann and Ammann, 1987) is given in Fig. 4.7. In the current thesis the focus is on static loading. Therefore dynamic loads will not be further discussed.
Permanent loads i.e. those which are more or less constant in time, may be modelled as random variables and characterised by their mean value and standard deviation. The most common permanent loads are the weight of structural and non-structural elements.
Variable loads that fluctuate in time (e.g. wind, snow, live loads etc.) are best described by stochastic processes. Their description is often very complex. If observations of the variable load are available over a period of time, the statistical properties of the load can be estimated directly from the data records (e.g. meteorological data). Maximum values for a certain time period can be extracted and the extreme value distributions may be used for time-invariant analysis. If instantaneous values are recorded (e.g. a real-time monitoring system is implemented), the point-in-time distribution function may be estimated and used for a time-variant reliability analysis.

50
Figure 4.7 Classification of loads on structures after Bachmann and Ammann (1987)
For man-made variable loads (e.g. live loads in buildings) sufficient long-term data is usually not available. Probabilistic description of loading is derived mathematically using data from short-term observation (e.g. load surveys) combined with plausible physical models and assumptions. Building live loads are discussed in detail in Chapter 5.

51
4.5 Resistance models
The resistance of a structural component mainly depends on the inherent properties of the structure. The structural capacity might be characterised by the strength and/or stiffness of the material, structural dimensions (i.e. geometry), boundary conditions etc. As a simple example the bending capacity of a steel member depends on the yield strength of the material and the section modulus. However, when lateral stability of the beam is considered, the support conditions, the span and stiffness must be considered as well.
The uncertainties of the material properties (strength and stiffness) are usually described by their probability distribution functions. These data are commonly provided by standardised test methods.
Geometrical uncertainties relate to the dimensions of the considered component or system. Typical examples are the concrete cover, out of straightness of columns, eccentricity of the loading etc. The most important aspect for the probabilistic modelling of uncertain geometrical quantities is their variability in space. The variation in time is usually not relevant. Since at the time of design the exact geometry is not known, design specifications and execution quality control are the only possible means to limit the uncertainty. On the basis of such specifications probabilistic models for the geometrical characteristics can be constructed (Faber, 2008). Due to tolerance specifications the uncertainties of geometrical quantities decrease with increasing structural dimensions. Therefore relatively large structural dimensions (e.g. spans) can often be modelled as deterministic variables.
Holický and Holická (1993) proposes the consideration of deviations induced by production procedures in addition to deformations due to loading when investigating serviceability limit states.
When the structure has been realised the material properties and the geometry of the structure may be assessed by measurements. Based on the measurements the probabilistic models may be updated. With the decreased uncertainties the confidence in the prediction of the failure probability may be increased.
Resistance models used in the current thesis are presented in Papers I and VI.

52
4.6 Design criteria for serviceability
Most studies, investigating structural reliability related to serviceability, consider the design criterion as a deterministic variable e.g. (Galambos and Ellingwood, 1986; Li and Melchers, 1992; Li and Melchers, 1993; Fridley and Rosowsky, 1993; Stewart, 1996a; Stewart, 1996b). However, the definition of a distinct serviceability limit is usually difficult. Therefore, it is a quite considerable variation in the design criterion. Thus this simplification cannot be justified.
Reid (1981) proposes an approach, where the effect of reduced serviceability is considered and the serviceability problem is regarded as a cost-optimisation problem, i.e. the consequences of serviceability non-compliance are taken into account. Serviceability is not considered as a binary function (e.g. satisfactory/unsatisfactory) with a discrete limit state. Therefore to calculate probabilities of serviceability failure a measure of structural utility is required. A lower and upper bound of serviceability is defined. Outside these limits the structural behaviour is fully acceptable or completely unacceptable, whereas within the limits a linear transition is assumed. The general measure of serviceability is given by the expected structural utility. There are however, some disadvantages of the proposed method:
o The upper and lower bounds are in fact not deterministic variables and the transition between them is not necessarily linear.
o The model requires many parameters, which are not easy to determine.
Similarly to Reid, two types of uncertainties are distinguished by Deák and Holický (1993) when analysing serviceability limit states:
o Vagueness in the definition of limit states and,
o Randomness of loads, mechanical and geometrical characteristics, sensitivity of occupants, attached structural components and equipment.
While randomness could be handled mathematically with probabilistic methods, vagueness is suggested to be handled with the theory of fuzzy sets. With the model using fuzzy set theory (Holický and Östlund, 1993, Holický, 1999) a linear transition region between serviceability and unserviceability may be defined with a membership function R. The failure damage function R is defined as the weighted average of damage probabilities reduced by the corresponding damage level. Thus both types of uncertainties are combined in the fuzzy probabilistic measures. The concept is presented in Fig. 4.8 with R representing the damage density function. It should be, however noted, that experimental data do not include all the relevant information needed, thus usually some additional assumptions are required to define the model.

53
Figure 4.8 Fuzzy probabilistic model of performance requirement R (Holický, 2010).
Concerning serviceability an important question is raised by Turkstra and Reid (1993): Does the state or professional body have a right to prevent building owners to reduce initial investments at the cost of low-quality building performance or shorter expected service life? The answer is not clear.
Perhaps it is good to have a minimum level of serviceability defined by target reliabilities. Thus the code optimisation for serviceability i.e. determination of load factors and serviceability requirements could be based on level 2 and level 3 methods and the consequences could be added later.
Two simple statistical models of codification for serviceability is presented by Leicester (1993). The first concept is a design code optimised from the viewpoint of the building owner. It is assumed that the building has an in-service value T of the unserviceability parameter, whereas the client has a complaint threshold U. The aim is to optimise the costs as a consequence of T exceeding U. The second concept is a performance standard involving a legal limit of the unserviceability parameter L, which will decide whether the builder or the client will pay the costs of exceeding U.
In the current thesis an approach is presented, where the three main factors influencing serviceability performance (see Fig. 4.9) are described as stochastic variables.
0 r1 r2 x
ΦR , R
ΦR(x)
R(x)
1
0.5
0
ν
ν
R(x )νϕ
R(x )νϕ
R(x )νϕ

54
Figure 4.9 Main factors influencing the reliability of serviceability design.
The exposure is in general time-dependent e.g. mechanical loading, moisture and temperature changes. However, in some cases a time-integrated simplification is used. The structural response e.g. the deflections due to the mechanical loading may have an additional time-variant characteristic due to time-dependent material behaviour e.g. creep. The design criterion e.g. the acceptable deflection is considered time-invariant. However, in general a time-dependency could also be defined. It is assumed that the information collected from measurements or surveys already contains information about vagueness and randomness. In other words the expected utility function (Reid, 1981) or the damage function (Holický, 1999) is considered as a generalised distribution function of the performance requirement and used similarly to classical probabilistic functions.
The advantages of the proposed approach are that:
o It is consistent with probabilistic concepts applied for ULS, in terms of classical structural reliability. Thus it could be used for code calibration.
o It only requires the stochastic description of a single design criterion (for a given serviceability requirement), which in principle could be simply determined.
In the classical formulation of structural reliability the resistance is compared to the load effect, see Eq. (4.1). With regard to serviceability the limit state function is usually defined as an allowable – often subjective – limit compared to an action effect. For example the deflections of a beam should be less than a certain value:
maxlimit wwg x (4.25) where wlimit is the allowable deflection limit (capacity) and wmax is the maximum deflection as a consequence of loading (demand). In the classical formulation the capacity (resistance) is governed by the inherent properties of the structure (material properties, dimensions etc.), whereas the demand (load effect) is governed by the external actions. In case of serviceability the demand is already a structural response to the distinct actions, thus includes the effect of both the external and internal uncertainties. However, the limiting value i.e. the design criterion itself is often uncertain.

55
Stochastic models for deflection limits are not easy to construct, since they are difficult to measure. Existing models are based on field data from literature (Hossain and Stewart, 2001) and experts’ opinion (Ter Haar et al., 1998). A summary of proposed deflection limit models is given in Paper VI and shown in Table 4.1.
Table 4.1 Simplified probabilistic models of basic variables for the deflection limits (taken from Paper VI).
Description Reference Material X Distribution μX σX Perception damage Hossain and
Stewart, 2001RC wmax Lognormal L/130 0.42μX
Partition wall damage Hossain and Stewart, 2001
RC wmax Gamma L/185 0.57μX
Visually objectionable Ter Haar et al., 1998
Steel wmax Lognormal L/125 0.45μX
Damage to cladding Ter Haar et al., 1998
Steel wmax Lognormal L/175 0.45μX
Minor damage Magnusson, 1987
Timber usust Lognormal L/300 0.20μX
Appearance Paper VI Timber unet,fin Gamma L/150 0.40μX Damage Paper VI Timber u2,fin Gamma L/200 0.55μX
4.7 Target reliabilities
Target reliability indices suggested for serviceability limit states in ISO 2394:1998 (ISO, 2002) are =0 for reversible and =1.5 for irreversible limit states considering a reference period of 1 year. This has been adopted in EN1990 for structures in reliability class 2, i.e. structures with medium consequences of failure (e.g. residential, office and public buildings). These values are used in this thesis as well. Values for structures in other reliability classes are given in the JCSS Probabilistic Model Code (JCSS, 2001) as shown in Table 4.2.
Table 4.2 Target reliability indices related to a one-year reference period and irreversible serviceability limit states (JCSS, 2001).
Relative cost of safety measure High 1.3Normal 1.7Low 2.3

56

57
5 Live loads in buildings
In the following chapter an overview of stochastic modelling of live loads is resented. A more detailed description of the problem is given in e.g. (Sentler, 1975; Corotis, 1979; Harris et al., 1981; CIB, 1989)
5.1 General concept
Since long-term records on floor live loads are not available, information on live loads is collected through surveys. Live load surveys are conducted during normal use of buildings. Thus survey loads usually contain information on the weight of furniture (and other items) and persons present at the time of the survey (sustained load). Therefore unusual loading situations, such as emergency crowding and furniture remodelling, are not observed (intermittent load). Since these situations might be important in the critical loading of the structure during its lifetime, it is important to incorporate them into the loading model (Corotis, 1979).
Figure 5.1 Sustained (top), intermittent (middle) and the total live load (bottom).

58
Fig. 5.1 shows the concept of sustained QLS and intermittent QLE loading. From the figure it is evident, the maximum of the total load QL – obtained as the sum of sustained and intermittent load – in a reference period does not necessarily occur at the same time as the maximum sustained QLS,max or maximum intermittent load QLE,max.
5.2 Sustained load
5.2.1 Intensity of the sustained load
The “arbitrary-point-in-time” intensity of the sustained load on an infinitesimal area can be written as (Sentler, 1975):
),(, yxmyxwSL (5.1)
where w(x,y) is the load intensity at any location x,y on a bay of a particular floor in a building; mLS is the overall mean load intensity; γ is a zero mean random variable representing the deviation from mL for the particular bay of the floor of the building; ε(x,y) is a zero mean random process, which represents the spatial load intensity.
In general γ can be given as:
bayflrbld (5.2)
where γbld represents the deviation from mLS due to building effects; γflr accounts for deviations due to floor effects; whereas γbay takes into considerations the effects of the actual bay.
Instead of the load on an infinitesimal area, one is usually interested in a unit load i.e. the total load over a bay of the floor. The statistical properties of the unit load UL, over an area A can be given as:
SLL mAUE (5.3)
A
AUL
22var
(5.4)
where E denotes the expected value; var stands for variance; whereas σ and σ are the standard deviation of and respectively.

59
5.2.2 Equivalent uniformly distributed load
For practical purposes it is convenient to define the sustained load as a uniformly distributed load. Therefore a so called equivalent uniformly distributed load (EUDL) is defined, which produces the same load effect as w(x,y).
According to Melchers (1999) the EUDL can be defined as:
I
I
A
A
dxdyyxI
dxdyyxIyxw
AEUDL),(
),(),(
)( (5.5)
where AI is the influence area and I(x,y) is the influence surface. It is important to note that AI is not equal to the tributary area AT, commonly used in structural design codes to consider the area contributing to the loading of a structural element. More information on I(x,y) and AI is given in (Sentler, 1975 and Melchers, 1999)
Defining a factor k (often referred as peak factor) equal to:
2
2
),(
),(
I
I
A
A
dxdyyxI
dxdyyxI
k (5.6)
The statistical properties of the EUDL of the sustained load LS can be given as:
SLS mLE (5.7)
A
kL S
S
22var
(5.8)
where the parameters mLS, σ and σS can be obtained from fitting observations from survey loads.
5.2.3 Maximum sustained load
During the lifetime of the structure the occupancy of a given floor area is likely to change. The sustained load is a square wave process, assumed to be constant between occupancy changes. Data from Mitchell and Woodgate (1971) and Harris et al. (1981) suggests that the number of occupancy changes may be modelled as a Poisson

60
counting process, i.e. the time between the load changes is exponentially distributed. Thus the cumulative distribution function of the maximum sustained load is:
)(1,max
xFTLS
LSSexF (5.9) where υS is the mean rate of occupancy changes; T is the reference period (usually the design lifetime) and FLS(x) is the cumulative distribution function of the arbitrary-point-in-time sustained load.
5.3 Intermittent load
As mentioned earlier live load surveys do not contain information about extraordinary loading situations i.e. the intermittent load. Therefore very little data exist on this type of load. However, information is sometimes obtained from questionnaires. A plausible model presented by Peir and Cornell (1973) assumes crowding of persons in unit cells, where the number of unit cells is a function of the floor area. A single occurrence of the intermittent load LE can be expressed as:
PNLE (5.10) where P is the weight of a single person (with a mean value P=0.67 kN and a standard deviation σP=0.11 kN), N is the number of loads per cell (typically N=4 and σN=2) and is the mean number of load cells in a specified influence area AI.
Using the concept of EUDL the statistical parameters of the intermittent load LE can be calculated as:
I
NPLEE AmLE
(5.11)
22
222222var
IPQPNNPE A
kL (5.12)
The mean number of load cells is given as (McGuire and Cornell, 1974):
6.2472.1 IA (5.13) for AI>14.4 m2.
The intermittent load may be considered as a Poisson renewal process with an occurrence rate νE and a deterministic load duration dp. The cumulative distribution function of the maximum intermittent load during a specific time interval T can be given, analogous to Eq. (5.9), as:

61
)(1,max
xFTLE
LEEexF (5.14)
5.4 Serviceability loads
In the design for safety the maximum loads during the lifetime of the structure are of interest (Fig. 5.1). However, when designing for serviceability more complex problems arise. When the design is intended to avoid permanent irreversible damage, the problem is similar to the design for safety. The serviceability design load is determined by the maximum load in a given reference period (e.g. characteristic load combination).
In other cases non-serviceability is a consequence of damage accumulation. In such cases the long-term behaviour of the sustained loading will determine the serviceability design load. Thus duration of the load above a certain level (i.e. the excursion time) is of interest (CIB, 1989).
In case of reversible damage both the occurrence and the excursion time could be interesting to determine the serviceability design load. In some situations the first passage time could be important, i.e. the average time until encountering the failure will be critical.
When designing for serviceability, usually a reduced load level – compared to the ultimate limit state – is used in structural design codes. In Paper V serviceability load levels are investigated using a probabilistic load model. One of the findings is that the live load model proposed by JCSS (JCSS, 2001) might be too conservative in the ULS and not yet developed enough for some floor types to be used in SLS.
To further investigate this question the JCSS model was compared to a model used by Stewart (1996a) in a paper to study serviceability load combinations given in the Australian and the North American structural codes. His probabilistic model is based on models by (Mitchell and Woodgate, 1971; Madsen and Turkstra, 1979; Harris et al., 1981). The parameters for sustained and the intermittent load from Stewart’s study are given in Table 5.1.
Table 5.1 Parameters for live loads (after Stewart, 1996).
Occupancy mLS [kN/m2]
σγ2
σS2 T
[y] P [kN]
σP [kN]
R [kN]
σR [kN]
Office 0.60 0.053 1.570 8 0.67 0.11 4.00 2.00 Residence 0.59 0.077 0.635 10 0.67 0.11 1.00 0.67

62
To compare JCSS model with Stewart’s model the same method is applied here as in Paper V, i.e. realisations of the live loads for office and residential floors were computed using Monte Carlo simulation. First the characteristic values were analysed. The results for offices and residential floors are presented in Fig. 5.2 and Fig. 5.3 respectively.
The characteristic values are computed in two different ways: (1) as the mean value of the 50-year extremes and (2) as the 98th percentile of the annual extremes. It can be seen that the JCSS model is more conservative than the model used by Stewart.
Figure 5.2 Comparison of the simulation from the probabilistic models and the characteristic load values given in EC1 (office floors).
0
1
2
3
4
5
0 50 100 150 200 250
Q[k
N/m
2 ]
AT [m2]
Q50 (mean) - Stewart
Q50 (mean) - JCSS
Q1 (98th perc.) - Stewart
Q1 (98th perc.) - JCSS
EN 1991

63
Figure 5.3 Comparison of the simulation from the probabilistic models and the characteristic load values given in EC1 (residential floors).
The characteristic values of the codes are important, since the load combinations for different loading situations are defined through them. In serviceability limit states the loads are usually reduced and expressed as a fraction of the characteristic value. Paper V gives detailed description about how the so called representative values can be determined. Load reduction factors of EN1990 are determined and it was found that the current values given in the code for ψ0 and ψ2 might be too conservative, whereas ψ1 is un-conservative in some cases. Therefore the investigation presented in Paper V was repeated using Stewart’s load model. The results are presented in Figs. 5.4 and 5.5. To estimate ψ1 two definitions were adopted for the frequent value (i.e. being exceeded in 99% and 95% of the total time). It is clear that for ψ1 and ψ2 Stewart’s model gives higher values for both cases. ψ0 was also higher for offices, but almost equal for residences. These results indicate that the stochastic live load models should be revisited, rather than the ψ values in the codes. A special focus should be made on the duration of loads and extraordinary loading situations. Therefore continuous measurements are recommended, rather than periodic surveys.
0
0.5
1
1.5
2
2.5
3
3.5
0 50 100 150 200 250
Q[k
N/m
2 ]
AT [m2]
Q50 (mean) - Stewart
Q50 (mean) - JCSS
Q1 (98th perc.) - Stewart
Q1 (98th perc.) - JCSS
EN 1991

64
Figure 5.4 ψ-factors calculated using different probabilistic models (office floors).
Figure 5.5 ψ-factors calculated using different probabilistic models (residential floors).
0
0.1
0.2
0.3
0.4
0.5
0.6
0.7
0.8
0.9
1
0 50 100 150 200 250
ψ
AT [m2]
psi0 Stewart
psi1,99 Stewart
psi1,95 Stewart
psi2 Stewart
psi0 JCSS
psi1,99 JCSS
psi1,95 JCSS
psi2 JCSS
0
0.2
0.4
0.6
0.8
1
1.2
0 50 100 150 200 250
ψ
AT [m2]
psi0 Stewart
psi1,99 Stewart
psi1,95 Stewart
psi2 Stewart
psi0 JCSS
psi1,99 JCSS
psi1,95 JCSS
psi2 JCSS

65
When FORM or SORM is used live loads are often described with their mean values (often in relation to the characteristic value) and their coefficient of variation. COV of the annual extreme of the variable load is often taken as 0.2, e.g. (NKB/SAKO, 1999). However, simulation results indicate higher variability, see Figs. 5.6 and 5.7. It can be seen that the COV decreases with the tributary area considering both the 1- and 50-year extremes. The results indicate COV=0.4-0.5 for the 1-year extremes and COV=0.2-0.3 for the 50-year extremes, when considering office and residential floors with a sufficiently large area. For smaller areas the variation is higher.
Figure 5.6 Changing of the COV of the total live load for a residential floor with the increase of tributary area.
0
0.2
0.4
0.6
0.8
1
0 50 100 150 200 250
CO
V
AT [m2]
residence Stewart (1 year)
residence Stewart (50 years)
residence JCSS (1 year)
residence JCSS (50 years)
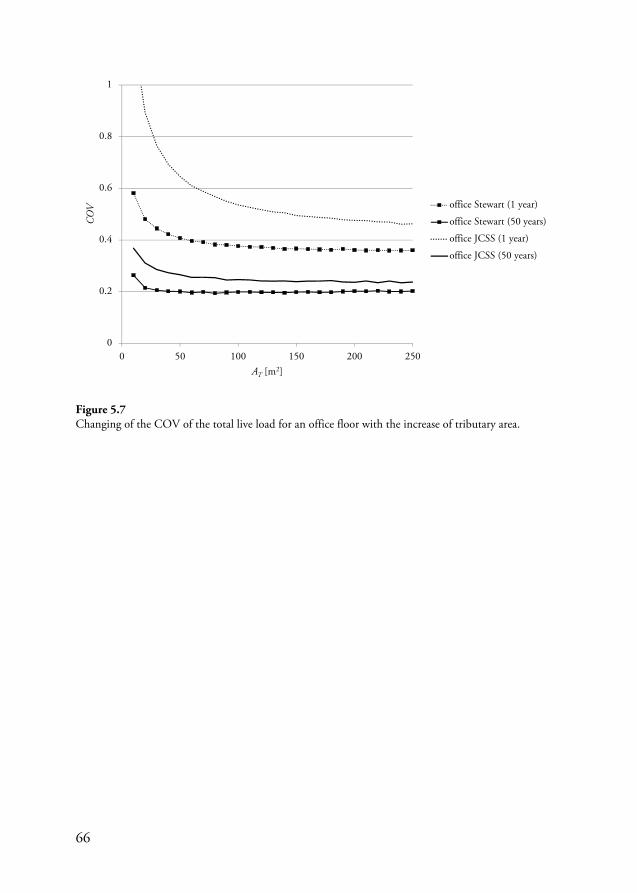
66
Figure 5.7 Changing of the COV of the total live load for an office floor with the increase of tributary area.
0
0.2
0.4
0.6
0.8
1
0 50 100 150 200 250
CO
V
AT [m2]
office Stewart (1 year)
office Stewart (50 years)
office JCSS (1 year)
office JCSS (50 years)

67
6 Long-term deformation of timber
The time-dependent behaviour of timber has a significant influence on the deformations (SLS) and the stresses (ULS) of structures. Structural codes usually define creep coefficients to take into account the effects of the time-dependent behaviour. However, creep coefficients consider different aspects of creep (e.g. load and moisture variation) in a very simplified way. To be more confident in prediction of structural behaviour over the service-life of the structure, rheological models based on test data are investigated and presented in the following chapter.
6.1 Long-term deformation of timber
Although extensive research has been carried out in the past decades, the long-term behaviour of wood subjected to mechanical and moisture loading is not yet fully understood. Several constitutive models have been developed including the effect of creep, mechano-sorption and hygroexpansion e.g. (Mårtensson, 1992; Toratti, 1992 and Hanhijärvi, 1995). However, models are commonly fitted to some tests and are difficult to generalise for structural applications.
The structural behaviour of wood is strongly influenced by the surrounding conditions, such as (Morlier, 1994):
o load and loading history;
o loading direction (in relation to the grain direction);
o time;
o moisture content and moisture history;
o moisture variations;
o temperature.
Moreover, the material properties of timber have a strong effect on the mechanical behaviour, since wood is a cylindrically orthotropic, viscoelastic material with a highly variable strength and stiffness. These characteristics make it difficult to predict long-term deformations of structural timber.

68
6.1.1 Elastic deformation
Load induced deformation may be separated into two parts: (1) elastic and (2) delayed deformation, i.e. normal creep. Elastic deformation is the immediate deformation when applying or removing load. Separation of elastic and creep deformation however, is not always easy, since the loading itself takes some time.
At low level of stress – which is usual in serviceability limit state – timber behaves linearly. However, at a certain stress level the behaviour becomes nonlinear. This certain point on the stress-deformation curve is called the limit of proportionality (LoP). The proportionality limit is at different stresses for different loading types (see Fig. 6.1)
Figure 6.1 Elastic material behaviour of timber and limit of proportionality (Mårtensson, 2003).
The slope of the curve in the elastic phase refers to the elastic modulus E, which is dependent (among others) on moisture content of wood. Therefore an accurate prediction of moisture content is needed, to calculate the deflections accurately.
6.1.2 Viscoelastic deformation
Viscoelastic creep is the progressively increasing deformation – with a decreasing rate – after the immediate elastic response at constant loading. If the load is removed, recovery occurs. Recovery can also be divided into two parts: an immediate elastic recovery and a delayed viscoelastic recovery with a slowing rate.
A wide variety of research on creep of timber can be found in the literature e.g. (Ranta-Maunus, 1972; Morlier, 1994). However, most of them are limited in terms
tg = E
LoP
LoP
e
P
Compression
Tension

69
of specimen size and test duration compared to real-life structural applications. Nevertheless, several studies are carried out investigating the effect of creep on structural sized timber under various circumstances (Gowda et al., 1996; Ranta-Maunus and Kortsmaa, 2000; Ranta-Maunus, 2007). The experiments on different types of timber and timber products (pine, spruce, glulam, LVL) with different treatments (nil, painted, creosoted, salt treated), different environments (sheltered, heated, outdoors) are mainly performed on beams in bending. Typical creep diagrams can be observed in Fig. 6.2.
Figure 6.2 Relative creep of different timber products at low stress level in natural sheltered environment (Gowda et al., 1996).
Wood is a hygroscopic material, thus binds water from moisture in the surrounding environment. The moisture content influences several material properties of timber such as strength, modulus of elasticity and creep. For moisture contents below the fibre saturation point the modulus of elasticity decreases as the moisture content increases. The reduction of the modulus of elasticity makes wood softer and thus increases the elastic deformations and the normal creep. Higher stresses also lead to higher creep in general. However, at low stress levels, the effect of stress on creep is not significant.
1
1.2
1.4
1.6
1.8
2
0 0.5 1 1.5 2 2.5 3 3.5
Rel
ativ
e cr
eep
[-]
Time [y]
LVL
Glulam
Spruce
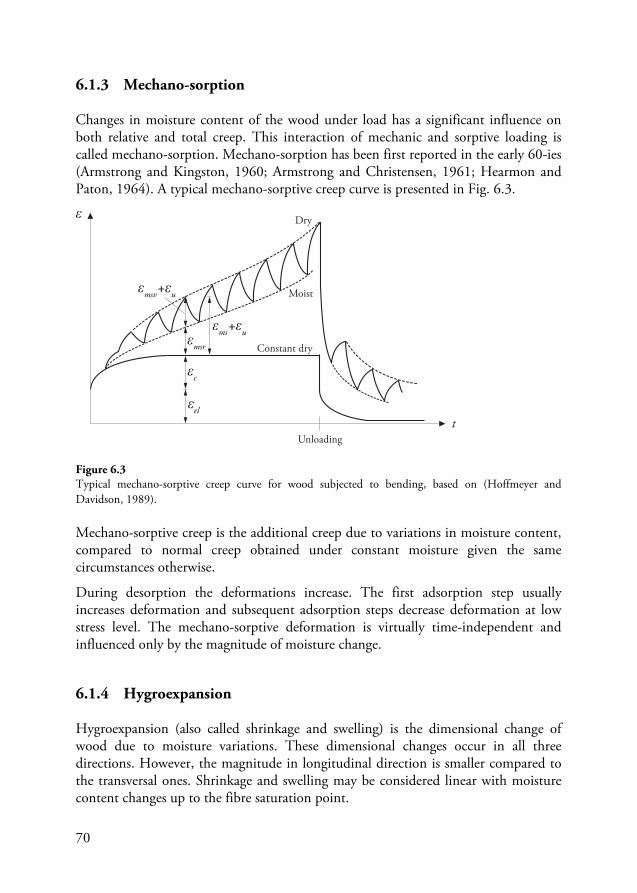
70
6.1.3 Mechano-sorption
Changes in moisture content of the wood under load has a significant influence on both relative and total creep. This interaction of mechanic and sorptive loading is called mechano-sorption. Mechano-sorption has been first reported in the early 60-ies (Armstrong and Kingston, 1960; Armstrong and Christensen, 1961; Hearmon and Paton, 1964). A typical mechano-sorptive creep curve is presented in Fig. 6.3.
Figure 6.3 Typical mechano-sorptive creep curve for wood subjected to bending, based on (Hoffmeyer and Davidson, 1989).
Mechano-sorptive creep is the additional creep due to variations in moisture content, compared to normal creep obtained under constant moisture given the same circumstances otherwise.
During desorption the deformations increase. The first adsorption step usually increases deformation and subsequent adsorption steps decrease deformation at low stress level. The mechano-sorptive deformation is virtually time-independent and influenced only by the magnitude of moisture change.
6.1.4 Hygroexpansion
Hygroexpansion (also called shrinkage and swelling) is the dimensional change of wood due to moisture variations. These dimensional changes occur in all three directions. However, the magnitude in longitudinal direction is smaller compared to the transversal ones. Shrinkage and swelling may be considered linear with moisture content changes up to the fibre saturation point.
ε
εel
εc
εmsr
εms+εu
εmsv+εu
tUnloading
Moist
Dry
Constant dry

71
6.2 Constitutive modelling
The constitutive equation of wood subjected to mechanical loading and moisture variation can be expressed as:
)()()()( tttt umsvisc (6.1) where ε is the total strain, εvisc is the viscoelastic strain, εms is the mechano-sorptive strain and εu is the shrinkage-swelling strain due to hygroexpansion.
6.2.1 Viscoelastic creep
The viscoelastic behaviour of timber can be described by the viscoelastic strain rate visc which can be separated into an elastic part el and a viscous part (normal creep) c :
celvisc (6.2) The elastic strain rate el can be written as:
)(0 uJel (6.3) where J0 is the elastic compliance, a function of moisture content (by weight) u; and is the stress rate.
The normal creep may be modelled with m Kelvin elements in series, thus the normal creep strain rate c is expressed as:
m
i i
icic
J
1
,
(6.4)
where Ji is the creep compliance, i is the relaxation time of the ith Kelvin element and the normal creep strain caused by the ith Kelvin element. A schematic illustration of a Kelvin element, consisting of an elastic spring and a viscous dashpot, is shown in Fig. 6.4.
Figure 6.4 Illustration of a Kelvin element.

72
6.2.2 Mechano-sorptive creep
Several models exist to describe mechano-sorption, such as constant slope models (Ranta-Maunus, 1975), creep limit models (Hunt and Shelton, 1988), two slope models (Leicester, 1971; Mårtensson, 1988) and combined models (Toratti, 1992; Svensson and Toratti, 2002). In this thesis the creep limit model is used. Mechano-sorptive strain rate consists of two parts:
msrmsvms (6.5) where msv and msr are the variable and the residual parts of the mechano-sorptive strain rate respectively. The residual part of mechano-sorption may be modelled by n Kelvin elements in series:
n
j jmsr
jmsrjmsrmsr u
J
1 ,
,,
(6.6)
where Jmsr,j is the mechano-sorptive compliance, msr,j is the relaxation parameter of the jth Kelvin element; msr,j the residual part of the mechano-sorptive creep strain caused by the jth Kelvin element and u is the rate of the moisture content change.
The variable part of the mechano-sorptive strain rate is proportional to the moisture content rate u and the total strain :
ubmsv (6.7) where b is a material parameter.
6.2.3 Shrinkage and swelling
The free shrinkage rate u is described as a linear function of moisture content rate u :
uu (6.8) where is the shrinkage-swelling coefficient and assumed to be independent of moisture.

73
6.3 Moisture transport
The moisture transport in wood can be modelled by similar equations to heat transfer in solids. The diffusion within the material is expressed by Fick’s second law:
wDtw
w
(6.9)
where w is the moisture content per volume and Dw is the diffusion coefficient.
At the surface, the exchange of moisture between air and wood is described as a surface flux q according to Fick’s first law.
eqsurfw wwq (6.10)
where w is the mass transport coefficient (or surface emissivity) with respect to moisture content, wsurf and weq are the moisture content at the surface and in the air (equilibrium moisture content) respectively. Data on moisture transport parameters are given in Paper II.
6.4 Long-term deflections in Eurocode
The effect of long-term deflections in EC5 is considered using a creep factor kdef as it has already been discussed in Section 2.2.2.5. The value of kdef depends on the service class (SC) which is supposed to represent the environmental conditions of the structure:
o Service class 1 is characterised by a MC in the materials corresponding to a temperature of 20°C and the relative humidity of the surrounding air only exceeding 65% for a few weeks per year In SC1 the average moisture content usually does not exceed 12%. The value of kdef for solid timber and glulam in SC1 is 0.6.
o Service class 2 is characterised by a MC in the materials corresponding to a temperature of 20°C and the relative humidity of the surrounding air only exceeding 85% for a few weeks per year. In SC2 the average moisture content usually does not exceed 20%. The value of kdef for solid timber and glulam in SC2 is 0.9.
o Service class 3 is characterised by climatic conditions leading to higher moisture contents than in service class 2. The value of kdef for solid timber and glulam in SC3 is 2.0.

74
6.5 Model calibration
A finite element model was developed by the author to simulate the effect of varying moisture content in wood. The modelling was undertaken in COMSOL Multiphysics 4.3a environment (COMSOL, 2012). Two models were developed and coupled together:
1. A moisture transport model to calculate distribution of moisture content and moisture content rate within a cross-section of the timber structural member.
2. A structural mechanics model to determine the strains, stresses and displacements of structural element.
Detailed information about the model with the parameters is given in Paper II.
6.5.1 Tests by Bengtsson and Kliger (2003)
The model was verified against tests made by Bengtsson and Kliger (2003). Structural sized beams (45×70×1100 mm) were loaded in bending for 240 days in RH varying between 30% and 90% and at a constant temperature of 20°C. The specimens were loaded flatwise in four-point bending to a maximum bending stress of 10 MPa. The duration of the moisture cycles was 2×14 days (drying and wetting). The different mechano-sorptive behaviour of low- (LT) and high-temperature-dried (HT) structural-sized specimens was considered with different mechano-sorptive and shrinkage-swelling parameters. Relative creep of the tests and simulations are compared in Fig. 6.5.

75
Figure 6.5 Relative creep of the LT- and HT-specimens: test (dashed lines) vs. simulation (cont. lines) from Paper II.
6.5.2 Tests by Leivo (1991)
The model was then tested with the experiments done by Leivo (1991). In the tests the timber spruce specimens were loaded in 4-point bending to stress levels of 5 and 10 MPa under cycling RH (35-90%) and a constant temperature (20°C). The size of the specimens was 45×90×2000 mm. The length of the moisture cycles was 70 days and the duration of the tests was 1 year.
The find a very simple but yet reasonable model to predict relative creep, an analytical expression is defined as a combination of two formulas from (Ranta-Maunus, 2007) and (Fragiacomo and Ceccotti, 2006):
t
tu
ett 14.01
)0()( 2.0 (6.11)
where is the midspan deflection, t is the time after loading in years, t is the length of a half moisture cycle, and are mechano-sorptive parameters derived from the FE-model, u is the moisture amplitude. represents the final value of the mechano-sorptive creep i.e. the creep limit and is determined as:
1.0
1.5
2.0
2.5
0 50 100 150 200 250
Time [d]
Rel
ativ
ecr
eep
[-]
3(LT)
2(LT)
6(HT)
4(HT)
5(HT)
1(LT)

76
0JJmsr (6.12)
The moisture amplitude u is the given as:
minmax uuu (6.13) where umax is the maximum value of the average moisture content in the cross-section within one moisture cycle, whereas umin is the minimum value. umax and umin may be estimated with the sorption isotherm e.g. (Mohager and Toratti, 1993):
33467.0012545000928.001.0
2
RHRHRH
u (6.14)
This model is very simplified and does not take into account for example the effect of the cross-section size. A more advance analytical model is given in (Schänzlin, 2010).
Fig. 6.6 shows a comparison of an average test curve with the relative creep calculated by the numerical and the analytical model. Similar to the results in Paper II, the FE prediction of the first moisture cycles is poor; however, subsequent cycles are estimated accurately. The analytical model seems to predict the average relative creep in a reasonable way.
Figure 6.6 Relative creep of test by Leivo (1991) (dashed lines) vs. models (cont. lines).
1.0
1.5
2.0
2.5
3.0
0 50 100 150 200 250 300 350
Test
Simulation
Analytical
Time [d]
Rel
ativ
ecr
eep
[-]
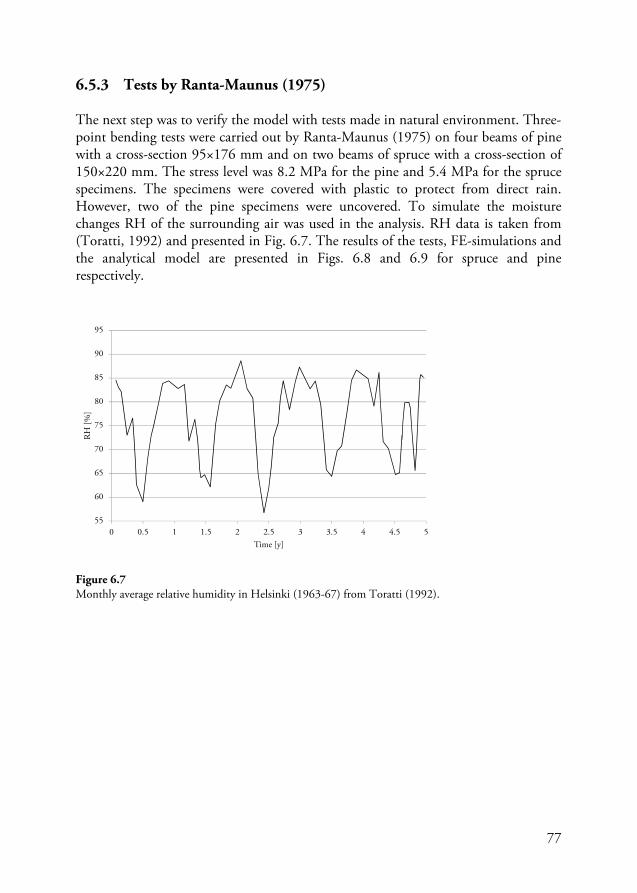
77
6.5.3 Tests by Ranta-Maunus (1975)
The next step was to verify the model with tests made in natural environment. Three-point bending tests were carried out by Ranta-Maunus (1975) on four beams of pine with a cross-section 95×176 mm and on two beams of spruce with a cross-section of 150×220 mm. The stress level was 8.2 MPa for the pine and 5.4 MPa for the spruce specimens. The specimens were covered with plastic to protect from direct rain. However, two of the pine specimens were uncovered. To simulate the moisture changes RH of the surrounding air was used in the analysis. RH data is taken from (Toratti, 1992) and presented in Fig. 6.7. The results of the tests, FE-simulations and the analytical model are presented in Figs. 6.8 and 6.9 for spruce and pine respectively.
Figure 6.7 Monthly average relative humidity in Helsinki (1963-67) from Toratti (1992).
55
60
65
70
75
80
85
90
95
0 0.5 1 1.5 2 2.5 3 3.5 4 4.5 5
RH
[%]
Time [y]

78
Figure 6.8 Relative creep results: test (spruce, Ranta-Maunus, 1975) vs. models.
Figure 6.9 Relative creep results: test (pine, Ranta-Maunus, 1975) vs. models.
1.0
1.5
2.0
2.5
3.0
0 50 100 150 200 250 300
Test, light
Test, heavy
Simulation
Analytical
Time [w]
Rel
ativ
ecr
eep
[-]
1.0
1.5
2.0
2.5
0 50 100 150 200 250 300
Test, light covered
Test, heavy covered
Simulation
Analytical
Time [w]
Rel
ativ
ecr
eep
[-]

79
6.5.4 Tests by Ranta-Maunus (2007)
Creep experiment of 8 glulam beams with a cross-section of 90×270 mm was started in 1991 in heated indoor environment. Results from the test were reported 16 years later (Ranta-Maunus, 2007). The beams had a span of 9 m and were loaded in 4-point bending. The specimens were divided into two groups. 4 beams were loaded at a stress level of 4 MPa, whereas the remaining half of the specimens was loaded at 2 MPa. The RH variation in the heated rooms is given in Fig. 6.10 for a 4 year reference period. In the FE-simulations the RH cycles were approximated with a sine wave with extreme values of 20 and 70%. The results of the test, the simulation and the analytical model are presented in Fig. 6.11.
Figure 6.10 Monthly average relative humidity in the heated test room (Ranta-Maunus, 2007)
Figure 6.11 Relative creep: results test (Ranta-Maunus, 2007) vs. numerical models.
0
20
40
60
80
2003 2004 2005 2006 2007
RH
[%]
Year
1.0
1.5
2.0
0 200 400 600 800
Test
Analytical model
Simulation
Time [w]
Rel
ativ
ecr
eep
[-]

80
6.5.5 Summary of the modelling
The main difference in the simulations was in the applied mechano-sorptive parameters: Jmsr, msr, b, see Eqs. (6.6) and (6.7). A summary of the mechano-sorptive parameters for each test is given in Table 6.1.
Table 6.1 Mechano-sorptive parameters estimated from different tests from the test.
Test Jmsr
[1/MPa] msr
[-]
b [-]
Bengtsson and Kliger (2003) LT 0.5-0.7J0 0.40 1.3-1.6 Bengtsson and Kliger (2003) HT 0-0.4J0 0.35 0.7-1.3 Leivo (1991) 0.9J0 0.2 2.0 Ranta-Maunus (1975) spruce 0.9J0 0.1 5.0 Ranta-Maunus (1975) pine 0.7J0 0.3 3.0 Ranta-Maunus (2007) 0 0 1.3
It can be observed that for the controlled moisture cycle tests (Leivo, 1991; Bengtsson and Kliger, 2003) the model parameters are similar to those obtained by Toratti (1992) by a similar creep limit model, i.e. Jmsr=0.7J0, msr=0.4, b=1.3. These values would probably be suitable for service class 2 conditions. However, in outdoor environment those values would underestimate the test results, i.e. for service class 3 the mechano-sorptive effect is more pronounced, see the tests from (Ranta-Maunus, 1975). In contrast, for heated indoor environments (Ranta-Maunus, 2007) the mechano-sorptive effect vanishes, i.e. it is included in the normal creep model. This indicates that the last part of Eq. (6.11) may be neglected for service class 1 conditions. Fig. 6.12 shows the predicted 50 year relative creep using Eq. (6.11) compared to test results from Ranta-Maunus (2007) and Abdul-Wahab et al. (1998). In the latter case varnished and unvarnished glulam beams were kept in more or less constant environment, i.e. T=20C and RH=60%(10%) for nearly 8 years. The span of the beams was 1.8 m with a cross-section of 190×70 mm.
Clearly, extrapolation from the results is difficult, therefore determination of creep data from measurement on real structures is encouraged (Schänzlin, 2010). Unfortunately there is no data available for service class 1, i.e. indoor conditions, on existing structures. Therefore Eq. (6.11) is recommended to use in time variant analysis of timber floors, see Paper VI and Chapter 7.

81
Figure 6.12 Relative creep of structural sized timber in heated room.
1.0
1.5
2.0
0 10 20 30 40 50
Analytical model
Test average (Ranta-Maunus, 2007)
Test, unvarnished (Abdul-Wahab et al., 1998)
Test, varnished (Abdul-Wahab et al., 1998)
Time [y]
Rel
ativ
ecr
eep
[-]

82

83
7 Reliability in the serviceability limit state
Code calibration used in modern design codes is an optimisation process to determine reasonable partial safety factors using level 2 reliability methods. The aim is to achieve a consistent reliability level around the target reliability in most practical design situations. The calibration commonly focuses on the strength of the structural members, thus is related to the ULS. However, as shown in Chapter 2, in the design of beams the performance of the structural elements is often governed by the serviceability requirements. In this chapter time-invariant and time-variant reliability of beams in serviceability limit state is discussed.
7.1 Time-invariant reliability of beams in the serviceability limit state
In the following section the time-variant reliability of design according to current structural design standards is briefly discussed through the example of beams subjected to bending. The main focus is on Eurocodes, where the reliability in ULS and SLS is presented and compared.
7.1.1 Reliability in ULS
The reliability level of Eurocodes (such as any design codes) for different structural materials should be consistent. In 1999 the Joint Nordic Group of Structural Matters (SAKO) prepared a report investigating reliability level obtained when using the suggested partial safety factors in ENV-Eurocodes (i.e. the preliminary versions of Eurocodes) (NKB/SAKO, 1999). The investigation was carried out for different structural materials (concrete, steel and timber), different type of structural elements (e.g. beams and columns) and for different ratios between permanent and variable actions. The results show a significant variation in the reliability level.

84
Fig. 7.1 presents a typical result from the report comparing beams and columns made of different material. The horizontal axis represents the ratio between the variable and the total load , whereas on the vertical axis the 1-year reliability index is measured. It can be seen that the results clearly deviate from the target reliability =4.7 given for ULS.
Figure 7.1 Reliability indices for beams and columns depending on the material, reproduced from (NKB/SAKO, 1999).
As a next step the material safety factors and then the partial safety factors on the action side were calibrated to achieve a more consistent reliability.
A similar investigation was carried out at BRE (BRE, 2003) this time focusing on the load combinations. Fig. 7.2 shows the variation of the reliability index β with χ for selected values of ψW=0.3, 0.4, 0.5, 0,6 and 0.7 (i.e. the combination factor for wind load) for k=Wk/Qk=0.75 (solid lines from bottom to top) and for k=0 (dashed line). It should be noted that the reliability in this case is calculated for a reference period of 50 years. Therefore target reliability β=3.8 is indicated in Fig. 7.2.
3
4
5
6
7
0 0.2 0.4 0.6 0.8 1
χ
Steel beamConcrete beamTimber beamSteel columnConcrete columnTimber column

85
Figure 7.2 Reliability indices for a generic cross section, redrawn from (BRE, 2003)
7.1.2 Reliability in SLS
Since, to the best knowledge of the author, no previous studies about the reliability level of Eurocodes in the serviceability limit state have been carried out, the author aimed to investigate the reliability of serviceability design for flexural members made of different materials (steel, concrete and timber) according to the specifications of the current versions of Eurocodes. SORM is applied to determine the reliability index for different design situations for simply supported beams subjected to bending. The probabilistic calculations were performed using the commercial software COMREL (RCP, 2004).
The results are published in (Honfi and Mårtensson, 2009; Honfi and Mårtensson, 2011) and summarised in Paper I. The results of Paper I showed that the reliability in SLS is not consistent for different load ratios and is below the target reliability for irreversible limit states (=2.9). In general the reliability of serviceability of Eurocodes seems to be quite inconsistent. With regard to steel members it can be concluded that the reliability increases with (the variable to total load ratio), when considering the remaining total deflections wmax (Fig. 7.3). This fact can be advantageous, since steel structures are usually light and carry more variable load than self-weight. If it is assumed that the deflections that cause damage are random variables, then the actual deflection limit applied in the deterministic design format will have an effect on the reliability. This is shown in Fig. 7.4.
β=3.8
k=0
6
5.5
5
4.5
4
3.5
30 0.2 0.4 0.6 0.8 1
β
χ
ψw = 0.7
ψw = 0.6
ψw = 0.5
ψw = 0.4
ψw = 0.3
for k=0.75

86
Figure 7.3 Reliability indices for a steel beam considering wmax (from Paper I).
Figure 7.4 Reliability indices for a steel beam considering w3 (from Paper I).
The time-invariant analysis of concrete structures suggested, that the probability of exceeding the deflection limits is quite high. This is especially true for higher portion of variable loads; therefore it may cause problems for innovative light-weight concrete structures. For timber members the EC prescriptions to calculate the long-term deflections differ from those given for concrete. Therefore the variable to total load ratio has a different effect on the reliability for the serviceability limit state. However, it should be noted that for concrete and timber structures, the time-invariant analysis might not be sufficient due to the long-term effects. Therefore a time-variant analysis of serviceability is given in Section 7.2.
0
0.5
1
1.5
2
2.5
3
3.5
0 0.1 0.2 0.3 0.4 0.5 0.6 0.7 0.8 0.9 1
0.2
0.4
0.6
0.8
COV
0
0.5
1
1.5
2
2.5
3
3.5
0.2 0.3 0.4 0.5 0.6 0.7 0.8
COV
L/300
L/400
L/500
L/600

87
There is obviously a need for further investigation in this field. This analysis indicates that some of the main objectives with future studies should be to discuss the relevance of limit values and also relevant target reliabilities for serviceability. Furthermore system effects must also be considered, since structural elements are usually parts of a larger system.
The investigation in Paper I focuses on Eurocodes. However, a similar study for steel structures was carried about by Stewart (1996a) considering the reliability of Australian and US serviceability load combinations. Fig. 7.5 shows the effect of changing tributary area on the reliability index using the serviceability load combination from the Australian standard. The main conclusion in the referred paper is that serviceability reliabilities for different floor occupancies vary considerably for Australian and US serviceability load combinations.
Figure 7.5 Influence of tributary area on for Australian serviceability loading provision after Stewart (1996a).
A fundamental difference between Stewart’s study and Paper I is the treatment of deflection limits. In the former investigation the deflection limits are considered as deterministic variables and therefore the results are independent from the actual limits. In contrast, in Paper I the deflection limits are assumed to be random variables based on (Hossain and Stewart, 2001).
Another difference is the load model. Stewart applied Monte Carlo simulation and an area dependent load model (presented in Chapter 4), whereas in Paper I a variable load was simply assumed Gumbel distributed with a given COV and related to the characteristic load Qk. Thus an inherent assumption of Paper I is that characteristic values of live loads in Eurocode in fact represent the 98th percentile of the annual extreme distribution. However, this assumption might be argued, see Chapter 5 and Paper V.
3
2.5
2
1.5
1
0.5
00 50 100 150 200 250
AnnualTenancy
Retail
Office
Car Park
Dom
esti
c
AT [m2]
β

88
The reliability of different type of steel structures concerning serviceability was examined by Galambos and Ellingwood (1986). The deflections were determined for unfactored loads taken from North American code specification with deterministic deflection limits i.e. no effects on reliability. First order second-moment probabilistic theory was used in the analysis. Values of the reliability index are calculated for eight- and one-year reference periods. It was found that live-load deflection and wind drift give reliabilities which are consistent with other serviceability criteria, while exceedance of roof deflection limits is considerably less likely. A suggestion to achieve consistency is to use 75% of the code-specified snow load for deflection limit calculations.
FORM is used to estimate the short-term deflection for a single timber member under uniformly distributed transverse loading in (Foschi et al., 1989). The deflection criterion in this case was also deterministic, thus irrelevant for the reliability. A performance factor was determined for various grades of several wood species (Douglas-fir, hem-fir and spruce-pine-fir) to adjust the loading/stiffness and to achieve a target reliability =2.0. It was found that for occupancy loading the average value is =0.5. It means that the reliability for short-term deflection of timber floors is much lower than the target reliability. However, system modification factors were not considered and the occupancy loading was considered deterministic.
Time-variant reliability of a single timber beam according to EC5 is shown in Fig. 7.6. ULS values for solid timber are taken from (Sousa et al., 2013), for glulam beams from (NKB/SAKO, 1999), whereas SLS values are based on Paper I.
Figure 7.6 Comparison of reliability levels of ULS and SLS for structural timber.
0
1
2
3
4
5
6
0 0.2 0.4 0.6 0.8 1
χ
ULS, solid timberULS, glulamuinstufinunet,finu2,fin

89
7.2 Time-variant reliability of beams in the serviceability limit state
In this section results from time-variant reliability analysis is discussed considering long-term deflections of structural elements. The investigation is limited to timber beams. However, similar studies for concrete structures have also been carried out (Li and Melchers, 1992; Li and Melchers, 1993 and Stewart, 1996b). Nevertheless, in those studies the uncertainties in the deflection limits are not taken into account.
7.2.1 Variation of deflections in time
Structural deflections are limited for different reasons as discussed in Chapter 2. However, the various deflections limits might be exceeded during the lifetime of the structure with a certain probability.
To estimate the probability of failure, it is important to note that loads and deflections of a structural member may fluctuate in time during the lifetime of the structure. The effect of the changes in variable load could be significant, especially for timber structures, since the self-weight is generally small. A simplified illustration (i.e. no sustained variable load is considered) of the variation of loads and deflections of a timber structural element in time is presented in Fig. 7.7 after Mårtensson and Thelandersson (1992). The figure shows that one part of the deflections takes place immediately after loading from the permanent actions and another part changes during lifetime.

90
Figure 7.7 Time variation in principle for deflection (lower figure) of a beam with permanent and variable loads (upper figure) (Mårtensson and Thelandersson, 1992).
7.2.2 Previous studies
Time-invariant reliability analysis of the serviceability of timber structural elements was mentioned in Chapter 6. Reference was made to (Foschi et al., 1989) and Paper I. However, when considering long-term deflections time-variant analysis is more appropriate due to creep effect.
In a paper by Leichti and Tang (1989) data on initial elastic and creep displacements were recorded and fitted to a Burger body model to predict creep. The mathematical model was then used as the failure surface in a second-moment reliability analysis. It was shown that the reliability is a function of time for serviceability limit state, i.e. reliability decreases with time.
Fridley and Rosowsky (1993) used Monte Carlo simulation to determine a resistance factor c to achieve a target reliability =2.0. It was found that a resistance factor c=0.45 and 0.35 is required to attain the target reliability for a reference period of for 1 and 8 years respectively, when the combination of unfactored permanent and live
0 1 2 3 4 5 6 46 47 48 49 50
0 1 2 3 4 5 6 46 47 48 49 50
Deflection
Time [y]
Time [y]
Load
Q k
Gk
ucreep
u2
u1
u2,inst

91
load was used as basis of the deterministic design. c serves as a reduction of the stiffness, thus it can be seen as an “inverse” creep factor. It should be noted that the deflection limit was considered deterministic in the model.
The same model was applied by Philpot et al. (1994) and the effect of moisture content, i.e. different drying methods was investigated. A typical result is presented in Fig. 7.8, where the reliability index is plotted against resistance factor c for various moisture levels.
Figure 7.8 Reliability analysis result, effect of timber moisture content (Philpot et al., 1994).
The investigation was later further improved to consider system effects i.e. the effect of creep on system reliability. Based on the results system factors for different timber grades were determined (Philpot et al., 1995).
7.2.3 Reliability according to EC
Time-variant reliability of timber beams is investigated in Paper VI using the probabilistic load and resistance model from (JCSS, 2001). Long-term deflections are considered in the light of the Eurocode specifications. A simple creep model (see Section 6.5.5) is used to calculate the deflections and Monte Carlo simulation is carried out to determine the reliability index. A detailed description of the analysis methods, the stochastic models and the results are given in Paper VI.
The results are highly dependent on the stochastic load model. Thus the JCSS live load model might be too conservative as shown in Section 4.4, the calculations from Paper VI were repeated for office and residential floors with the load model referred as Stewart’s model in Section 5.4.
Kiln-dried
Air-dried
Green
4
3
2
1
0
0.2 0.4 0.6 0.8 1
β
ϕc

92
The results of the calculations are presented Figs. B.1-B.22 in Appendix B. The JCSS live load model is referred as model A, whereas the model described in Section 5.4 is referred as model B (see Table 5.1)..
It can be generally concluded that the reliability level is higher for model B if the same creep factor kdef and the same deflection limit is applied. Thus using model B slightly less conservative deflection limits could be suggested than in Paper VI.
7.2.3.1 Office floors – appearance criterion Using deflection model B, the deflection limit could be even less strict than suggested in Paper VI, i.e. unet,fin≤L/150 (Fig. B.1). Applying L/150 with model B the first failure is expected more than 10 years later (Fig. B.2) and the average number of violated years Df decreases, but not significantly (with 1 year) compared to model A (Fig. B.3). However, the effect of tributary area AT is more significant (Fig. B.4), since the reduction due to the loaded area is different in model A and B. For larger areas the difference between the two models is smaller. On the other hand, the effect of precamber u0 on the reliability index seems to be more pronounced for model B than for model A, see Fig. B.5. The same applies for the variable to total load ratio (Fig. B.6).
7.2.3.2 Office floors– appearance criterion Considering the criterion for damaging deflections u2,fin≤L/400 could be suggested based on model B (Fig. B.7). This value seems more reasonable than u2,fin≤L/600 (model A) suggested in Paper VI, since it is closer to current recommendations (see Section 2.2.2.5). The failure is expected 2-5 years later (depending on the actual limit) using model B (Fig. B.8). However, the mean number of violated years Df does not change significantly (Fig. B.9). The effect of tributary area AT is also bigger for model B (Fig. B.10), such as the effect of the variable to total load ratio (Fig. B.11).
7.2.3.3 Residential floors – appearance criterion For the appearance criterion at residential floors the same effects could be observed as for offices. Using model B instead of model A will suggest a less strict deflection limit for u2,fin (Fig. B.12). However, the increase in the mean first passage time Tf is about 6 years (Fig. B.13), whereas the reduction in mean number of violated years Df is about 2 years, when assuming a deflection limit of L/150 (Fig. B.14). The effect of AT, u0 and is similar to those presented for offices (Figs. B.15-17).

93
7.2.3.4 Residential floors – damage criterion When investigating residential floors with regard to the damage criterion using model B the suggested deflection limit is u2,fin≤L/500 i.e. stricter than for offices (Fig. B.18). The mean first passage time Tf has reduced with 2-3 year compared to model A (Fig. B.19). However, the mean number of violated years Df has even increased in some situations (Fig. B.20). It means that the average time to first failure is longer, but then the deflection limit will be expected to be exceeded for a longer period. The tributary area AT has similar effect as in the previous cases, but sometimes model B is less conservative (for larger areas), see Fig. B.21. Considering the differences in the results from model A and B on the effect of on the reliability less variation can be observed (Fig. B.22).
7.2.3.5 Conclusions from the results A conclusion from the results for the reversible limit state is that the mean value of the deflection limit – represented as a stochastic variable – may be used in the deterministic design. In the presented example this value is L/150, see Fig. 7.9.
Figure 7.9. Cumulative distribution function with the deterministic limit (unet,fin).
In contrast, for the irreversible limit state a certain percentile of the CDF of the deflection limit is recommended to achieve the target reliability index. In the current investigation the suggested deterministic value is L/400-L/600. Applying L/500 would represent a value around the 10th percentile of the CDF, see Fig. 7.10.
The results suggest that deflection limits in design codes could be interpreted and further developed as a certain percentile of the distribution function of the relevant stochastic variable.
0 0.005 0.01 0.015 0.020
0.2
0.4
0.6
0.8
1
unet,fin
/L
CDF

94
Figure 7.10. Cumulative distribution function with the deterministic limit (u2,fin).
0 0.002 0.004 0.006 0.008 0.01 0.012 0.0140
0.2
0.4
0.6
0.8
1
u2,fin
/L
CDF

95
8 Other Publications
In addition to the six appended papers the following publications have been prepared, with contributions from the author, during the preparation of this thesis:
Honfi, D. & Mårtensson, A. (2009) Reliability of steel flexural members according to EC in serviceability limit state, Proceedings of 11th Nordic Steel Construction Conference, 2-4 September 2009, Malmö, Sweden, pp. 446-453.
Honfi, D. (2009) Ultimate and serviceability limit state optimization of cold-formed steel hat-shaped beams, Proceedings of 11th Nordic Steel Construction Conference, 2-4 September 2009, Malmö, Sweden, pp. 510-515.
Thelandersson, S. and Honfi, D. (2009) Structural behaviour of timber structures with reference to robustness, Joint Workshop of COST Actions TU0601 and E55, 21-22 September 2009, Ljubljana, Slovenia.
Honfi, D. & Mårtensson, A. (2011) Structural reliability according to Eurocodes in serviceability limit state, IABSE-IASS 2011 Symposium, London, September 2011.
Thelandersson, S. & Honfi, D. (2011) Structural design and detailing for robustness, IABSE-IASS 2011 Symposium, London, September 2011.
Honfi, D., Reith A., Vigh, L.G., Stocker, Gy. (2014) Why glass structures fail? – Learning from failures of glass structures, In Louter C., Bos F., Belis J. & Lebet J-P. (Eds.) Challenging Glass 4 & COST Action TU0905 Final Conference, accepted for publication.

96

97
9 Summary of appended papers
Paper I
The paper investigates the reliability of serviceability design for flexural members made of different materials (steel, concrete and timber) according to the specifications of the Eurocodes. Second-order reliability method is applied to determine the reliability index for different design situations for beams subjected to bending. The probabilistic models of basic variables for time-invariant analysis have been taken from the JCSS Probabilistic Model Code. The characteristic, the frequent and the quasi-permanent combination of actions are investigated and compared. The differences in serviceability reliability for different materials are discussed. The results show that there are differences between the achieved reliability indices in the serviceability limit state between different materials. Furthermore for load combinations given in Eurocode the reliability index is often below the target values.
Paper II
In this paper, a finite element model is developed to analyse the long-term behaviour of timber beams, since Paper I showed that a time-variant analysis is required to estimate the reliability of timber in SLS. The time-dependent response of wood subjected to bending and moisture changes is investigated in terms of strains and stresses. A rheological model is implemented to capture the effects of creep, mechano-sorption and hygroexpansion. The model is validated against test results from Bengtsson and Kliger (2003). The results of the analysis showed that the mechano-sorptive creep of low- and high-temperature-dried timber beams can be sufficiently modelled with a spring and a single Kelvin body. The different mechano-sorptive behaviour of LT- and HT-dried specimens is considered with different mechano-sorptive and shrinkage-swelling parameters. The presented model may provide a basis of time-dependent probabilistic calculations for structural sized timber in serviceability limit state.
Paper III
To connect the research with actual practice a series of research interviews were carried out related to serviceability issues. The paper addresses the question, how structural engineers deal with different design aspects of serviceability in a legal environment where little guidance is given. 19 practising structural engineers from

98
the Southern part of Sweden were interviewed. Most of the questions focused on deflections with special attention on loads, limit values and long-term effects. One question about vibrations and one about cracks were also asked to be answered. A final question intended to obtain information about known serviceability issues of existing structures. The results confirmed some of the findings of Paper I, i.e. that in many practical cases the serviceability requirements govern the design and there are differences in the reliability in SLS among different structural materials. However, it was also found that there is an uncertainty among designers how to design for serviceability.
Paper IV
The paper presents a survey about how practicing structural engineers deal with different design aspects of glass with a special focus on robustness and serviceability. The summary of the interviews with 14 glass design experts is presented. The survey showed that there is a need for more comprehensive design aids and recommendation for structural glass engineering. However, robustness and serviceability requirements are not always easy to quantify in terms or numbers and formulas. Problems with existing structures are also briefly presented. Concerning serviceability, clear similarities to Paper III can be seen.
Paper V
The paper estimates the representative values of different type of floor live loads by numerical simulation using stochastic live load models with a special focus on serviceability, since Paper I and III revealed that loads have a significant effect on reliability, especially in SLS. The results are compared to values given in existing standards (Eurocode on first place). Improvements are suggested concerning the load reduction factors, the definitions of the representative values and the stochastic load parameters.
Paper VI
The last paper appended to this thesis investigates the time-dependent reliability for long-term deflections of timber office and residential floor beams according to the specifications of the Eurocodes. A simple creep model is used to calculate the deflections and Monte Carlo simulation is carried out to determine the reliability index. It is found that the creep factor and the suggested deflection limits given in Eurocode 5 might not be appropriate to achieve the expected target reliabilities. To obtain a more consistent reliability, and thus improve the prescriptions, more suitable values for the mentioned parameters are suggested.

99
10 Conclusions and future work
10.1 Summary and conclusions
To study current design practice concerning serviceability interviews with experts were undertaken with regard to serviceability issues. The first one was carried out in Sweden in relation to traditional structural materials, whereas the second one was made on an international level concerning serviceability questions in the design philosophy of glass and glass related structures. The analysis of the interviews reconfirms the significance of structural serviceability. A common request from practicing engineers is better guidelines and codification of serviceability requirements.
The reliability of serviceability limit states in current design codes was investigated mainly focusing on static deflections. It was shown that the reliability of Eurocodes is not consistent. The inconsistency exists among different materials, variable to total load ratios and loaded areas.
A framework for probabilistic investigation of structural serviceability was presented taking into account uncertainties in all important aspects of structural serviceability i.e. loads, structural response and performance criteria. The proposed method provides a good basis for code calibration focusing on serviceability. Using the method the serviceability criteria in design codes may be defined as certain percentiles of the cumulative distribution function of the stochastic models of the performance criteria.
To investigate the long-term effects in serviceability:
1. The serviceability loads for floors were investigated in detail using stochastic load models. It was found that the serviceability load combinations in structural design codes should be reinvestigated. Proposal for changes are suggested in Paper V. However, the stochastic models for live loads should be improved first.

100
2. Time-variant reliability of timber floors beams was investigated considering long-term deflections. Based on the results a change of the creep factor and the recommended deflection limits in Eurocode 5 was proposed in Paper VI.
To increase knowledge about long-term deflections an advanced finite element model was developed to estimate the deflections of structural sized timber beams in natural environment. The model consist of the coupling a moisture transport model and a structural mechanics model. The constitutive equations of the FE-model are capable to take into account the combined effect of the variations of relative humidity in the surrounding environment and the time-variant mechanical loading. Based on the results of the FE-model a simple model was derived to calculate the mechano-sorptive deformations of timber beams.
10.2 Future research
There are obviously several possibilities to continue the research initiated by this thesis:
o The probabilistic model of serviceability criteria could be improved and be supported by extensive survey data.
o Delphi technique could be applied to improve serviceability criteria in structural design codes both for traditional materials and glass used structurally.
o The stochastic live load models could be improved. In order to do that, structural monitoring systems should be applied. It is important that collection of data should be long-term and extensive. It is recommended to organise it as a joint collaboration among many research institutes using the same procedures.
o The time-variant analysis could be extended to SC2 and SC3 structures (e.g. roofs constructions) involving probabilistic snow load modelling.
o The finite element model could be improved including non-linear material properties. Due to internal or external restraints local stresses may exceed the LoP even at serviceability load level. Preliminary results indicate that including material-nonlinearity would improve the agreement with the tests.
The increased knowledge about serviceability with the improved design guidelines will lead to less serviceability problems in the future i.e. higher comfort level and longer useful life, therefore providing with a more liveable built environment.

101
Acknowledgements
There are many people whom I would like to express my gratitude and appreciation for their contribution and support during my research.
First of all, I would like to thank my supervisors Prof Annika Mårtensson and Prof Sven Thelandersson for their help, encouragement and patience during my doctoral studies. I am very grateful for their guidance and constructive criticism during this research. I would also like to thank to my other co-authors Prof Robert Kliger from Chalmers University and Dr Mauro Overend from Cambridge University for their contribution and valuable comments and discussions.
I would like to take this opportunity to thank to all my colleagues at the Divisions of Structural Engineering at Lund University for their company at work, fruitful discussions and the lots of fun at the coffee breaks and social activities in the last five years. Special thanks to Oskar Larsson for the help with the translation of the popularised summary of the thesis, and Ívar Björnsson for being a good roommate.
I am very grateful to my colleagues and friends Prof László Dunai, László Gergely Vigh, Dr Gábor Jakab and Dr Attila László Joó from Budapest University of Technology and Economics for their help at the early stage of my research career. Special thanks are given to Prof Károly Zalka, who has always been very supportive.
In addition, I would like to thank Dr Jörg Schänzlin for his valuable comments and explanations about his model on timber deflections; and Stephan Gollwitzer from RCP Consult GmbH for his support in relation to COMREL.
A major part of the thesis is based on interviews with experts in structural engineering. Their time and effort has been a great help and is deeply appreciated.
This research project has been financed by the Swedish Research Council FORMAS. Their support are highly appreciated and acknowledged.
I thank Bea Wittmann the great help she provided with the design of the figures and the cover image of the thesis. It has really improved the quality of this work.
Thanks to my friends I met in Lund or elsewhere in Sweden, who have made it easier to live away from my family and childhood friends.
Finally, but perhaps most importantly, I want to thank my family and friends for supporting me throughout my studies.

102

103
References
Abdul-Wahab, H. M. S., Taylor, G. D., Price, W. F. & Pope, D. J. 1998. Measurement and Modelling of Long-Term Creep in Glued Laminated Timber Beams Used in Structural Building Frames. The Structural Engineer, 76(14), 271-282.
Allen, D. E. 1970. Serviceability criteria for deflections and vibrations. Building Structures Section. Division of Building Research, National Research Council of Canada, NBC of Canada, Supplement No. 4, Commentary No. 4.
ANSI 1972. ANSI A58.1-72 Minimum Design Loads for Buildings and Other Structures, American National Standards Institute.
Armstrong, L. D. & Christensen, G. N. 1961. Influence of Moisture Changes on Deformation of Wood Under Stress. Nature, 191(4791), 869-870.
Armstrong, L. D. & Kingston, R. S. T. 1960. Effect of Moisture Changes on Creep in Wood. Nature, 185(4716), 862-863.
ASCE 1995. ASCE 7-95 Minimum Design Loads for Buildings and Other Structures, American Society of Civil Engineers.
ASTM 2012. ASTM1300 Standard Practice for Determining Load Resistance of Glass in Buildings. West Conshohocken, PA: American Society for Testing and Materials.
Bachmann, H. & Ammann, W. 1987. Vibrations in Structures: Induced by Man and Machines, International Association for Bridge and Structural Engineering.
Bainbridge, R. J. & Mettem, C. J. 1997. Serviceability Performance of Timber Floors – Eurocode 5 and Full Scale Testing. Meeting thirty of the Working Commission W18 – Timber Structures, Paper 30-20-2. Vancouver, Canada. International Council for Research and Innovation, 23 p.
Beauty in Serviceability. 1910. Art and Progress, 1(4), p. 103. Bengtsson, C. & Kliger, R. 2003. Bending Creep of High-Temperature Dried Spruce
Timber. Holzforschung, 57(1), 95-100. Bos, F. P. 2009. Safety Concepts in Structural Glass Engineering: Towards an Integrated
Approach. PhD Thesis, TU Delft. Boverket 2010. Regelsamling för konstruktion, BKR 2010. Karlskrona: Boverket. BRE 2003. An Independent Technical Expert Review of the SAKO Report – Final, Building
Research Establishment. CEN 1994. ENV 1995-1-1 Eurocode 5: Design of timber structures – Part 1-1: General rules
and rules for buildings. Brussels: Comité Européen de Normalisation. CEN 2002. EN 1990 Eurocode – Basis of Structural Design. Brussels: European Committee for
Standardization.

104
CEN 2004a. EN 1992-1-1 Eurocode 2: Design of concrete structures – Part 1-1: General rules and rules for buildings. Brussels: European Committee for Standardization.
CEN 2004b. EN 1995-1-1 Eurocode 5: Design of timber structures – Part 1-1: General - Common rules and rules for buildings. Brussels: Comité Européen de Normalisation.
CEN 2005. EN 1993-1-1 Eurocode 3: Design of steel structures – Part 1-1: General rules and rules for buildings. Brussels: European Committee for Standardization.
CEN/TC250/WG3 2012. Guideline for a European Structural Design of Glass Components. CIB 1989. Actions on Structures: Live Loads in Buildings. CIB Publication 116. International
Council for Building Research (CIB) Commission W81. COMSOL 2012. COMSOL Multiphysics User’s Guide, Version 4.3a. Cooney, R. C. & King, A. B. 1988. Serviceability criteria for buildings. BRANZ Study Report
SR14. Porirua, NZ. Cornell, C. A. 1969. A Probability Based Structural Code. ACI-Journal, 66(12), 974-985. Corotis, R. B. 1979. Reliability Basis of Live Loads in Standards – State of the Art. In: Ang, A.
H.-S. & Shinozuka, M. (eds.) 4th ASCE Specialty Conference on Probabilistic Mechanics and Structural Reliability, December 10-12 1979 Tucson, Arizona. New York: American Society of Civil Engineers, 86-90.
Corotis, R. B., Harris, J. C. & Fox, R. R. 1981. Delphi Methods: Theory and Design Load Application. Journal of the Structural Division, American Society of Civil Engineers, 107(6), 1095-1105.
COST/TU0905. 2009. http://www.glassnetwork.org/ [Online]. COST Action TU0905, European Cooperation in Science and Technology.
Crist, R. A. & Shaver, J. R. 1976. Deflection Performance Criteria for Floors. U.S. Government Printing Office.
Deák, G. & Holický, M. 1993. Serviceability requirements. International Colloquium: Structural Serviceability of Buildings, Göteborg, Sweden. International Association for Bridge and Structural Engineering, 25-31.
DIN 2008. DIN 1052:2008 Entwurf, Berechnung und Bemessung von Holzbauwerken – Allgemeine Bemessungsregeln und Bemessungsregelen für den Hochbau. Berlin: Deutsches Institut für Normung.
Ellingwood, B. & Tallin, A. 1984. Structural Serviceability: Floor Vibrations. Journal of Structural Engineering, 110(2), 401-418.
Ellingwood, B. R. & Tekie, P. B. 1999. Wind Load Statistics for Probability-Based Structural Design. Journal of Structural Engineering, ASCE, 125(4), 453-463.
Faber, M. H. 2008. Risk and Safety in Civil Engineering. Zürich: Swiss Federal Institute of Technology.
Fleming, R. 1941. The deflection of beams, New York, American institute of steel construction. Foschi, R. O., Folz, B. & Yao, F. Z. 1989. Reliability-based design of wood structures,
Deptartment of Civil Engineering, University of British Columbia. Fragiacomo, M. & Ceccotti, A. 2006. Simplified approach for the long-term behaviour of
timber-concrete composite beams according to the Eurocode 5 provisions. Meeting thirty-nine of the Working Commission W18 – Timber Structures, Paper 39-9-1. Florence, Italy. International Council for Research and Innovation, 12 p.

105
Fridley, K. J. & Rosowsky, D. V. 1993. Serviceability analysis of structures including creep effects. International Colloquium: Structural Serviceability of Buildings, Göteborg, Sweden. International Association for Bridge and Structural Engineering, 277-282.
Galambos, T. & Ellingwood, B. 1986. Serviceability Limit States: Deflection. Journal of Structural Engineering, 112(1), 67-84.
Galambos, T. V., Gould, P. L., Ravindra, M. K., Suryoutomo, H. & Crist, R. A. 1973. Structural deflections. A literature and state-of-the-art survey. Building Science Series 47. Washington.
Gergely, P. & Leroy, A. L. 1968. Maximum Crack Width in Reinforced Concrete Flexural Members. American Concrete Institute Special Publication, 20, 87-117.
Gowda, C., Kortsmaa, M. & Ranta-Maunus, A. 1996. Long term creep tests on timber beams in heated and non-heated environments. VTT Publications 278. Espoo: Technical Research Centre of Finland
Green, R. R. 2013. A New ASTM Guide for Structural Glass. GPD Glass Performance Days, June 13-15, Tampere, Finland.
Griffis, L. G. 1993. Serviceability Limit States Under Wind Load. AISC Engineering Journal, 30(1), 1-16.
Gulvanessian, H., Calgaro, J. A. & Holický, M. 2002. Designer's Guide to EN 1990: Eurocode: Basis of Structural Design, Thomas Telford.
Hanhijärvi, A. 1995. Modelling of Creep Deformation Mechanisms in Wood. PhD Thesis, Helsinki Univesity of Technology, VTT.
Harris, M. E., Corotis, R. B. & Bova, C. J. 1981. Area-Dependent Processes for Structural Live Loads. Journal of the Structural Division, American Society of Civil Engineers, 107(5), 857-868.
Hasofer, A. M. & Lind, N. C. 1973. An Exact and Invariant First-order Reliability Format, Solid Mechanics Division, University of Waterloo.
Hearmon, R. F. S. & Paton, J. M. 1964. Moisture content changes and creep of wood. Forest Products Journal, 14, 357-358.
Hoffmeyer, P. & Davidson, R. W. 1989. Mechano-sorptive creep mechanism of wood in compression and bending. Wood Science and Technology, 23(3), 215-227.
Holický, M. 1999. Fuzzy probabilistic optimisation of building performance. Automation in Construction, 8(4), 437-443.
Holický, M. 2010. Fuzzy Probabilistic Models for Structural Serviceability. Journal of Applied Quantitative Methods, 5(3), 467-478.
Holický, M. & Holická, N. 1993 Serviceability and tolerances. International Colloquium: Structural Serviceability of Buildings, Göteborg, Sweden. International Association for Bridge and Structural Engineering, 33-39.
Holický, M. & Östlund, L. 1993 Probabilistic design concept. International Colloquium: Structural Serviceability of Buildings, Göteborg, Sweden. International Association for Bridge and Structural Engineering, 91-98.
Honfi, D. & Mårtensson, A. 2009. Reliability of steel flexural members according to EC in serviceability limit state. 11th Nordic Steel Construction Conference, September 2-4, Malmö, Sweden. SBI, 446-453.

106
Honfi, D. & Mårtensson, A. 2011. Structural reliability according to Eurocodes in serviceability limit state. IABSE-IASS 2011 London Symposium Report, September 23, London, United Kingdom. IABSE.
Hossain, N. B. & Stewart, M. G. 2001. Probabilistic Models of Damaging Deflections for Floor Elements. Journal of Performance of Constructed Facilities, 15(4), 135-140.
ISO 2002. ISO 2394:1998 - General principles on reliability for structures. Geneve: International Organization for Standardization.
ISO 2009. ISO 4356:1977 Bases for the design of structures -- Deformations of buildings at the serviceability limit states. Geneve: International Organization for Standardization.
ISO 2012. ISO 10137:2007 Bases for design of structures - Serviceability of buildings and walkways against vibrations. Geneve: International Organization for Standardization.
ISO 2013. ISO 2631-2:2003 - Mechanical vibration and shock - Evaluation of human exposure to whole-body vibration - Part 2: Vibration in buildings (1 Hz to 80 Hz). Geneve: International Organization for Standardization.
IStructE 1999. Structural Use of Glass in Buildings, London, Institution of Structural Engineers.
IStructE 2010. Manual for the design of building structures to Eurocode 1 and Basis of Structural Design, The Institution of Structural Engineers.
JCSS 2001. Probabilistic Model Code. Joint Committee on Structural Safety. Johansson, P. 2009. Vibration of Hollow Core Concrete Elements Induced by Walking. Master
Thesis, Division of Structural Engineering and Division of Engineering Acoustics, Lund University.
Ketchum, M. S. 1916. General specifications for steel frame buildings, New York, McGraw. Köhler, J. 2007. Reliability of Timber Structures. PhD Thesis, Institute of Structural
Engineering, Swiss Federal Institute of Technology. Leicester, H. R. 1993. Serviceability criteria for building codes. International Colloquium:
Structural Serviceability of Buildings, Göteborg, Sweden. International Association for Bridge and Structural Engineering, 69-83.
Leichti, R. J. & Tang, R. C. 1989. Effect of Creep on the Reliability of Sawn Lumber and Wood-Composite I-Beams. Mathematical and Computer Modelling, 12(2), 153-161.
Leivo, M. 1991. On the stiffness changes in nail plate trusses. PhD Thesis, Technical Research Centre of Finland.
Li, C. Q. & Melchers, R. E. 1992. Reliability-Analysis of Creep and Shrinkage Effects. Journal of Structural Engineering, ASCE, 118(9), 2323-2337.
Li, C. Q. & Melchers, R. E. 1993. Gaussian Upcrossing Rate Solution for Structural Serviceability. Structural Safety, 12(4), 293-303.
Lüchinger, P. 1996. Basis of design - Serviceability aspects. IABSE Colloquium on Basis of Design and Actions on Structures - Background and Application of Eurocode 1. Delft, The Netherlands. International Association for Bridge and Structural Engineering, 33-40.
Madsen, H. O., Krenk, S. & Lind, N. C. 2006. Methods of structural safety, Mineola, NY, Dover Publications.

107
Madsen, H. O. & Turkstra, C. J. 1979. Residential floor loads, a theoretical and field study. Montreal: Dept. of Civil Engineering, McGill University.
Magnusson, B. 1987. Reliability indices for the servicability limit state: an optimization approach. PhD Thesis, Division of Structural Design, Chalmers University of Technology.
Mårtensson, A. 1992. Mechanical Behaviour of Wood Exposed to Humidity Variations. PhD Thesis, Department of Structural Engineering, Lund University.
Mårtensson, A. 2003. Short- and long-term deformation of timber structures. In: Thelandersson, S. & Larsen, H. J. (eds.) Timber Engineering. Chichester, United Kingdom: John Wiley & Sons.
Mårtensson, A. & Thelandersson, S. 1992. Control of deflections in timber structures with reference to Eurocode 5. Meeting twenty-five of the Working Commission W18 – Timber Structures, Paper 25-102-2 Åhus, Sweden. International Council for Research and Innovation, 23 p.
McGuire, R. K. & Cornell, C. A. 1974. Live Load Effects in Office Buildings. Journal of the Structural Division, American Society of Civil Engineers, 100(7), 1351-1356.
Melchers, R. E. 1999. Structural reliability analysis and prediction, Chichester; New York, John Wiley.
Mitchell, G. R. & Woodgate, R. W. 1971. Floor loadings in office buildings : the results of a survey. Garston, England: Building Research Station.
Mohager, S. & Toratti, T. 1993. Long-Term Bending Creep of Wood in Cyclic Relative-Humidity. Wood Science and Technology, 27(1), 49-59.
Morlier, P. 1994. Creep in Timber Structures, Taylor & Francis. NKB/SAKO 1999. Basis of design of structures – proposals for modification of partial safety
factors in Eurocodes. NKB Committee and work reports 1999:01 E. Nowak, A. S. & Collins, K. R. 2000. Reliability of structures, Boston, McGraw-Hill. Ohlsson, S. V. 1982. Floor vibrations and human discomfort. PhD Thesis, Division of Steel and
Timber Structures, Chalmers University of Technology. Pavic, A. & Reynolds, P. 2002. Vibration serviceability of long-span concrete building floors.
Part 1: Review of background information. The Shock and Vibration Digest, 34(3), 191-201.
Peir, J. C. & Cornell, C. A. 1973. Spatial and Temporal Variability of Live Loads. Journal of the Structural Division, American Society of Civil Engineers, 99(5), 903-922.
Percival, D. H. 1979. History of L/360. Forest Products Journal, 29(8), 26-27. Philpot, T. A., Fridley, K. J. & Rosowsky, D. V. 1994. Structural Reliability-Analysis Method
for Viscoelastic Members. Computers & Structures, 53(3), 591-599. Philpot, T. A., Rosowski, D. V. & Fridley, K. J. 1995. Reliability of Wood Joist Floor
Systems with Creep. Journal of Structural Engineering, ASCE, 121(6), 946-954. Rackwitz, R. 2001. Reliability analysis—a review and some perspectives. Structural Safety,
23(4), 365-395. Ranta-Maunus, A. 1972. Viscoelasticity of Plywood Under Constant Climatic Conditions,
Technical Research Centre of Finland.

108
Ranta-Maunus, A. 1975. The viscoelasticity of wood at varying moisture content. Wood Science and Technology, 9(3), 189-205.
Ranta-Maunus, A. 2007. Strength of Finnish Grown Timber, VTT. Ranta-Maunus, A. & Kortsmaa, M. 2000. Creep of timber during eight years in natural
environments. World Conference on Timber Engineering, July 31-August 3 Whistler Resort, British Columbia, Canada.
RCP 2004. COMREL and SYSREL: Users manual, RCP GmbH. Reid, S. G. 1981. Structural Design for Serviceability. PhD Thesis, McGill University. Rice, S. O. 1944. Mathematical Analysis of Random Noise. Bell System Technical Journal,
23(3), 282-332. Ryan, P. A., Otlet, M. & G., O. R. 1997. Steel supported glazing systems, London: The Steel
Construction Institute. Saidani, M. & Nethercot, D. A. 1993 Structural serviceability of buildings. International
Colloquium: Structural Serviceability of Buildings, Göteborg, Sweden. International Association for Bridge and Structural Engineering, 111-118.
Schänzlin, J. 2010. Modeling the long-term behavior of structural timber for typical service class-II conditions in South-West Germany. Habilitation, University of Stuttgart.
Sentler, L. 1975. A Stochastic Model for Live Loads on Floors in Buildings. Division of Building Technology, Lund Institution of Technology.
Skempton, A. W. & MacDonald, D. H. 1956. The Allowable Settlements of Buildings. ICE Proceedings: Engineering Divisions, 5(6), 727–768.
Sophian, T. J. 1930. London Building Act. London: Sweet & Maxwell. Sørensen, J. D. 2004. Notes in Structural Reliability Theory and Risk Analysis. Department of
Civil Engineering, AAU. Sousa, H. S., Sørensen, J. D., Kirkegaard, P. H., Branco, J. M. & Lourenço, P. B. 2013. On
the use of NDT data for reliability-based assessment of existing timber structures. Engineering Structures, 56(0), 298-311.
Stewart, M. G. 1996a. Optimization of serviceability load combinations for structural steel beam design. Structural Safety, 18(2-3), 225-238.
Stewart, M. G. 1996b. Serviceability reliability analysis of reinforced concrete structures. Journal of Structural Engineering, ASCE, 122(7), 794-803.
Tammo, K. 2009. A new approach to crack control for reinforced concrete. PhD Thesis, Division of Structural Engineering, Lund University.
Ter Haar, T. R., Retief, J. V. & Dunaiski, P. E. 1998. Towards a More Rational Approach of the Serviceability Limit States Design of Industrial Steel Buildings. Journal of Constructional Steel Research, 46(1), 152-153.
Thelandersson, S. 1995. Serviceability Limit States - Deformations. In: Blass, H. J. (ed.) Timber Engineering STEP 1: Basis of design, material properties, structural components and joints.
Thoft-Christensen, P. & Baker, M. J. 1982. Structural reliability theory and its applications, Berlin, New York: Springer-Verlag.

109
Tichý, M. 1993. Backgrounds to serviceability requirements. International Colloquium: Structural Serviceability of Buildings, Göteborg, Sweden. International Association for Bridge and Structural Engineering, 69-83.
Toratti, T. 1992. Creep of timber beams in a variable environment. PhD Thesis, Helsinki University of Technology.
Tredgold, T. 1885 Elementary principles of carpentry. London: Crosby Lockwood and Co. Turkstra, C. J. & Reid, S. G. 1993 Structural design for serviceability. International
Colloquium: Structural Serviceability of Buildings, Göteborg, Sweden. International Association for Bridge and Structural Engineering, 1048-1054.

110

111
Appendix A
Adsd
Q
11111
22222
3333333
44
4444
55
5
An ongoingdesign methstructural sydifferent des
Questions a
1. General1.1 Age (un1.2 Position1.3 Compan1.4 Location
2. Experie2.1 How lon2.2 What %2.3 What is 2.4 Which d
3. Robustn3.1 How do 3.2 What ar3.3 How do 3.4 Do you 3.5 Do you 3.6 Could y
4. Servicea4.1 How do
use?4.2 Do defle4.3 How do 4.4 Are vibr4.5 What is
5. Existing5.1 Have yo
If yes, c5.2 Have yo
give furt
g research ihods and neystems. Thsign aspects
about struc
l data nder 35; 35-4nny size n
enceng have you
% of the timethe field yo
design code
nessyou deal we the exposyou differetreat primarapply any rou mention
abilityyou deal w
ection limitsyou deal w
rations oftenthe load lev
g structuresou ever encoould you gi
ou ever encother details?
initiative in ext generatiohe investigas of glass w
ctural desig
44; 45-55; o
u been worke is spent onou are works and/or gui
with robustnures, unfore
entiate betwry, secondarrobustness mn some good
with displace
s often govewith the vibrn importantvel you app
sountered ultive further dountered ser?
the framewon productsation includ
with a specia
gn philosop
over 55).
king as a strun glass or gling in (typicidelines do
ess issues (beseen event
ween differenry and cladd
measures? Ifd examples o
ements and
ern the desirations?t in your woly for servic
timate failurdetails? rviceability
work of COs aims to imdes a surveal focus on r
phy of struc
uctural engilass-related cal structuryou use wh
both at comts you consint consequeding membf yes, how?of detailing
deflections
ign? If yes,
ork? If yes, wceability de
re (breakag
problems i
OST Action mprove desiey about horobustness a
ctural glass
ineer?structures?es, typical g
hen designin
mponent andider in the aences? ers differen
?g with regard
? What are
where?
where?esign?
e, partial or
n existing g
TU0905 Stgn methodsow structurand servicea
s
glass matering glass stru
d system levnalysis?
ntly if yes, h
d to robustn
the deflecti
r full collaps
glass structu
tructural Gs of glass stral engineerability.
ials)? uctures?
vel)?
how?
ness?
ion limits yo
se) in glass
ures? If yes,
Glass - Novetructures anrs deal wit
ou usually
structures?
could you
elndth

112

113
Appendix B
In this appendix the results from the time-variant analysis of timber beams is presented. The analysis of the results is given in Section 7.2.3.
B.1 Office floors – appearance
Figure B.1 Reliability indices for office floors with different limit values of unet,fin calculated from model A and model B (AT=20 m2, =0.8, u0=L /400).
0.5 0.6 0.7 0.8 0.9 1-0.5
0
0.5
1
1.5
2
2.5
kdef
L/150, office, AL/250, office, AL/350, office, AL/150, office, BL/250, office, BL/350, office, B
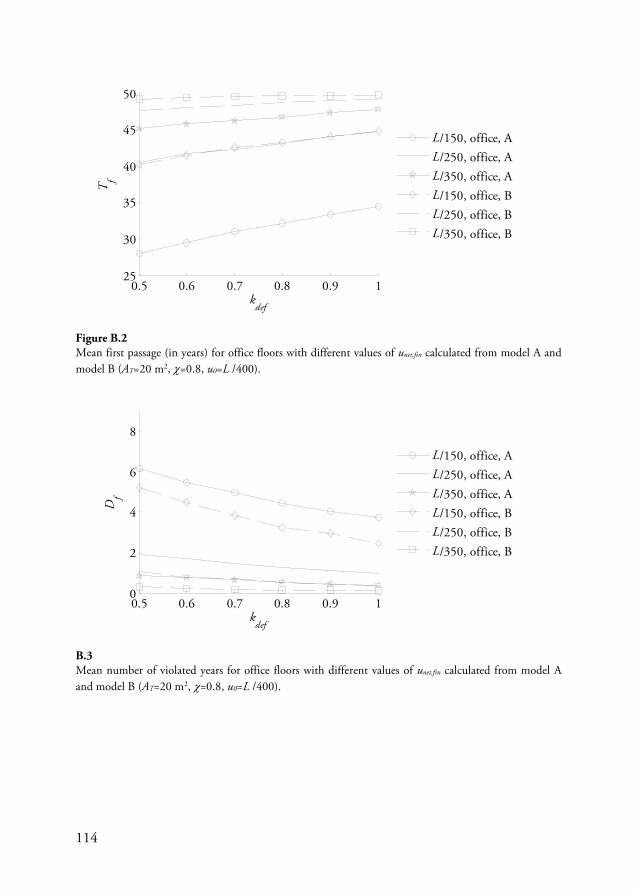
114
Figure B.2 Mean first passage (in years) for office floors with different values of unet,fin calculated from model A and model B (AT=20 m2, =0.8, u0=L /400).
B.3 Mean number of violated years for office floors with different values of unet,fin calculated from model A and model B (AT=20 m2, =0.8, u0=L /400).
0.5 0.6 0.7 0.8 0.9 125
30
35
40
45
50T f
kdef
L/150, office, AL/250, office, AL/350, office, AL/150, office, BL/250, office, BL/350, office, B
0.5 0.6 0.7 0.8 0.9 10
2
4
6
8
Df
kdef
L/150, office, AL/250, office, AL/350, office, AL/150, office, BL/250, office, BL/350, office, B

115
Figure B.4 Reliability indices for office floors with different values of AT calculated from model A and model B (unet,fin=L/150, =0.8, u0=L /400).
Figure B.5 Reliability indices for office floors with different values of u0 calculated from model A and model B (unet,fin=L/150, AT=20 m2, =0.8).
0.5 0.6 0.7 0.8 0.9 1
-0.5
0
0.5
1
kdef
AT=20 m2, office, A
AT=100 m2, office, A
AT=250 m2, office, A
AT=20 m2, office, B
AT=100 m2, office, B
AT=250 m2, office, B
0.5 0.6 0.7 0.8 0.9 1
-0.5
0
0.5
1
kdef
u0=0, office
u0=L/400, office, A
u0=L/300, office, A
u0=0, office
u0=L/400, office, B
u0=L/300, office, B

116
Figure B.6 Reliability indices for residential floors with different values of calculated from model A and model B (unet,fin=L/150 m2, AT=20 m2, u0=L /400).
B.2 Office floors – damage
Figure B.7 Reliability indices for office floors with different values of u2,fin calculated from model A and model B (AT=20 m2, =0.8).
0.5 0.6 0.7 0.8 0.9 1
-0.5
0
0.5
1
kdef
=0.2, office, A=0.5, office, A=0.8, office, A=0.2, office, B=0.5, office, B=0.8, office, B
0.5 0.6 0.7 0.8 0.9 1-0.5
0
0.5
1
1.5
2
2.5
kdef
L/400, office, AL/500, office, AL/600, office, AL/400, office, BL/500, office, BL/600, office, B

117
Figure B.8 Mean first passage (in years) for residential floors with different values of u2,fin calculated from model A and model B (AT=20 m2, =0.8).
Figure B.9 Mean number of violated years for office floors with different values of u2,fin calculated from model A and model B (AT=20 m2, =0.8).
0.5 0.6 0.7 0.8 0.9 125
30
35
40
45
50T f
kdef
L/400, office, AL/500, office, AL/600, office, AL/400, office, BL/500, office, BL/600, office, B
0.5 0.6 0.7 0.8 0.9 10
2
4
6
8
Df
kdef
L/400, office, AL/500, office, AL/600, office, AL/400, office, BL/500, office, BL/600, office, B

118
Figure B.10 Reliability indices for office floors with different values of AT calculated from model A and model B (u2,fin=L/600, =0.8).
Figure B.11 Reliability indices for office floors with different values of calculated from model A and model B (u2,fin=L/600, AT=20 m2).
0.5 0.6 0.7 0.8 0.9 1
1
1.5
2
2.5
kdef
AT=20 m2, office, A
AT=100 m2, office, A
AT=250 m2, office, A
AT=20 m2, office, B
AT=100 m2, office, B
AT=250 m2, office, B
0.5 0.6 0.7 0.8 0.9 1
1
1.5
2
2.5
kdef
=0.2, office, A=0.5, office, A=0.8, office, A=0.2, office, B=0.5, office, B=0.8, office, B

119
B.3 Residential floors – appearance
Figure B.12 Reliability indices for residential floors with different limit values of unet,fin calculated from model A and model B (AT=20 m2, =0.8, u0=L /400).
Figure B.13 Mean first passage (in years) for residential floors with different values of unet,fin calculated from model A and model B (AT=20 m2, =0.8, u0=L /400).
0.5 0.6 0.7 0.8 0.9 1-0.5
0
0.5
1
1.5
2
2.5
kdef
L/150, residence, AL/250, residence, AL/350, residence, AL/150, residence, BL/250, residence, BL/350, residence, B
0.5 0.6 0.7 0.8 0.9 125
30
35
40
45
50
T f
kdef
L/150, residence, AL/250, residence, AL/350, residence, AL/150, residence, BL/250, residence, BL/350, residence, B

120
Figure B.14 Mean number of violated years for residential floors with different values of unet,fin calculated from model A and model B (AT=20 m2, =0.8, u0=L /400).
Figure B.15 Reliability indices for residential floors with different values of AT calculated from model A and model B (unet,fin=L/150, =0.8, u0=L /400).
0.5 0.6 0.7 0.8 0.9 10
2
4
6
8D
f
kdef
L/150, residence, AL/250, residence, AL/350, residence, AL/150, residence, BL/250, residence, BL/350, residence, B
0.5 0.6 0.7 0.8 0.9 1
-0.5
0
0.5
1
kdef
AT=20 m2, residence, A
AT=100 m2, residence, A
AT=250 m2, residence, A
AT=20 m2, residence, B
AT=100 m2, residence, B
AT=250 m2, residence, B

121
Figure B.16 Reliability indices for residential floors with different values of u0 calculated from model A and model B (unet,fin=L/150, AT=20 m2, =0.8).
Figure B.17 Reliability indices for residential floors with different values of calculated from model A and model B (unet,fin=L/150, AT=20 m2, u0=L /400).
0.5 0.6 0.7 0.8 0.9 1
-0.5
0
0.5
1
kdef
u0=0, residence
u0=L/400, residence, A
u0=L/300, residence, A
u0=0, residence
u0=L/400, residence, B
u0=L/300, residence, B
0.5 0.6 0.7 0.8 0.9 1
-0.5
0
0.5
1
kdef
=0.2, residence, A=0.5, residence, A=0.8, residence, A=0.2, residence, B=0.5, residence, B=0.8, residence, B

122
B.4 Residential floors – damage
Figure B.18 Reliability indices for office floors with different values of u2,fin calculated from model A and model B (AT=20 m2, =0.8).
Figure B.19 Mean first passage (in years) for residential floors with different values of u2,fin calculated from model A and model B (AT=20 m2, =0.8).
0.5 0.6 0.7 0.8 0.9 1-0.5
0
0.5
1
1.5
2
2.5
kdef
L/400, residence, AL/500, residence, AL/600, residence, AL/400, residence, BL/500, residence, BL/600, residence, B
0.5 0.6 0.7 0.8 0.9 125
30
35
40
45
50
T f
kdef
L/400, residence, AL/500, residence, AL/600, residence, AL/400, residence, BL/500, residence, BL/600, residence, B

123
Figure B.20 Mean number of violated years for residential floors with different values of u2,fin calculated from model A and model B (AT=20 m2, =0.8).
Figure B.21 Reliability indices for residential floors with different values of AT calculated from model A and model B (u2,fin=L/600, =0.8).
0.5 0.6 0.7 0.8 0.9 10
2
4
6
8D
f
kdef
L/400, residence, AL/500, residence, AL/600, residence, AL/400, residence, BL/500, residence, BL/600, residence, B
0.5 0.6 0.7 0.8 0.9 1
1
1.5
2
2.5
kdef
AT=20 m2, residence, A
AT=100 m2, residence, A
AT=250 m2, residence, A
AT=20 m2, residence, B
AT=100 m2, residence, B
AT=250 m2, residence, B

124
Figure B.22 Reliability indices for residential floors with different values of calculated from model A and model B (u2,fin=L/600, AT=20 m2).
0.5 0.6 0.7 0.8 0.9 1
1
1.5
2
2.5
kdef
=0.2, residence, A=0.5, residence, A=0.8, residence, A=0.2, residence, B=0.5, residence, B=0.8, residence, B