
Design for Crashworthiness of Vehicle Structures via ...
12
1 Copyright © 2004 by ASME DESIGN FOR CRASHWORTHINESS OF VEHICLE STRUCTURES VIA EQUIVALENT MECHANISM APPROXIMATIONS AND CRUSH MODE MATCHING Karim Hamza Ph.D. Candidate, Mechanical Engineering Dept., University of Michigan, Ann Arbor, MI 48109-2102 [email protected] Kazuhiro Saitou Associate Professor, Mechanical Engineering Dept., University of Michigan, Ann Arbor, MI 48109-2102 [email protected] ABSTRACT This paper presents a 3D extension to our previous work on vehicle crashworthiness design that utilizes “equivalent” mechanism models of vehicle structures as a tool for the early design exploration. An equivalent mechanism (EM) is a network of rigid links with lumped masses connected by prismatic and revolute joints with nonlinear springs, which approximate aggregated behaviors of structural members during crush. A number of finite element (FE) models of thin- walled beams with typical cross sections and wall thicknesses are analyzed to build a surrogate model that maps the beam dimensions to nonlinear spring properties. Using the surrogate model, an EM model is optimized for given design objectives by selecting the nonlinear springs among the ones realizable by thin-walled beams. The optimum EM model serves to identify a good crash mode (CM), the time history of collapse of the structural members, and to suggest the dimensions of the structural members to attain it. After the optimization, the FE model of an entire structure is “assembled” from the suggested dimensions, which is further modified to attain the good CM identified by the optimum EM model. A case study of a 3D vehicle front half body demonstrates that the proposed approach can help obtain good designs with far less computational resources than the direct optimization of a FE model. 1. INTRODUCTION Vehicle crashworthiness is an important design attribute which designers strive to improve in order to meet necessary safety regulations and gain better market attractiveness. However, structural design for crashworthiness is a difficult task in which the design process often involves non-obvious decisions since the structure has to be strong enough in some zones to prevent collapse of the passenger compartment, yet sufficiently compliant in other zones to absorb the crash energy. Moreover, the nonlinear finite element (FE) simulations, widely used in industry for predicting the crash response, often require massive computational resources, thereby hindering adoption of many computational design methods that can aid the human designers to make these non-obvious decisions. This paper attempts to remedy the situation by presenting a new method for crashworthiness design of 3D vehicle structures applicable for the preliminary design stages, where designers only have a rough idea of the vehicle dimensions. As a 3D extension of our previous work [1,2], an early design exploration is done by the optimization of an “equivalent” mechanism approximating a vehicle structure. An equivalent mechanism (EM) is a network of rigid beams joined by prismatic and revolute joints with special nonlinear springs. These springs are designed to mimic the force-displacement and moment-rotation characteristics of thin-walled beams often found in the vehicle body structures. Dissimilar to the conventional lumped parameter and global surrogate models, the EM model is capable of capturing crash mode (CM), the time history of collapse of the structural members, which has a strong influence in the crash performance [3]. Thus, the capability to observe the CM in EM models provides essential clues during early design phases. A number of finite element (FE) models of thin-walled beams with typical cross sections and wall thicknesses are analyzed to build a surrogate model that maps the beam dimensions to nonlinear spring properties [4]. Using the surrogate model, an EM model is optimized for given design objectives by selecting the nonlinear springs among the ones realizable by thin-walled beams. After the optimization, the FE model of an entire structure is “assembled” from the suggested dimensions then further modified to attain the good CM in the EM model. A case study of a 3D vehicle front half body demonstrates that the proposed approach can help obtain good designs with far less computational resources than the direct parametric optimization of a FE model. Proceedings of IMECE04 2004 ASME International Mechanical Engineering Congress and Exposition November 13-20, 2004, Anaheim, California USA IMECE2004-62226
Transcript of Design for Crashworthiness of Vehicle Structures via ...
DESIGN FOR CRASHWORTHINESS OF VEHICLE STRUCTURES VIA EQUIVALENT MECHANISM APPROXIMATIONS AND CRUSH MODE MATCHING
Karim Hamza Ph.D. Candidate, Mechanical Engineering Dept., University of Michigan, Ann Arbor, MI 48109-2102
Kazuhiro Saitou Associate Professor, Mechanical Engineering Dept., University of Michigan, Ann Arbor, MI 48109-2102
Proceedings of IMECE04 2004 ASME International Mechanical Engineering Congress and Exposition
November 13-20, 2004, Anaheim, California USA
IMECE2004-62226
ABSTRACT
This paper presents a 3D extension to our previous work on vehicle crashworthiness design that utilizes “equivalent” mechanism models of vehicle structures as a tool for the early design exploration. An equivalent mechanism (EM) is a network of rigid links with lumped masses connected by prismatic and revolute joints with nonlinear springs, which approximate aggregated behaviors of structural members during crush. A number of finite element (FE) models of thin-walled beams with typical cross sections and wall thicknesses are analyzed to build a surrogate model that maps the beam dimensions to nonlinear spring properties. Using the surrogate model, an EM model is optimized for given design objectives by selecting the nonlinear springs among the ones realizable by thin-walled beams. The optimum EM model serves to identify a good crash mode (CM), the time history of collapse of the structural members, and to suggest the dimensions of the structural members to attain it. After the optimization, the FE model of an entire structure is “assembled” from the suggested dimensions, which is further modified to attain the good CM identified by the optimum EM model. A case study of a 3D vehicle front half body demonstrates that the proposed approach can help obtain good designs with far less computational resources than the direct optimization of a FE model.
1. INTRODUCTION Vehicle crashworthiness is an important design attribute
which designers strive to improve in order to meet necessary safety regulations and gain better market attractiveness. However, structural design for crashworthiness is a difficult task in which the design process often involves non-obvious decisions since the structure has to be strong enough in some zones to prevent collapse of the passenger compartment, yet sufficiently compliant in other zones to absorb the crash energy. Moreover, the nonlinear finite element (FE) simulations, widely
used in industry for predicting the crash response, often require massive computational resources, thereby hindering adoption of many computational design methods that can aid the human designers to make these non-obvious decisions.
This paper attempts to remedy the situation by presenting a new method for crashworthiness design of 3D vehicle structures applicable for the preliminary design stages, where designers only have a rough idea of the vehicle dimensions. As a 3D extension of our previous work [1,2], an early design exploration is done by the optimization of an “equivalent” mechanism approximating a vehicle structure. An equivalent mechanism (EM) is a network of rigid beams joined by prismatic and revolute joints with special nonlinear springs. These springs are designed to mimic the force-displacement and moment-rotation characteristics of thin-walled beams often found in the vehicle body structures. Dissimilar to the conventional lumped parameter and global surrogate models, the EM model is capable of capturing crash mode (CM), the time history of collapse of the structural members, which has a strong influence in the crash performance [3]. Thus, the capability to observe the CM in EM models provides essential clues during early design phases.
A number of finite element (FE) models of thin-walled beams with typical cross sections and wall thicknesses are analyzed to build a surrogate model that maps the beam dimensions to nonlinear spring properties [4]. Using the surrogate model, an EM model is optimized for given design objectives by selecting the nonlinear springs among the ones realizable by thin-walled beams. After the optimization, the FE model of an entire structure is “assembled” from the suggested dimensions then further modified to attain the good CM in the EM model. A case study of a 3D vehicle front half body demonstrates that the proposed approach can help obtain good designs with far less computational resources than the direct parametric optimization of a FE model.
1 Copyright © 2004 by ASME

The following sections provides a review of relevant literature, the description of each step in the proposed EM-based approach including the fidelity examination and a case study of a 3D vehicle front half body. The paper then concludes with a discussion and future work.
2. RELATED WORK Due to the high computational demand for high-fidelity FE
simulations, the focus of the automated methods for the crashworthiness design has been the development of alternate models suitable for simulating the crush phenomena at a reasonable accuracy and computational speed.
For use during the detailed design phase where the parametric geometry of the vehicle structures is fully known, the surrogate models that empirically capture the input-output relationship of a FE crash simulation are widely used [5-12]. However, the ranges of design variables (typically dimensions) are often limited in order to build an accurate model with a small number of sample input and output obtained by FE runs. For this reason, the success of surrogate model is severely limited when full vehicles are considered. Mase et al. [13] considered a full vehicle optimization under a low speed test (5 mph), where the structural parts unlikely to deform during crash were removed to reduce the size of the finite element model. Without such model reduction, Yang et al. [14] reported the use of 512 processors running in parallel for 72 hours to perform only two local optimization iterations.
Since the construction of surrogate models require detailed FE models, they are unsuitable for the pre-parametric design where complete parametric geometry is yet to be finalized. As such, more physically-oriented approximations, such as coarse mesh, lumped parameter, and lattice models [15-19] have been developed. While these models can be computationally inexpensive and also bear some physical roots in underlying crash phenomena, they are too abstract for the examination of the crash mode (a sequence of collapse events), which is essential for the early design iterations to identify effective energy-absorbing strategies of a given structural topology [3]. Also, a difficulty arises when a detailed FE model realizing the behavior of the approximation model needs to be constructed, which requires solving an optimization problem involving expensive crash simulations.
Aiming at the very early conceptual design stages, the conventional structural topology optimization methods have been applied to crashworthiness design [20-26], while other approaches extends these methods to utilize lumped parameter models and/or reduced order lattice models [15,16]. However, the application has been limited to excessively simple (often 2D) structures due to a large number of design variables involved in topology optimization.
The approach presented in this paper attempts to overcome these difficulties via equivalent mechanism (EM) models. The EM model, introduced in our previous work [1,2] and extended to 3D in this paper, is a “higher detail” lumped parameter model, where each beam member in the real structure is
represented by a few segments of rigid masses and special nonlinear springs. EM models are inexpensive to simulate, capable of simulating crash modes, and easily realizable into a FE model. And since EM models do not require fine geometric details, they are a natural choice in earlier design stages for overall observation of energy flow within the vehicle structure.
Fig. 1 (a) vehicle front substructure and its (b) finite element, (c) lumped parameter, and (d) equivalent mechanism models.
Fig. 1 shows the comparison of a FE model, a lumped parameter model, and an EM model of a vehicle front substructure. In lumped models (Fig 1 (c)), entire zones of the structure are lumped into equivalent springs and only the main masses (e.g., for the engine and the passenger compartment) are considered. In EM models (Fig. 1 (d)), each main structural member is represented by a set of rigid masses connected by prismatic and revolute joints. These joints have special nonlinear springs that are tuned to mimic the collapse behavior of the structural members.
Similar to the super-folding beam elements (SBE) [27, 28], these springs can be viewed as macro elements that capture the aggregated behavior of large structural deformation during crush. However, unlike SBE models, the EM models utilize pre-analyzed component databases to identify the properties of nonlinear springs, allowing the direct realization to a detailed geometry and easy enforcement of arbitrary design constraints. By performing most design iterations (including numerical optimization) on the EM model rather than the FE model, quick design insight and considerable savings on computational time can be achieved.
(a)
(b)
mass mass
main mass
revolute joints with NL torsional springs
minor masses
prismatic joints with NL axial springs
(d)
barrier
(c)
2 Copyright © 2004 by ASME
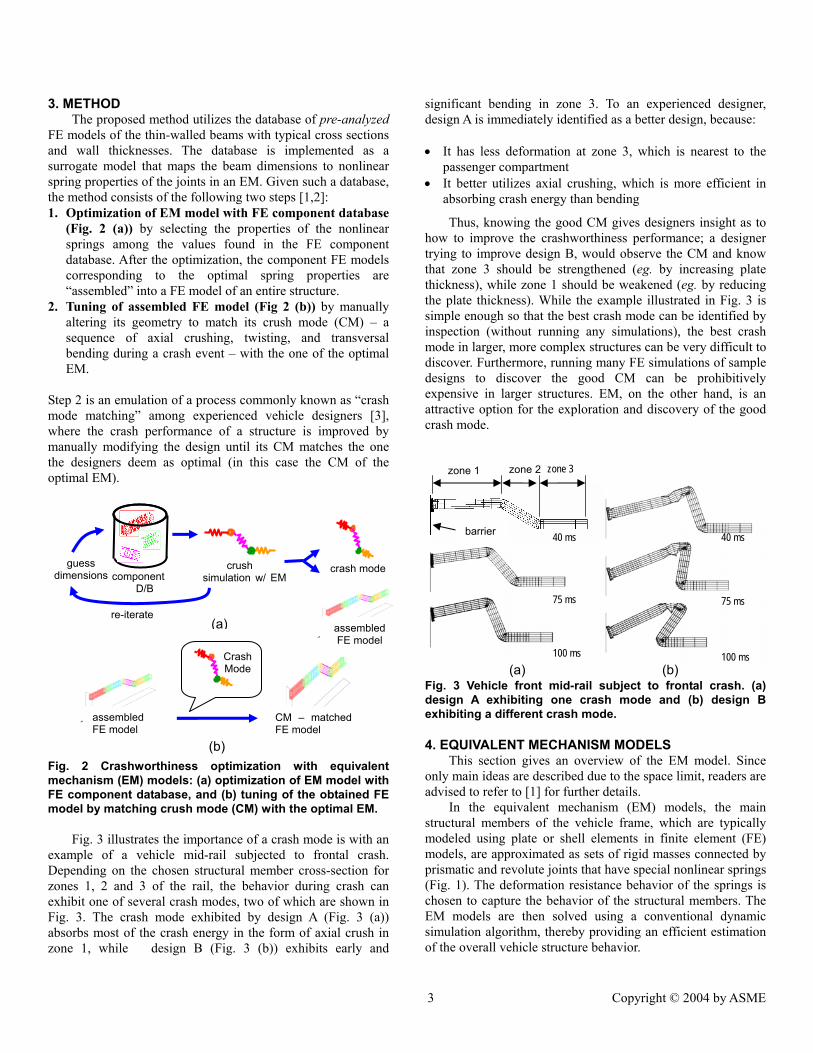
3. METHOD The proposed method utilizes the database of pre-analyzed
FE models of the thin-walled beams with typical cross sections and wall thicknesses. The database is implemented as a surrogate model that maps the beam dimensions to nonlinear spring properties of the joints in an EM. Given such a database, the method consists of the following two steps [1,2]: 1. Optimization of EM model with FE component database
(Fig. 2 (a)) by selecting the properties of the nonlinear springs among the values found in the FE component database. After the optimization, the component FE models corresponding to the optimal spring properties are “assembled” into a FE model of an entire structure.
2. Tuning of assembled FE model (Fig 2 (b)) by manually altering its geometry to match its crush mode (CM) – a sequence of axial crushing, twisting, and transversal bending during a crash event – with the one of the optimal EM.
Step 2 is an emulation of a process commonly known as “crash mode matching” among experienced vehicle designers [3], where the crash performance of a structure is improved by manually modifying the design until its CM matches the one the designers deem as optimal (in this case the CM of the optimal EM).
Fig. 2 Crashworthiness optimization with equivalent mechanism (EM) models: (a) optimization of EM model with FE component database, and (b) tuning of the obtained FE model by matching crush mode (CM) with the optimal EM.
Fig. 3 illustrates the importance of a crash mode is with an
example of a vehicle mid-rail subjected to frontal crash. Depending on the chosen structural member cross-section for zones 1, 2 and 3 of the rail, the behavior during crash can exhibit one of several crash modes, two of which are shown in Fig. 3. The crash mode exhibited by design A (Fig. 3 (a)) absorbs most of the crash energy in the form of axial crush in zone 1, while design B (Fig. 3 (b)) exhibits early and
crush simulation w/ EM
(a)
(b)
component D/B
re-iterate
CM – matched FE model
Crash Mode
assembled FE model
guess dimensions crash mode
assembled FE model
significant bending in zone 3. To an experienced designer, design A is immediately identified as a better design, because:
• It has less deformation at zone 3, which is nearest to the
passenger compartment • It better utilizes axial crushing, which is more efficient in
absorbing crash energy than bending
Thus, knowing the good CM gives designers insight as to how to improve the crashworthiness performance; a designer trying to improve design B, would observe the CM and know that zone 3 should be strengthened (eg. by increasing plate thickness), while zone 1 should be weakened (eg. by reducing the plate thickness). While the example illustrated in Fig. 3 is simple enough so that the best crash mode can be identified by inspection (without running any simulations), the best crash mode in larger, more complex structures can be very difficult to discover. Furthermore, running many FE simulations of sample designs to discover the good CM can be prohibitively expensive in larger structures. EM, on the other hand, is an attractive option for the exploration and discovery of the good crash mode.
Fig. 3 Vehicle front mid-rail subject to frontal crash. (a) design A exhibiting one crash mode and (b) design B exhibiting a different crash mode.
4. EQUIVALENT MECHANISM MODELS This section gives an overview of the EM model. Since
only main ideas are described due to the space limit, readers are advised to refer to [1] for further details.
In the equivalent mechanism (EM) models, the main structural members of the vehicle frame, which are typically modeled using plate or shell elements in finite element (FE) models, are approximated as sets of rigid masses connected by prismatic and revolute joints that have special nonlinear springs (Fig. 1). The deformation resistance behavior of the springs is chosen to capture the behavior of the structural members. The EM models are then solved using a conventional dynamic simulation algorithm, thereby providing an efficient estimation of the overall vehicle structure behavior.
(a) (b)
zone 1 zone 3 zone 2
barrier
100 ms
75 ms
100 ms
75 ms
40 ms 40 ms
3 Copyright © 2004 by ASME
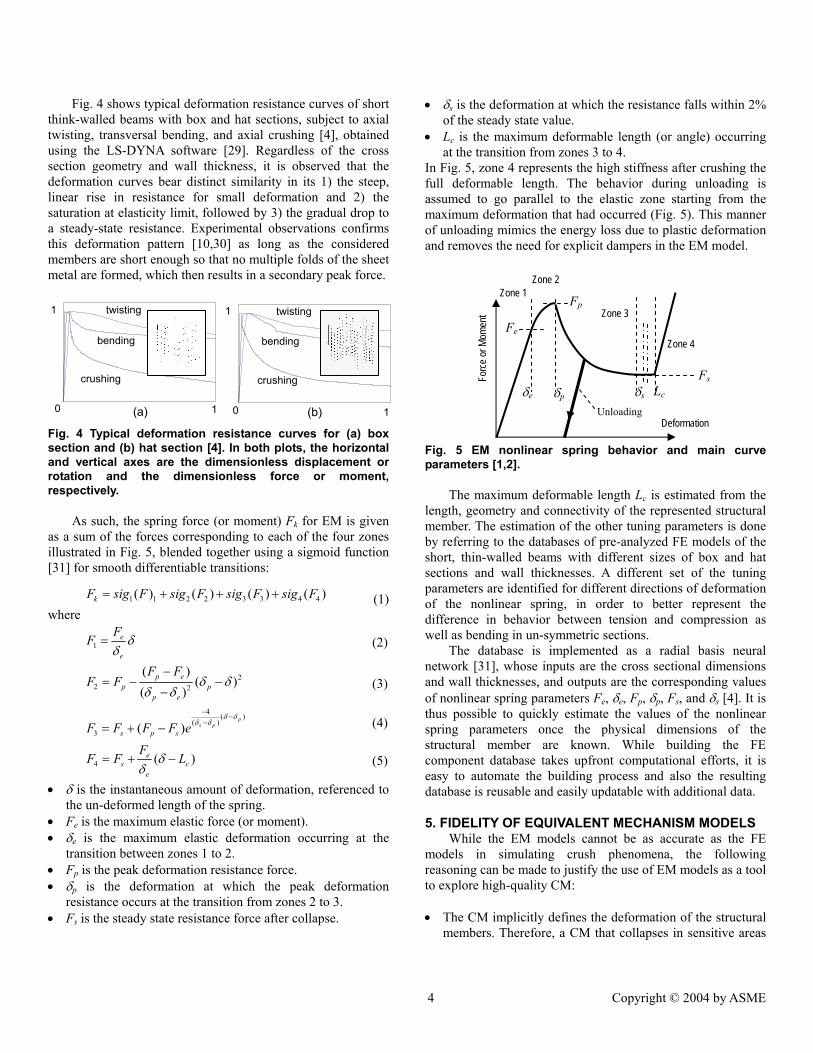
Fig. 4 shows typical deformation resistance curves of short think-walled beams with box and hat sections, subject to axial twisting, transversal bending, and axial crushing [4], obtained using the LS-DYNA software [29]. Regardless of the cross section geometry and wall thickness, it is observed that the deformation curves bear distinct similarity in its 1) the steep, linear rise in resistance for small deformation and 2) the saturation at elasticity limit, followed by 3) the gradual drop to a steady-state resistance. Experimental observations confirms this deformation pattern [10,30] as long as the considered members are short enough so that no multiple folds of the sheet metal are formed, which then results in a secondary peak force.
Fig. 4 Typical deformation resistance curves for (a) box section and (b) hat section [4]. In both plots, the horizontal and vertical axes are the dimensionless displacement or rotation and the dimensionless force or moment, respectively.
As such, the spring force (or moment) Fk for EM is given
as a sum of the forces corresponding to each of the four zones illustrated in Fig. 5, blended together using a sigmoid function [31] for smooth differentiable transitions:
1 1 2 2 3 3 4 4( ) ( ) ( ) ( )kF sig F sig F sig F sig F= + + + (1) where
1e
e
FF δδ
=
(2)
22 2
( )( )
( )p e
p pp e
F FF F δ δ
δ δ−
= − −−
(3)
4 ( )( )
3 ( )p
s ps p sF F F F e
δ δδ δ−
−−= + −
(4)
4 ( )es c
e
FF F Lδδ
= + −
(5)
• δ is the instantaneous amount of deformation, referenced to the un-deformed length of the spring.
• Fe is the maximum elastic force (or moment). • δe is the maximum elastic deformation occurring at the
transition between zones 1 to 2. • Fp is the peak deformation resistance force. • δp is the deformation at which the peak deformation
resistance occurs at the transition from zones 2 to 3. • Fs is the steady state resistance force after collapse.
(b) (a) 0
1
1
twisting
bending
crushing
0 1
crushing
bending
twisting 1
• δs is the deformation at which the resistance falls within 2% of the steady state value.
• Lc is the maximum deformable length (or angle) occurring at the transition from zones 3 to 4.
In Fig. 5, zone 4 represents the high stiffness after crushing the full deformable length. The behavior during unloading is assumed to go parallel to the elastic zone starting from the maximum deformation that had occurred (Fig. 5). This manner of unloading mimics the energy loss due to plastic deformation and removes the need for explicit dampers in the EM model.
Fig. 5 EM nonlinear spring behavior and main curve parameters [1,2].
The maximum deformable length Lc is estimated from the
length, geometry and connectivity of the represented structural member. The estimation of the other tuning parameters is done by referring to the databases of pre-analyzed FE models of the short, thin-walled beams with different sizes of box and hat sections and wall thicknesses. A different set of the tuning parameters are identified for different directions of deformation of the nonlinear spring, in order to better represent the difference in behavior between tension and compression as well as bending in un-symmetric sections.
The database is implemented as a radial basis neural network [31], whose inputs are the cross sectional dimensions and wall thicknesses, and outputs are the corresponding values of nonlinear spring parameters Fe, δe, Fp, δp, Fs, and δs [4]. It is thus possible to quickly estimate the values of the nonlinear spring parameters once the physical dimensions of the structural member are known. While building the FE component database takes upfront computational efforts, it is easy to automate the building process and also the resulting database is reusable and easily updatable with additional data.
5. FIDELITY OF EQUIVALENT MECHANISM MODELS While the EM models cannot be as accurate as the FE
models in simulating crush phenomena, the following reasoning can be made to justify the use of EM models as a tool to explore high-quality CM:
• The CM implicitly defines the deformation of the structural
members. Therefore, a CM that collapses in sensitive areas
Deformation
Force
or M
omen
t
Zone 1 Zone 2
Zone 3
Zone 4
Fp
δe δp
Fe
Fs δs
Unloading
Lc
4 Copyright © 2004 by ASME

(eg. passenger compartment) will be judged as being low quality in both EM and FE.
• With proper tuning of the nonlinear springs, the energy required to deform a segment of an EM model can accurately match to the FE model. Therefore, a CM that efficiently absorbs crash energy (by having more axially crushed members and less bending) will be judged as efficient in both EM and FE.
The above reasoning, however, assumes that EM model
can identify all feasible CMs in the FE model with the comparable number of frequencies. In an attempt to empirically validate the assumption, the capability of the EM models to identify crash modes is investigated using a simple two-zone column shown in Fig. 6. For various column geometries, the results of the EM models are compared with the FE simulations by LS-DYNA [29]. The column is fixed at both ends, while one end moves at a constant crush velocity at an inclination of 1:5 to the column axis. This simple geometry allows for a thorough investigation via full factorial experimental sampling of the column dimensions. Table 1 lists the values at the sample levels for the six parameters. The total number of samples in the full factorial experiment is 1536.
Fig. 6 A two-zone, box-section column subjected to offset axial crush.
Table 1 Parameter values for the two-zone column. Parameter Level 1 2 3 4 Box section height (h) [mm] 50 75 110 150 Box section width (b) [mm] 50 70 90 120 Thickness in zone 1 (t1) [mm] 1.0 1.6 2.4 3.2 Thickness in zone 2 (t2) [mm] 1.0 1.6 2.4 3.2 Length to height (L/h) 1 2 5 Crush velocity (v) [m/s] 1.0 15.0
The reference solutions are obtained by LS-DYNA using
the shell elements of the size no more than 25 mm and elastic-plastic material model for mild steel, typical material used for built-up sheet metal sections in the automotive industry. For both EM and LS-DYNA simulations, the positions of the column centroids at a constant interval along the column axis are recorded at fixed time intervals during the crash event. Since EM models employ the segmentation of the structural members (analogous to meshes in FE models), the results are presented for two different segmentation sizes.
Zone 1, t1 Zone 2, t2
1
5
L L
v
h
b
Fig. 7 shows the histogram of the time and space average of the absolute positional error relative to the column length, and Table 2 shows the sample statistics. It is observed that the average error of EM models (over all 1536 samples) is less than 4%, with a large standard deviation (~3%). In particular, approximately 72% of 1536 samples have less than 4% error, whereas a small fraction of samples has noticeably larger error values, causing the drop in the average. It is also observed that the reduced segment size did little improvement to the accuracy of the EM models, thereby suggesting that a segment size of 25 mm was adequate for this example.
0.00
5.00
10.00
15.00
20.00
25.00
30.00
35.00
2 3 4 5 6 7 8 9 10 11 12 13 14 15
Error [% of Column Length]%
of s
ampl
es
Fig. 7 Histogram of the time and space average of the absolute positional error relative to the column length
Table 2 Absolute positional error in EM model of the two-zone column.
EM Segment size 25.0mm
EM Segment size 12.5mm
Average positional error (% of column length) 3.88 % 3.58 %
Standard deviation (% of column length) 2.78 % 2.79 %
Error in Best Sample (% of column length) 1.00 % 0.94 %
Error in Worst Sample (% of column length) 15.47 % 14.50 %
Number of samples with error less than 6% 1312 1364
Number of samples with error greater than 10%
89 91
By observing the results of the FE simulations, four main
crash modes of the column are identified, which can be described as:
1. Axial crushing of zone 2 2. Axial crushing combined with bending of zone 2 3. Axial crushing of zone 1 4. Axial crushing combined with bending of zone 1 The number of samples belonging to each CM is listed in Table 3. It is apparent that the EM simulations are not guaranteed to
5 Copyright © 2004 by ASME

exhibit the exact CM as the corresponding FE model. When the CM is not captured correctly, the accuracy of EM models is noticeably poor, bringing down the average error in Table 2. Moreover, smaller segmentation size does not seem to improve the accuracy if the CM is incorrect. On the other hand, the EM successfully discovered all crush modes observed in the FE simulations with the comparable number of frequencies, which suggests the validity of the EM as a tool to explore high-quality crush modes, as discussed in the previous section. Table 3 Number of samples in observed crash modes for the two-zone column.
Number of Observed Samples CM # FE EM Segment
size 25.0mm EM Segment size 12.5mm
1 628 527 513 2 316 267 223 3 322 455 505 4 267 280 263
6. CASE STUDY: VEHICLE FRONT HALF BODY
6.1. Problem definition This section describes a case study on the front half body
of a mid-sized vehicle, subjected to full-lap frontal crash against a rigid barrier (Fig. 8), with the following specifications:
• All main structural members are hollow box-section • The engine and power train are represented as a rigid box of
mass 250 kg, connected to the engine mounting points via stiff beams.
• The rest of the vehicle mass (600 kg) is represented as a lumped mass connected to the structure via stiff beams.
• Crash speed is 15.6 m/s (35 mph) • Coefficient of friction at the rigid barrier is 0.3 • Material model is elastic-plastic for mild steel
There are 4 continuous and 14 discrete design variables:
• h1, b1 [mm]: height and width of box-section for upper rails
and cross members (continuous in [50, 150]). • h2, b2 [mm]: height and width of box-section for lower rails
and cross members (continuous in [50, 150]). • t1, …, t14 [mm]: sheet metal thickness of the box-section, for
structural zones 1 through 14 as indicated in Fig. 7 (discrete in {0.6, 0.8, 1.0, …, 4.2, 4.4}).
The design objective is to minimize the structural mass, subject to the constraints on the passenger safety:
• f [kg]: structural weight, to be minimized • g1 < 100 [mm]: intrusion into passenger cabin • g2 < 30 [G]: acceleration at passenger cabin
Fig. 8 Model of vehicle front half body, showing the main components and structural zones.
6.2 Construction of EM model Fig 9 shows the EM model of the front half of the vehicle
constructed by assembling nonlinear springs corresponding to the beam dimensions of the baseline design shown in the first column of Table 4. It should be noted that the “beams” in EM is simply a neutral axis of the corresponding structural members, with no zero cross-sectional area, whereas Fig 9 shows them with bounding boxes around the axes to provide a better visual clue to the user.
Fig. 9 EM Model of vehicle front half body.
While the baseline EM model showed a good qualitative
match with FE models during the first half of the crash event, it performed quite differently during the second half of the crash event (after 50 ms), as shown in Fig. 10. Further investigation revealed that the discrepancy comes from the significant absorption of kinetic energy in FE models by “side-crushing” of the bumper and front cross bar between the engine block and the rigid barrier. The effect of the “side-crushing” of beam
1
2 3
4
6
10
11
12
9
13
14
8
7
Engine & Power Train Rigid Barrier Rest of
vehicle mass
Ground
Suspension springs
5
6 Copyright © 2004 by ASME

cross section cannot be simulated in EM since it only observes the center line of the structural members.
To overcome this difficulty, a special constant-force spring was added to the equivalent mechanism models. The purpose of the special spring is to compensate for the difference in energy absorption that goes into the side-crushing of the bumper and front cross bar, which occurs during the earlier stages of the crash event. A first order model for the spring force [kN] as a function of box-section dimension of the bumper (h1, b1, t1) and the lower cross bar (h2, b2, t10) was constructed using the designs sampled around the base-line design as:
1 1 1 2
2 2
2.0 1.13 5.4 2.0 2.4 14.5 400
kcF h b t hb t
= + + ++ + −
, 40time ms≤
0kcF = , 40time ms> (6)
The addition of this constant force spring significantly
improved the performance of the EM model. Table 4 shows the total kinetic energy discrepancy after 40ms of the crash event between EM and FE models for the base-line design and three more samples used in the construction of the first order model of the spring. It is observed that first order model of the spring is quite successful in significantly reducing the total kinetic energy discrepancy between EM and FE models. This resulted in successfully capturing the crash mode in the EM model simulation for the base-line design (Fig. 11). At this point, we concluded the EM model can capture CM with reasonable accuracy and hence ready for the exploration of the crash modes via parametric optimization.
Fig. 10 Snap shots of crash time history for base-line design, as estimated by FE and EM models.
FE Model
40ms
EM Model
40ms
80ms 80ms
Isometric Side view
Isometric Side view
Isometric Side view
Isometric Side view
Fig. 11 Top view close-up of FE model, showing the engine block as it crushes the side of the bumper and lower cross bar.
Table 4 Kinetic energy discrepancy between EM and FE models at 40ms of the crash event for selected designs. Sample
Baseline design 1 2 3
h1 [mm] 120.0 100.0 120.0 100.0 b1 [mm] 80.0 60.0 60.0 60.0 t1 [mm] 3.2 3.2 2.4 3.2 h2 [mm] 90.0 90.0 90.0 70.0 b1 [mm] 100.0 100.0 80.0 80.0 t10 [mm] 2.4 2.4 2.4 2.0 K.E. discrepancy – no constant force spring [kJ]
31.4 28.9 30.0 21.7
Fkc [kN] 400.0 337.5 325.2 245.2 K.E. discrepancy – with constant force spring [kJ]
-0.3* 2.1 4.2 2.2
* negative sign indicates that the EM model has less kinetic energy than the corresponding FE model.
6.3 Optimization of EM model with FE component database
Identification of a high-quality CM is performed by optimizing the EM model with a genetic algorithm. Genetic algorithms (GA) is a stochastic heuristic algorithm requiring no derivative information of the objective and constraints and suitable for discrete or mixed-discrete optimization problems [32, 33]. Each candidate design generated by GA is passed to the FE component database, which translates the box-section dimensions into the equivalent spring parameters for the EM model. The EM model is then used to estimate the crash response to evaluate the objective and constraints and passes them to GA. Since the objective of the GA run is only to identify the good CM, a large GA population and a few generations are used:
• Population size: 120
Top view, close-up
Engine block
Barrier
Lower cross bar Bumper
Mid rail
Lower rail Isometric view
7 Copyright © 2004 by ASME
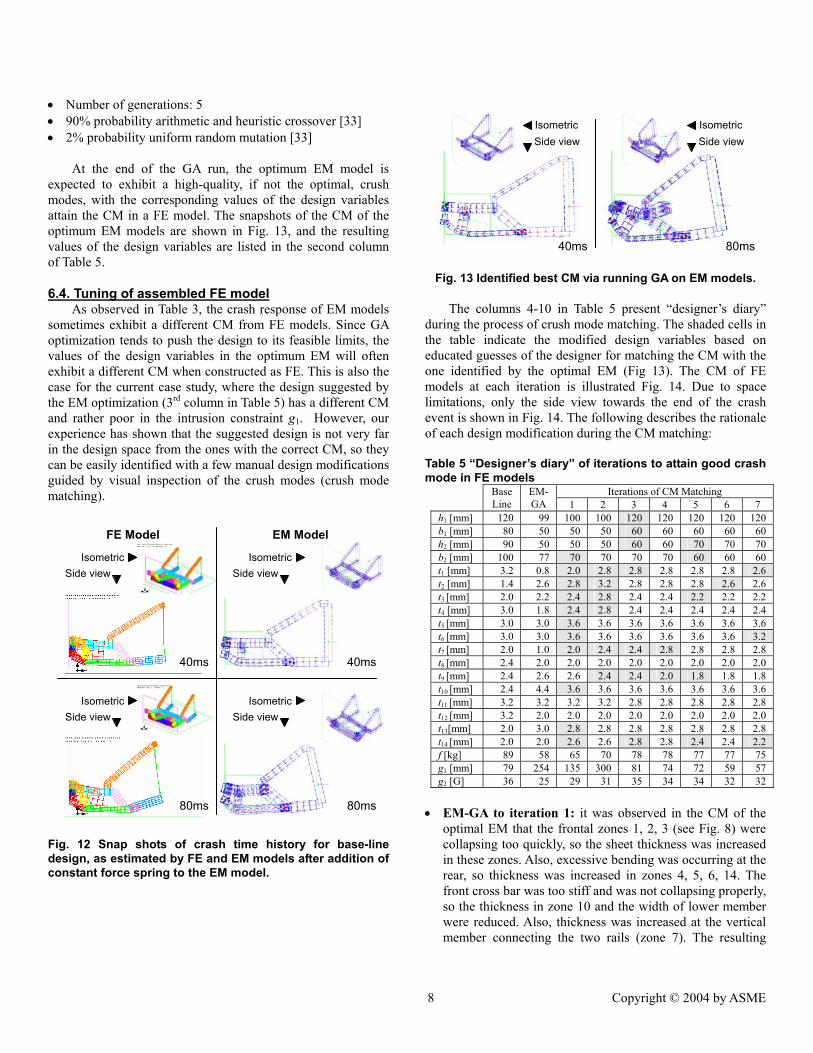
• Number of generations: 5 • 90% probability arithmetic and heuristic crossover [33] • 2% probability uniform random mutation [33]
At the end of the GA run, the optimum EM model is
expected to exhibit a high-quality, if not the optimal, crush modes, with the corresponding values of the design variables attain the CM in a FE model. The snapshots of the CM of the optimum EM models are shown in Fig. 13, and the resulting values of the design variables are listed in the second column of Table 5.
6.4. Tuning of assembled FE model As observed in Table 3, the crash response of EM models
sometimes exhibit a different CM from FE models. Since GA optimization tends to push the design to its feasible limits, the values of the design variables in the optimum EM will often exhibit a different CM when constructed as FE. This is also the case for the current case study, where the design suggested by the EM optimization (3rd column in Table 5) has a different CM and rather poor in the intrusion constraint g1. However, our experience has shown that the suggested design is not very far in the design space from the ones with the correct CM, so they can be easily identified with a few manual design modifications guided by visual inspection of the crush modes (crush mode matching).
Fig. 12 Snap shots of crash time history for base-line design, as estimated by FE and EM models after addition of constant force spring to the EM model.
FE Model
40ms
EM Model
40ms
80ms 80ms
Isometric Side view
Isometric Side view
Isometric Side view
Isometric Side view
Fig. 13 Identified best CM via running GA on EM models.
The columns 4-10 in Table 5 present “designer’s diary”
during the process of crush mode matching. The shaded cells in the table indicate the modified design variables based on educated guesses of the designer for matching the CM with the one identified by the optimal EM (Fig 13). The CM of FE models at each iteration is illustrated Fig. 14. Due to space limitations, only the side view towards the end of the crash event is shown in Fig. 14. The following describes the rationale of each design modification during the CM matching: Table 5 “Designer’s diary” of iterations to attain good crash mode in FE models
Iterations of CM Matching Base Line
EM-GA 1 2 3 4 5 6 7
h1 [mm] 120 99 100 100 120 120 120 120 120 b1 [mm] 80 50 50 50 60 60 60 60 60 h2 [mm] 90 50 50 50 60 60 70 70 70 b2 [mm] 100 77 70 70 70 70 60 60 60 t1 [mm] 3.2 0.8 2.0 2.8 2.8 2.8 2.8 2.8 2.6 t2 [mm] 1.4 2.6 2.8 3.2 2.8 2.8 2.8 2.6 2.6 t3 [mm] 2.0 2.2 2.4 2.8 2.4 2.4 2.2 2.2 2.2 t4 [mm] 3.0 1.8 2.4 2.8 2.4 2.4 2.4 2.4 2.4 t5 [mm] 3.0 3.0 3.6 3.6 3.6 3.6 3.6 3.6 3.6 t6 [mm] 3.0 3.0 3.6 3.6 3.6 3.6 3.6 3.6 3.2 t7 [mm] 2.0 1.0 2.0 2.4 2.4 2.8 2.8 2.8 2.8 t8 [mm] 2.4 2.0 2.0 2.0 2.0 2.0 2.0 2.0 2.0 t9 [mm] 2.4 2.6 2.6 2.4 2.4 2.0 1.8 1.8 1.8 t10 [mm] 2.4 4.4 3.6 3.6 3.6 3.6 3.6 3.6 3.6 t11 [mm] 3.2 3.2 3.2 3.2 2.8 2.8 2.8 2.8 2.8 t12 [mm] 3.2 2.0 2.0 2.0 2.0 2.0 2.0 2.0 2.0 t13[mm] 2.0 3.0 2.8 2.8 2.8 2.8 2.8 2.8 2.8 t14 [mm] 2.0 2.0 2.6 2.6 2.8 2.8 2.4 2.4 2.2 f [kg] 89 58 65 70 78 78 77 77 75 g1 [mm] 79 254 135 300 81 74 72 59 57 g2 [G] 36 25 29 31 35 34 34 32 32
• EM-GA to iteration 1: it was observed in the CM of the optimal EM that the frontal zones 1, 2, 3 (see Fig. 8) were collapsing too quickly, so the sheet thickness was increased in these zones. Also, excessive bending was occurring at the rear, so thickness was increased in zones 4, 5, 6, 14. The front cross bar was too stiff and was not collapsing properly, so the thickness in zone 10 and the width of lower member were reduced. Also, thickness was increased at the vertical member connecting the two rails (zone 7). The resulting
40ms 80ms
Isometric Side view
Isometric Side view
8 Copyright © 2004 by ASME

design of iteration 1 had a much better cabin intrusion performance of 135 mm compared to 254 mm, but was still short of the target performance of 100 mm.
• Iterations 1 to 2: in an attempt to further prevent too early collapse of the front zones, the thickness in zones 1, 2, 3, 4, 7, 9 was increased, but this resulted in zone 3 not collapsing at all, so iteration 2 was abandoned as its performance was poor.
• Iterations 2 to 3: Prevention of too early collapse of the front structural zones was next attempted by increasing the width of upper structural members and height of lower structural members, as well as an increase of sheet thickness in zones 1, 7, 9. Sheet thickness in zone 14 was also slightly increased to further resist the bending at the rear. The resulting design did achieve an acceptable cabin intrusion of 81 mm, but the maximum acceleration became 35G, which was slightly above the target of 30G.
• Iterations 3 to 4: the slight CM mismatch between iteration 3 and the target CM identified by the optimal EM (Fig. 13) seemed to be apparent at zone 9, which was not axially deforming but got bent at the connection to zones 7 and 11. An attempted remedy was to decrease the thickness in zone 9, and increase it in zone 7. The resulting design more closely resembled the target CM and had less structural weight. It also performed better than iteration 3 in both cabin intrusion and acceleration. However, the acceleration level was at 34 g, which was still above the target of 30 g.
Fig. 14 Designers’ diary of iterations to attain good crash mode in FE models.
Suggested by EM-GA
Iteration 1
Iteration 2 Iteration 3
Iteration 4 Iteration 5
Iteration 6 Iteration 7
• Iterations 4 to 5: the CM of iteration 4 still had more bending and less axial deformation in zone 9. To counter the bending, the box-section height and width for the lower members were flipped. Also, thickness in zones 9, 3 14 were reduced. The resulting design had the correct deformation pattern at the end of the crash event as well as slightly improved cabin intrusion and acceleration.
• Iterations 5 to 7: now that the final deformation pattern matched that of the target CM, there is less insight to guide the designer as to where to make design changes. Observing intermediate stages of the crash event suggested that the design of iteration 5 was slightly over-stiff at zone 2. By reducing the thickness at zone 2, an improvement of the acceleration was observed. However, the acceleration at iteration 6 was still slightly higher than the desired target of 30 g. The design of iteration 6 was deemed as having the desired CM, further improvement attempts were purely based on designer intuition. A slight reduction of the thickness at the rear zones 6, 14, and at the bumper (zone 1) succeeded in slight improvements of the acceleration and cabin intrusion, as well as reduction of the total structural weight. Two more attempted design changes (not shown) were unsuccessful and the CM matching was concluded.
The final obtained design at iteration 7 was a successful reduction of the structural weight, cabin intrusion and acceleration over the base-line design. The acceleration response was however still slightly above the desired target.
6.5 Direct parametric optimization of FE models To obtain the optimal solution to the given problem, the
direct parametric optimization of FE models via GA was performed. Although GA typically requires many function evaluation and thus unsuitable for crash problems, the adopted version of GA used an initial population that was carefully seeded by including many diverse and good designs, which were obtained via an orthogonal array [34] of the design variables. The GA parameters used are given as:
• Population size: 50 and initial population seeding: 30% • Number of generations: 12 • Maximum number of function evaluations: 500 • 90% probability arithmetic and heuristic crossover [33] • 2% probability uniform random mutation [33]
The best design is listed in Table 6 along with the baseline design and that of iteration 7 of the proposed approach. The designs are also displayed in spider web diagrams (Fig. 15). It was noticed that the best design by GA was only 5% lighter than the proposed approach. Moreover, both designs didn’t exactly meet the target acceleration of 30 G and only attained a near-feasible status along that constraint. Interestingly too, the best design by GA had the identical CM as in the proposed approach (Fig. 16).
9 Copyright © 2004 by ASME

Table 6 Result of direct optimization by running GA on FE models as it compares to base-line design and the design obtained by CM matching via the proposed approach.
Base Line Proposed Approach
GA on FE Models
h1 [mm] 120 120 116 b1 [mm] 80 60 77 h2 [mm] 90 70 87 b2 [mm] 100 60 96 t1 [mm] 3.2 2.6 2.4 t2 [mm] 1.4 2.6 1.8 t3 [mm] 2.0 2.2 1.6 t4 [mm] 3.0 2.4 2.6 t5 [mm] 3.0 3.6 3.0 t6 [mm] 3.0 3.2 2.8 t7 [mm] 2.0 2.8 1.6 t8 [mm] 2.4 2.0 3.0 t9 [mm] 2.4 1.8 2.0 t10 [mm] 2.4 3.6 2.0 t11 [mm] 3.2 2.8 2.2 t12 [mm] 3.2 2.0 3.2 t13[mm] 2.0 2.8 0.8 t14 [mm] 2.0 2.2 1.6 f [kg] 89 75 71 g1 [mm] 79 57 83 g2 [G] 36 32 31 Total comp. time* [hr] – 55 350
* Computations were performed on a 3.2GHz, 1.0GB RAM PC
Fig. 15 Spider web diagram summary of case study results.
Base-Line Design Proposed ApproachGA on FE Models
1h1b
2h
2b
1t
2t
3t
4t
5t6t7t8t
9t
10t
11t
12t13t
14t
f
1g2g
Fig. 16 Crash modes of best obtained designs via running GA directly on FE models and via the proposed approach.
7. DISCUSSION AND FUTURE WORK The approach proposed in this paper is our first attempt
toward a computational emulation of crash mode matching used by experienced vehicle designers. The proposed design process includes two main phases: 1) discovery of the good crash mode and 2) matching the design to the desired CM. It is intended for earlier design stages, where fine geometric details are unknown. For the efficient discovery of the good CM, equivalent mechanism approximations are employed within a short GA run. Matching the CM is manually performed by the designer. While the CM matching via manual tuning of the FE model is rather empirical and can be potentially divergent, the results of the case study clearly indicated otherwise. The authors conjectured this was due to the fact that 1) a crush mode of the optimal EM is also a highly effective, if not optimal, energy absorption strategy for the FE model, and 2) the assembled FE model is already close to the design domain that exhibits the CM of the optimal EM.
The overall computational efficiency of the proposed approach was clearly better than the direct parametric optimization of FE models as summarized in Fig. 17. The total computational time in the proposed approach included approximately 10 FE runs for construction and validation of the bumper side crush spring, 600 EM simulations for the discovery of CM and 10 FE runs for CM matching. While the quality of the best obtain design via both approaches was comparable, direct optimization of FE models employed 500 FE runs, which required 6 to 7 times more computational resources than the proposed approach. By comparing computational time of EM and FE models in the 3D case study with the simpler 2D case studies [1, 2], it is also expected that the computational efficiency runs more in favor of the proposed approach as models become larger and more complex. For
Direct GA on FE Models
40ms
Itr 7 of Proposed Approach
40ms
80ms 80ms
Isometric Side view
Isometric Side view
Isometric Side view
Isometric Side view
10 Copyright © 2004 by ASME
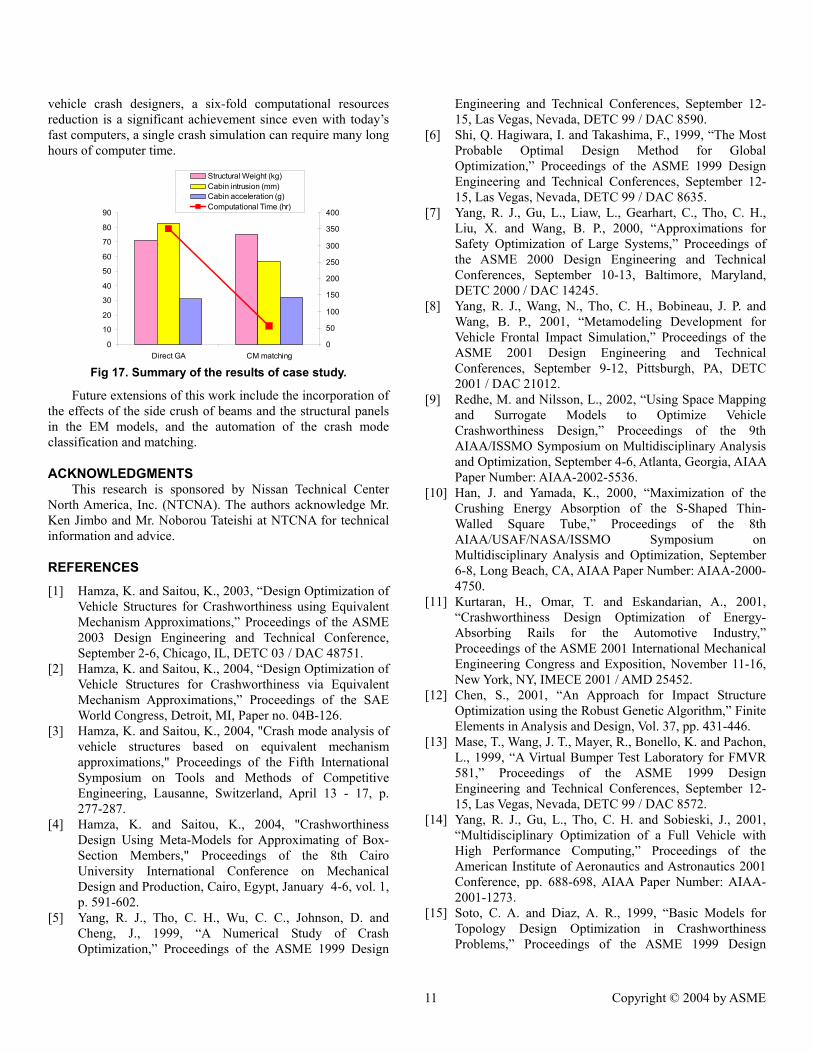
vehicle crash designers, a six-fold computational resources reduction is a significant achievement since even with today’s fast computers, a single crash simulation can require many long hours of computer time.
0
10
20
30
40
50
60
70
80
90
Direct GA CM matching0
50
100
150
200
250
300
350
400
Structural Weight (kg)Cabin intrusion (mm)Cabin acceleration (g)Computational Time (hr)
Fig 17. Summary of the results of case study.
Future extensions of this work include the incorporation of the effects of the side crush of beams and the structural panels in the EM models, and the automation of the crash mode classification and matching.
ACKNOWLEDGMENTS This research is sponsored by Nissan Technical Center
North America, Inc. (NTCNA). The authors acknowledge Mr. Ken Jimbo and Mr. Noborou Tateishi at NTCNA for technical information and advice.
REFERENCES
[1] Hamza, K. and Saitou, K., 2003, “Design Optimization of Vehicle Structures for Crashworthiness using Equivalent Mechanism Approximations,” Proceedings of the ASME 2003 Design Engineering and Technical Conference, September 2-6, Chicago, IL, DETC 03 / DAC 48751.
[2] Hamza, K. and Saitou, K., 2004, “Design Optimization of Vehicle Structures for Crashworthiness via Equivalent Mechanism Approximations,” Proceedings of the SAE World Congress, Detroit, MI, Paper no. 04B-126.
[3] Hamza, K. and Saitou, K., 2004, "Crash mode analysis of vehicle structures based on equivalent mechanism approximations," Proceedings of the Fifth International Symposium on Tools and Methods of Competitive Engineering, Lausanne, Switzerland, April 13 - 17, p. 277-287.
[4] Hamza, K. and Saitou, K., 2004, "Crashworthiness Design Using Meta-Models for Approximating of Box-Section Members," Proceedings of the 8th Cairo University International Conference on Mechanical Design and Production, Cairo, Egypt, January 4-6, vol. 1, p. 591-602.
[5] Yang, R. J., Tho, C. H., Wu, C. C., Johnson, D. and Cheng, J., 1999, “A Numerical Study of Crash Optimization,” Proceedings of the ASME 1999 Design
Engineering and Technical Conferences, September 12-15, Las Vegas, Nevada, DETC 99 / DAC 8590.
[6] Shi, Q. Hagiwara, I. and Takashima, F., 1999, “The Most Probable Optimal Design Method for Global Optimization,” Proceedings of the ASME 1999 Design Engineering and Technical Conferences, September 12-15, Las Vegas, Nevada, DETC 99 / DAC 8635.
[7] Yang, R. J., Gu, L., Liaw, L., Gearhart, C., Tho, C. H., Liu, X. and Wang, B. P., 2000, “Approximations for Safety Optimization of Large Systems,” Proceedings of the ASME 2000 Design Engineering and Technical Conferences, September 10-13, Baltimore, Maryland, DETC 2000 / DAC 14245.
[8] Yang, R. J., Wang, N., Tho, C. H., Bobineau, J. P. and Wang, B. P., 2001, “Metamodeling Development for Vehicle Frontal Impact Simulation,” Proceedings of the ASME 2001 Design Engineering and Technical Conferences, September 9-12, Pittsburgh, PA, DETC 2001 / DAC 21012.
[9] Redhe, M. and Nilsson, L., 2002, “Using Space Mapping and Surrogate Models to Optimize Vehicle Crashworthiness Design,” Proceedings of the 9th AIAA/ISSMO Symposium on Multidisciplinary Analysis and Optimization, September 4-6, Atlanta, Georgia, AIAA Paper Number: AIAA-2002-5536.
[10] Han, J. and Yamada, K., 2000, “Maximization of the Crushing Energy Absorption of the S-Shaped Thin-Walled Square Tube,” Proceedings of the 8th AIAA/USAF/NASA/ISSMO Symposium on Multidisciplinary Analysis and Optimization, September 6-8, Long Beach, CA, AIAA Paper Number: AIAA-2000-4750.
[11] Kurtaran, H., Omar, T. and Eskandarian, A., 2001, “Crashworthiness Design Optimization of Energy-Absorbing Rails for the Automotive Industry,” Proceedings of the ASME 2001 International Mechanical Engineering Congress and Exposition, November 11-16, New York, NY, IMECE 2001 / AMD 25452.
[12] Chen, S., 2001, “An Approach for Impact Structure Optimization using the Robust Genetic Algorithm,” Finite Elements in Analysis and Design, Vol. 37, pp. 431-446.
[13] Mase, T., Wang, J. T., Mayer, R., Bonello, K. and Pachon, L., 1999, “A Virtual Bumper Test Laboratory for FMVR 581,” Proceedings of the ASME 1999 Design Engineering and Technical Conferences, September 12-15, Las Vegas, Nevada, DETC 99 / DAC 8572.
[14] Yang, R. J., Gu, L., Tho, C. H. and Sobieski, J., 2001, “Multidisciplinary Optimization of a Full Vehicle with High Performance Computing,” Proceedings of the American Institute of Aeronautics and Astronautics 2001 Conference, pp. 688-698, AIAA Paper Number: AIAA-2001-1273.
[15] Soto, C. A. and Diaz, A. R., 1999, “Basic Models for Topology Design Optimization in Crashworthiness Problems,” Proceedings of the ASME 1999 Design
11 Copyright © 2004 by ASME

Engineering and Technical Conferences, September 12-15, Las Vegas, Nevada, DETC 99 / DAC 8591.
[16] Song, J. O., 1986, “An Optimization Method for Crashworthiness Design,” SAE transactions, Paper number 860804, pp. 39-46.
[17] Bennett, J. A., Lust, R. V. and Wang, J.T., 1991, “Optimal Design Strategies in Crashworthiness and Occupant Protection,” ASME Winter Annual Meeting, Atlanta, GA, AMD - Vol. 126, pp. 51-66.
[18] Chellappa, S. and Diaz, A., 2002, “A Multi-Resolution Reduction Scheme for Structural Design,” Proceeding of the NSF 2002 Conference, January 2002, pp. 98-107.
[19] Ignatovich, C. L. and Diaz, A., 2002, “Physical Surrogates in Design Optimization for Enhanced Crashworthiness,” Proceedings of the 9th AIAA/ISSMO Symposium on Multidisciplinary Analysis and Optimization, September 4-6, Atlanta, Georgia, AIAA Paper Number: AIAA-2002-5537.
[20] Mayer, R. R., Kikuchi, N. and Scott, R. A., 1996, “Application of Topological Optimization Techniques to Structural Crashworthiness,” International Journal for Numerical Methods in Engineering, Vol. 39, pp. 1383-1403.
[21] Mayer, R. R., 2001, “Application of Topological Optimization Techniques to Automotive Structural Design,” Proceedings of the ASME 2001 International Mechanical Engineering Congress and Exposition, November 11-16, New York, NY, IMECE 2001 / AMD 25458.
[22] Luo, J., Gea, H. C. and Yang, R. J., 2000, “Topology Optimization for Crush Design,” Proceedings of the 8th AIAA/USAF/NASA/ISSMO Symposium on Multidisciplinary Analysis and Optimization, September 6-8, Long Beach, CA, AIAA Paper Number: AIAA-2000-4770.
[23] Mayer, R. R., Maurer, D. and Bottcher, C., 2000, “Application of Topological Optimization Program to the Danner Test Simulation,” Proceedings of the ASME 2000 Design Engineering and Technical Conferences, September 10-13, Baltimore, Maryland, DETC 2000 / DAC 14292.
[24] Gea, H. C. and Luo, J., 2001, “Design for Energy Absorption: A Topology Optimization Approach,” Proceedings of the ASME 2001 Design Engineering and Technical Conferences, September 9-12, Pittsburgh, PA, DETC 2001 / DAC 21060.
[25] Soto, C. A., 2001, “Optimal Structural Topology Design for Energy Absorption: A Heurtistic Approach,” Proceedings of the ASME 2001 Design Engineering and Technical Conferences, September 9-12, Pittsburgh, PA, DETC 2001 / DAC 21126.
[26] Soto, C. A., 2001, “Structural Topology for Crashworthiness Design by Matching Plastic Strain and Stress Levels,” Proceedings of the ASME 2001 International Mechanical Engineering Congress and
Exposition, November 11-16, New York, NY, IMECE 2001 / AMD 25455.
[27] Abramowicz, W., 2003, “Thin-Walled Structures as Impact Energy Absorbers,” Thin Walled Structures, Vol. 41, pp. 91-107.
[28] Takada, K. and Abramowicz, W., 2004, “Fast Crash Analysis of 3D Beam Structures Based on Object Oriented Formulation,” Proceedings of the 2004 SAE World Congress, Detroit, Michigan, Paper no. 04B-119.
[29] LSTC, 2001, LS-DYNA Software Manuals, Livermore Software Technology Corporation, Livermore, CA, USA.
[30] Koanti, R. P. and Caliskan, A. G., 2001, “Stochastic Applications in Crashworthiness,” Proceedings of the 2001 ASME International Mechanical Engineering Congress and Exposition, November 11-16, New York, NY, IMECE 2001 / AMD 25433.
[31] MathWorks, 2001, MatLab 6 Documentation, MathWorks Inc., Natick, MA, USA.
[32] Goldberg, D., 1989, “Genetic Algorithms in Search, Optimization and Machine Learning,” Addison-Wesley Inc.
[33] Michalewiz, Z. and Fogel, D. B., 2000, “How to Solve it: Modern Heuristics,” Springer-Verlag Berlin Heidelberg, New York.
[34] Phadke, M., 1989, “Quality Engineering Using Robust Design,” Prentice Hall.
12 Copyright © 2004 by ASME