Design, Fabrication and CFD Analysis of Jet Impingement ...
15
ISSN: 2237-0722 Vol. 11 No. 4 (2021) Received: 07.01.2021 – Accepted: 28.05.2021 22 Design, Fabrication and CFD Analysis of Jet Impingement Solar Dryer for Copra M. Kannan 1 , P.M. Venkatesh 2 , A.R. Vijay Babu 3* , Vibha Parmar 4 1 School of Energy, Department of Mechanical Engineering, PSG College of Technology, Coimbatore, Tamil Nadu, India. 1 [email protected] 2 Department of Electrical and Electronics Engineering, Vignan’s Foundation of Science Technology and Research, Guntur, Andhra Pradesh, India. 2 [email protected] 3* Department of Electrical and Electronics Engineering, Vignan’s Foundation of Science Technology and Research, Guntur, Andhra Pradesh, India. 3* [email protected] 4 M & V Patel, Department of Electrical Engineering, Charotar University of Science and Technology, Changa, Gujarat, India. 4 [email protected] Abstract This Paper attempts to study the variation of simulation and fabricated jet impingement dryer to define how to increase efficiency, temperature and best quality of the dryer. The jet impingement is helps to increase the overall temperature of the exhaust air. where increasing the temperature slightly and velocity ranges of drying time as been reduced. The experimental process has been carried in the copra. From the CFD analysis end results establish the flow jet impingement processing on the absorber where a strong function of heat transfer enhancement. The present process concludes that the mass flow ranges of air as been influence the heat transfer rates. At solar radiation 500-1000 (W/M 2 ), 348K ambient temperature and 0.048(Kg/S) mass flow ranges has been get at the end analysis. Now a day the new model innovations are needed in solar dryer to fulfil the requirements of drying industrial and agricultural products. The new design process analysis and assumptions are very necessary to design any system. By comparison solar drying fulfil the requirements than sun drying processing. Under the such process and conditions Effect of mass flow ranges of air, solar radiation on exit air temperature, and efficiency has been analyzed. Key-word: Collector, Dryer Temperature, Absorber Plate, CFD Analyszing, Etc.
Transcript of Design, Fabrication and CFD Analysis of Jet Impingement ...

ISSN: 2237-0722
Vol. 11 No. 4 (2021)
Received: 07.01.2021 – Accepted: 28.05.2021
22
Design, Fabrication and CFD Analysis of Jet Impingement Solar Dryer for Copra
M. Kannan1, P.M. Venkatesh2, A.R. Vijay Babu3*, Vibha Parmar4
1School of Energy, Department of Mechanical Engineering, PSG College of Technology, Coimbatore, Tamil
Nadu, India. [email protected]
2Department of Electrical and Electronics Engineering, Vignan’s Foundation of Science Technology and
Research, Guntur, Andhra Pradesh, India. [email protected]
3*Department of Electrical and Electronics Engineering, Vignan’s Foundation of Science Technology and
Research, Guntur, Andhra Pradesh, India. 3*[email protected]
4M & V Patel, Department of Electrical Engineering, Charotar University of Science and Technology, Changa,
Gujarat, India. [email protected]
Abstract
This Paper attempts to study the variation of simulation and fabricated jet impingement dryer to
define how to increase efficiency, temperature and best quality of the dryer. The jet impingement is
helps to increase the overall temperature of the exhaust air. where increasing the temperature
slightly and velocity ranges of drying time as been reduced. The experimental process has been
carried in the copra.
From the CFD analysis end results establish the flow jet impingement processing on the absorber
where a strong function of heat transfer enhancement. The present process concludes that the mass
flow ranges of air as been influence the heat transfer rates. At solar radiation 500-1000 (W/M2),
348K ambient temperature and 0.048(Kg/S) mass flow ranges has been get at the end analysis.
Now a day the new model innovations are needed in solar dryer to fulfil the requirements of drying
industrial and agricultural products. The new design process analysis and assumptions are very
necessary to design any system. By comparison solar drying fulfil the requirements than sun drying
processing. Under the such process and conditions Effect of mass flow ranges of air, solar radiation
on exit air temperature, and efficiency has been analyzed.
Key-word: Collector, Dryer Temperature, Absorber Plate, CFD Analyszing, Etc.

ISSN: 2237-0722
Vol. 11 No. 4 (2021)
Received: 07.01.2021 – Accepted: 28.05.2021
23
1. Introduction
The Solar drying technology which exposes the food to sunlight, where they used to reduced
the moisture content from the food naturally[1]. In drying process two process has been taken placed
such as heat transfer of the product and mass at interior region, the product to surface and surfaces to
surrounding air. For agricultural drying process the formers used both open sun drying or natural
drying, which drying process achieves by humidity of air, ambient temperature, solar radiation and
wind. From the sun drying analysis and nowadays solar dryer needs easy to use, economic drying,
faster drying rate. Drying which involve on all three process, transfer of heat, convection, radiation
and conduction for enhanced drying. The some of disadvantages from the natural or sun drying
techniques involved suffer from the dirt, dust, pollutions, rodent attacks, etc. These disadvantages are
removed by using a solar dryer[2].
The active dryer are unnatural convections dryers and the hybrid solar dryers. Required air
flow rate is used to provide in drying overall the whole ranges to control the temperature and
moisture ranges[3]. By using forced convection the drying time reduced to three times and half of the
area reduced for collector surfaces. The some of disadvantages from the natural or sun drying
techniques involved suffer from the dirt, dust, pollutions, rodent attacks, etc. These disadvantages are
removed by using a solar dryer [4-5]. The air circulation for solar air heater been split into two stages
such as primary type air may flows over the absorber or behind the plates[6].
Nomenclature Ac Collector area (m2)
Cp Specific heat of the air
HA Solar radiation (W/m2)
m Moisture content (%)
Tamb Ambient Temperature(°C)
Ti Collector Temperature at entry stage (°C)
To Collector Temperature at outlet stage (°C)
ΔT Change in temperature difference (°C)
t Time(h)
ma Air flow rate (kg/s)
L Collector Length(m)
W Collector Width (m)
UL Heat losses coeifficient (W/m2°C)
ɳC Overall efficiency of collector (%)
Va Wind velocity(m/s)
G Global radiation (W/m2)
Qu The Overall heat losses at the collector (W)
Ib Direct usual beam radiations (kwh/m2/day)
Id Diffused parallel radiations (kwh/m2/day)

ISSN: 2237-0722
Vol. 11 No. 4 (2021)
Received: 07.01.2021 – Accepted: 28.05.2021
24
2. Methods and Materials
2.1. Solar Dryer and Site
Experiment study as been performed during January 2020 at the SJS oil mill Salem. A jet
impinging type dryer as been fabricated and placed at SJS oil mill, Salem (India). Longitude
77.1460E: Latitude: 11.6643N. Salem has moderate climatic condition. Solar radiations spotted over
the every year average on the horizontal surfaces in Salem is found to be 756W/m2 and it is max
range of (1250W/m2) in summer and avg solar radiations as been spotted 870W/m2. The total solar
radiation on a 21.663 tilt surfaces towards the south direction is observed to be 630 W/m2.
2.2. Experimental Procedure
The drying chamber shown in figure 1 is made from GI of 5mm thick and trays are made from
aluminium mesh and placed inside the chamber. The collector was tilted by 21.6643ᵒ where overall
length, width, and height of collector dimensions is 1.2 m x 0.5m x 0.15m. The 0.005m thickness
transparent glass cover was used and 0.001m thick of copper corrugated plate used as absorber plate.
The drying chamber was made from GI of 5mm thick and trays are made from aluminium mesh and
placed inside the chamber. The perforated plate consists of 6mm holes section to test the flow of the
dryer. The collector was made from GI of 5mm thickness. The 0.05m of polyurethane and with
thermal conductivity 0.0288 W/m2 K used for prevent the collector.
Figure 1 - Schematic View of Solar Dryer
ISSN: 2237-0722
Vol. 11 No. 4 (2021)
Received: 07.01.2021 – Accepted: 28.05.2021
25
Testing as been done in the month of January, the dryer was fixed under the sun with facing
south directions to get better performances. Here we used pt-100 sensor which indicate the maximum
accurate range of temperature. Here we using DHT22 Sensor for measuring the humidity of air at
higher accuracy. In this experiment we used TES 1333 Solar power meter for measuring the solar
intensity with better accuracy. Temperature reading as been recorded on hourly ranges starting from
9AM – 4PM.
2.3. Instrumentation and Experimental Process
Experiments as been conducted to study the properties and process of copra. Copra is the one
of the highest production in India and having good nutritive values used for various applications.
During these experiments the climatic conditions are moderately sunny. The experimental process
were conducted from February to march 2020 at SJS mill, Salem. The moisture ranges as been
determined regularly by weighing copra for every hour. The experimental setup is shown in figure 2
and perforated plate is shown in figure 3.
Figure 2 - Overall Position of Jet Impinging Dryer
Figure 3 - Perforated Plate

ISSN: 2237-0722
Vol. 11 No. 4 (2021)
Received: 07.01.2021 – Accepted: 28.05.2021
26
The new fresh copra are used for drying, 6-8mm thickness of copra was selected. The copra
are placed uniformly on the two trays. The mass of 2.5kg of copra are used for drying in the chamber.
While performing this experiment completely closed the door to prevent from thermal leakages.
During this process the solar dryer as been tested under by solar radiation, humidity, moisture level of
copra for every one hour interval of time.
2.4. Mathematical Modelling of Drying
The percentage of moisture content presented in the copra has been determined by following
equation.
Moisture range content (%) = (At Initial stage of weight – At final Stage of weight) ⁄ (At the Initial
stage of weight)×100 (1)
Insolation on the solar collector surfaces
The Total amount of the solar radiations HA available at the selected place is 550 W/m2 and
total insolation solar as (IC) determined by following equation
IC = HA × R (2)
Where,
HA = 550 W/m2
R = (1-D/G) rb + D/G[(1+cosβ)/2] + [ρ(1-cosβ)] /2 (3)
The ma is the Mass flow rate of the air calculated by
ma = v'a ρa (4)
v'a = va × h × w (5)
Where the Va is velocity of air(m3/s), h is the height (metre, m) of the collectors, W is width
of collectors. Air density (ρa) is taken as 1.225 (kg/m3) v'a is Volumetric flow rate (m3/s) and
Optimum temperature for Copra is (55 to 65)ᵒC,
ΔT is the temperature difference, ΔT = (To - Ta)ᵒC = (70- 30)ᵒC = 40oC
Calculation of Heat losses from the collector
IC AC τ α = QU + QL + QS (6)
The amount of heat removal factors heat removal factor FR can be calculated by
FR = QU / AC [ IC × τ × α – UL ×(T0 – Ta) ] (7)
The thermal efficiency of a solar collector is the ratio of useful heat gained to the solar
radiation incident on the plane of the collector. This thermal efficiency is expressed as
ɳC = ma cp ΔT / Ac Ic (8)
ISSN: 2237-0722
Vol. 11 No. 4 (2021)
Received: 07.01.2021 – Accepted: 28.05.2021
27
Where the QU is how much useful energy where gained by the collectors (W), AC is how
much area obtained in the collectors(m2) and UL is the how much overall heat transfer coefficient of
the absorbers7
(Wm–2K–1). Where m is overall air mass flow rate, cp is the specific heat of air (1004J/kg K
for air), To and Ti is the exit and inlet collector temperature (°C), Ic is how much solar radiation in
the collector area(w/m2).
3. CFD Analysis
The governing equations for the analysis are mentioned below
Continuity Equation
(9)
Momentum Equation
(10)
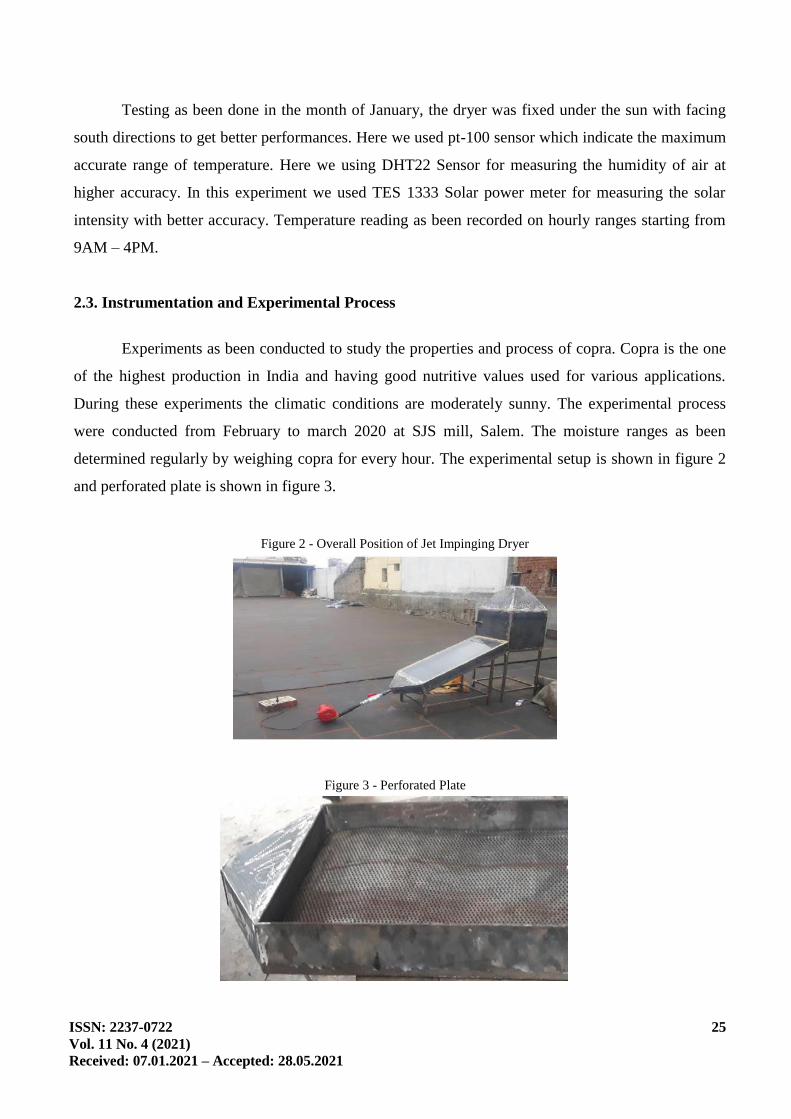
Governing equations are solved using Ansys Fluent software
Figure 4 - Mesh Generation in CFD

ISSN: 2237-0722
Vol. 11 No. 4 (2021)
Received: 07.01.2021 – Accepted: 28.05.2021
28
Figure 5 - Temperature Contour
Figure 6 – Pressure Contour
Figure 7 - Velocity Contour

ISSN: 2237-0722
Vol. 11 No. 4 (2021)
Received: 07.01.2021 – Accepted: 28.05.2021
29
The 3D model has been designed by using Solid Works software. Then it is imported in
ANSYS. After importing of the model the meshing has been created by ANSYS ICEM software and
therefore meshing created elements consist of around 28 millions elements. The created mesh is
imported in ANSYS FLUENT software and the values taken from experimentation are used while
simulating collector.
After setting of all boundary condition in fluent software, to solve numerical equations the
starting initialization by inlet be done. To get the end results the numbers of iterations are to be set
around to min of 10000. The result for these simulations as been converged at around 7218 iterations.
As per number of elements is more to get the converged results and the time taken for these
simulations will be higher with single or mono processor. After getting the results in the final stage of
the flow distributions of air and the heat transfer of collector will be plotted in the contour plots. From
the result, it is evident that the temperature reached to maximum extent of 348K and average
temperature at outlet is 334.61K. The temperature difference between Initial stage and Final stage
varies from 35ᵒc and to 45ᵒc shown in figure 5. The figure 6 shows the pressure varied (drop) of the
collector. Average pressure difference is 15pa (loss). The figure 7 shows the average air flow passage
through the plate of 0.439m/s. Thus the evident from the results the average heat transfer at outlet is
334.61K is sufficient by using the Jet impinging process for drying the copra.
Table 1 - CFD Results of Jet Impinging Dryer
Time (hr) Solar Intensity(W/m2) Tamb (ᵒc) Tout1 (ᵒc) Tout2 (ᵒc)
9AM 346 28.3 47.2 48.219
10AM 418 29.9 53.9 56.815
11AM 497 31.4 59.1 61.977
12NOON 587 32.9 65.4 67.583
1PM 693 33.6 71 75.987
2PM 712 34.4 72.8 77.432
3PM 643 34 70.3 74.916
4PM 502 33.4 69 71.123
5PM 451 31 62 65.483
The table 2 shows the CFD Results of jet impinging solar dryer for copra. This analysis were
taken from the Day-2 The max solar intensity obtained is 712 W/m2 and maximum temperature of
ambient and exit temperature of the dryer is 34.4ᵒC and 77.43ᵒC.
ISSN: 2237-0722
Vol. 11 No. 4 (2021)
Received: 07.01.2021 – Accepted: 28.05.2021
30
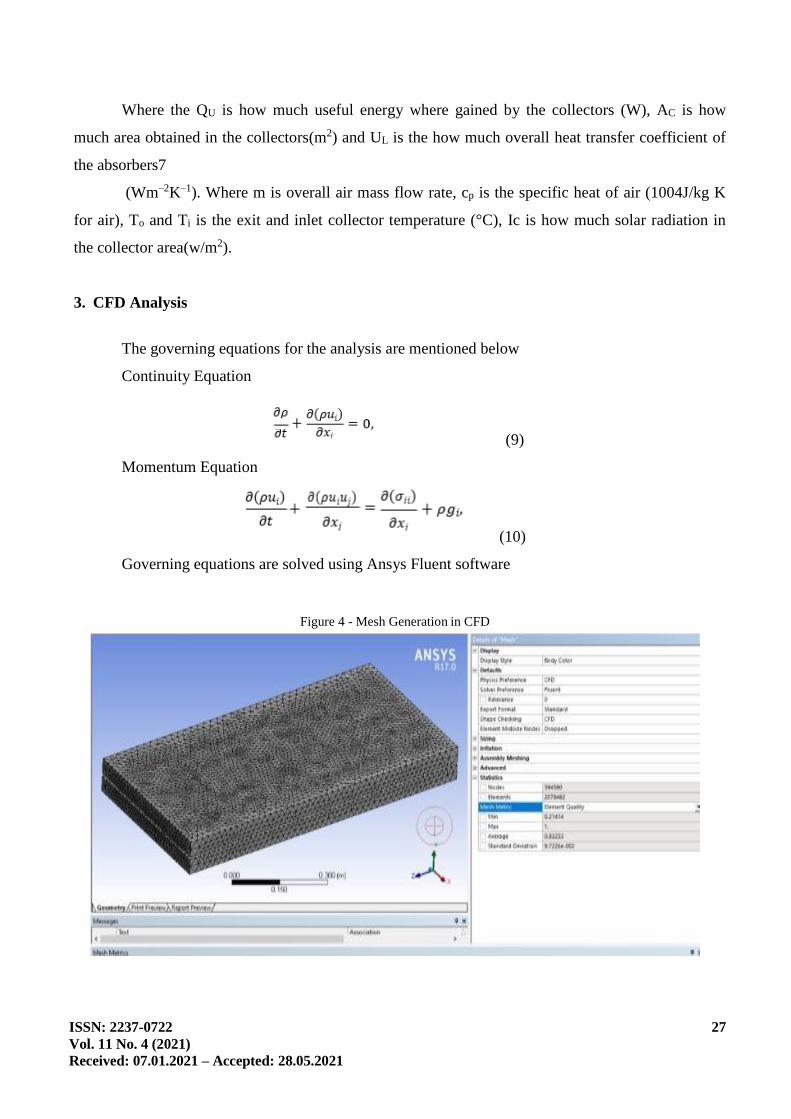
Figure 8 - Before Sun Dried Copra
Figure 9 - After Sun Dried Copra
Figure 10 - Before Jet Impingement Dried
ISSN: 2237-0722
Vol. 11 No. 4 (2021)
Received: 07.01.2021 – Accepted: 28.05.2021
31
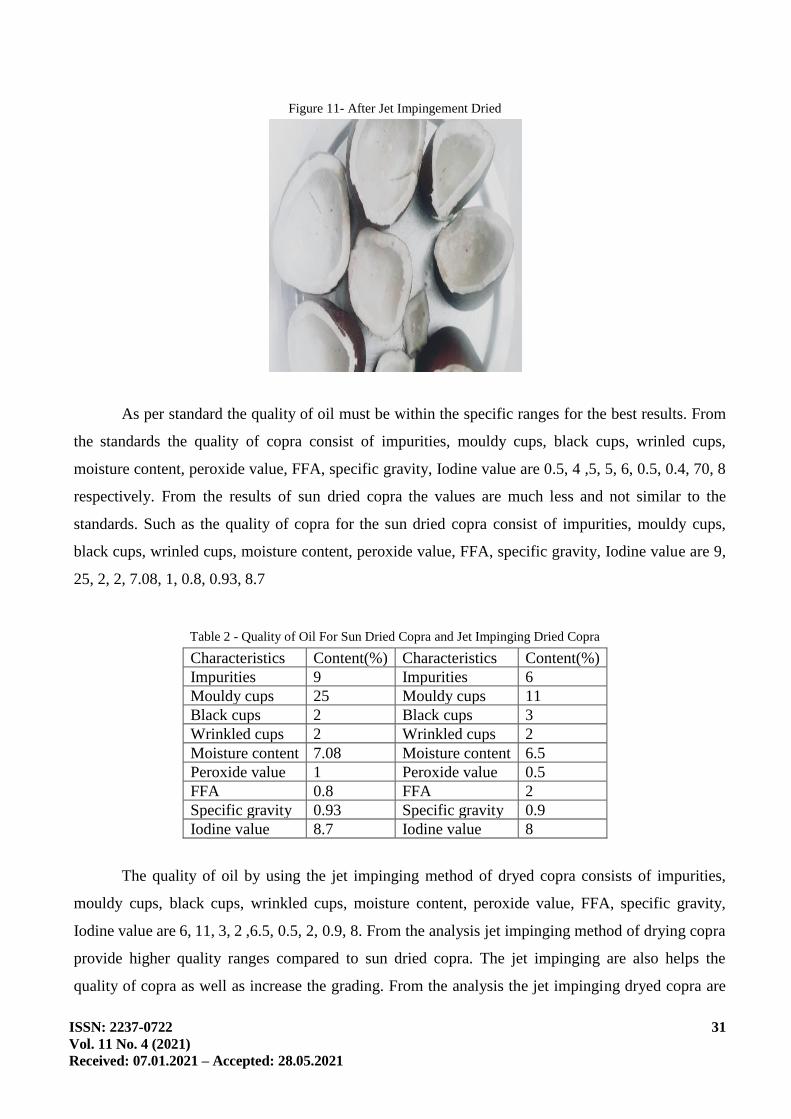
Figure 11- After Jet Impingement Dried
As per standard the quality of oil must be within the specific ranges for the best results. From
the standards the quality of copra consist of impurities, mouldy cups, black cups, wrinled cups,
moisture content, peroxide value, FFA, specific gravity, Iodine value are 0.5, 4 ,5, 5, 6, 0.5, 0.4, 70, 8
respectively. From the results of sun dried copra the values are much less and not similar to the
standards. Such as the quality of copra for the sun dried copra consist of impurities, mouldy cups,
black cups, wrinled cups, moisture content, peroxide value, FFA, specific gravity, Iodine value are 9,
25, 2, 2, 7.08, 1, 0.8, 0.93, 8.7
Table 2 - Quality of Oil For Sun Dried Copra and Jet Impinging Dried Copra
Characteristics Content(%) Characteristics Content(%)
Impurities 9 Impurities 6
Mouldy cups 25 Mouldy cups 11
Black cups 2 Black cups 3
Wrinkled cups 2 Wrinkled cups 2
Moisture content 7.08 Moisture content 6.5
Peroxide value 1 Peroxide value 0.5
FFA 0.8 FFA 2
Specific gravity 0.93 Specific gravity 0.9
Iodine value 8.7 Iodine value 8
The quality of oil by using the jet impinging method of dryed copra consists of impurities,
mouldy cups, black cups, wrinkled cups, moisture content, peroxide value, FFA, specific gravity,
Iodine value are 6, 11, 3, 2 ,6.5, 0.5, 2, 0.9, 8. From the analysis jet impinging method of drying copra
provide higher quality ranges compared to sun dried copra. The jet impinging are also helps the
quality of copra as well as increase the grading. From the analysis the jet impinging dryed copra are
ISSN: 2237-0722
Vol. 11 No. 4 (2021)
Received: 07.01.2021 – Accepted: 28.05.2021
32
having similar quality content to as per standards. By increasing the quality of copra the higher rate of
oil extraction as been taken and microbiological attacks, fungus, bacteria, etc. are reduced.
4. Result and Discussion
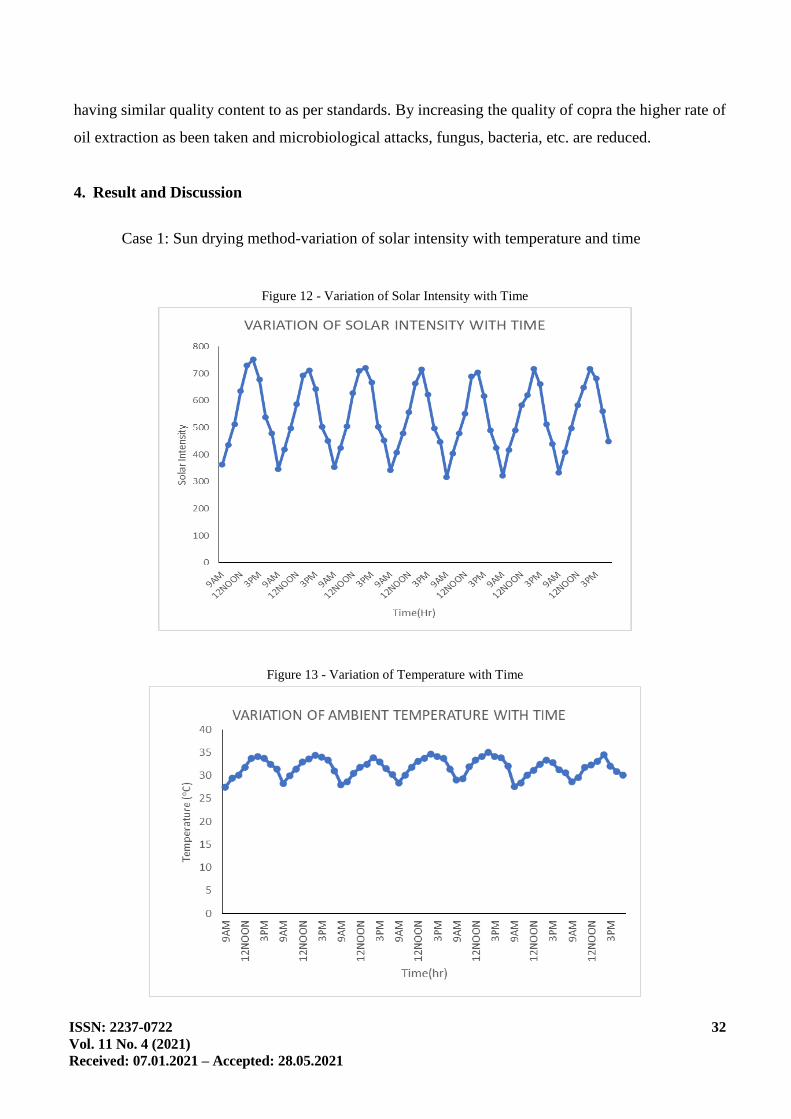
Case 1: Sun drying method-variation of solar intensity with temperature and time
Figure 12 - Variation of Solar Intensity with Time
Figure 13 - Variation of Temperature with Time

ISSN: 2237-0722
Vol. 11 No. 4 (2021)
Received: 07.01.2021 – Accepted: 28.05.2021
33
The figure 12 shows that solar intensity is varied respect to time intensity get increase at time
of maximum of 752 W/m2 at time 2pm and gets reduced to 478 W/m2 at 5pm. The solar intensity has
been taken for the duration of seven days. During this experiments, the sky was clear and maximum
solar radiation observed on first day, the average of 541W/m2 solar intensity has been observed.
The figure 13 shows that variation of ambient temperature and time. The maximum
temperature attained 35.1ᵒc at time 2pm and get reduced to 28ᵒC at 5pm.During this experiment of
seven day duration the maximum temperature attained on fifth day of maximum temperature of 35ᵒC.
Figure 14 - Variation of Moisture with Time
The figure 14 shows that variation of moisture content of copra and time. The average
moisture content of copra get reduced from 55.72% to 7.08% in 63 hrs.
Case 2: Jet impingement method-Variation of solar intensity and moisture and time
Figure.15 Variation of moisture ranges and time at tray 1

ISSN: 2237-0722
Vol. 11 No. 4 (2021)
Received: 07.01.2021 – Accepted: 28.05.2021
34
The figure 15 shows that variation of moisture ranges of copra and time. The average
moisture content get reduced from the range of 55.64% to 6.5% at 45hours. The moisture reduced
from 55.64% to 6.5% in tray 1 at 41hours and tray 2 at 45hours shown in the figure 16.
Figure 16 - Variation of Moisture and Time
The moisture reduces shows that solar intensity is varied respect to time intensity get increase
at time of maximum of 752 W/m2 at time 2pm and gets reduced to 478 W/m2 at 5pm. The solar
intensity has been taken for the duration of five days. During these experiments, the sky was clear and
maximum solar radiation observed on first day, the average of 541W/m2 solar intensity has been
observed.
Figure.17 Variation of Temperature with time for dryer and Ambient temperature

ISSN: 2237-0722
Vol. 11 No. 4 (2021)
Received: 07.01.2021 – Accepted: 28.05.2021
35
The figure 17 shows that variation of dryer temperature and ambient temperature with
time(Hr). The maximum temperature of 72.9ᵒC at Tout and 66.4ᵒC at tray1 and 61ᵒC at tray2.The
average temperature at the dryer is 55.5ᵒC as been obtained. During this experiment the maximum
temperature of dryer is 72.8ᵒC at the ambient temperature of 35.6ᵒC.
Figure 18 - Variation of Temperature and Time for Experimental and Analytical Results
The figure 18 shows the variation of Analytical and Experimental results of Time(Hr) and
Temperature. The analysis done from the DAY 2 data shows that the ambient temperature raised to
maximum. The Analytical results are higher compared to the experimental results due to some losses
in the actual results. The collector temperature varies directly by dependent on solar intensity. Due to
some local available properties in the analysis the losses are occurred. This result shows there will be
best result obtained during the sunny days.
5. Conclusion
The solar air heater cannot reach to maximum extent temperature as well as pressure drop
along the side is also higher. For the better extent temperature and time considerations in this project,
we have discussed with jet plate impingement to provide maximum heat supply and less time
consideration.
The copra drying time period are also reduced from 63hrs to 48hrs and the moisture ranges of
the copra varies from 54.72% to 7.08% in sun dried copra and 55.64% to 6.5% in jet impingement

ISSN: 2237-0722
Vol. 11 No. 4 (2021)
Received: 07.01.2021 – Accepted: 28.05.2021
36
method. The moisture content as reduced maximum less than 6.5% as per (IS 6620 1971) standard for
oils. From this analysis we used 8mm hole section of perforated plate and checked with different
conditions. Where by using the jet plate impingements techniques we have reached maximum heat
supply. From the analysis the pressure drop is also less and it is concluded that sufficient for drying
the copra for given conditions.
References
Abdullahi Y, Momoh M, Garba MM, Musa M (2013) Design and construction of an adjustable and
collapsible natural convection solar food dryer. Int J Comput Eng Res 3(6): 1–8.
Emad Almuhanna A (2012) Utilization of a solar greenhouse as a solar dryer for drying dates under
the climatic conditions of the eastern province of Saudi Arabia. J Agric Sci 4(3): 237–246.
Umogbai VI, Iorter HA (2013) Design, construction and performance evaluation of a passive solar
dryer for maize cobs. Afr J Food Sci Technol 4(5): 110–115.
Rajeshwari N, Ramalingam A (2012). Low cost material used to construct effective box type solar
dryer. Arch Appl Sci Res 4(3): 1476–1482.
Schirmer P, Janjai S, Esper A, Smitabhindu R, Mühlbauer W (1996) Experimental investigation of
the performance of the solar dryer for drying bananas. Renew Energy 7(2):119–129
Kannan, C., Mohanraj, M., & Sathyabalan, P. (2020). Experimental investigations on jet
impingement solar air collectors using pin-fin absorber. Proceedings of the Institution of Mechanical
Engineers. Part E: Journal of Process Mechanical Engineering 235(1): 134-146.