Design Constraints on a Synthetic Metabolism
14
Design Constraints on a Synthetic Metabolism Tugce Bilgin 1,2 *, Andreas Wagner 1,2,3 1 Institute of Evolutionary Biology and Environmental Sciences, University of Zurich, Zu ¨ rich, Switzerland, 2 The Swiss Institute of Bioinformatics, Zurich, Switzerland, 3 The Santa Fe Institute, Santa Fe, New Mexico, United States of America Abstract A metabolism is a complex network of chemical reactions that converts sources of energy and chemical elements into biomass and other molecules. To design a metabolism from scratch and to implement it in a synthetic genome is almost within technological reach. Ideally, a synthetic metabolism should be able to synthesize a desired spectrum of molecules at a high rate, from multiple different nutrients, while using few chemical reactions, and producing little or no waste. Not all of these properties are achievable simultaneously. We here use a recently developed technique to create random metabolic networks with pre-specified properties to quantify trade-offs between these and other properties. We find that for every additional molecule to be synthesized a network needs on average three additional reactions. For every additional carbon source to be utilized, it needs on average two additional reactions. Networks able to synthesize 20 biomass molecules from each of 20 alternative sole carbon sources need to have at least 260 reactions. This number increases to 518 reactions for networks that can synthesize more than 60 molecules from each of 80 carbon sources. The maximally achievable rate of biosynthesis decreases by approximately 5 percent for every additional molecule to be synthesized. Biochemically related molecules can be synthesized at higher rates, because their synthesis produces less waste. Overall, the variables we study can explain 87 percent of variation in network size and 84 percent of the variation in synthesis rate. The constraints we identify prescribe broad boundary conditions that can help to guide synthetic metabolism design. Citation: Bilgin T, Wagner A (2012) Design Constraints on a Synthetic Metabolism. PLoS ONE 7(6): e39903. doi:10.1371/journal.pone.0039903 Editor: Petter Holme, Umea ˚ University, Sweden Received March 7, 2012; Accepted May 28, 2012; Published June 29, 2012 Copyright: ß 2012 Bilgin and Wagner. This is an open-access article distributed under the terms of the Creative Commons Attribution License, which permits unrestricted use, distribution, and reproduction in any medium, provided the original author and source are credited. Funding: We acknowledge support through Swiss National Science Foundation grant 315230-129708, as well as through the YeastX project of SystemsX.ch, and the University Priority Research Program in Systems Biology at the University of Zurich. The funders had no role in study design, data collection and analysis, decision to publish, or preparation of the manuscript. Competing Interests: The authors have declared that no competing interests exist. * E-mail: [email protected] Introduction Among the most important goals of synthetic biology and biotechnology is to engineer organisms with novel properties [1,2]. Most current efforts focus on designing subsystems of organisms, such as regulatory circuits [1,3] or metabolic pathways [4,5]. However, recent advances in genomics and genome synthesis have allowed synthetic biology to make great strides towards the ultimate goal of designing new organisms from scratch [6–10]. To be able to synthesize new life, one needs to understand life’s minimal needs. Considerable effort has thus focused on un- derstanding and creating minimal organisms [9–15]. One line of research studies organisms with very small genomes that comprise only a few hundred genes, such as the gamma proteobacteria [14], Blochannia floridanus [16] and Carsonella ruddii [17]. Such organisms are typically endosymbionts or endoparasites, and receive sub- stantial resources from their host [15]. Although valuable knowledge has been gained by studying these organisms, this property renders them of limited use in understanding minimal requirements for a free-living organism. A second, complementary line of research starts from a complex genome, successfully eliminates genes from it without affecting viability, and thus creates a genome that is (close to) minimal. This is possible because free-living organisms have many genes that are dispensable in any one environment [9–11,13,18]. Such systematic gene deletion efforts not only provide insight into minimal genomes, they can also help to eliminate the synthesis of undesired molecules, avoid excessive waste production, and thus increase the efficiency with which an organism synthesizes desired molecules [19]. Based on both computational and experimental approaches of genome reduction, several proposals for the gene complements of minimal organisms have been made. They range in size from 100 genes to more than 300 genes in organisms such as Mycoplasmas [9,11,13]. One indispensable feature of any living organisms is its metabolism. A metabolism is a complex network of chemical reactions, catalyzed by enzymes that are encoded in genes. It uses sources of energy and chemical elements – nutrients – to synthesize molecules that an organism needs, including precursors of biomass and various secondary products, such as molecules for defense and communication [14]. The manipulation of metabo- lism for technological purposes is known as metabolic engineering [19–22]. Metabolic engineering has multiple applications. They include the large-scale, fast, and efficient synthesis of pharmaceuticals, chemical reagents, and biofuels [2,19,23–26]. The latter class of molecules is especially important given their importance in energy security and in the reduction of greenhouse gas emissions [20,21,27,28]. Another application is bioremediation, where microbes with properly engineered metabolic pathways may be able to clean hazardous waste in inaccessible places [28,29]. Current metabolic engineering approaches typically manipulate one or a few enzyme-coding genes [1]. Because of the highly interconnected nature of metabolism, and because of the complexity of enzyme regulation, such manipulation faces several challenges. The first is to ensure a high level of expression of the PLoS ONE | www.plosone.org 1 June 2012 | Volume 7 | Issue 6 | e39903
Transcript of Design Constraints on a Synthetic Metabolism

Design Constraints on a Synthetic MetabolismTugce Bilgin1,2*, Andreas Wagner1,2,3
1 Institute of Evolutionary Biology and Environmental Sciences, University of Zurich, Zurich, Switzerland, 2 The Swiss Institute of Bioinformatics, Zurich, Switzerland, 3 The
Santa Fe Institute, Santa Fe, New Mexico, United States of America
Abstract
A metabolism is a complex network of chemical reactions that converts sources of energy and chemical elements intobiomass and other molecules. To design a metabolism from scratch and to implement it in a synthetic genome is almostwithin technological reach. Ideally, a synthetic metabolism should be able to synthesize a desired spectrum of molecules ata high rate, from multiple different nutrients, while using few chemical reactions, and producing little or no waste. Not all ofthese properties are achievable simultaneously. We here use a recently developed technique to create random metabolicnetworks with pre-specified properties to quantify trade-offs between these and other properties. We find that for everyadditional molecule to be synthesized a network needs on average three additional reactions. For every additional carbonsource to be utilized, it needs on average two additional reactions. Networks able to synthesize 20 biomass molecules fromeach of 20 alternative sole carbon sources need to have at least 260 reactions. This number increases to 518 reactions fornetworks that can synthesize more than 60 molecules from each of 80 carbon sources. The maximally achievable rate ofbiosynthesis decreases by approximately 5 percent for every additional molecule to be synthesized. Biochemically relatedmolecules can be synthesized at higher rates, because their synthesis produces less waste. Overall, the variables we studycan explain 87 percent of variation in network size and 84 percent of the variation in synthesis rate. The constraints weidentify prescribe broad boundary conditions that can help to guide synthetic metabolism design.
Citation: Bilgin T, Wagner A (2012) Design Constraints on a Synthetic Metabolism. PLoS ONE 7(6): e39903. doi:10.1371/journal.pone.0039903
Editor: Petter Holme, Umea University, Sweden
Received March 7, 2012; Accepted May 28, 2012; Published June 29, 2012
Copyright: � 2012 Bilgin and Wagner. This is an open-access article distributed under the terms of the Creative Commons Attribution License, which permitsunrestricted use, distribution, and reproduction in any medium, provided the original author and source are credited.
Funding: We acknowledge support through Swiss National Science Foundation grant 315230-129708, as well as through the YeastX project of SystemsX.ch, andthe University Priority Research Program in Systems Biology at the University of Zurich. The funders had no role in study design, data collection and analysis,decision to publish, or preparation of the manuscript.
Competing Interests: The authors have declared that no competing interests exist.
* E-mail: [email protected]
Introduction
Among the most important goals of synthetic biology and
biotechnology is to engineer organisms with novel properties [1,2].
Most current efforts focus on designing subsystems of organisms,
such as regulatory circuits [1,3] or metabolic pathways [4,5].
However, recent advances in genomics and genome synthesis have
allowed synthetic biology to make great strides towards the
ultimate goal of designing new organisms from scratch [6–10].
To be able to synthesize new life, one needs to understand life’s
minimal needs. Considerable effort has thus focused on un-
derstanding and creating minimal organisms [9–15]. One line of
research studies organisms with very small genomes that comprise
only a few hundred genes, such as the gamma proteobacteria [14],
Blochannia floridanus [16] and Carsonella ruddii [17]. Such organisms
are typically endosymbionts or endoparasites, and receive sub-
stantial resources from their host [15]. Although valuable
knowledge has been gained by studying these organisms, this
property renders them of limited use in understanding minimal
requirements for a free-living organism.
A second, complementary line of research starts from a complex
genome, successfully eliminates genes from it without affecting
viability, and thus creates a genome that is (close to) minimal. This
is possible because free-living organisms have many genes that are
dispensable in any one environment [9–11,13,18]. Such systematic
gene deletion efforts not only provide insight into minimal
genomes, they can also help to eliminate the synthesis of undesired
molecules, avoid excessive waste production, and thus increase the
efficiency with which an organism synthesizes desired molecules
[19]. Based on both computational and experimental approaches
of genome reduction, several proposals for the gene complements
of minimal organisms have been made. They range in size from
100 genes to more than 300 genes in organisms such as
Mycoplasmas [9,11,13].
One indispensable feature of any living organisms is its
metabolism. A metabolism is a complex network of chemical
reactions, catalyzed by enzymes that are encoded in genes. It uses
sources of energy and chemical elements – nutrients – to
synthesize molecules that an organism needs, including precursors
of biomass and various secondary products, such as molecules for
defense and communication [14]. The manipulation of metabo-
lism for technological purposes is known as metabolic engineering
[19–22].
Metabolic engineering has multiple applications. They include
the large-scale, fast, and efficient synthesis of pharmaceuticals,
chemical reagents, and biofuels [2,19,23–26]. The latter class of
molecules is especially important given their importance in energy
security and in the reduction of greenhouse gas emissions
[20,21,27,28]. Another application is bioremediation, where
microbes with properly engineered metabolic pathways may be
able to clean hazardous waste in inaccessible places [28,29].
Current metabolic engineering approaches typically manipulate
one or a few enzyme-coding genes [1]. Because of the highly
interconnected nature of metabolism, and because of the
complexity of enzyme regulation, such manipulation faces several
challenges. The first is to ensure a high level of expression of the
PLoS ONE | www.plosone.org 1 June 2012 | Volume 7 | Issue 6 | e39903
genes and the enzymes they encode. A second challenge is to
manipulate cells into selectively producing desired molecules at
high rates and yield. Cells can be quite recalcitrant to such
manipulations [30]. A third challenge is to ensure that a desired
product can be produced from one source of chemical elements
and energy, but from multiple sources, to ensure efficient
production. For example, yeast species are good candidate
organisms to synthesize ethanol, with the drawback that they are
not highly efficient at fermenting cellulosic biomass. (In addition to
glucose, which yeast strains can catabolize normally, cellulosic
biomass contains five carbon sugars, such as arabinose and xylose,
which yeast strains cannot catabolize.) Metabolic engineering can
create yeast strains that ferment not only glucose but also mixtures
of other sugars. [31]. A fourth challenge is to overcome the toxicity
of some desired products when they accumulate at high
concentrations in a cell. This holds especially for biofuels that
are produced in large amounts [27]. Finally, metabolic engineer-
ing needs to control ratios of metabolites such as ATP/ADP or
NAD+/NADH, which can influence product yields and lead to
synthesis of undesired byproducts through their global effects on
physiology [21].
While contemporary metabolic engineering focuses on altering
existing pathways, future engineering will design metabolisms and
minimal organisms de novo [1,21,32,33]. Ongoing technological
advances in sequencing and de-novo synthesis and declining prices
in these technologies [2,20,34,35] suggest that de-novo synthesis of
minimal organisms for biomass production will be feasible soon. A
small (synthetic) metabolism may also allow better control of
metabolic properties than a large metabolism [1,18].
To be able to design a metabolism, one needs to be able to
predict system-wide metabolic properties. In recent years great
strides have been made towards such prediction. Especially
noteworthy are constraint-based modeling approaches, which
can predict the spectrum of biosynthetic properties of a metabolism
from knowledge about the reactions that its enzymes catalyze, and
from the nutrients available in its environment [36–38]. One such
approach, flux balance analysis (FBA) [36,37,39,40], uses in-
formation about the stoichiometry of reactions in a metabolic
network to predict the rate at which a network can synthesize
a given spectrum of molecules, which we refer to as the network’s
biosynthetic flux. FBA makes two main assumptions. The first is
that a metabolism is in a steady state with a constant nutrient
supply. The second is that it maximizes some property, such as
biosynthetic flux [41]. While FBA faces challenges caused by
regulatory constraints [42,43], it is well suited to answer simple
qualitative and quantitative questions about important properties
of a metabolic system [44]. An especially important property is the
minimal number of reactions R needed to synthesize a given
number B of (biomass) molecules from a given spectrum N of
nutrients. The ideal network has few reactions and can synthesize
many molecules using a broad spectrum of nutrients. However
trade-offs between these properties exist, which do not allow all
these requirements to be met.
We here take a first step towards a quantitative understanding of
these and other trade-offs using constraint-based methods. To this
end, we study the properties of not just one metabolic network, but
of multiple networks that differ in these properties. Experimental
techniques are not yet suitable to do that, but computational
approaches are [45]. The approach we use starts with the
observation that any one metabolic network exists in a vast space
of possible metabolic networks. The approach uses recently
developed techniques [46,47] to create unbiased arbitrary large
samples of networks from this space, where each network of the
sample has a specific property, such as a given number of
reactions, a given number of carbon sources it can use, and a given
set of molecules that it can synthesize. The underlying sampling
technique, Markov Chain Monte Carlo sampling [48,49] is
a widely used approach with a well-developed statistical theory
[50–54]. We use it to quantify the trade-offs and thus the design
constraints imposed by important metabolic network properties.
Specifically, a first part of our analysis focuses on three main
properties. The first is nutrient flexibility N, that is, the number of
different carbon sources a metabolic network can utilize as sole
carbon sources. The second is a network’s biosynthetic ability B,
that is, the number of biomass molecules that it can synthesize.
The third is the number of reactions R in a network. We then
extend our analysis to further properties, such as the biosynthetic
flux S, the rate at which biomass molecules are synthesized, and
the amount W of waste produced.
Results
Each Additional Nutrient Requires on Average TwoAdditional Reactions
Due to the presence of alternative metabolic routes that connect
many pairs of molecules, most metabolic systems are able to
tolerate genotypic changes, such as the deletion of enzyme coding
genes. For instance, 80% of single gene deletions in budding yeast
have no detectable phenotypic effect in standard laboratory
environments [55]. More specifically, metabolic systems are to
some extent robust against deletions of enzyme coding genes,
because the resulting elimination of metabolic reactions from
a metabolic network does not necessarily affect cell viability
[9,11,13,23–25,56].
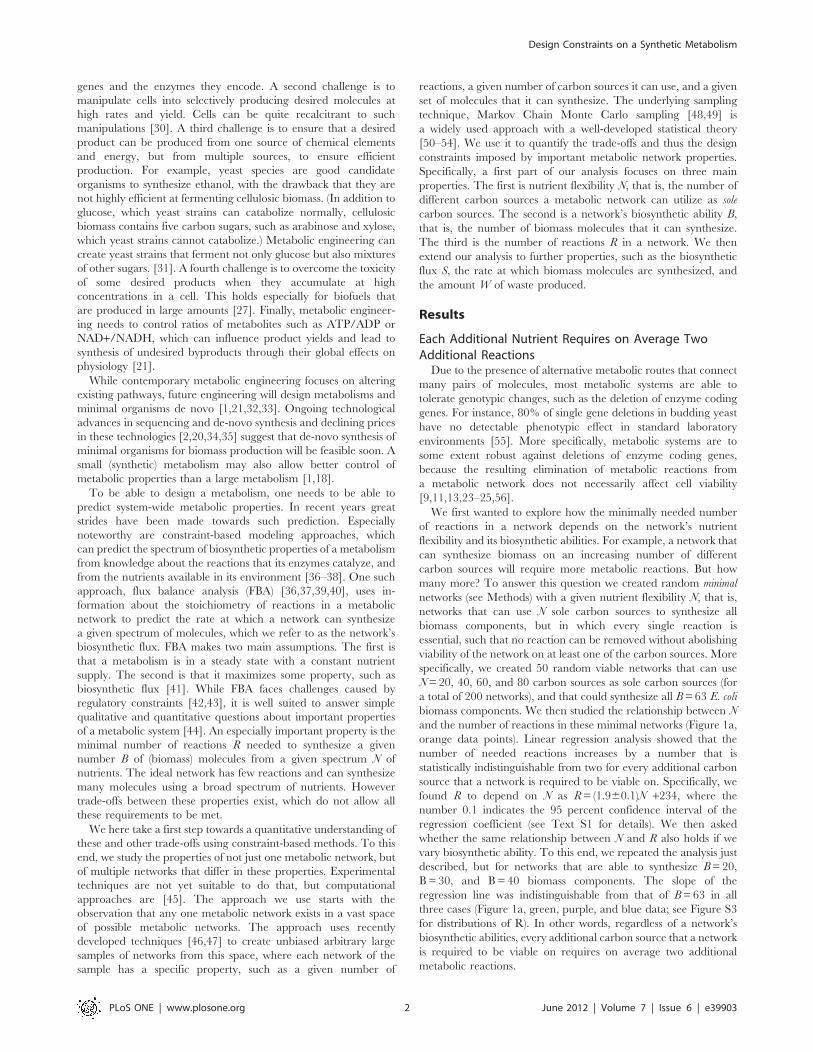
We first wanted to explore how the minimally needed number
of reactions in a network depends on the network’s nutrient
flexibility and its biosynthetic abilities. For example, a network that
can synthesize biomass on an increasing number of different
carbon sources will require more metabolic reactions. But how
many more? To answer this question we created random minimal
networks (see Methods) with a given nutrient flexibility N, that is,
networks that can use N sole carbon sources to synthesize all
biomass components, but in which every single reaction is
essential, such that no reaction can be removed without abolishing
viability of the network on at least one of the carbon sources. More
specifically, we created 50 random viable networks that can use
N= 20, 40, 60, and 80 carbon sources as sole carbon sources (for
a total of 200 networks), and that could synthesize all B= 63 E. coli
biomass components. We then studied the relationship between N
and the number of reactions in these minimal networks (Figure 1a,
orange data points). Linear regression analysis showed that the
number of needed reactions increases by a number that is
statistically indistinguishable from two for every additional carbon
source that a network is required to be viable on. Specifically, we
found R to depend on N as R= (1.960.1)N +234, where the
number 0.1 indicates the 95 percent confidence interval of the
regression coefficient (see Text S1 for details). We then asked
whether the same relationship between N and R also holds if we
vary biosynthetic ability. To this end, we repeated the analysis just
described, but for networks that are able to synthesize B= 20,
B = 30, and B = 40 biomass components. The slope of the
regression line was indistinguishable from that of B= 63 in all
three cases (Figure 1a, green, purple, and blue data; see Figure S3
for distributions of R). In other words, regardless of a network’s
biosynthetic abilities, every additional carbon source that a network
is required to be viable on requires on average two additional
metabolic reactions.
Design Constraints on a Synthetic Metabolism
PLoS ONE | www.plosone.org 2 June 2012 | Volume 7 | Issue 6 | e39903
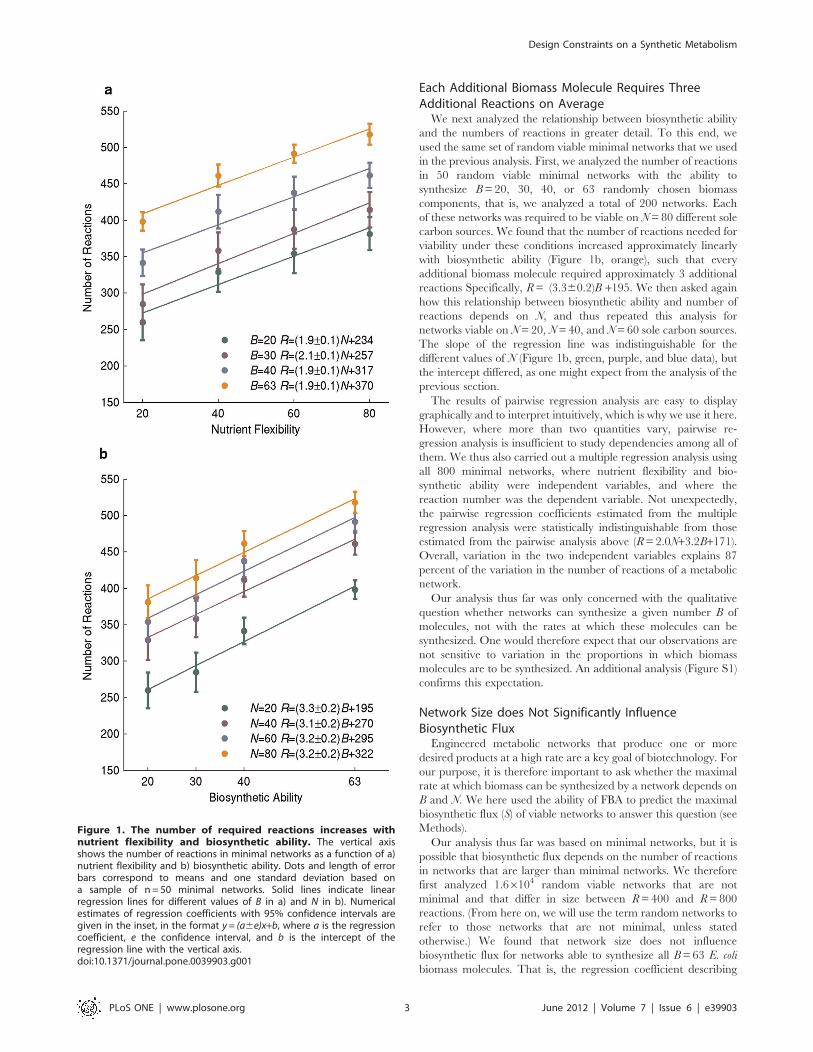
Each Additional Biomass Molecule Requires ThreeAdditional Reactions on Average
We next analyzed the relationship between biosynthetic ability
and the numbers of reactions in greater detail. To this end, we
used the same set of random viable minimal networks that we used
in the previous analysis. First, we analyzed the number of reactions
in 50 random viable minimal networks with the ability to
synthesize B= 20, 30, 40, or 63 randomly chosen biomass
components, that is, we analyzed a total of 200 networks. Each
of these networks was required to be viable on N= 80 different sole
carbon sources. We found that the number of reactions needed for
viability under these conditions increased approximately linearly
with biosynthetic ability (Figure 1b, orange), such that every
additional biomass molecule required approximately 3 additional
reactions Specifically, R= (3.360.2)B +195. We then asked again
how this relationship between biosynthetic ability and number of
reactions depends on N, and thus repeated this analysis for
networks viable on N= 20, N= 40, and N= 60 sole carbon sources.
The slope of the regression line was indistinguishable for the
different values of N (Figure 1b, green, purple, and blue data), but
the intercept differed, as one might expect from the analysis of the
previous section.
The results of pairwise regression analysis are easy to display
graphically and to interpret intuitively, which is why we use it here.
However, where more than two quantities vary, pairwise re-
gression analysis is insufficient to study dependencies among all of
them. We thus also carried out a multiple regression analysis using
all 800 minimal networks, where nutrient flexibility and bio-
synthetic ability were independent variables, and where the
reaction number was the dependent variable. Not unexpectedly,
the pairwise regression coefficients estimated from the multiple
regression analysis were statistically indistinguishable from those
estimated from the pairwise analysis above (R= 2.0N+3.2B+171).
Overall, variation in the two independent variables explains 87
percent of the variation in the number of reactions of a metabolic
network.
Our analysis thus far was only concerned with the qualitative
question whether networks can synthesize a given number B of
molecules, not with the rates at which these molecules can be
synthesized. One would therefore expect that our observations are
not sensitive to variation in the proportions in which biomass
molecules are to be synthesized. An additional analysis (Figure S1)
confirms this expectation.
Network Size does Not Significantly InfluenceBiosynthetic Flux
Engineered metabolic networks that produce one or more
desired products at a high rate are a key goal of biotechnology. For
our purpose, it is therefore important to ask whether the maximal
rate at which biomass can be synthesized by a network depends on
B and N. We here used the ability of FBA to predict the maximal
biosynthetic flux (S) of viable networks to answer this question (see
Methods).
Our analysis thus far was based on minimal networks, but it is
possible that biosynthetic flux depends on the number of reactions
in networks that are larger than minimal networks. We therefore
first analyzed 1.66104 random viable networks that are not
minimal and that differ in size between R= 400 and R= 800
reactions. (From here on, we will use the term random networks to
refer to those networks that are not minimal, unless stated
otherwise.) We found that network size does not influence
biosynthetic flux for networks able to synthesize all B= 63 E. coli
biomass molecules. That is, the regression coefficient describing
Figure 1. The number of required reactions increases withnutrient flexibility and biosynthetic ability. The vertical axisshows the number of reactions in minimal networks as a function of a)nutrient flexibility and b) biosynthetic ability. Dots and length of errorbars correspond to means and one standard deviation based ona sample of n = 50 minimal networks. Solid lines indicate linearregression lines for different values of B in a) and N in b). Numericalestimates of regression coefficients with 95% confidence intervals aregiven in the inset, in the format y = (a6e)x+b, where a is the regressioncoefficient, e the confidence interval, and b is the intercept of theregression line with the vertical axis.doi:10.1371/journal.pone.0039903.g001
Design Constraints on a Synthetic Metabolism
PLoS ONE | www.plosone.org 3 June 2012 | Volume 7 | Issue 6 | e39903

their relationship is statistically indistinguishable from zero (f= rR,
with r = 3610256761025, n= 1000 networks). The same holds
for networks that can synthesize B= 20, B= 30, and B= 40
biomass molecules. (See Figure S2 for flux distributions.).
High Biosynthetic Flux is Usually Achieved by a ModestNumber of Active Reactions
We just showed that the number of reactions in a network does
not affect its biosynthetic flux. However, it is well-known that only
a subset of a network’s metabolic reactions are usually active in any
one environment, that is, they have nonzero flux [12]. We thus
wanted to know whether a relationship exists between biosynthetic
flux and the number of active reactions, RA. This is indeed the
case, based on an analysis of all our 1.66104 random networks
viable on glucose as a sole carbon source. More specifically, this
relationship is strongly negative (Pearson’s r = -0.65 for bio-
synthetic flux on glucose). That is, the greater the number of
active reactions, the lower the biosynthetic flux of a network.
We next used linear regression to ask whether network size R
itself influences the number of active reactions RA. The answer is
no. Network size has no statistically significant influence on the
number of active reactions for any combination of values of N and
B. This observation is in agreement with earlier results by
Nishikawa et al. [12], which showed that the number of active
reactions in a network is not sensitive to the size of the network.
We subsequently asked whether synthesis of each additional
biomass molecule also needs more active reactions. The answer is
yes, as shown by linear regression analysis (3.6–4 additional
reactions, on average, per biomass molecule).
The More Biomass Molecules a Network Synthesizes, theSmaller is its Biosynthetic Flux
We next wanted to explore why the number of active reactions
is negatively correlated with biosynthetic flux. Our observations so
far show that the number of active reactions increases with
biosynthetic ability. We thus hypothesized that increased bio-
synthetic ability entails smaller biosynthetic flux, because bio-
synthetic flux should decrease as the number of biomass molecules
to be synthesized grows, given a constant nutrient supply. To test
this hypothesis, we computed the correlation between the number
of molecules synthesized and biosynthetic flux in multiple
environments for all 16000 networks we had generated (see
Methods). This correlation is significantly negative (Pearson’s r = -
0.60; P,102300). Each molecule to be synthesized decreases
biosynthetic flux by 0.05 mmoles per g DW per hour, equivalent
to a 6 percent decline relative to E.coli’s computed biosynthetic
flux. Next, we analyzed networks viable on 80 different sole carbon
sources that were able to synthesize B= 20, 30, 40, or 63 randomly
chosen biomass components (1000 networks each, for a total of
4000 networks). Biosynthetic flux under these conditions also
decreased approximately linearly with biosynthetic ability
(Figure 2a, orange data). Specifically, every additional biomass
molecule that a network needs to synthesize decreases the
biosynthetic flux by approximately 0.05 mmoles of biomass per
g DW per hour (6 percent; S= -(0.0560.001)B +3.5). Similar
relationships also hold for networks viable on N= 20, N= 40, and
N= 60 sole carbon sources (Figure 2a, green, purple, and blue
data). They show that, every additional biomass molecule to be
synthesized reduces biosynthetic flux by 3–6 percent. Taken
together, these observations help explain the negative relation
between the number of active reactions and biosynthetic flux.
Networks that can synthesize more biomass molecules need more
active reactions. Given a constant nutrient supply, the total
Figure 2. Biosynthetic flux decreases with biosynthetic abilityand increases with nutrient flexibility. The vertical axis showsbiosynthetic flux in mmoles per g DW per hour in random networks asa function of a) biosynthetic ability and b) nutrient flexibility. Dots andlengths of error bars correspond to means and one standard deviationsbased on a sample of n = 1000 minimal networks. Solid lines indicatelinear regression lines for different values of B. Numerical estimates of
Design Constraints on a Synthetic Metabolism
PLoS ONE | www.plosone.org 4 June 2012 | Volume 7 | Issue 6 | e39903
biosynthetic flux that can be realized by these networks must
decrease as the number of molecules that they can synthesize
increases. The negative correlation between the number of active
reactions and biosynthetic flux is a by-product of the latter two
correlations.
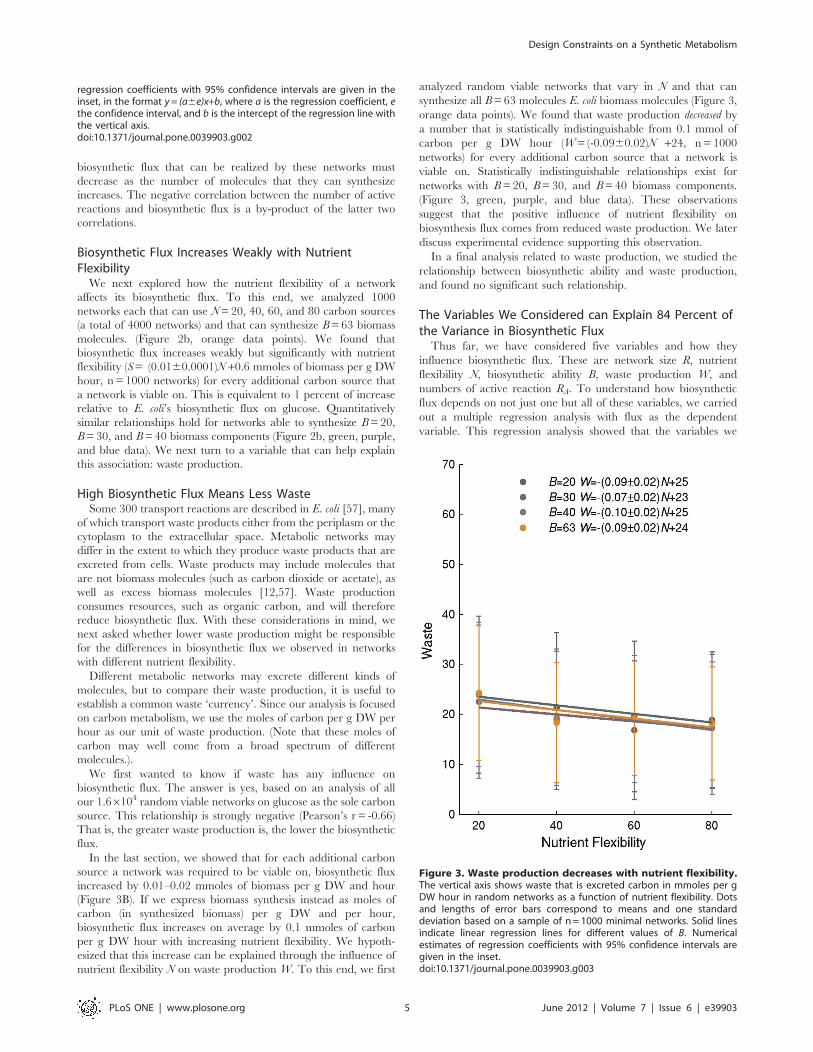
Biosynthetic Flux Increases Weakly with NutrientFlexibility
We next explored how the nutrient flexibility of a network
affects its biosynthetic flux. To this end, we analyzed 1000
networks each that can use N= 20, 40, 60, and 80 carbon sources
(a total of 4000 networks) and that can synthesize B= 63 biomass
molecules. (Figure 2b, orange data points). We found that
biosynthetic flux increases weakly but significantly with nutrient
flexibility (S= (0.0160.0001)N +0.6 mmoles of biomass per g DW
hour, n = 1000 networks) for every additional carbon source that
a network is viable on. This is equivalent to 1 percent of increase
relative to E. coli’s biosynthetic flux on glucose. Quantitatively
similar relationships hold for networks able to synthesize B= 20,
B= 30, and B= 40 biomass components (Figure 2b, green, purple,
and blue data). We next turn to a variable that can help explain
this association: waste production.
High Biosynthetic Flux Means Less WasteSome 300 transport reactions are described in E. coli [57], many
of which transport waste products either from the periplasm or the
cytoplasm to the extracellular space. Metabolic networks may
differ in the extent to which they produce waste products that are
excreted from cells. Waste products may include molecules that
are not biomass molecules (such as carbon dioxide or acetate), as
well as excess biomass molecules [12,57]. Waste production
consumes resources, such as organic carbon, and will therefore
reduce biosynthetic flux. With these considerations in mind, we
next asked whether lower waste production might be responsible
for the differences in biosynthetic flux we observed in networks
with different nutrient flexibility.
Different metabolic networks may excrete different kinds of
molecules, but to compare their waste production, it is useful to
establish a common waste ‘currency’. Since our analysis is focused
on carbon metabolism, we use the moles of carbon per g DW per
hour as our unit of waste production. (Note that these moles of
carbon may well come from a broad spectrum of different
molecules.).
We first wanted to know if waste has any influence on
biosynthetic flux. The answer is yes, based on an analysis of all
our 1.66104 random viable networks on glucose as the sole carbon
source. This relationship is strongly negative (Pearson’s r = -0.66)
That is, the greater waste production is, the lower the biosynthetic
flux.
In the last section, we showed that for each additional carbon
source a network was required to be viable on, biosynthetic flux
increased by 0.01–0.02 mmoles of biomass per g DW and hour
(Figure 3B). If we express biomass synthesis instead as moles of
carbon (in synthesized biomass) per g DW and per hour,
biosynthetic flux increases on average by 0.1 mmoles of carbon
per g DW hour with increasing nutrient flexibility. We hypoth-
esized that this increase can be explained through the influence of
nutrient flexibility N on waste production W. To this end, we first
analyzed random viable networks that vary in N and that can
synthesize all B= 63 molecules E. coli biomass molecules (Figure 3,
orange data points). We found that waste production decreased by
a number that is statistically indistinguishable from 0.1 mmol of
carbon per g DW hour (W= (-0.0960.02)N +24, n = 1000
networks) for every additional carbon source that a network is
viable on. Statistically indistinguishable relationships exist for
networks with B= 20, B= 30, and B= 40 biomass components.
(Figure 3, green, purple, and blue data). These observations
suggest that the positive influence of nutrient flexibility on
biosynthesis flux comes from reduced waste production. We later
discuss experimental evidence supporting this observation.
In a final analysis related to waste production, we studied the
relationship between biosynthetic ability and waste production,
and found no significant such relationship.
The Variables We Considered can Explain 84 Percent ofthe Variance in Biosynthetic Flux
Thus far, we have considered five variables and how they
influence biosynthetic flux. These are network size R, nutrient
flexibility N, biosynthetic ability B, waste production W, and
numbers of active reaction RA. To understand how biosynthetic
flux depends on not just one but all of these variables, we carried
out a multiple regression analysis with flux as the dependent
variable. This regression analysis showed that the variables we
regression coefficients with 95% confidence intervals are given in theinset, in the format y = (a6e)x+b, where a is the regression coefficient, ethe confidence interval, and b is the intercept of the regression line withthe vertical axis.doi:10.1371/journal.pone.0039903.g002
Figure 3. Waste production decreases with nutrient flexibility.The vertical axis shows waste that is excreted carbon in mmoles per gDW hour in random networks as a function of nutrient flexibility. Dotsand lengths of error bars correspond to means and one standarddeviation based on a sample of n = 1000 minimal networks. Solid linesindicate linear regression lines for different values of B. Numericalestimates of regression coefficients with 95% confidence intervals aregiven in the inset.doi:10.1371/journal.pone.0039903.g003
Design Constraints on a Synthetic Metabolism
PLoS ONE | www.plosone.org 5 June 2012 | Volume 7 | Issue 6 | e39903

analyzed explain 84 percent of the variation in biosynthetic flux
(R2 = 0.84).
Synthesis of Biochemically Related Molecules RequiresFewer Reactions, because it Produces Less Waste
In our analysis of how required reaction numbers depend on
a network’s biosynthetic abilities, we have purposely focused on
randomly chosen biomass precursors, as they give us an unbiased
view of this dependency. However, this relationship may change if
one considers biochemically related biomass molecules. To obtain
some insights how it changes, we next studied a group of molecules
whose known biosynthesis pathways share several reactions. These
are the 20 proteinaceous amino acids [58]. Figure 4a shows the
number of reactions in minimal networks that can synthesize all 20
proteinaceous amino acids (left panel), as well as the number of
reactions needed to synthesize 20 randomly chosen biomass
molecules (right panel). Amino acid synthesizing networks need
191610 (mean 6 one standard deviation) reactions, 27 percent
fewer than the 261624 reactions needed to synthesize 20 arbitrary
molecules. This difference is highly significant (P,10210, Mann-
Whitney U-test, n = 100) [59].
In minimal networks every reaction is active under the
conditions we study. Our observations in the last paragraph thus
also show that amino acid biosynthesis needs fewer active reactions
than biosynthesis of arbitrary biomass molecules. One of our
analyses above showed that fewer active reactions also imply
higher biosynthetic flux, which raises the question whether the 20
amino acids can be synthesized at higher rates. The answer is yes
(Figure 5b). Minimal networks that synthesize 20 arbitrary biomass
molecules synthesize them 35 percent more slowly than minimal
networks that synthesize 20 amino acids (P,10213, n= 80, Mann-
Whitney U-test) [59].
We next hypothesized that these dependencies might be
explicable as a by-product of a lower cost of amino acid synthesis.
If amino acids have fewer carbon molecules than the average
biomass molecule, both fewer steps would be needed to synthesize
them and a higher synthesis rate could be achieved. To test this
hypothesis, we computed the average carbon content of all 20
amino acids, weighted by each amino acid’s stoichiometry in
biomass, as 1.2860.60 mmoles of carbon per mmole biomass.
This molecular weight turned out not to be smaller but
significantly larger than the carbon content of 20 random biomass
molecules, also weighted by their stoichiometry in biomass
(0.8760.15 mmoles of carbon, P,2.2610216, one sample t-test,
for n= 105 sets of 20 random biomass molecules). This means that
low amino acid cost cannot explain a higher rate of amino acid
production.
We next asked whether lower waste production might be
responsible for the lower biosynthetic flux we observed. We
therefore analyzed the quantity of secreted waste products in 80
networks that synthesize 20 amino acids, and in 80 networks
that synthesize 20 random biomass compounds. Waste pro-
duction is indeed significantly lower in networks that synthesize
amino acids (P,10217, Mann-Whitney U-test) [59]. Specifically,
amino acid synthesizing networks produce 47 percent less waste
than networks that synthesize arbitrary molecules. They excrete
on average 22.8 mmoles of carbon waste per g DW hour
(Figure 5c).
To provide a concrete example of a prominent waste
molecule, consider the amount of secreted carbon dioxide. For
each mole of carbon entering a network in the form of glucose,
amino acid synthesizing networks excrete 0.1860.12 (mean 6
one standard deviation) moles of carbon per g DW hour as
carbon dioxide, whereas networks synthesizing 20 arbitrary
molecules excrete 0.3160.06 mmoles of carbon per g DW hour
as carbon dioxide (P,10225, Mann-Whitney U-test) [59]. In
sum, waste production is an important factor in explaining the
smaller costs of amino acid biosynthesis compared to arbitrary
biomass molecules.
Figure 4. Synthesis of biochemically related compoundsrequire less reactions, achieve higher biosynthetic flux withless waste. Box-plot of a) number of reactions, b) biosynthetic flux inmmoles per g DW hour, and c) waste in mmoles per g DW per hour inminimal networks synthesizing twenty amino acids (left panel) andsynthesizing twenty random biomass molecules (right panel). Horizon-tal lines in the middle of each box mark the median. The edges of theboxes correspond to the 25th and 75th percentiles. Data is based ona sample of n= 80 for each box.doi:10.1371/journal.pone.0039903.g004
Design Constraints on a Synthetic Metabolism
PLoS ONE | www.plosone.org 6 June 2012 | Volume 7 | Issue 6 | e39903

Discussion
We here studied typical properties of metabolic networks with
recently developed techniques to create random and unbiased
samples of metabolic networks from a vast space of such
networks [46,47]. Specifically, we studied the quantitative
relationships between 6 different properties. These are the
number of alternative sole carbon sources N that a network can
use – its nutrient flexibility –, the number of (biomass) molecules
B it can synthesize, the rate S at which it can synthesize these
molecules, the number of reactions R in the network, the
number of active reactions RA, that is, reactions that have
nonzero metabolic flux, and the amount of waste W the
network produces.
We focused first on how the number of minimally needed
reactions R depends on N and B, because this number of reactions
is an important design variable. Smaller networks would be easier
to design and smaller genomes would be easier to synthesize [35].
More than that, biosynthetic processes are more controllable and
predictable in a small metabolism [1,18]. We found that for every
additional molecule to be synthesized, a network needs on average
three additional reactions.
In a related analysis, we focused on nutrient flexibility. The
ability of a metabolic network to sustain life on multiple sources of
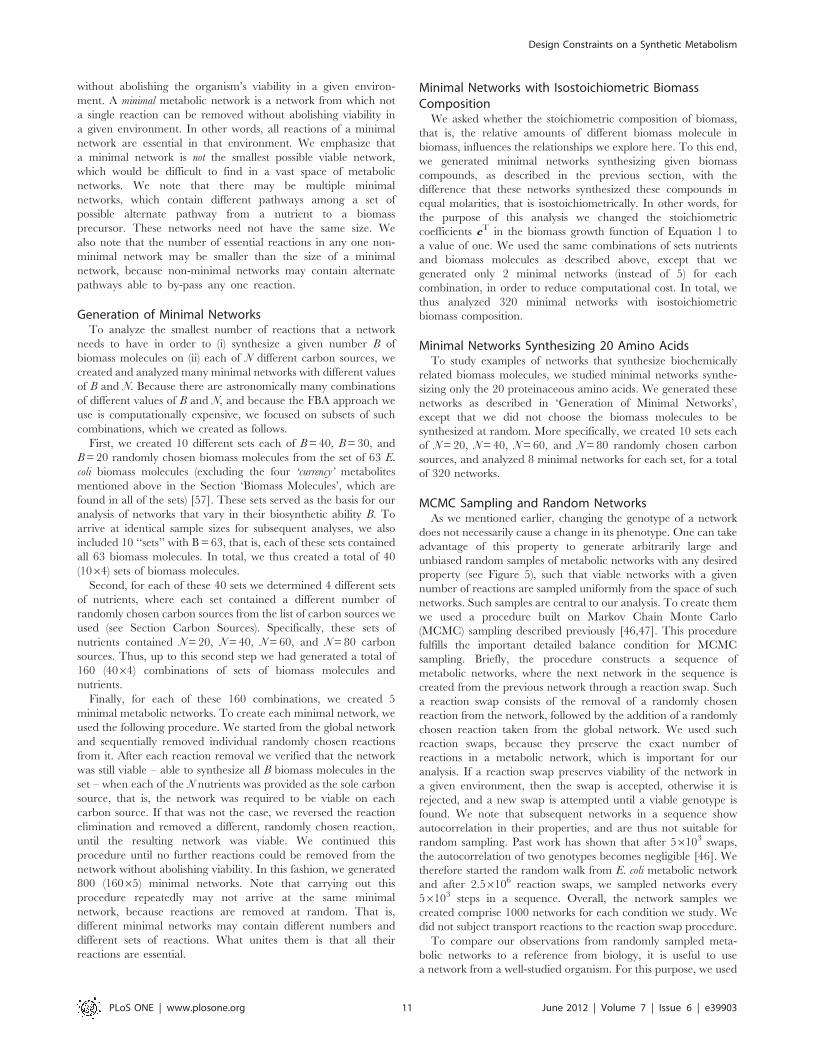
Figure 5. Exploration of a metabolic network space. Metabolic networks can be viewed as subsets of enzyme-catalyzed metabolic reactions ina global reaction set. Formally, they can be represented as binary vectors listing the reactions catalyzed by enzymes in an organism, as indicated fortwo hypothetical metabolic networks (N1, N2) in the figure. Metabolic phenotypes are computed from metabolic networks using FBA. They can berepresented as binary vectors indicating the carbon sources (i.e.: alanine, glucose, melibiose,…) on which a network is viable, that is, on which it cansynthesize a given set of (biomass) molecules. Neighboring networks (blue circles linked by edges) differ by a single reaction swap (edges betweencircles) that leaves the metabolic phenotype unchanged. A reaction swap consists of two changes: one random reaction addition (R4 in the example)and one random reaction deletion (R3 in the example). A series of successful reaction swaps is called a random walk (indicated by red arrows). TheMarkov Chain Monte Carlo (MCMC) technique allows one to randomly sample networks with a given phenotype by generating long random walksthrough genotype space, where each step in a walk consists of a reaction swap. The advantage of using reaction swaps is that they leave the numberof reactions constant.doi:10.1371/journal.pone.0039903.g005
Design Constraints on a Synthetic Metabolism
PLoS ONE | www.plosone.org 7 June 2012 | Volume 7 | Issue 6 | e39903
chemical elements and energy is highly desirable in industrial
production processes [31]. Examples include biofuel production
from cellulosic biomass. Cellulosic biomass contains both hexoses
(e.g., glucose) and pentoses, whose major constituent is xylose
[31,60]. Many yeast species, for instance, do not consume
pentoses, and need to be engineered to have greater nutrient
flexibility to make biofuel production more efficient [60]. In our
analysis, we found that for every additional carbon source to be
utilized, a network needs on average two additional reactions.
Thus, it is more expensive, in terms of the number of needed
reactions, to synthesize additional molecules than to synthesize the
same molecules but from a larger number of alternative carbon
sources.
Anecdotal evidence for the tendency that increased nutrient
flexibility requires larger networks is provided by two networks for
which nutrient flexibility is experimentally known [57,61]. These
are E. coli where N= 54 and R= 1396 and Bacillus Subtilis where N
is smaller (N= 41) and so is R (R= 769). We also compared the
computationally predicted number of carbon sources that can be
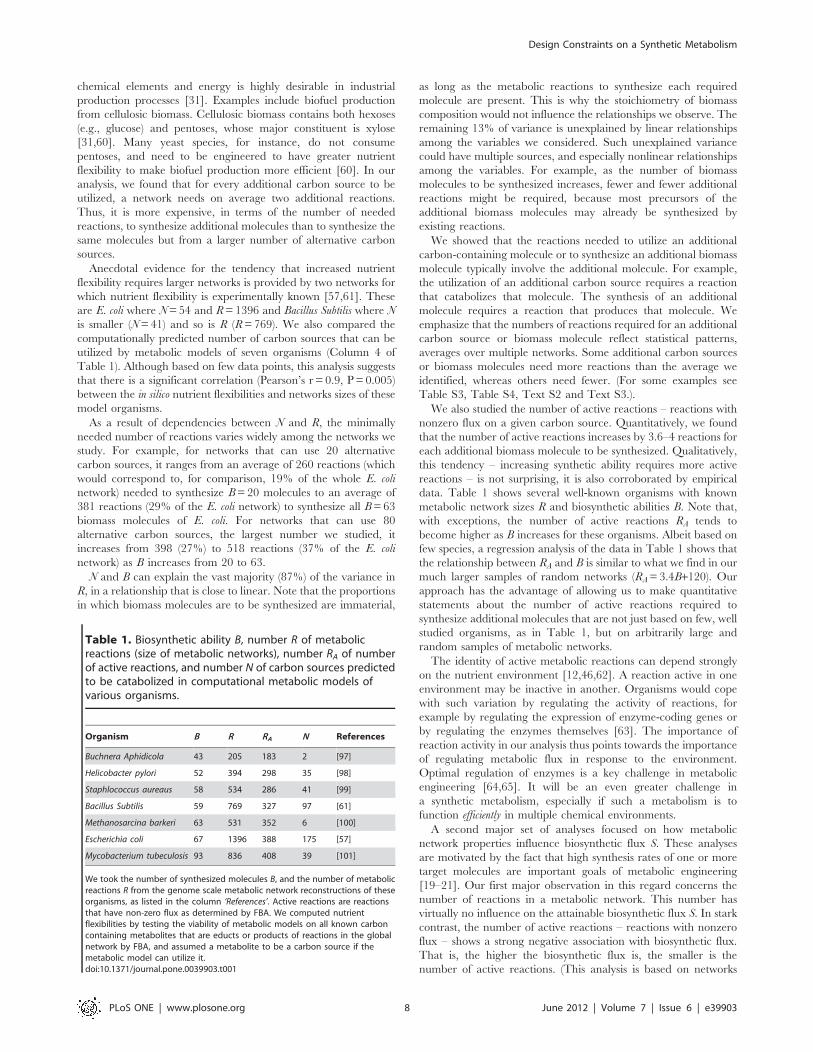
utilized by metabolic models of seven organisms (Column 4 of
Table 1). Although based on few data points, this analysis suggests
that there is a significant correlation (Pearson’s r = 0.9, P = 0.005)
between the in silico nutrient flexibilities and networks sizes of these
model organisms.
As a result of dependencies between N and R, the minimally
needed number of reactions varies widely among the networks we
study. For example, for networks that can use 20 alternative
carbon sources, it ranges from an average of 260 reactions (which
would correspond to, for comparison, 19% of the whole E. coli
network) needed to synthesize B= 20 molecules to an average of
381 reactions (29% of the E. coli network) to synthesize all B= 63
biomass molecules of E. coli. For networks that can use 80
alternative carbon sources, the largest number we studied, it
increases from 398 (27%) to 518 reactions (37% of the E. coli
network) as B increases from 20 to 63.
N and B can explain the vast majority (87%) of the variance in
R, in a relationship that is close to linear. Note that the proportions
in which biomass molecules are to be synthesized are immaterial,
as long as the metabolic reactions to synthesize each required
molecule are present. This is why the stoichiometry of biomass
composition would not influence the relationships we observe. The
remaining 13% of variance is unexplained by linear relationships
among the variables we considered. Such unexplained variance
could have multiple sources, and especially nonlinear relationships
among the variables. For example, as the number of biomass
molecules to be synthesized increases, fewer and fewer additional
reactions might be required, because most precursors of the
additional biomass molecules may already be synthesized by
existing reactions.
We showed that the reactions needed to utilize an additional
carbon-containing molecule or to synthesize an additional biomass
molecule typically involve the additional molecule. For example,
the utilization of an additional carbon source requires a reaction
that catabolizes that molecule. The synthesis of an additional
molecule requires a reaction that produces that molecule. We
emphasize that the numbers of reactions required for an additional
carbon source or biomass molecule reflect statistical patterns,
averages over multiple networks. Some additional carbon sources
or biomass molecules need more reactions than the average we
identified, whereas others need fewer. (For some examples see
Table S3, Table S4, Text S2 and Text S3.).
We also studied the number of active reactions – reactions with
nonzero flux on a given carbon source. Quantitatively, we found
that the number of active reactions increases by 3.6–4 reactions for
each additional biomass molecule to be synthesized. Qualitatively,
this tendency – increasing synthetic ability requires more active
reactions – is not surprising, it is also corroborated by empirical
data. Table 1 shows several well-known organisms with known
metabolic network sizes R and biosynthetic abilities B. Note that,
with exceptions, the number of active reactions RA tends to
become higher as B increases for these organisms. Albeit based on
few species, a regression analysis of the data in Table 1 shows that
the relationship between RA and B is similar to what we find in our
much larger samples of random networks (RA = 3.4B+120). Our
approach has the advantage of allowing us to make quantitative
statements about the number of active reactions required to
synthesize additional molecules that are not just based on few, well
studied organisms, as in Table 1, but on arbitrarily large and
random samples of metabolic networks.
The identity of active metabolic reactions can depend strongly
on the nutrient environment [12,46,62]. A reaction active in one
environment may be inactive in another. Organisms would cope
with such variation by regulating the activity of reactions, for
example by regulating the expression of enzyme-coding genes or
by regulating the enzymes themselves [63]. The importance of
reaction activity in our analysis thus points towards the importance
of regulating metabolic flux in response to the environment.
Optimal regulation of enzymes is a key challenge in metabolic
engineering [64,65]. It will be an even greater challenge in
a synthetic metabolism, especially if such a metabolism is to
function efficiently in multiple chemical environments.
A second major set of analyses focused on how metabolic
network properties influence biosynthetic flux S. These analyses
are motivated by the fact that high synthesis rates of one or more
target molecules are important goals of metabolic engineering
[19–21]. Our first major observation in this regard concerns the
number of reactions in a metabolic network. This number has
virtually no influence on the attainable biosynthetic flux S. In stark
contrast, the number of active reactions – reactions with nonzero
flux – shows a strong negative association with biosynthetic flux.
That is, the higher the biosynthetic flux is, the smaller is the
number of active reactions. (This analysis is based on networks
Table 1. Biosynthetic ability B, number R of metabolicreactions (size of metabolic networks), number RA of numberof active reactions, and number N of carbon sources predictedto be catabolized in computational metabolic models ofvarious organisms.
Organism B R RA N References
Buchnera Aphidicola 43 205 183 2 [97]
Helicobacter pylori 52 394 298 35 [98]
Staphlococcus aureaus 58 534 286 41 [99]
Bacillus Subtilis 59 769 327 97 [61]
Methanosarcina barkeri 63 531 352 6 [100]
Escherichia coli 67 1396 388 175 [57]
Mycobacterium tubeculosis 93 836 408 39 [101]
We took the number of synthesized molecules B, and the number of metabolicreactions R from the genome scale metabolic network reconstructions of theseorganisms, as listed in the column ‘References’. Active reactions are reactionsthat have non-zero flux as determined by FBA. We computed nutrientflexibilities by testing the viability of metabolic models on all known carboncontaining metabolites that are educts or products of reactions in the globalnetwork by FBA, and assumed a metabolite to be a carbon source if themetabolic model can utilize it.doi:10.1371/journal.pone.0039903.t001
Design Constraints on a Synthetic Metabolism
PLoS ONE | www.plosone.org 8 June 2012 | Volume 7 | Issue 6 | e39903

that have more than the minimally necessary number of reactions
in a given environment. In minimal networks, all reactions must be
active.) This observation is consistent with earlier work based on
four microbial metabolic networks [12].
A second important influence on biosynthetic flux S is the
number of biomass molecules to be synthesized. Specifically, every
additional such molecule reduces S by approximately 5 percent.
This influence is stronger than the influence of nutrient flexibility,
where each additional carbon source changes biomass synthesis
flux by 1 percent. That nutrient flexibility influences biosynthesis
rates is known from experiment [31,66–69]. For example,
engineered yeast strains capable of growing on more carbon
sources achieve higher product yields [31].
The amount of waste W that a network produces is a third, and
the most important influence on biosynthetic flux S. Metabolic
networks generally excrete waste, for example, in the form of
carbon dioxide [12], acetate [12,70], pyruvate [70] or glycerol
[60,66]. Not only does this mean wasted resources, some waste
products may also be toxic and interfere with goals of metabolic
engineering [27]. We found that biosynthetic flux S shows a strong
negative correlation with waste production W in the form of
excreted carbon. This observation is in qualitative agreement with
experimental observations [60,66,70]. For example in E. coli,
Weber et al [70] demonstrated that excretion of methylglyoxal, D-
and L-lactate, pyruvate, and acetate decreases growth rates. We
also observed that networks with higher nutrient flexibility
produce less waste, such that for each additional carbon source,
networks produce 0.1 mmoles less in excreted carbon waste. This
relationship can help explain the positive influence of N on flux S.
Experimental support for this observation exists as well. For
example, Wisselink et al. [31] observed that increased ethanol
production in engineered yeast with higher nutrient flexibility is
caused by reduced production of the waste products xylitol and
arabinitol. Relatedly, the elimination of glycerol formation
increases the yield of ethanol up to 10 percent in yeast [66]. Ho
et al. [60] report similar observations.
We also found that an analogous association does not exist for
B. Networks seem to produce indistinguishable amounts of waste
products regardless of how many biomass molecules they
synthesize.
Overall, the quantities we examined can explain 84 percent of
the variance in biosynthetic flux S we observed. This means, that
these quantities account for most of the variation in the
biosynthetic flux, and are thus important factors in the design of
a synthetic metabolism.
In our final analysis, we showed that the nature of the molecules
to be synthesized can influence biosynthetic flux. For example, in
biotechnological applications, a metabolic network may need to
synthesize molecules that are closely related, and whose bio-
synthetic pathways are therefore similar, in the sense that they
share many reactions. Examples include vitamins and coenzymes
[71], taxols and related taxoids [72], hydrocarbons and related
ether lipids [73], as well as amino acids [74]. We examined the
influence of biochemical relatedness by studying metabolic
networks that synthesize all 20 amino acids, and by comparing
them with networks that synthesize 20 arbitrary biomass
molecules. In this analysis, we found that amino acids could be
synthesized with fewer reactions, which reflects their biosynthetic
relatedness. They can also be synthesized at a rate that is 35
percent higher, because their biosynthesis produces 47 percent less
waste as excreted carbon. These differences are substantial, given
that metabolic engineering in biotechnological processes typically
increases synthesis rates of desired products by 5–10 percent
[66,75–77].
We conclude with some caveats and limitations of our analysis.
First, we are well aware that there is still a gap between current
metabolic engineering and synthetic biology experiments on the
one hand, and theoretical studies such as ours on the other. We see
the value of studies like ours as providing quantitative reference
points for future experimental work in this area.
Second, flux balance analysis, on which our approach rests,
assumes a metabolic system that is in a steady-state, such as might
be achieved by a microbial population growing under a constant
nutrient supply. This assumption ignores possible additional
constraints that regulation and enzyme kinetics exert on a metab-
olism [78,79]. While achieving proper regulation remains a big
challenge in synthetic biology, we note that some of our
observations are unlikely to be affected by this assumption. For
example, relaxing this assumption would not reduce the minimal
number of reactions needed for a given biosynthetic task.
Third, we focus on typical network properties, that is, properties
of metabolic networks sampled at random from a large space of
such networks. Optimization procedures that search metabolic
networks space systematically may be able to identify individual
networks whose properties deviate from those we identified as
typical. For example, they may identify networks that are able to
synthesize biomass with even fewer reactions or at higher rates.
Such procedures have been successful in other combinatorial
optimization problems. They include simulated annealing [80,81],
bi-level optimization [82,83], OptFlux [84], convex optimization
[85] and evolutionary optimization [86,87]. The extent to which
they can identify networks with superior design remains an
important subject of future work.
Fourth, the expression of enzymes itself has a metabolic cost.
This cost may be reduced by regulating enzyme expression
depending on the nutrient environment (through a regulatory
machinery whose expression may itself be costly.) We did not
consider costs like these here, because they are poorly understood
on a quantitative level. Their analysis also remains an important
goal for future work.
Finally, we note that an organism’s genome encodes more than
metabolism. Nonmetabolic genes, even in small genomes serve
roles in systems that allow cell motility, signaling, secretion, and
defense [14]. The heterogeneity of these systems will make
general, quantitative statements about design constraints for entire
genomes more difficult to obtain. In this regard, we note that the
proportion of a gene’s genome devoted to metabolism increases in
small genomes. For example, in the free-living E. coli with a large
genome, fewer than 75 percent of genes exert metabolic functions
[88]. In contrast, in some endosymbionts including Buchnera,
Wiggleswothia glossinidia and Thiomicrospira crunogena more than 80
percent of genes are devoted to metabolic functions, and in yet
others, such as the gamma proteobacteria, Blochmanni floridanus and
Wolbachia pipientis more than 95 percent have metabolic functions
[14]. Thus, the constraints we identified here would affect the
majority and perhaps the vast majority of a synthetic minimal
organism’s genome.
Methods
The metabolic genotype of an organism comprises all genes that
encode metabolic enzymes. This genotype can be compactly
represented through a list of reactions that can take place in the
organism and that are catalyzed by enzymes [36,37,89–92]. Each
metabolic genotype exists in a vast metabolic genotype space that
contains all possible metabolic networks – all possible combina-
tions of reactions drawn from a set of biochemically feasible
reactions – that could take place in a living system. According to
Design Constraints on a Synthetic Metabolism
PLoS ONE | www.plosone.org 9 June 2012 | Volume 7 | Issue 6 | e39903

our current knowledge, there are more than 5000 such reactions,
which means that metabolic genotype space comprises 25000
possible metabolic networks. The metabolic genotype or metabolic
network of any one organism can be viewed as a point in this
space. Two genotypes differing from each other in a single
reaction are neighbors in this space. We refer to a network’s
metabolic phenotype as the spectrum of chemical environments –
defined by nutrients these environments contain – on which the
network can synthesize a predetermined spectrum of molecules, as
well as the rate at which it can synthesize these molecules. We call
a network viable in a given environment if it can synthesize all these
molecules in the environment.
Flux Balance AnalysisFlux balance analysis (FBA) is a constraint-based modeling
approach that predicts steady state metabolic fluxes – rates of
substrate to product conversion – for all metabolic reactions in
a metabolic network. It can thus also predict the biomass yield and
other complex metabolic attributes of a metabolic network
[78,79]. Because FBA does not need kinetic information, but only
stoichiometric information about the reactions involved, it is
a widely used approach for analyzing the metabolism of well-
studied organisms such as E. coli and S. cerevisiae [40,78,79]. The
needed stoichiometric information comes from experimental
biochemical analysis, as well as from comparative analyses of
enzyme-coding genes in different, completely sequenced genomes.
This information is encapsulated in a stoichiometric matrix S of
dimensions m6n, where m denotes the number of metabolites, and
n is the number of reactions in a network [40,79]. FBA assumes
that a metabolic network is in a metabolic steady-state, such as
may occur in a microbial population that proliferates in an
unchanging environment. Because mass needs to be conserved
under these conditions, any vector v of metabolic fluxes – the rates
at which a network’s metabolic reactions convert substrates into
products – must satisfy the equation.
Sv~0:
This equation typically has a large solution space of allowable
fluxes. The size of this space can be reduced somewhat by placing
biochemically motivated constraints on the irreversibility of some
reactions and on maximal flux magnitudes [93]. In the (reduced)
solution space, FBA then uses linear programming to identify
regions in the space that maximize a quantity of interest, which
can be represented by a linear objective function Z [40,79]. More
specifically, the linear programming formulation of an FBA
problem can be written as:
maxZ~maxfcTvDSv~0,aƒvƒbg ð1Þ
where the vector cT stands for a transposed (T) array c of scalar
coefficients that define the objective function. Vectors a and
b contain lower and upper limits of reaction fluxes in the flux
vector v, respectively. A particularly important quantity to be
maximized is the rate of synthesis of a given set biomass
molecules. We refer to this quantity as the biosynthetic flux (in
units of mmol per g DW per hour) of a metabolic network. We
used the software packages CPLEX (11.0, ILOG; http://www.
ilog.com/) and CLP (1.4, Coin-OR; https://projects/coinor.
org/Clp) to solve all linear programming problems that arise in
this study.
Biomass MoleculesThe starting point of our analysis was a set of 67 biomass
molecules from E. coli [57]. We used these molecules, because E.
coli’s biomass composition is well studied, and many of its
components – amino acids, nucleotides, etc. – also occur in most
other free-living organisms. In addition, E. coli and its biomass
molecules are highly relevant to biotechnological applications
[18,19,21]. For some of our analyses, we needed to vary the
spectrum of metabolites that a metabolic network needs to
synthesize. Among the 67 E. coli biomass molecules, we allowed all
but four molecules to vary. These four molecules are the ‘‘currency
metabolites’’ adenosine 59-diphosphate (ADP), phosphoric acid
(Pi), pyrophosphoric acid (PPi), and hydrogen ions. A complete list
of the biomass molecules we used can be found in Table S1.
Carbon SourcesAny one metabolic network can only synthesize biomass if its
chemical environment contains specific nutrients [94]. In FBA,
these nutrients are represented by special exchange reactions that
reflect transport of nutrients into the cell. The environments we
study are minimal chemical environments that contain a single
molecular source for each essential chemical element. These
sources are oxygen, ammonium, inorganic phosphate, sulfate,
sodium, potassium, cobalt, iron, protons, water, molybdate,
copper, calcium, chloride, magnesium, manganese and zinc, as
well as a single source of carbon. We study how variation in
carbon sources constrains the composition of metabolic networks
that needs to synthesize a given spectrum of molecules. We chose
to vary carbon sources for this purpose, because of carbon’s
centrality as a chemical element in biomass. A complete list of the
carbon sources we used is given in the Table S2.
We computed the biomass growth of a network by taking the
average of its biomass growth rates on each carbon source that the
network is required to be viable on, except where mentioned
otherwise.
Global NetworkSome of our analyses use a ‘‘global reaction network’’. This
global network contains a comprehensive set of known bio-
chemical reactions from multiple organisms, and it has universal
biosynthetic abilities. We are fully aware that no such network is
likely to exist in any one organism. We use this global network
merely as a starting point for successive elimination of reactions, as
described in the next section. We generated this global network by
merging reactions from two sources, as described in more detail in
[47]. The first is the LIGAND reaction database of the Kyoto
Encyclopedia of Genes and Genomes (KEGG) [36,37,89–92].
The second is the complete metabolic reaction set of E. coli
(iAF1260), which contains 1397 non-transport reactions [57]. We
excluded from this network (i) all reactions involving polymer
metabolites of unspecified numbers of monomer units, (ii) general
polymerization reactions with uncertain stoichiometry, (ii) reac-
tions involving glycans, due to their complex structure, (iv)
reactions with unbalanced stoichiometry, and (v) reactions in-
volving complex metabolites without chemical information about
their structure [47]. After these procedures the global network
contained 5906 internal (non-transport reactions) and 5030
metabolites.
Essential Reactions and Minimal NetworksA gene whose deletion abolishes the viability of an organism
is called an essential gene. Analogously, an essential reaction in
a metabolic network is a reaction that cannot be removed
Design Constraints on a Synthetic Metabolism
PLoS ONE | www.plosone.org 10 June 2012 | Volume 7 | Issue 6 | e39903
without abolishing the organism’s viability in a given environ-
ment. A minimal metabolic network is a network from which not
a single reaction can be removed without abolishing viability in
a given environment. In other words, all reactions of a minimal
network are essential in that environment. We emphasize that
a minimal network is not the smallest possible viable network,
which would be difficult to find in a vast space of metabolic
networks. We note that there may be multiple minimal
networks, which contain different pathways among a set of
possible alternate pathway from a nutrient to a biomass
precursor. These networks need not have the same size. We
also note that the number of essential reactions in any one non-
minimal network may be smaller than the size of a minimal
network, because non-minimal networks may contain alternate
pathways able to by-pass any one reaction.
Generation of Minimal NetworksTo analyze the smallest number of reactions that a network
needs to have in order to (i) synthesize a given number B of
biomass molecules on (ii) each of N different carbon sources, we
created and analyzed many minimal networks with different values
of B and N. Because there are astronomically many combinations
of different values of B and N, and because the FBA approach we
use is computationally expensive, we focused on subsets of such
combinations, which we created as follows.
First, we created 10 different sets each of B= 40, B= 30, and
B= 20 randomly chosen biomass molecules from the set of 63 E.
coli biomass molecules (excluding the four ‘currency’ metabolites
mentioned above in the Section ‘Biomass Molecules’, which are
found in all of the sets) [57]. These sets served as the basis for our
analysis of networks that vary in their biosynthetic ability B. To
arrive at identical sample sizes for subsequent analyses, we also
included 10 ‘‘sets’’ with B = 63, that is, each of these sets contained
all 63 biomass molecules. In total, we thus created a total of 40
(1064) sets of biomass molecules.
Second, for each of these 40 sets we determined 4 different sets
of nutrients, where each set contained a different number of
randomly chosen carbon sources from the list of carbon sources we
used (see Section Carbon Sources). Specifically, these sets of
nutrients contained N= 20, N= 40, N= 60, and N= 80 carbon
sources. Thus, up to this second step we had generated a total of
160 (4064) combinations of sets of biomass molecules and
nutrients.
Finally, for each of these 160 combinations, we created 5
minimal metabolic networks. To create each minimal network, we
used the following procedure. We started from the global network
and sequentially removed individual randomly chosen reactions
from it. After each reaction removal we verified that the network
was still viable – able to synthesize all B biomass molecules in the
set – when each of the N nutrients was provided as the sole carbon
source, that is, the network was required to be viable on each
carbon source. If that was not the case, we reversed the reaction
elimination and removed a different, randomly chosen reaction,
until the resulting network was viable. We continued this
procedure until no further reactions could be removed from the
network without abolishing viability. In this fashion, we generated
800 (16065) minimal networks. Note that carrying out this
procedure repeatedly may not arrive at the same minimal
network, because reactions are removed at random. That is,
different minimal networks may contain different numbers and
different sets of reactions. What unites them is that all their
reactions are essential.
Minimal Networks with Isostoichiometric BiomassComposition
We asked whether the stoichiometric composition of biomass,
that is, the relative amounts of different biomass molecule in
biomass, influences the relationships we explore here. To this end,
we generated minimal networks synthesizing given biomass
compounds, as described in the previous section, with the
difference that these networks synthesized these compounds in
equal molarities, that is isostoichiometrically. In other words, for
the purpose of this analysis we changed the stoichiometric
coefficients cT in the biomass growth function of Equation 1 to
a value of one. We used the same combinations of sets nutrients
and biomass molecules as described above, except that we
generated only 2 minimal networks (instead of 5) for each
combination, in order to reduce computational cost. In total, we
thus analyzed 320 minimal networks with isostoichiometric
biomass composition.
Minimal Networks Synthesizing 20 Amino AcidsTo study examples of networks that synthesize biochemically
related biomass molecules, we studied minimal networks synthe-
sizing only the 20 proteinaceous amino acids. We generated these
networks as described in ‘Generation of Minimal Networks’,
except that we did not choose the biomass molecules to be
synthesized at random. More specifically, we created 10 sets each
of N= 20, N= 40, N= 60, and N= 80 randomly chosen carbon
sources, and analyzed 8 minimal networks for each set, for a total
of 320 networks.
MCMC Sampling and Random NetworksAs we mentioned earlier, changing the genotype of a network
does not necessarily cause a change in its phenotype. One can take
advantage of this property to generate arbitrarily large and
unbiased random samples of metabolic networks with any desired
property (see Figure 5), such that viable networks with a given
number of reactions are sampled uniformly from the space of such
networks. Such samples are central to our analysis. To create them
we used a procedure built on Markov Chain Monte Carlo
(MCMC) sampling described previously [46,47]. This procedure
fulfills the important detailed balance condition for MCMC
sampling. Briefly, the procedure constructs a sequence of
metabolic networks, where the next network in the sequence is
created from the previous network through a reaction swap. Such
a reaction swap consists of the removal of a randomly chosen
reaction from the network, followed by the addition of a randomly
chosen reaction taken from the global network. We used such
reaction swaps, because they preserve the exact number of
reactions in a metabolic network, which is important for our
analysis. If a reaction swap preserves viability of the network in
a given environment, then the swap is accepted, otherwise it is
rejected, and a new swap is attempted until a viable genotype is
found. We note that subsequent networks in a sequence show
autocorrelation in their properties, and are thus not suitable for
random sampling. Past work has shown that after 56103 swaps,
the autocorrelation of two genotypes becomes negligible [46]. We
therefore started the random walk from E. coli metabolic network
and after 2.56106 reaction swaps, we sampled networks every
56103 steps in a sequence. Overall, the network samples we
created comprise 1000 networks for each condition we study. We
did not subject transport reactions to the reaction swap procedure.
To compare our observations from randomly sampled meta-
bolic networks to a reference from biology, it is useful to use
a network from a well-studied organism. For this purpose, we used
Design Constraints on a Synthetic Metabolism
PLoS ONE | www.plosone.org 11 June 2012 | Volume 7 | Issue 6 | e39903

the metabolic network of E. coli, because E. coli is able to survive in
multiple different environments [95,96].
Generation of Starting Networks for MCMC SamplingTo initiate the MCMC procedure that generates random
samples of networks with a given set of properties, we needed
starting networks that have these properties. Specifically, we
needed to create networks with a given number of reactions R,
nutrient flexibility N, and biosynthetic ability B. To this end, we
started with the same 160 sets of N nutrients and B biomass
molecules described in ‘Generation of Minimal Networks’. We
created for each set 5 viable networks that differ in their number of
reactions, that is, they had 400, 500, 600, 700 and 800 reactions.
To create these networks, we used the same procedure as for the
production of minimal networks, except that we stopped removing
reactions when a network with the desired number of reactions
had been reached. At the end of this procedure, we had 800
networks (16065) with various combinations of the 3 network
properties. We used each of these networks as starting networks for
MCMC sampling, and generated 20 random viable networks from
each of the 800 starting networks, for a total of 16000 random
networks. This amounts to 200 networks for each different
combination of N, B, and R.
We performed all our analyses using MATLAB (7.10.0, The
MathWorks Inc., Natick, MA, R2010a) and R (R Development
Core Team, 2008).
Supporting Information
Figure S1 Biomass stoichiometry does not affect thenumber of reactions in a minimal network. The vertical
axis shows the number of reactions in minimal networks as
a function of a) biosynthetic ability and b) nutrient flexibility. Dots
and lengths of error bars correspond to means and one standard
deviation. Each blue dot of size 200 indicates networks with the
biomass stoichiometry of E. coli [57]. Each red dot of size 80
indicates networks with isostoichiometric biomass (see Methods).
Red and blue means do not differ from each other significantly
(P.0.40, Mann-Whitney U-test).
(TIF)
Figure S2 Biosynthetic flux distribution. The flux dis-
tributions in units of mmoles per g DW per hour are shown for
each combination of biosynthetic ability (B = 20 first row, B = 30
second row, B = 40 third row, B = 63 last row) and nutrient
flexibility (N = 20 first column, N = 30 second column, N = 40
third column, N = 63 last column) that we examined. Data are
based on 16,000 random viable networks, as described in methods
(1000 networks per panel).
(TIF)
Figure S3 Distribution of number R of reactions. The
distributions of R are shown for each combination of biosynthetic
ability (B = 20 first row, B = 30 second row, B = 40 third row,
B = 63 last row) and nutrient flexibility (N = 20 first column,
N = 30 second column, N = 40 third column, N = 63 last column)
that we examined, and for in total 800 minimal viable networks
(50 Networks per panel).
(TIF)
Table S1 List of E. coli’s Biomass Compounds [57].
(DOC)
Table S2 List of carbon sources used in this study.
(DOC)
Table S3 Examples of reactions required to synthesize addi-
tional biomass molecules. The table contains 20 arbitrary biomass
molecules (left), and a list of reactions that are required to
synthesize the molecule in a random minimal network (in addition
to the reactions that the network needed to synthesize other
biomass molecules). The analysis is based on minimal networks
that are required (i) to synthesize 62 E. coli biomass molecules and
(ii) to be viable on glucose. The Table illustrates that the number
of additional reactions needed depends on the biomass molecule.
(It may also depend on other reactions in a network, but for each
biomass molecule results from only one network are shown.)
(DOC)
Table S4 Examples of reactions required to utilize additional
carbon sources. The table contains arbitrary carbon sources (left)
and a list of reactions that are required to utilize the carbon source
in a random minimal network (in addition to the reactions that the
network needs to utilize other carbon sources). The analysis is
based on minimal networks that were required (i) to synthesize all
E. coli biomass molecules and (ii) to be viable on 30 other carbon
sources. The Table illustrates that the number of additional
reactions needed depends on the carbon source. (It may also
depend on other reactions in a network, but for each carbon
source results for only one network are shown.)
(DOC)
Text S1 Confidence Interval Calculation.
(DOC)
Text S2 Examples of reactions needed to metabolize new carbon
sources.
(DOC)
Text S3 Examples of reactions needed to synthesize additional
biomass molecules.
(DOC)
Acknowledgments
We thank Olivier Martin, Joao F. Matias Rodrigues, Vardan Andriasyan
and Aditya Barve for helpful discussions.
Author Contributions
Conceived and designed the experiments: TB AW. Performed the
experiments: TB. Analyzed the data: TB. Wrote the paper: TB AW.
References
1. Purnick PEM, Weiss R (2009) The second wave of synthetic biology: from
modules to systems. Nature reviews Molecular cell biology 10: 410–422.
Available:http://www.ncbi.nlm.nih.gov/pubmed/19461664. Accessed 2011
Jun 10.
2. Smolke CD, Silver PA (2011) Informing biological design by integration of
systems and synthetic biology. Cell 144: 855–859. Available:http://www.ncbi.
nlm.nih.gov/pubmed/21414477. Accessed 2011 Jun 10.
3. Sprinzak D, Elowitz MB (2005) Reconstruction of genetic circuits. Nature 438:
443–448. Available:http://www.ncbi.nlm.nih.gov/pubmed/16306982. Ac-
cessed 2011 Jul 5.
4. Benner SA, Sismour AM (2005) Synthetic biology. Nature Reviews Genetics 6:
533–543. Available: http://www.ncbi.nlm.nih.gov/pubmed/15995697. Ac-
cessed 2012 Jun 11.
5. Yarmush ML, Banta S (2003) Metabolic engineering: advances in modeling
and intervention in health and disease. Annual review of biomedical
engineering 5: 349–381. Available: http://www.ncbi.nlm.nih.gov/pubmed/
14527316. Accessed 2012 Jun 11.
6. Smith HO, Hutchison CA, Pfannkoch C, Venter JC (2003) Generating
a synthetic genome by whole genome assembly: phiX174 bacteriophage from
synthetic oligonucleotides. Proceedings of the National Academy of Sciences of
Design Constraints on a Synthetic Metabolism
PLoS ONE | www.plosone.org 12 June 2012 | Volume 7 | Issue 6 | e39903

the United States of America 100: 15440–15445. Available: http://www.
p u b m e d c e n t r a l . n i h . g o v / a r t i c l e r e n d e r .
fcgi?artid = 307586&tool = pmcentrez&rendertype = abstract. Accessed 2012
Jun 11.
7. Gibson DG, Benders GA, Andrews-Pfannkoch C, Denisova EA, Baden-Tillson
H, et al. (2008) Complete chemical synthesis, assembly, and cloning of
a Mycoplasma genitalium genome. Science (New York, NY) 319: 1215–1220.
Available: http://www.ncbi.nlm.nih.gov/pubmed/18218864. Accessed 2011
Jul 11.
8. Gibson DG, Glass JI, Lartigue C, Noskov VN, Chuang R-Y, et al. (2010)
Creation of a bacterial cell controlled by a chemically synthesized genome.
Science (New York, NY) 329: 52–56. Available: http://www.ncbi.nlm.nih.gov/
pubmed/20488990. Accessed 2011 Jul 17.
9. Murtas G (2007) Question 7: construction of a semi-synthetic minimal cell:
a model for early living cells. Origins of life and evolution of the biosphere?: the
journal of the International Society for the Study of the Origin of Life 37: 419–
422. Available: http://www.ncbi.nlm.nih.gov/pubmed/17668286. Accessed
2011 Aug 10.
10. Rasmussen S, Chen L, Deamer D, Krakauer DC, Packard NH, et al. (2004)
Evolution. Transitions from nonliving to living matter. Science (New York, NY)
303: 963–965. Available: http://www.ncbi.nlm.nih.gov/pubmed/14963315.
Accessed 2011 Jul 27.
11. Glass JI, Assad-Garcia N, Alperovich N, Yooseph S, Lewis MR, et al. (2006)
Essential genes of a minimal bacterium. Proceedings of the National Academy
of Sciences of the United States of America 103: 425–430. Available: http://
w w w . p u b m e d c e n t r a l . n i h . g o v / a r t i c l e r e n d e r .
fcgi?artid = 1324956&tool = pmcentrez&rendertype = abstract. Accessed 2012
Jun 11.
12. Nishikawa T, Gulbahce N, Motter AE (2008) Spontaneous reaction silencing in
metabolic optimization. PLoS computational biology 4: e1000236. Available:
h t t p : / / w w w . p u b m e d c e n t r a l . n i h . g o v / a r t i c l e r e n d e r .
fcgi?artid = 2582435&tool = pmcentrez&rendertype = abstract. Accessed 2011
Jul 21.
13. Forster AC, Church GM (2006) Towards synthesis of a minimal cell. Molecular
systems biology 2: 45. Available: http://www.pubmedcentral.nih.gov/
articlerender.fcgi?artid = 1681520&tool = pmcentrez&rendertype = abstract.
Accessed 2011 Jun 12.
14. Kuwahara H, Yoshida T, Takaki Y, Shimamura S, Nishi S, et al. (2007)
Reduced genome of the thioautotrophic intracellular symbiont in a deep-sea
clam, Calyptogena okutanii. Current biology?: CB 17: 881–886. Available:
http://www.ncbi.nlm.nih.gov/pubmed/17493812. Accessed 2011 Jul 18.
15. Mira A, Ochman H, Moran NA (2001) Deletional bias and the evolution of
bacterial genomes. Trends in Genetics 17: 589–596. Available: http://www.
ncbi.nlm.nih.gov/pubmed/11585665. Accessed 2012 Jun 11.
16. Gil R, Silva FJ, Zientz E, Delmotte F, Gonzalez-Candelas F, et al. (2003) The
genome sequence of Blochmannia floridanus: comparative analysis of reduced
genomes. Proceedings of the National Academy of Sciences of the United
States of America 100: 9388–9393. Available: http://www.pubmedcentral.nih.
g o v / a r t i c l e r e n d e r .
fcgi?artid = 170928&tool = pmcentrez&rendertype = abstract. Accessed 2012
Jun 11.
17. Nakabachi A, Yamashita A, Toh H, Ishikawa H, Dunbar HE, et al. (2008)
Bacterial Endosymbiont Carsonella. October: 3–5.
18. Mizoguchi H, Sawano Y, Kato J-ichi, Mori H (2008) Superpositioning of
deletions promotes growth of Escherichia coli with a reduced genome. DNA
research?: an international journal for rapid publication of reports on genes and
genomes 15: 277–284. Available: http://www.pubmedcentral.nih.gov/
articlerender.fcgi?artid = 2575892&tool = pmcentrez&rendertype = abstract.
Accessed 2011 Aug 10.
19. Rude MA, Schirmer A (2009) New microbial fuels: a biotech perspective.
Current opinion in microbiology 12: 274–281. Available: http://www.ncbi.
nlm.nih.gov/pubmed/19447673. Accessed 2011 Jul 12.
20. Antoni D, Zverlov VV, Schwarz WH (2007) Biofuels from microbes. Applied
microbiology and biotechnology 77: 23–35. Available: http://www.ncbi.nlm.
nih.gov/pubmed/17891391. Accessed 2011 Jul 17.
21. Lee SK, Chou H, Ham TS, Lee TS, Keasling JD (2008) Metabolic engineering
of microorganisms for biofuels production: from bugs to synthetic biology to
fuels. Current opinion in biotechnology 19: 556–563. Available: http://www.
ncbi.nlm.nih.gov/pubmed/18996194. Accessed 2011 Jul 5.
22. Bailey JE (1991) Toward a science of metabolic engineering. Science 252:
1668–1675. Available: http://www.ncbi.nlm.nih.gov/pubmed/2047876. Ac-
cessed 2012 Jun 11.
23. Steen EJ, Chan R, Prasad N, Myers S, Petzold CJ, et al. (2008) Metabolic
engineering of Saccharomyces cerevisiae for the production of n-butanol.
Microbial cell factories 7: 36. Available: http://www.ncbi.nlm.nih.gov/
pubmed/19055772. Accessed 2012 Jun 11.
24. Steen EJ, Kang Y, Bokinsky G, Hu Z, Schirmer A, et al. (2010) Microbial
production of fatty-acid-derived fuels and chemicals from plant biomass.
Nature 463: 559–562. Available: http://www.ncbi.nlm.nih.gov/pubmed/
20111002. Accessed 2012 Jun 11.
25. Schirmer A, Rude MA., Li X, Popova E, del Cardayre SB (2010) Microbial
Biosynthesis of Alkanes. Science 329: 559–562. Available: http://www.
sciencemag.org/cgi/doi/10.1126/science.1187936. Accessed 2010 Jul 30.
26. Keasling JD (2010) Manufacturing Molecules Through Metabolic Engineering.Science 330: 1355–1358. Available: http://www.sciencemag.org/cgi/doi/10.
1126/science.1193990. Accessed 2010 Dec 2.
27. Mukhopadhyay A, Redding AM, Rutherford BJ, Keasling JD (2008)
Importance of systems biology in engineering microbes for biofuel production.
Current opinion in biotechnology 19: 228–234. Available:http://www.ncbi.nlm.nih.gov/pubmed/18515068. Accessed 2011 Jul 11 July.
28. Schmidt CW (2010) Synthetic Biology: Environmental Health Implications ofa New Field. Environmental Health Perspectives 118: A118–A123.
29. Cases I, Lorenzo V (2005) Genetically modified organisms for the environment:stories of success and failure and what we have learned from them.
International microbiology 8: 213–222. Available: http://scielo.isciii.es/
scielo.php?pid = S1139-67092005000300009&script = sci_abstract&tlng = e.Accessed 2011 Nov 28.
30. Stephanopoulos G, Vallino JJ (1991) Network rigidity and metabolicengineering in metabolite overproduction. Science 252: 1675–1681. Available:
http://www.ncbi.nlm.nih.gov/pubmed/1904627. Accessed 2012 Jun 11.
31. Wisselink HW, Toirkens MJ, Wu Q, Pronk JT, van Maris AJ a (2009) Novelevolutionary engineering approach for accelerated utilization of glucose, xylose,
and arabinose mixtures by engineered Saccharomyces cerevisiae strains.Applied and environmental microbiology 75: 907–914. Available: http://www.
ncbi.nlm.nih.gov/pubmed/19074603. Accessed 2012 Jun 11.
32. Liang JC, Bloom RJ, Smolke CD (2011) Engineering Biological Systems with
Synthetic RNA Molecules. Molecular Cell 43: 915–926. Available: http://
linkinghub.elsevier.com/retrieve/pii/S1097276511006447. Accessed 2011 Sep19.
33. Savage DF, Way J, Silver PA (2008) Defossiling fuel: how synthetic biology cantransform biofuel production. ACS Chemical Biology 3: 13–16.
34. Shendure J, Mitra RD, Varma C, Church GM (2004) Advanced sequencingtechnologies: methods and goals. Nature reviews Genetics 5: 335–344.
Available:http://www.ncbi.nlm.nih.gov/pubmed/15143316. Accessed 2011
Jul 16.
35. Carr PA, Church GM (2009) Genome engineering. Nature biotechnology 27:
1151–1162. Available:http://www.ncbi.nlm.nih.gov/pubmed/20010598. Ac-cessed 2011 Jul 27.
36. Edwards JS, Palsson BO (2000) Robustness analysis of the Escherichia colimetabolic network. Biotechnology Progress 16: 927–939.
37. Edwards JS, Palsson BO (2000) Metabolic flux balance analysis and the in silico
analysis of Escherichia coli K-12 gene deletions. BMC bioinformatics 1: 1.
38. Segre D, Vitkup D, Church GM (2002) Analysis of optimality in natural and
perturbed metabolic networks. Proceedings of the National Academy ofSciences of the United States of America 99: 15112–15117.
39. Smallbone K, Simeonidis E (2009) Flux balance analysis: a geometricperspective. Journal of theoretical biology 258: 311–315.
40. Orth JD, Thiele I, Palsson BØ (2010) What is flux balance analysis? Nature
biotechnology 28: 245–248.
41. Feist AM, Palsson BO (2010) The biomass objective function. Current opinion
in microbiology 13: 344–349.
42. Fong SS, Marciniak JY, Palsson BØ (2003) Description and Interpretation of
Adaptive Evolution of Escherichia coli K-12 MG1655 by Using a Genome-
Scale In Silico Metabolic Model. Journal Of Bacteriology 185: 6400–6408.
43. Fong S, Joyce A (2005) Parallel adaptive evolution cultures of Escherichia coli
lead to convergent growth phenotypes with different gene expression states.Genome research 15: 1365–1372. Available: http://genome.cshlp.org/
content/15/10/1365.short. Accessed 2011 Nov 28.
44. Schellenberger J, Que R, Fleming RMT, Thiele I, Orth JD, et al. (2007)
Quantitative prediction of cellular metabolism with constraint-based models:
the COBRA Toolbox. Nature Protocols 2: 1290–1307.
45. Oberhardt MA, Palsson BØ, Papin JA (2009) Applications of genome-scale
metabolic reconstructions. Molecular Systems Biology 5: 320.
46. Samal A, Matias Rodrigues JF, Jost J, Martin OC, Wagner A (2010) Genotype
networks in metabolic reaction spaces. BMC systems biology 4: 30.
47. Matias Rodrigues JF, Wagner A (2009) Evolutionary plasticity and innovations
in complex metabolic reaction networks. PLoS computational biology 5:
e1000613.
48. Paul G. Higgs TKA (2005) Bioinformatics and molecular evolution. Oxford,
UK: John Wiley and Sons, Ltd.
49. Robert CP, Casella G (2004) Monte Carlo Statistical Methods. Berlin:
Springer.
50. Neal RM (1993) Probabilistic Inference Using Markov Chain Monte Carlo
Methods. Intelligence 62: 144.
51. Li XR (1992) Generation of random points uniformly distributed inhyperellipsoids. Proc First IEEE Conference on Control Applications.
p.654––658 vol.2. doi:10.1109/CCA.1992.269770.
52. Diaconis P (2008) The Markov chain Monte Carlo revolution. Bulletin of the
American Mathematical Society 46: 179–205.
53. Brooks S (1998) Markov chain Monte Carlo method and its application.
Journal of the Royal Statistical Society Series D The Statistician 47: 69–100.
54. Ciliberti S, Martin OC, Wagner A (2007) Robustness Can Evolve Gradually inComplex Regulatory Gene Networks with Varying Topology. PLoS Compu-
tational Biology 3: 10.
55. Hillenmeyer ME, Fung E, Wildenhain J, Pierce SE, Hoon S, et al. (2008) The
chemical genomic portrait of yeast: uncovering a phenotype for all genes.Science (New York, NY) 320: 362–365. Available:http://www.pubmedcentral.
Design Constraints on a Synthetic Metabolism
PLoS ONE | www.plosone.org 13 June 2012 | Volume 7 | Issue 6 | e39903

n i h . g o v / a r t i c l e r e n d e r .
fcgi?artid = 2794835&tool = pmcentrez&rendertype = abstract. Accessed 2011Jul 18.
56. Beller HR, Goh E-B, Keasling JD (2010) Genes involved in long-chain alkene
biosynthesis in Micrococcus luteus. Applied and environmental microbiology76: 1212–1223. Available: http://www.pubmedcentral.nih.gov/articlerender.
fcgi?artid = 2820947&tool = pmcentrez&rendertype = abstract. Accessed 2011Apr 3.
57. Feist AM, Henry CS, Reed JL, Krummenacker M, Joyce AR, et al. (2007) A
genome-scale metabolic reconstruction for Escherichia coli K-12 MG1655 thataccounts for 1260 ORFs and thermodynamic information. Molecular systems
biology 3: 121.58. Morot-Gaudry JF, Job D, Lea PJ (2001) Amino acid metabolism. Medical
Biochemistry. Springer Verlag, Vol. 28. 299–329.59. Mann HB, Whitney DR (1947) On a test of whether one of two random
variables is stochastically larger than the other. The Annals of Mathematical
Statistics 18: 50–60.60. Ho NWY, Chen Z, Brainard AP (1998) Genetically engineered Saccharomyces
yeast capable of effective cofermentation of glucose and xylose. Applied andEnvironmental Microbiology 64: 1852–1859.
61. Oh Y-K, Palsson BO, Park SM, Schilling CH, Mahadevan R (2007) Genome-
scale reconstruction of metabolic network in Bacillus subtilis based on high-throughput phenotyping and gene essentiality data. The Journal of biological
chemistry 282: 28791–28799. Available: http://www.ncbi.nlm.nih.gov/pubmed/17573341. Accessed 2011 Aug 3.
62. Wang Z, Zhang J (2009) Abundant Indispensable Redundancies in CellularMetabolic Networks. Genome biology and evolution 2009: 23–33.
63. Cooper GM (2008) The Cell. Cell 77: 67–109.
64. Wessely F, Bartl M, Guthke R, Li P, Schuster S, et al. (2011) Optimalregulatory strategies for metabolic pathways in Escherichia coli depending on
protein costs. Molecular Systems Biology 7: 515.65. Kim J, Reed JL (2010) OptORF: Optimal metabolic and regulatory
perturbations for metabolic engineering of microbial strains. BMC systems
biology 4: 53.66. Nevoigt E (2008) Progress in Metabolic Engineering of Saccharomyces
cerevisiae. Microbiology and molecular biology reviews MMBR 72: 379–412.67. Madhavan A, Tamalampudi S, Srivastava A, Fukuda H, Bisaria VS, et al.
(2009) Alcoholic fermentation of xylose and mixed sugars using recombinantSaccharomyces cerevisiae engineered for xylose utilization. Applied Microbi-
ology and Biotechnology 82: 1037–1047.
68. Garcia Sanchez R, Karhumaa K, Fonseca C, Sanchez Nogue V, Almeida JR,et al. (2010) Improved xylose and arabinose utilization by an industrial
recombinant Saccharomyces cerevisiae strain using evolutionary engineering.Biotechnology for biofuels 3: 13.
69. Liu E, Hu Y (2010) Construction of a xylose-fermenting Saccharomyces
cerevisiae strain by combined approaches of genetic engineering, chemicalmutagenesis and evolutionary adaptation. Biochemical Engineering Journal 48:
204–210.70. Weber J, Kayser A, Rinas U (2005) Metabolic flux analysis of Escherichia coli
in glucose-limited continuous culture. II. Dynamic response to famine andfeast, activation of the methylglyoxal pathway and oscillatory behaviour.
Microbiology (Reading, England) 151: 707–716. Available:http://www.ncbi.
nlm.nih.gov/pubmed/15758217. Accessed 2011 Aug 24.71. Vandamme EJ (1992) Production of vitamins, coenzymes and related
biochemicals by biotechnological processes. Journal of chemical technologyand biotechnology Oxford Oxfordshire 1986 53: 313–327. Available: http://
doi.wiley.com/10.1002/chin.199229310.
72. Exposito O, Bonfill M, Moyano E, Onrubia M, Mirjalili MH, et al. (2009)Biotechnological production of taxol and related taxoids: current state and
prospects. Anticancer agents in medicinal chemistry 9: 109–121.73. Metzger P, Largeau C (2005) Botryococcus braunii: a rich source for
hydrocarbons and related ether lipids. Applied Microbiology and Biotechnol-
ogy 66: 486–496.74. Leuchtenberger W, Huthmacher K, Drauz K (2005) Biotechnological
production of amino acids and derivatives: current status and prospects.Applied Microbiology and Biotechnology 69: 1–8.
75. Raghevendran V, Patil KR, Olsson L, Nielsen J (2006) Hap4 is not essential foractivation of respiration at low specific growth rates in Saccharomyces
cerevisiae. The Journal of Biological Chemistry 281: 12308–12314.
76. Duenas-Sanchez R, Codon AC, Rincon AM, Benıtez T (2010) Increasedbiomass production of industrial bakers’ yeasts by overexpression of Hap4
gene. International Journal of Food Microbiology 143: 150–160.77. Raab AM, Hlavacek V, Bolotina N, Lang C (2011) Shifting the Fermentative/
Oxidative Balance in Saccharomyces cerevisiae by Transcriptional Deregula-
tion of Snf1 via Overexpression of the Upstream Activating Kinase Sak1p.Applied and Environmental Microbiology 77: 1981–1989.
78. Price ND, Reed JL, Palsson BØ (2004) Genome-scale models of microbial cells:evaluating the consequences of constraints. Nature reviews Microbiology 2:
886–897. Available: http://www.ncbi.nlm.nih.gov/pubmed/15494745. Ac-cessed 2010 Jul 16.
79. Kauffman KJ, Prakash P, Edwards JS (2003) Advances in flux balance analysis.
Current Opinion in Biotechnology 14: 491–496. Available: http://linkinghub.
elsevier.com/retrieve/pii/S0958166903001174. Accessed 2010 Jul 16.
80. Gonzalez OR, Kuper C, Jung K, Naval PC, Mendoza E (2007) Parameter
estimation using Simulated Annealing for S-system models of biochemical
networks. Bioinformatics 23: 480–486.
81. Tomshine J, Kaznessis YN (2006) Optimization of a Stochastically Simulated
Gene Network Model via Simulated Annealing. Biophysical Journal 91: 3196–
3205.
82. Domingues A, Vinga S, Lemos JM (2010) Optimization strategies for metabolic
networks. BMC systems biology 4: 113.
83. Yang L, Mahadevan R, Cluett W (2008) A bilevel optimization algorithm to
identify enzymatic capacity constraints in metabolic networks. Computers &
Chemical Engineering 32: 2072–2085.
84. Rocha I, Maia P, Evangelista P, Vilaca P, Soares S, et al. (2010) OptFlux: an
open-source software platform for in silico metabolic engineering. BMC
systems biology 4: 45.
85. Julius AA, Imielinski M, Pappas GJ (2008) Metabolic networks analysis using
convex optimization. 2008 47th IEEE Conference on Decision and Control:
762–767.
86. Patil KR, Rocha I, Forster J, Nielsen J (2005) Evolutionary programming as
a platform for in silico metabolic engineering. BMC Bioinformatics 6: 308.
87. Ebenhoh O, Heinrich R (2001) Evolutionary optimization of metabolic
pathways. Theoretical reconstruction of the stoichiometry of ATP and NADH
producing systems. Bulletin of Mathematical Biology 63: 21–55.
88. Riley M (1997) Genes and proteins of Escherichia coli K-12 (GenProtEC).
Nucleic Acids Research 25: 51–52.
89. Goto S, Nishioka T, Kanehisa M (2000) LIGAND: chemical database of
enzyme reactions. Nucleic acids research 28: 380–382.
90. Kanehisa M, Goto S (2000) KEGG: kyoto encyclopedia of genes and genomes.
Nucleic acids research 28: 27–30.
91. Goto S, Okuno Y, Hattori M, Nishioka T, Kanehisa M (2002) LIGAND:
database of chemical compounds and reactions in biological pathways. Nucleic
acids research 30: 402–404.
92. Klasson L (2004) Evolution of minimal-gene-sets in host-dependent bacteria.
Trends in Microbiology 12: 37–43. Available:http://linkinghub.elsevier.com/
retrieve/pii/S0966842X03003111. Accessed 2011 Jul 19.
93. Covert MW, Schilling CH, Palsson B (2001) Regulation of gene expression in
flux balance models of metabolism. Journal of theoretical biology 213: 73–88.
94. Handorf T, Christian N, Ebenhoh O, Kahn D (2008) An environmental
perspective on metabolism. Journal of Theoretical Biology 252: 530–537.
95. Welch RA, Burland V, Plunkett G, Redford P, Roesch P, et al. (2002)
Extensive mosaic structure revealed by the complete genome sequence of
uropathogenic Escherichia coli. Proceedings of the National Academy of
Sciences of the United States of America 99: 17020–17024.
96. Touchon M, Hoede C, Tenaillon O, Barbe V, Baeriswyl S, et al. (2009)
Organised genome dynamics in the Escherichia coli species results in highly
diverse adaptive paths. PLoS genetics 5: e1000344. Available:http://www.
p u b m e d c e n t r a l . n i h . g o v / a r t i c l e r e n d e r .
fcgi?artid = 2617782&tool = pmcentrez&rendertype = abstract. Accessed 2011
Jul 21.
97. Thomas GH, Zucker J, Macdonald SJ, Sorokin A, Goryanin I, et al. (2009) A
fragile metabolic network adapted for cooperation in the symbiotic bacterium
Buchnera aphidicola. BMC systems biology 3: 24. Available:http://www.
p u b m e d c e n t r a l . n i h . g o v / a r t i c l e r e n d e r .
fcgi?artid = 2649895&tool = pmcentrez&rendertype = abstract. Accessed 2011
Jun 17.
98. Schilling CH, Covert MW, Famili I, Church GM, Edwards JS, et al. (2002)
Genome-scale metabolic model of Helicobacter pylori 26695. Journal Of
Bacteriology 184: 4582–4593.
99. Becker SA, Palsson BØ (2005) Genome-scale reconstruction of the metabolic
network in Staphylococcus aureus N315: an initial draft to the two-dimensional
annotation. BMC microbiology 5: 8. Available:http://www.pubmedcentral.
n i h . g o v / a r t i c l e r e n d e r .
fcgi?artid = 1079855&tool = pmcentrez&rendertype = abstract. Accessed 2011
Jul 18.
100. Feist AM, Scholten JCM, Palsson BØ, Brockman FJ, Ideker T (2006) Modeling
methanogenesis with a genome-scale metabolic reconstruction of Methano-
sarcina barkeri. Molecular systems biology 2: 2006.0004. Available: http://
w w w . p u b m e d c e n t r a l . n i h . g o v / a r t i c l e r e n d e r .
fcgi?artid = 1681478&tool = pmcentrez&rendertype = abstract. Accessed 2011
Jul 20.
101. Beste DJV, Hooper T, Stewart G, Bonde B, Avignone-Rossa C, et al. (2007)
GSMN-TB: a web-based genome-scale network model of Mycobacterium
tuberculosis metabolism. Genome biology 8: R89. Available: http://www.
p u b m e d c e n t r a l . n i h . g o v / a r t i c l e r e n d e r .
fcgi?artid = 1929162&tool = pmcentrez&rendertype = abstract. Accessed 2011
Jun 14.
Design Constraints on a Synthetic Metabolism
PLoS ONE | www.plosone.org 14 June 2012 | Volume 7 | Issue 6 | e39903