DESIGN AND VERIFICATION OF A MICRO WELLS TURBINE FOR ...
10
1 DESIGN AND VERIFICATION OF A MICRO WELLS TURBINE FOR MEDITERRANEAN OPERATIONS M. Bassetti 1 - A. Corsini 1 – G. Delibra 1 – F. Rispoli 1 – M. Ruggeri 2 - P. Venturini 1 1 Dipartimento di Ingegneria Meccanica e Aerospaziale, Sapienza Università di Roma, Italy 2 Faggiolati Pumps S.p.A., Z. Ind. Sforzacosta - 62100 Macerata Italy ABSTRACT In the framework of the Poseidone Project we have designed a Wells turbine for Mediterranean operations. Here we present RANS computations carried out with OpenFOAM at different operating conditions. Rotor-stator interaction was synthetized with MRF approach and RANS closure relied on the cubic eddy viscosity closure of Lien et al. The virtual test rig reproduced the ISO conditions of the laboratory and was able to correctly predict torque and efficiency at different operations. Computations moreover allowed to acquire information on the three- dimensional velocity and pressure field that develops inside the Wells turbine. The aim was to have an insight on the secondary motions and on the possible stall mechanism that characterize the device at low flow rates. Results were successfully validated against experimental measures. NOMENCLATURE latin Ct torque coefficient [-] Hm averaged sea-wave height [m] k turbulent kinetic energy [m 2 /s 2 ] Pm mechanical power [W] Q volume flow rate [m 3 /s] T torque [Nm] Tm averaged sea-wave period [s] Z number of blades [-] greek ptot total pressure drop [Pa] dissipation of k [m 3 /s 2 ] efficiency Pm·Q∙ptot) = [-] molecular viscosity [m 2 /s] eddy viscosity [m 2 /s] flow coefficient [-] angular velocity [1/s] INTRODUCTION Since the subscription of Tokyo Protocol the struggle against global warming has been a priority of the EU energy plan, that reserved a considerable amount of founds on research and development on Renewable Energy Sources (RES). Among RES, the wave energy production technologies had a great boost during the last thirty years, even if their potential has not been fully exploited so far. In fact Thorpe (1999) estimated a 2 TW/year power capacity over the total sea extension. Clement et al. (2002) estimated an energy density between 20 and 70 kW/m for the most favorable wave climates, and a more uniform daytime availability if compared to the solar radiation. According to Corsini and Rispoli (2006) wave energy has an estimated potential of 320 GW for EU, with 30 GW localized in the Mediterranean Sea. Among the number of wave energy converters, the Oscillating Water Column (OWC) can be considered as the on-shore technology closest to maturity. In fact OWCs already reached the stage of full-scale prototypes, with several pilot plants presently on-duty around the world, see e.g. Whittaker et al. (1993), Heath et al. (2000), Falcao et al. (2002) and White (1989). Proceedings of 11 th European Conference on Turbomachinery Fluid dynamics & Thermodynamics ETC11, March 23-27, 2015, Madrid, Spain OPEN ACCESS Downloaded from www.euroturbo.eu Copyright © by the Authors
Transcript of DESIGN AND VERIFICATION OF A MICRO WELLS TURBINE FOR ...

1
DESIGN AND VERIFICATION OF A MICRO WELLS TURBINE FOR MEDITERRANEAN OPERATIONS
M. Bassetti1 - A. Corsini1 – G. Delibra1 – F. Rispoli1 – M. Ruggeri2 - P. Venturini1
1Dipartimento di Ingegneria Meccanica e Aerospaziale, Sapienza Università di Roma, Italy
2Faggiolati Pumps S.p.A., Z. Ind. Sforzacosta - 62100 Macerata Italy
ABSTRACT In the framework of the Poseidone Project we have designed a Wells turbine for Mediterranean operations. Here we present RANS computations carried out with OpenFOAM at different operating conditions. Rotor-stator interaction was synthetized with MRF approach and RANS closure relied on the cubic eddy viscosity closure of Lien et al. The virtual test rig reproduced the ISO conditions of the laboratory and was able to correctly predict torque and efficiency at different operations. Computations moreover allowed to acquire information on the three-dimensional velocity and pressure field that develops inside the Wells turbine. The aim was to have an insight on the secondary motions and on the possible stall mechanism that characterize the device at low flow rates. Results were successfully validated against experimental measures.
NOMENCLATURE latin Ct torque coefficient [-] Hm averaged sea-wave height [m] k turbulent kinetic energy [m2/s2] Pm mechanical power [W] Q volume flow rate [m3/s] T torque [Nm] Tm averaged sea-wave period [s] Z number of blades [-]
greek ptot total pressure drop [Pa] dissipation of k [m3/s2] efficiency Pm·Q∙ptot) = [-] molecular viscosity [m2/s] eddy viscosity [m2/s] flow coefficient [-] angular velocity [1/s]
INTRODUCTION Since the subscription of Tokyo Protocol the struggle against global warming has been a priority of the EU energy plan, that reserved a considerable amount of founds on research and development on Renewable Energy Sources (RES). Among RES, the wave energy production technologies had a great boost during the last thirty years, even if their potential has not been fully exploited so far. In fact Thorpe (1999) estimated a 2 TW/year power capacity over the total sea extension. Clement et al. (2002) estimated an energy density between 20 and 70 kW/m for the most favorable wave climates, and a more uniform daytime availability if compared to the solar radiation. According to Corsini and Rispoli (2006) wave energy has an estimated potential of 320 GW for EU, with 30 GW localized in the Mediterranean Sea. Among the number of wave energy converters, the Oscillating Water Column (OWC) can be considered as the on-shore technology closest to maturity. In fact OWCs already reached the stage of full-scale prototypes, with several pilot plants presently on-duty around the world, see e.g. Whittaker et al. (1993), Heath et al. (2000), Falcao et al. (2002) and White (1989).
Proceedings of
11th European Conference on Turbomachinery Fluid dynamics & Thermodynamics
ETC11, March 23-27, 2015, Madrid, Spain
OPEN ACCESS
Downloaded from www.euroturbo.eu Copyright © by the Authors

2
All these prototypes operate with oceanic waves, characterized by wave heights and periods different from the ones peculiar of the Mediterranean Sea. OWC devices to be installed in the Mediterranean shores need to be re-designed according to different operating conditions as the wave energy features an extremely high dependency on space (such as sea bathymetry and sea-swell direction) and time parameters. As a consequence, to identify the best location to deploy a wave energy farm, an accurate wave energy potential study is needed, as pointed out in Corsini et al. (2010). An OWC device has a partly submerged chamber, opened below the water surface. In the upper part air is trapped above the free surface of the water inside a column. As the incident wave induces an oscillating motion of the free surface, wave energy is converted into low-pressure pneumatic energy by a continuous cycle of compression and expansion of the air in the chamber, Malara and Arena 2013. OWCs are usually coupled with Wells turbines, see Raghunathan (1995), that, being characterised by symmetric rotor profiles and zero pitch, are able to work with bi-directional flows in self-rectifying operations. To summarise, a Wells turbine is subjected during its operations to an oscillating mass flow rate, which varies between zero and a maximum value. Moreover, the variability of the operating conditions is further amplified because of the extremely large variations of the sea conditions, that in Mediterranean operations are even more severe than in the ocean. In fact at low specific energy levels the Wells turbine operations become critic at both low and high flow rates, respectively because of negative output and onset on stall on the blades. In the framework of Poseidone Project (Italian Ministry of Environment) we have designed an Oscillating Water Column (OWC) device able to exploit the wave energy available in the Mediterranean Sea through a Wells turbine, Corsini et al., 2012. In the following we describe the features of a prototype turbine for Mediterranean operations, with a nominal power rating of 1.5 kW. This prototype was built and tested on a static test rig according to ISO normative, aiming at characterizing its operating conditions. Numerical investigations presented in the following aim at assess the capability of the numerical test rig in predicting the operating conditions of the turbine and to acquire information on the three dimensional velocity and pressure field that develops inside the Wells turbine device.
WELLS TURBINE FOR MEDITERRANEAN OPERATIONS
Figure 1. 3D (left) and side (right) views of the DIMAFP-TW1.5 – Courtesy of Faggiolati Pumps S.p.A.
In the present work we will focus on a Wells turbine prototype for Mediterranean operations, labelled as DIMAFP-TW1.5, Figure 1. The turbine was designed to operate in Mediterranean conditions, with an average wave height of 0.8m and an average period of 4s (Bassetti et al., 2012) and are summarized in Table 1. Design power is 1.5 kW at 3000 rpm. The rotor of the turbine has a NACA0015 profile with a total 9 runner blades. As the flow is bi-directional, stator blades are placed up- and down-
stators
rotor

3
stream of the rotor with 17 blades for each row, to align the incoming flow field with the rotor during operations. These data are summarized in Table 2. A full-scale prototype was tested in laboratory in steady state operations, using a centrifugal fan to drive the air to the turbine. The characteristic curves measured at 8 different volume flow rates according ISO standards are shown in Figure 2.
Table 1. Design sea conditions, Bassetti et al., 2012 Table 2. DIMAFP-TW1.5 design data
power density 2 kW/m Hm 0.8 m Tm 4 s
design power 1.5 kW 3000 rpm
rotor profile NACA0015 Zrot 9 Zstat 17 x 2 rows
Figure 2. Measured characteristic curves of torque coefficient and efficiency of the DIMAFP-TW1.5
NUMERICAL METHODOLOGY The numerical computations here presented were carried out using the open-source OpenFOAM library (Weller et al., 1998). In particular, the incompressible Navier-Stokes equations were solved using RANS closure. Turbulence closure relied on the high-Reynolds non-linear formulation of the k- model of Lien and Leschziner (1994). This model was chosen as cubic expansion of the dependency of eddy viscosity from rate-of-strain tensor was proven able to partially account for the anisotropy of the Reynolds stresses, improving results with respect to linear formulations in flows characterized by impinging, curvature of the streamlines, boundary layer development on curved surfaces, rotational flows and thus turbomachinery flows. A summary of the capability of the model and its capability to correctly predict three-dimensional features in turbomachinery flows is given in Corsini et al., 2013, Chen et al., 1998. In particular for these computations the classic formulation of the k- model based on the simple Boussinesq assumption (not discussed here) was able to predict correctly the total pressure drop in the turbine, yet was completely unable to predict the torque of the turbine, resulting in a 70% underestimation of the values. Coupling of rotor with the two stator rows was handled with frozen rotor approach, so that the solution is achieved in steady-state, without moving mesh techniques, but handling different frames of references by adding Coriolis and centrifugal forces in the rotor region of the domain. Frozen rotor approximation of course introduce a drastic exemplification of the rotor-stator interaction, but are

4
here considered as the cost-effective approach to evaluate the capability of the model in predicting the torque and efficiency of the device, also considering the ISO operating conditions that do not account for an oscillating flow rate. Moreover the combination of solidity (0.6), hub to tip ratio (0.75) and low expansion coefficient of the turbine mitigate the non-physical reproduction of wake released from a row and interacting with the following one. The linear system of equations was solved using conjugate gradient solver for pressure and Gauss-Seidel linear equation solver for momentum, k and equations, setting the tolerance to 10-8. The convective terms were discretized using QUICK scheme. The computational domain entailed the whole turbine and counted about 14.2M hexahedral cells, 3.8M in the rotor, and 5.2M in each stator row. Mass flow rate was set at the inflow, no-slip conditions were used on the solid surfaces with wall functions for k and , and convective condition was used at the outflow of the domain. As all the computations were run in steady-state at fixed flow rate, in the following the stator row upstream of the rotor will be labelled as IGV and the one downstream as OGV, even if in normal operations the flow rate changes direction. Four different operating points were simulated, Table 3. The design process of the turbine was based on the hypothesis of a sinusoidal wave pattern corresponding to a pulsating flow rate. The points correspond to design flow rate (DP), half of the design flow rate (HP), the effective value of the sinusoid used for design (EP), and the flow rate at which the torque of the turbine changes sign (IP).
Table 3. Operating points scrutinized with numerical computations, labels are used throughout the text.
operating points Q [m3/s] Ubulk [m/s] IP 0.17 1.44 HP 0.42 3.60 EP 0.60 5.09 DP 0.85 7.20
RESULTS Validation Numerical data are validated against available measurements shown in a summary in Table 4. Total pressure drop inside the turbine is predicted with a 1% accuracy, efficiency values are within a 6% accuracy, proving the effectiveness of the overall numerical strategy. The higher discrepancies occur at IP, as the blade stalls. This can be explained by the increase in three-dimensional and multi-scale features of the flow that can hardly be reproduced even by an advanced RANS closure.
Table 4. Total pressure drop and efficiency of DIMAFP-TW1.5 at four computed duty points. Exp values are interpolated from measurements shown in Figure 2
Q [m3/s] Ptot [Pa] [%] [Nm] CFD EXP CFD EXP CFD EXPIP 0.17 476 476 - 3% 9% -6% 0.2 0.16 HP 0.42 1180 1187 -1% 36% 38% -2% 1 1 EP 0.60 1691 1706 -1% 66% 63% +3% 2.2 2 DP 0.85 2333 2363 -1% 64% 68% -4% 3.8 4
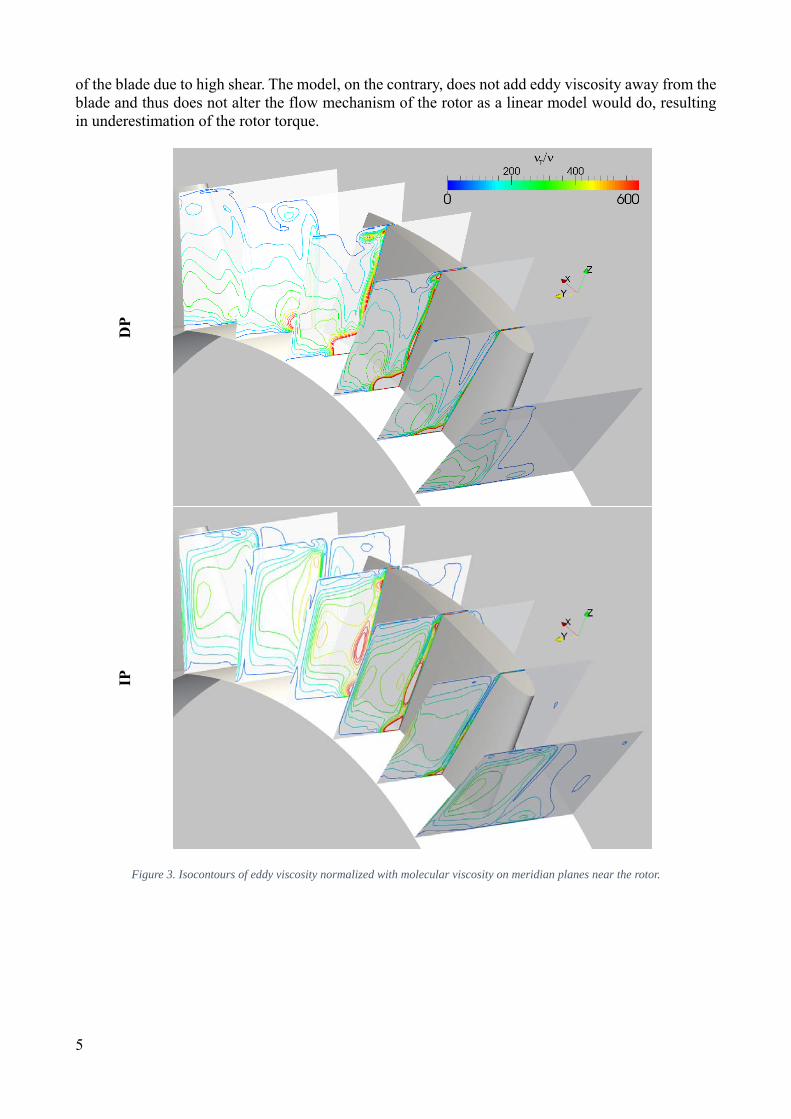
Rotor flow survey As pointed out the use of a non-linear eddy viscosity model allowed for credible computation of the aerodynamic forces on the rotor blades. In Figure 3 the distribution of eddy viscosity is shown for DP and IP. In particular the regions where the model controls the eddy viscosity are those of tip-leakage vortex at DP and hub separation; the same occurs at midspan onto the suction surface and at the tip
5
of the blade due to high shear. The model, on the contrary, does not add eddy viscosity away from the blade and thus does not alter the flow mechanism of the rotor as a linear model would do, resulting in underestimation of the rotor torque.
DP
IP
Figure 3. Isocontours of eddy viscosity normalized with molecular viscosity on meridian planes near the rotor.

6
DP
EP
IP
Figure 4. Velocity contours over meridian planes at three different operating points.
In Figure 4 isocontours of velocity magnitude are shown on different meridional planes in the rotor. At DP the trace of the tip leakage is recognizable at about 1/3 of the blade span. At the trailing edge

7
of the blade the vortex is convected away from the blade and result in a blockage of the flow in the adjacent row. At EP the vortex is weaker and leaks onto the suction surface slightly downstream, evolving in a slower motion and diminishing its blockage effect onto the adjacent blade vane. The slower motion and the reduced flow rate results in the trace of the vortex from the previous blade being still visible in the local view. Finally at IP the vortex is hardly recognizable due to the very small pressure difference between pressure and suction side. In Figure 5 the pressure distribution on the rotor is shown at DP, EP and IP operations. As the flow rate reduces from DP to IP the low-pressure core on the pressure surface moves from the trailing edge towards the leading edge. Conspicuously on the suction surface isolines of pressure that at DP are mostly parallel to the blade leading edge deform as the low-pressure region at the tip of the blade diminish at EP and completely collapse at IP.
DP EP IP
pressure side
suction side
Figure 5. Pressure distribution on the rotor at three operating points. Top: pressure side, bottom: suction side.
LP label highlights a low-pressure core at the tip of the blade pressure side.
LP
LPLP

8
Turbine flow survey
DP
E
P
IP
Figure 6. Absolute velocity streamlines at 3 different immersions. Left: 5% of the span; centre: midspan; right: 95% of the span.
In Figure 6 streamlines at three different spanwise immersions (5%, 50% and 95% of the blade span) are shown for three duty points. At design point (DP) the flow is aligned with the rotor and at the tip
Axi
al d
irec
tion
Peripheral direction
IGV
OGV

9
results in a high velocity tip leakage vortex that is convected towards the adjacent blade and partially blocks the blade-to-blade passage. The stator row acting as OGV is not aligned with the flow incoming from the rotor and therefore separation occurs. At EP the main difference is in the smaller extension of the tip leakage vortex, resulting in a weaker blockage of the adjacent vane. At IP finally the flow is separated along the blade span resulting in multiple separations in the rotor and the OGV as well. The most of the momentum transfer from the fluid to the turbine is localized at the tip. As seen in Figure 4 and Figure 6 the tip leakage at DP is characterized by high velocity and develops staying attached to the suction surface and blocks the flow in the following blade vane and delays the leakage of flows from the following blade. The reduction of flow rate to EP results in this blockage effect to be weakened and in slower development of the vortex, that also results to be convected away from the suction surface. Decrease of flow rate results in a lower momentum exchange because of further weakening of the tip vortex.
CONCLUSIONS In this paper we presented a numerical investigation of the flow field in a Wells turbine for
Mediterranean operations, computed at 4 different duty points with frozen rotor coupling of the 9 blades rotor with 2 rows of 17 blades stators. Results in terms of total pressure drop, torque and efficiency measured in steady state operations confirmed that this methodology was able to reproduce experimental data within the accuracy of the measurements.
Computations confirmed that most of the tip of the rotor blade is responsible for most of the momentum exchange with the fluid and that this is regulated by how the tip leakage vortex evolves inside the blade vane. In particular the higher the flow rate, the faster and more attached remains the vortex, blocking the blade vane and increasing the exchange of momentum. As the flow rate diminish, the vane is not blocked anymore and the deviation capability of the rotor is reduced.
Even if frozen rotor approach is not able to correctly account for mixing of the wakes released by the rotor blades, it was shown that the stator row that acts as OGV causes separation of the flow at discharge at all the computed operations increasing the overall losses of the device.
Finally the peculiar setup of the turbine, with 90 deg stagger of the rotor, resulted in a highly three-dimensional flow field that required an advanced RANS closure to correctly predict the torque on the rotor blade.
ACKNOWLEDGEMENTS This work was financed by the Italian Ministry of Environment under Poseidone Project. The
authors would like to acknowledge Faggiolati Pumps for building the DIMAFP-TW1.5 device and Mr. Giovanni Faggiolati for the kind support during the realization of this project.
REFERENCES M. Bassetti, A. Corsini, F. Rispoli, E. Marro, E. Tortora, E. Tuccimei, Modelling and transient
simulation of an OWC wave energy converters tailored to the Mediterranean shore-line, Fourth International Symposium “Monitoring of Mediterranean coastal areas problems and measurements techniques”, June 12-14, 2012, Livorno, Italy.
W. L. Chen, F. S. Lien, and M. A. Leschziner, “Computational prediction of flow around highly loaded compressor-cascade blades with non-linear eddy-viscosity models,” International Journal of Heat and Fluid Flow, vol. 19, no. 4, pp. 307–319, 1998.
Clement et al., 2002, Wave energy in Europe: current status and perspectives, Renewable and Sustainable Energy Reviews, 2002, pp.405-431.
Corsini and F. Rispoli, 2006, Modeling of wave energy conversion with an Oscillating Water Column device, Proceedings of 6th European Seminar OWEMES, Brindisi, Italy.

10
Corsini, A., Rispoli, F. and T. E. Tezduyar, 2012, Computer Modeling of Wave-Energy Air Turbines With the SUPG/PSPG Formulation and Discontinuity-Capturing Technique. J. Appl. Mech., vol. 79, Issue 1, 010910.
Corsini, A., Delibra, G. & Sheard, A.G. (2013), A Critical Review of Computational Methods and Their Application in Industrial Fan Design. International Scholarly Research Network, Mechanical Engineering, vol. 2013, Article ID 625175, pp. 1-20.
Corsini, E. Marro, F. Rispoli, E. Tortora, 2010, Space-time mapping of wave Energy conversion potential in Mediterranean Sea states. Proc. ASME-ATI-UIT Conference on Thermal and Enviromental Issues in Energy Systems. 2010.
A.F. de O. Falcão, R.J.A.Rodriguez, 2002, Stochastic modelling of OWC wave power plant performance, Applied Ocean Research 2002, pp.59-71.
T Heath , TJT Whittaker, CB Boake, 2000, The design, construction and operation of the LIMPET wave energy converter (Islay, Scotland), Proceeding 4th European Wave Power Conference, Aalborg, Denmark, paper B2
Lien, F.S. and Leschziner, M.A., 1994, Assessment of Turbulence-transport Models Including Non-linear RNG Eddy-viscosity Formulation and Second-moment Closure for Flow over a Backward-facing Step, Computers & Fluids, vol. 23, pp. 983-1004.
Malara G. and Arena F, 2013, Analytical modelling of an U-Oscillating Water Column and performance in random waves, Renewable Energy, Volume 60, December 2013, Pages 116-126
S. Raghunathan, 1995, The Wells air turbine for wave energy conversion. Prog. Aerospace Sci. vol. 31, pp. 335-386. 1995.
T. W. Thorpe, 1999, A brief review of wave energy, Report ETSU-R-120 for DTI, AEA Technology.
H. G. Weller, G. Tabor, H. Jasak and C. Fureby, 1998, A tensorial approach to continuum mechanics using objectoriented techniques, Computers in Physics, vol. 12, pp. 620–631.
P. White, 1989, Developments in Norwegian Wave Energy, Proceedings of a Conference on Wave Energy Devices, Coventry, UK, 1989.
TJT Whittaker, SJ McIlwaine, R Raghunathan, 1993, A review of the Islay shoreline wave power plant, Proceedings of European Wave Energy Symposium, Edinburgh.