Design and Status of the VISA II Experiment...
1
Design and Status of the VISA II Experiment G. Andonian, R. Agustsson, A.Murokh, C.Pellegrini, S.Reiche, J.B.Rosenzweig, G.Travish, UCLA I. Ben-Zvi, V. Yakimenko, BNL L.Palumbo, C. Vicario, INFN Abstract VISA II is a follow-up venture to the succesful Visible to Infrared SASE Amplifier (VISA) experiment. This is a collaborative effort headed by UCLA and the ATF (Accelerator Test Facility) at BNL. There are two main experiments associated with the VISA II program. The first is the study of strong bunch compression, via a chicane compressor, and deep saturation investigations. The next undertaking is the study of the physics of a chirped-beam SASE-FEL, where a linear energy chirp is imparted on the beam and injected into the undulator. The VISA II program encompasses a number of hardware upgrades at the ATF, including the installation of the chicane compressor and addition of sextupole magnets to mitigate second order effects. More information can be found at http://pbpl.physics.ucla.edu/visa PBPL Particle Beam Physics Lab Compressed Bunch Overview Chirped Beam Overview SASE-FEL Experimental Program 0 1 2 3 10 -2 10 0 10 2 10 4 E [nJ] a) Energy Evolution z [m] 600 650 700 750 800 l [nm] 0.00 0.05 0.10 0.15 0.20 0.25 0.30 P( ) [a.u.] l c) Saturation Spectrum 0.00 0.05 0.10 0.15 0.20 0.25 0.30 t [ps] 0.00 0.05 0.10 0.15 0.20 0.25 0.30 P [GW] b) Power Profile at Saturation Summary of Simulations Beamline Description a) Saturation is evident at about 3m, well before the end of the undulator, allowing for deep saturation studies. b)Slippage plays an important role in the compressed bunch case. Current is represented by the dashed curve. c)The FEL Spectrum is peaked at about 685 nm. The follwoing plots were generated by GENESIS 1.3, a 3-D FEL Code Summary of Simulations 350 360 370 380 390 f [THz] 0 2 4 6 8 10 12 P [a.u.] 350 360 370 380 390 f [THz] 0 2 4 6 8 10 12 P [a.u.] 350 360 370 380 390 f [THz] 0 2 4 6 8 P [a.u.] 350 360 370 380 390 f [THz] 0 1 2 3 4 5 6 P [a.u.] 0% Chirp 0.5% Chirp 2% Chirp 4% Chirp Theoretical Studies on the spectral response of an initially chirped electron beam. Simulations show that total energy at saturation is not affected by chirping up to 4% (no gain degradation). It is necessary to go to 2% chirp to overcome the intrinsic frequency width of the FEL amplification in order to achieve a correlation between frequency and time. An ideal case for FROG measurement. Current Profile Radiation Power
-
Upload
trinhhuong -
Category
Documents
-
view
219 -
download
0
Transcript of Design and Status of the VISA II Experiment...
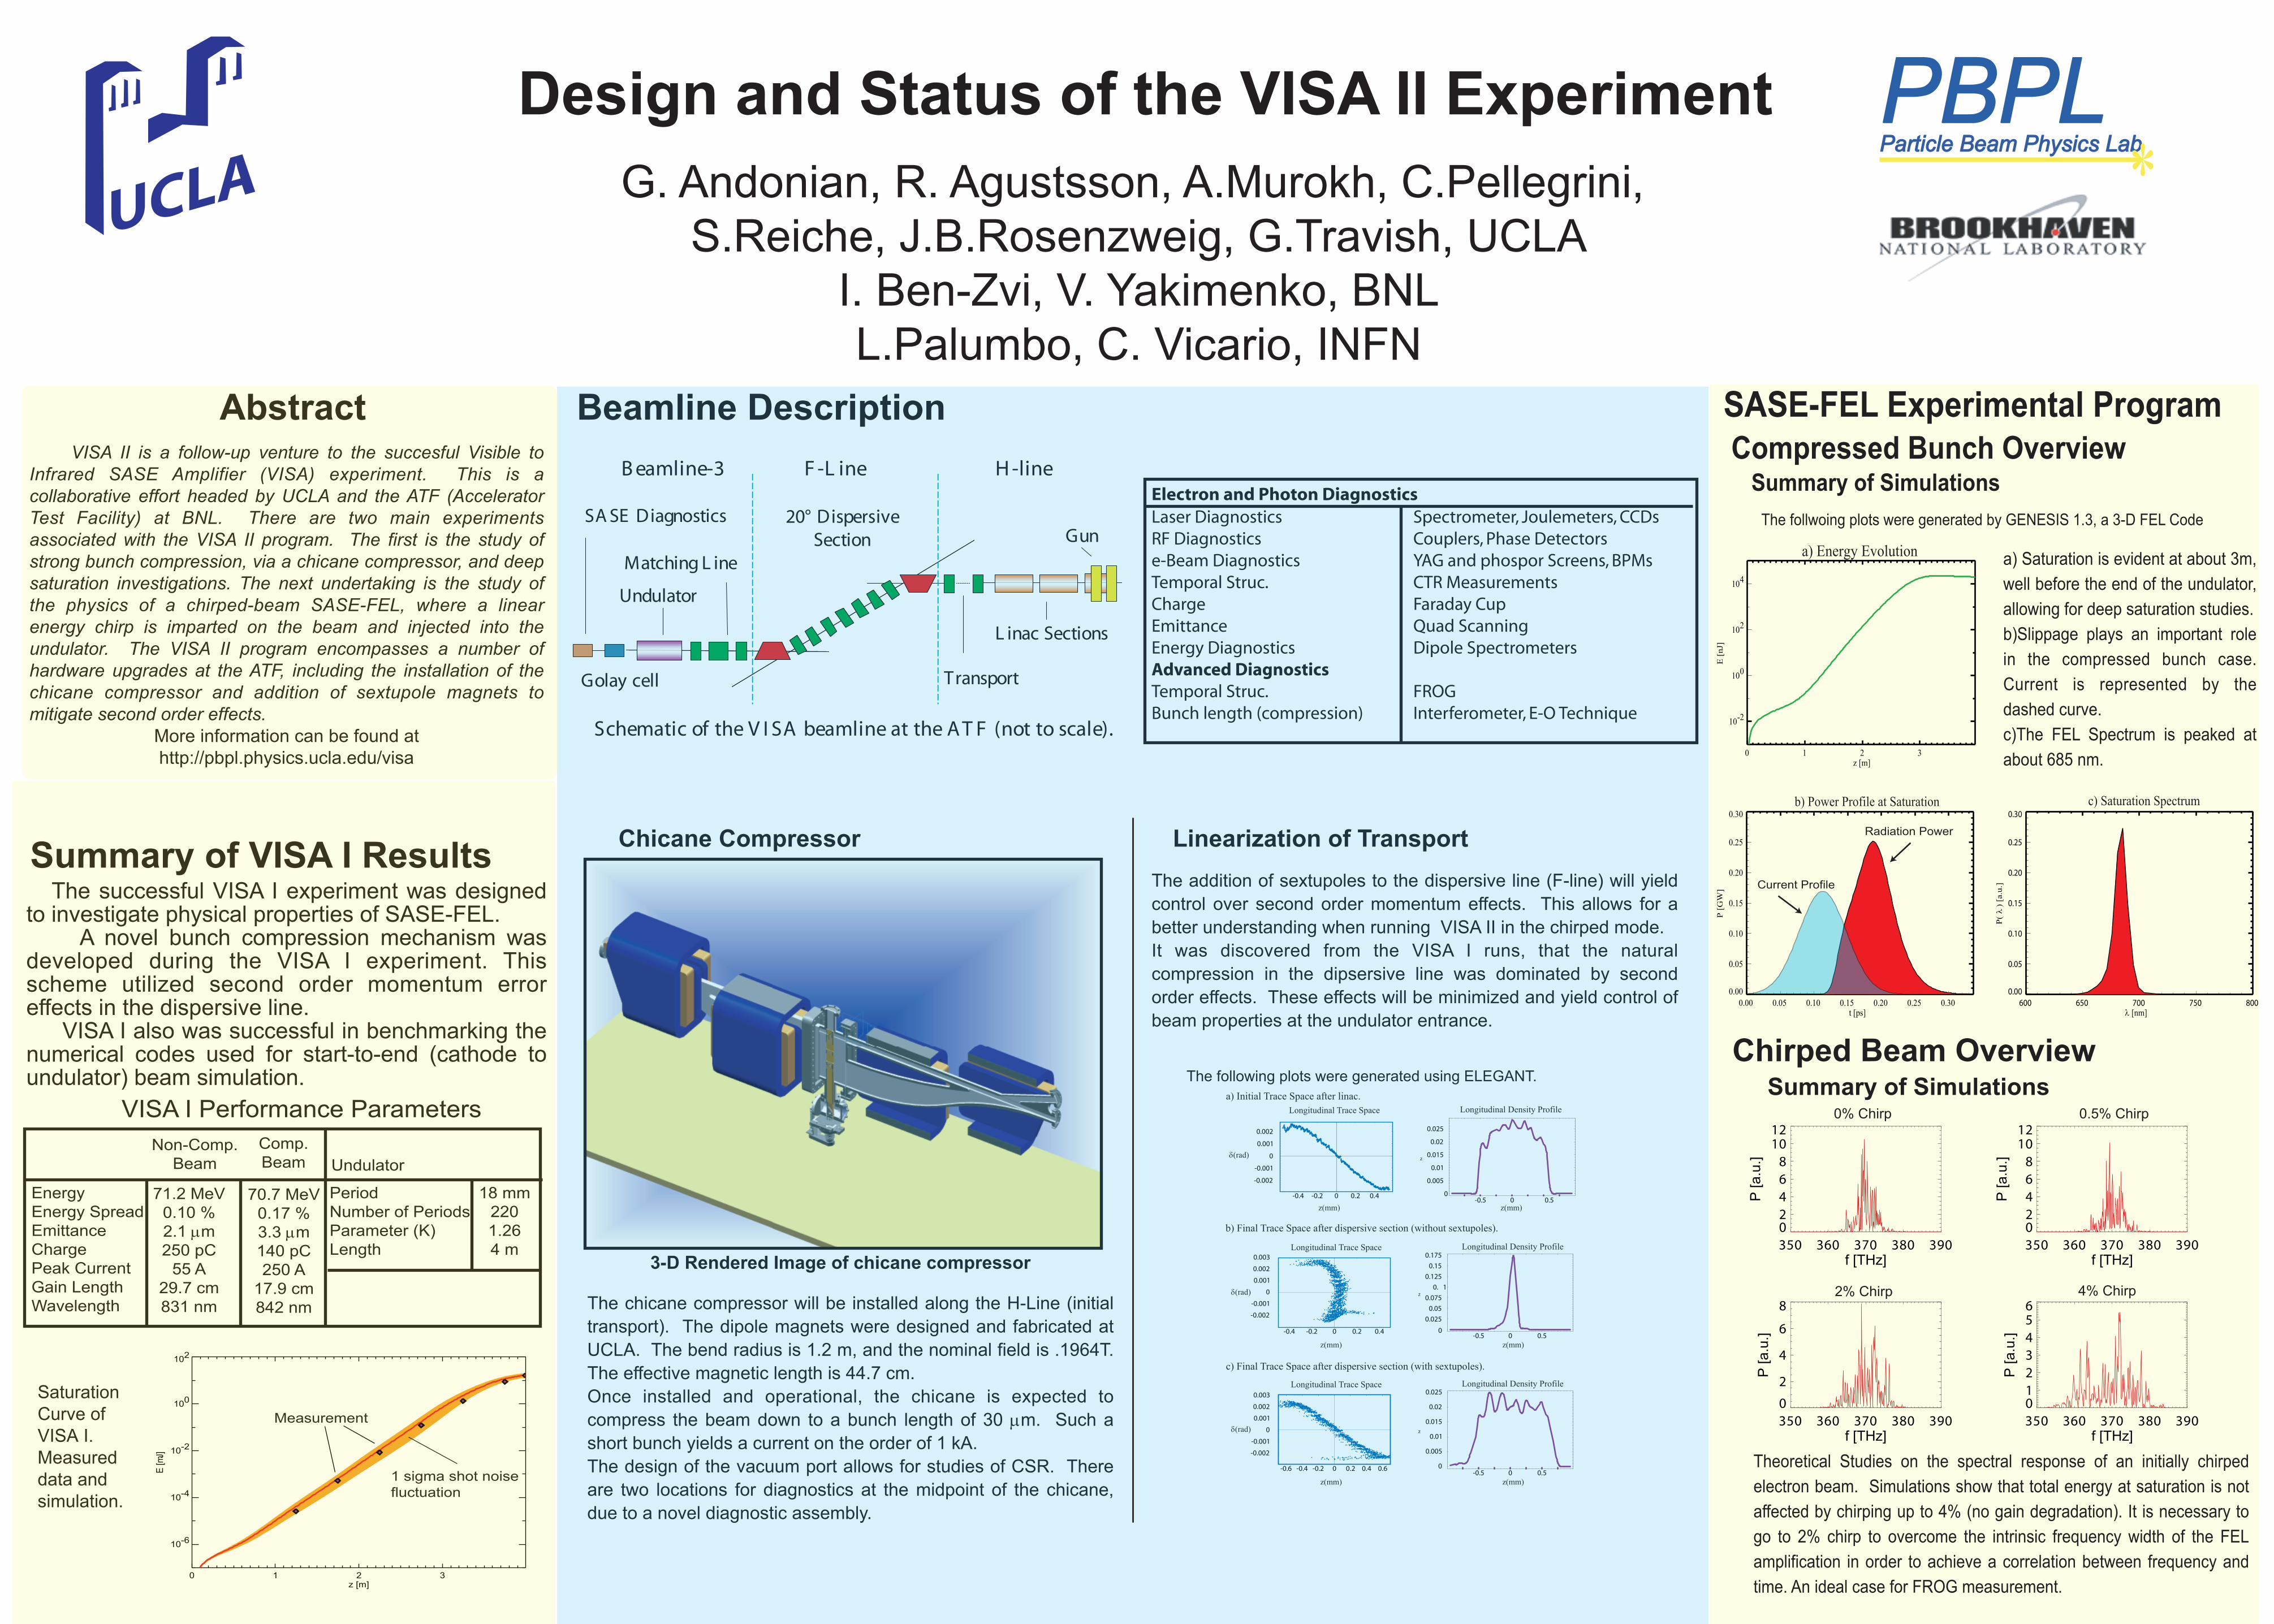
Design and Status of the VISA II ExperimentG. Andonian, R. Agustsson, A.Murokh, C.Pellegrini,
S.Reiche, J.B.Rosenzweig, G.Travish, UCLAI. Ben-Zvi, V. Yakimenko, BNLL.Palumbo, C. Vicario, INFN
Abstract VISA II is a follow-up venture to the succesful Visible to Infrared SASE Amplifier (VISA) experiment. This is a collaborative effort headed by UCLA and the ATF (Accelerator Test Facility) at BNL. There are two main experiments associated with the VISA II program. The first is the study of strong bunch compression, via a chicane compressor, and deep saturation investigations. The next undertaking is the study of the physics of a chirped-beam SASE-FEL, where a linear energy chirp is imparted on the beam and injected into the undulator. The VISA II program encompasses a number of hardware upgrades at the ATF, including the installation of the chicane compressor and addition of sextupole magnets to mitigate second order effects.
More information can be found athttp://pbpl.physics.ucla.edu/visa
PBPLParticle Beam Physics Lab
L inac Sections
Gun
Transport
20° DispersiveSection
Matching L ine
Undulator
Golay cell
SA SE Diagnostics
F -L ineB eamline-3 H -line
Schematic of the V I SA beamline at the A T F (not to scale).
Compressed Bunch Overview
Chirped Beam Overview
SASE-FEL Experimental Program
0 1 2 3
10-2
100
102
104
E [
nJ]
a) Energy Evolution
z [m]
600 650 700 750 800λ [nm]
0.00
0.05
0.10
0.15
0.20
0.25
0.30
P()
[a.u
.]
λ
c) Saturation Spectrum
0.00 0.05 0.10 0.15 0.20 0.25 0.30t [ps]
0.00
0.05
0.10
0.15
0.20
0.25
0.30
P [G
W]
b) Power Profile at Saturation
Summary of Simulations
Summary of VISA I Results
Beamline Description
a) Saturation is evident at about 3m, well before the end of the undulator, allowing for deep saturation studies.b)Slippage plays an important role in the compressed bunch case. Current is represented by the dashed curve.c)The FEL Spectrum is peaked at about 685 nm.
The follwoing plots were generated by GENESIS 1.3, a 3-D FEL Code
Linearization of Transport
-0.4 -0.2 0 0.2 0.4
-0.002
-0.001
0
0.001
0.002
-0.5 0 0.50
0.005
0.01
0.015
0.02
0.025
�zδ(rad)
Longitudinal Trace Space
z(mm) z(mm)
Longitudinal Density Profile
-0.6 -0.4 -0.2 0 0.2 0.4 0.6
-0.002
-0.001
0
0.001
0.002
0.003
-0.5 0 0.50
0.005
0.01
0.015
0.02
0.025
�zδ(rad)
Longitudinal Trace Space
z(mm) z(mm)
Longitudinal Density Profile
-0.4 -0.2 0 0.2 0.4
-0.002
-0.001
0
0.001
0.002
0.003
-0.5 0 0.50
0.025
0.05
0.075
0. 1
0.125
0.15
0.175
�zδ(rad)
Longitudinal Trace Space
z(mm) z(mm)
Longitudinal Density Profile
a) Initial Trace Space after linac.
b) Final Trace Space after dispersive section (without sextupoles).
c) Final Trace Space after dispersive section (with sextupoles).
The addition of sextupoles to the dispersive line (F-line) will yield control over second order momentum effects. This allows for a better understanding when running VISA II in the chirped mode.It was discovered from the VISA I runs, that the natural compression in the dipsersive line was dominated by second order effects. These effects will be minimized and yield control of beam properties at the undulator entrance.
The following plots were generated using ELEGANT. Summary of Simulations
Electron and Photon DiagnosticsLaser DiagnosticsRF Diagnosticse-Beam DiagnosticsTemporal Struc.ChargeEmittance Energy DiagnosticsAdvanced DiagnosticsTemporal Struc.Bunch length (compression)
Spectrometer, Joulemeters, CCDsCouplers, Phase DetectorsYAG and phospor Screens, BPMsCTR MeasurementsFaraday Cup Quad ScanningDipole Spectrometers
FROGInterferometer, E-O Technique
The successful VISA I experiment was designed to investigate physical properties of SASE-FEL. A novel bunch compression mechanism was developed during the VISA I experiment. This scheme utilized second order momentum error effects in the dispersive line. VISA I also was successful in benchmarking the numerical codes used for start-to-end (cathode to undulator) beam simulation.
350 360 370 380 390f [THz]
02468
1012
P [a
.u.]
350 360 370 380 390f [THz]
02468
1012
P [a
.u.]
350 360 370 380 390f [THz]
0
2
4
6
8
P [a
.u.]
350 360 370 380 390f [THz]
0123456
P [a
.u.]
0% Chirp 0.5% Chirp
2% Chirp 4% Chirp
Theoretical Studies on the spectral response of an initially chirped electron beam. Simulations show that total energy at saturation is not affected by chirping up to 4% (no gain degradation). It is necessary to go to 2% chirp to overcome the intrinsic frequency width of the FEL amplification in order to achieve a correlation between frequency and time. An ideal case for FROG measurement.
0 1 2 3z [m]
10-6
10-4
10-2
100
102
E [m
J]
Measurement
1 sigma shot noise fluctuation
VISA I Performance Parameters
EnergyEnergy SpreadEmittanceChargePeak CurrentGain LengthWavelength
70.7 MeV0.17 %3.3 µm140 pC250 A
17.9 cm842 nm
PeriodNumber of PeriodsParameter (K)Length
18 mm2201.264 m
Comp.Beam Undulator
71.2 MeV0.10 %2.1 µm250 pC
55 A29.7 cm831 nm
Non-Comp.Beam
Saturation Curve of VISA I.Measured data and simulation.
3-D Rendered Image of chicane compressor
Chicane Compressor
The chicane compressor will be installed along the H-Line (initial transport). The dipole magnets were designed and fabricated at UCLA. The bend radius is 1.2 m, and the nominal field is .1964T. The effective magnetic length is 44.7 cm.Once installed and operational, the chicane is expected to compress the beam down to a bunch length of 30 µm. Such a short bunch yields a current on the order of 1 kA. The design of the vacuum port allows for studies of CSR. There are two locations for diagnostics at the midpoint of the chicane, due to a novel diagnostic assembly.
Current Profile
Radiation Power