DESIGN AND SIMULATION OF LITHIUM- ION BATTERY … · DESIGN AND SIMULATION OF LITHIUM-ION BATTERY...
20
DESIGN AND SIMULATION OF LITHIUM- ION BATTERY THERMAL MANAGEMENT SYSTEM FOR MILD HYBRID VEHICLE APPLICATION Ahmed Imtiaz Uddin, Jerry Ku, Wayne State University
Transcript of DESIGN AND SIMULATION OF LITHIUM- ION BATTERY … · DESIGN AND SIMULATION OF LITHIUM-ION BATTERY...
DESIGN AND SIMULATION OF LITHIUM-ION BATTERY THERMAL MANAGEMENT SYSTEM FOR MILD HYBRID VEHICLE APPLICATIONAhmed Imtiaz Uddin, Jerry Ku, Wayne State University

SAE INTERNATIONAL
Introduction
Model development
– Modeling Electrical behavior
– Modeling Thermal behavior
Thermal management system design
Assumptions and boundary condition
HEV vehicle driveline modeling
Results and discussions
Conclusion
Future recommendations
Acknowledgement
Outline
Paper # (if applicable) 2

SAE INTERNATIONAL
Introduction
Primary objectives of battery thermal management system
(1) Limit cell temperatures below allowable maximum operating temperature,
(2) Minimize cell temperature gradient, and
(3) Maintain cell temperatures within the operating range for optimum performance and
longevity of the battery pack.
An air cooled Power Pack Unit (PPU) comprised of 12 series connected
lithium-ion battery cells has been analyzed for a mild hybrid electric vehicle
(HEV) application.
Coupled electro-thermal modeling approach has been adopted to simulated
detailed temperature distribution within the battery module and optimize air flow
requirements to ensure the minimum temperature gradient.
Paper # 2015-01-1230 3
SAE INTERNATIONAL
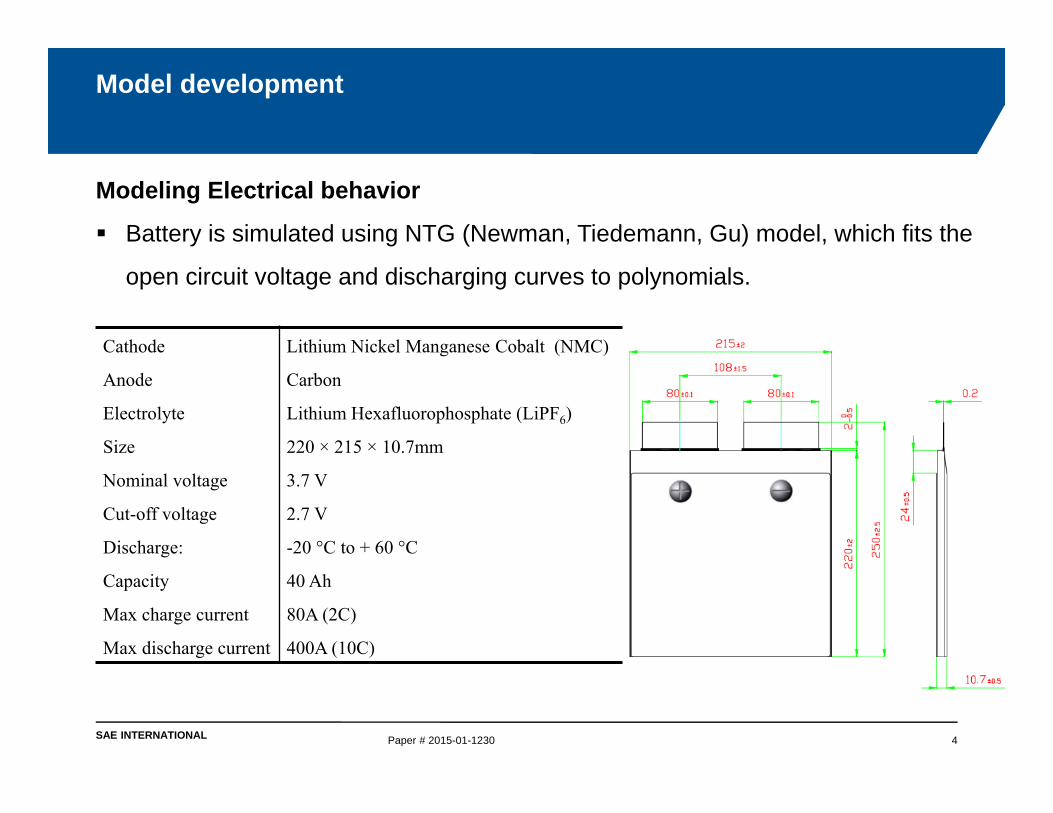
Modeling Electrical behavior
Battery is simulated using NTG (Newman, Tiedemann, Gu) model, which fits the
open circuit voltage and discharging curves to polynomials.
Model development
Paper # 2015-01-1230 4
Cathode Lithium Nickel Manganese Cobalt (NMC)
Anode Carbon
Electrolyte Lithium Hexafluorophosphate (LiPF6)
Size 220 × 215 × 10.7mm
Nominal voltage 3.7 V
Cut-off voltage 2.7 V
Discharge: -20 °C to + 60 °C
Capacity 40 Ah
Max charge current 80A (2C)
Max discharge current 400A (10C)
SAE INTERNATIONAL
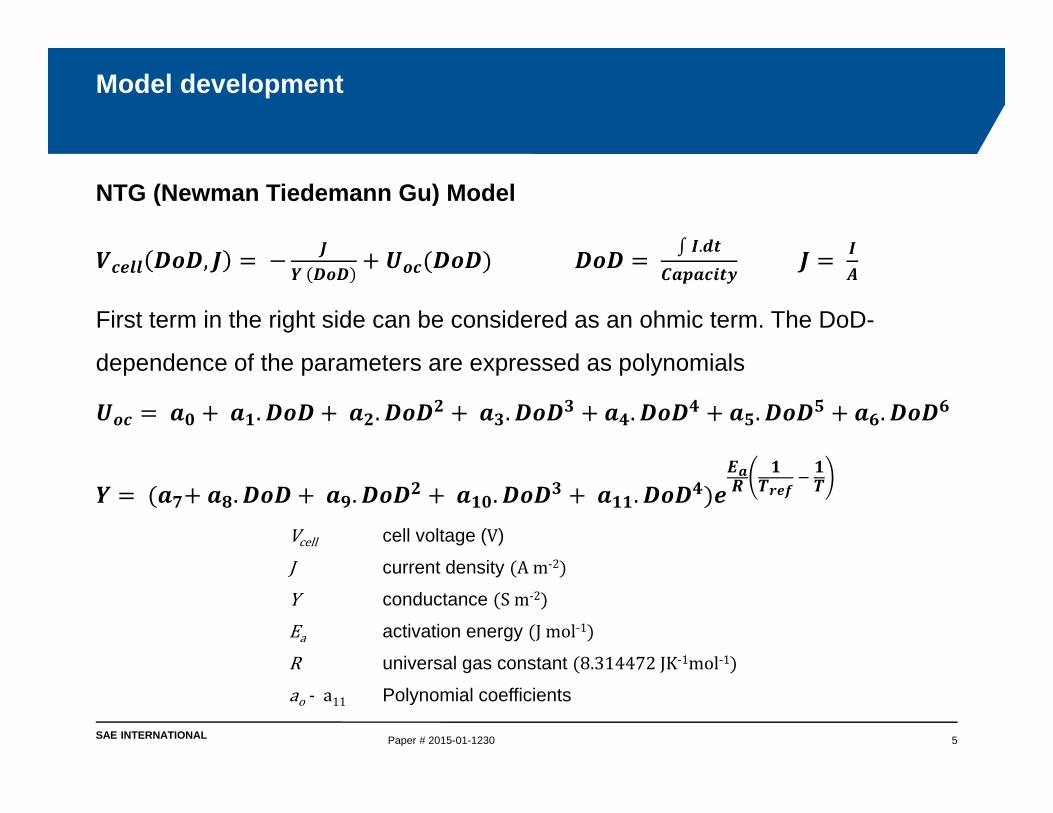
NTG (Newman Tiedemann Gu) Model
,
.
First term in the right side can be considered as an ohmic term. The DoD-
dependence of the parameters are expressed as polynomials
. . . . . .
. . . .
Model development
Paper # 2015-01-1230 5
Vcell cell voltage (V)
J current density Am‐2
Y conductance Sm‐2
Ea activation energy Jmol‐1
R universal gas constant 8.314472JK‐1mol‐1
ao ‐ a11 Polynomial coefficients
SAE INTERNATIONAL
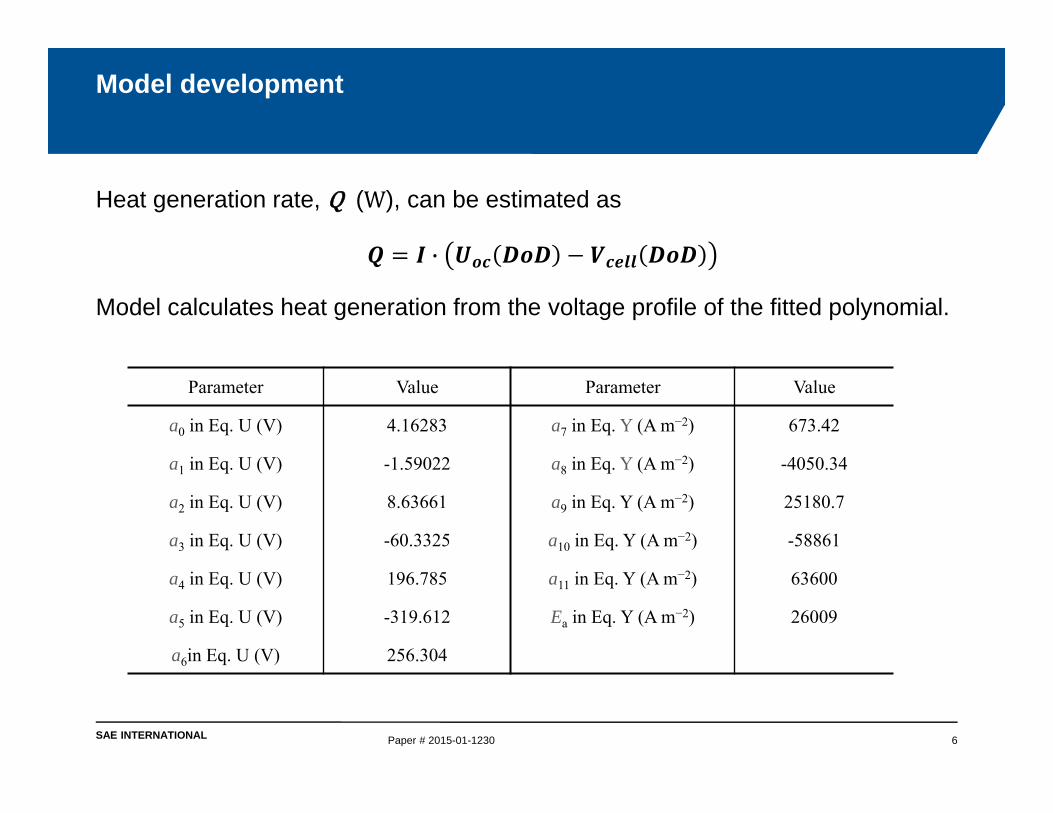
Heat generation rate, Q (W), can be estimated as
·
Model calculates heat generation from the voltage profile of the fitted polynomial.
Model development
Paper # 2015-01-1230 6
Parameter Value Parameter Value
a0 in Eq. U (V) 4.16283 a7 in Eq. Y (A m−2) 673.42
a1 in Eq. U (V) -1.59022 a8 in Eq. Y (A m−2) -4050.34
a2 in Eq. U (V) 8.63661 a9 in Eq. Y (A m−2) 25180.7
a3 in Eq. U (V) -60.3325 a10 in Eq. Y (A m−2) -58861
a4 in Eq. U (V) 196.785 a11 in Eq. Y (A m−2) 63600
a5 in Eq. U (V) -319.612 Ea in Eq. Y (A m−2) 26009
a6in Eq. U (V) 256.304
SAE INTERNATIONAL
Modeling Thermal behavior
Battery modeling process involves running electrical and thermal solvers
sequentially for each thermal time step, starting with the electrical solver.
Electrical solver calculates electrical voltage and heat generation on a grid
based on the fitted polynomial coefficients.
Thermal solver takes the internal heat generation values, calculate the
temperature field and outputs the local temperature for each thermal grid cell.
Communication between the electrical and thermal solutions is done using
internal mapping between the electrical mesh and the thermal mesh.
Model development
Paper # 2015-01-1230 7
SAE INTERNATIONAL
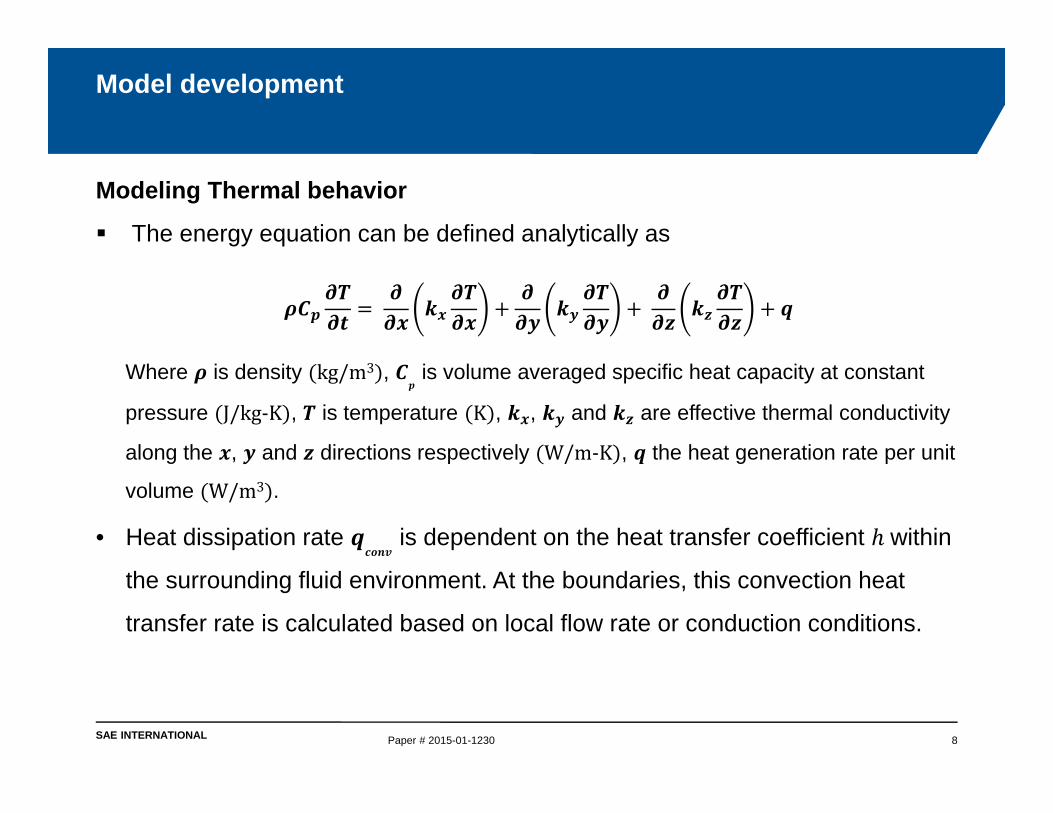
Modeling Thermal behavior
The energy equation can be defined analytically as
Where is density kg/m3 , is volume averaged specific heat capacity at constant
pressure J/kg‐K , is temperature K , , and are effective thermal conductivity
along the , and directions respectively W/m‐K , the heat generation rate per unit
volume W/m3 .
• Heat dissipation rate is dependent on the heat transfer coefficient within
the surrounding fluid environment. At the boundaries, this convection heat
transfer rate is calculated based on local flow rate or conduction conditions.
Model development
Paper # 2015-01-1230 8

SAE INTERNATIONAL
Cool-down
Forced air cooling system has been designed due to
– less complexity in design,
– low cost, weight, and
– simpler control mechanism
Aluminum cooling plates are sandwiched in-between the cells.
Plates have extended surfaces for heat transfer with the flowing air.
Thermal management system design
Paper # 2015-01-1230 9
SAE INTERNATIONAL
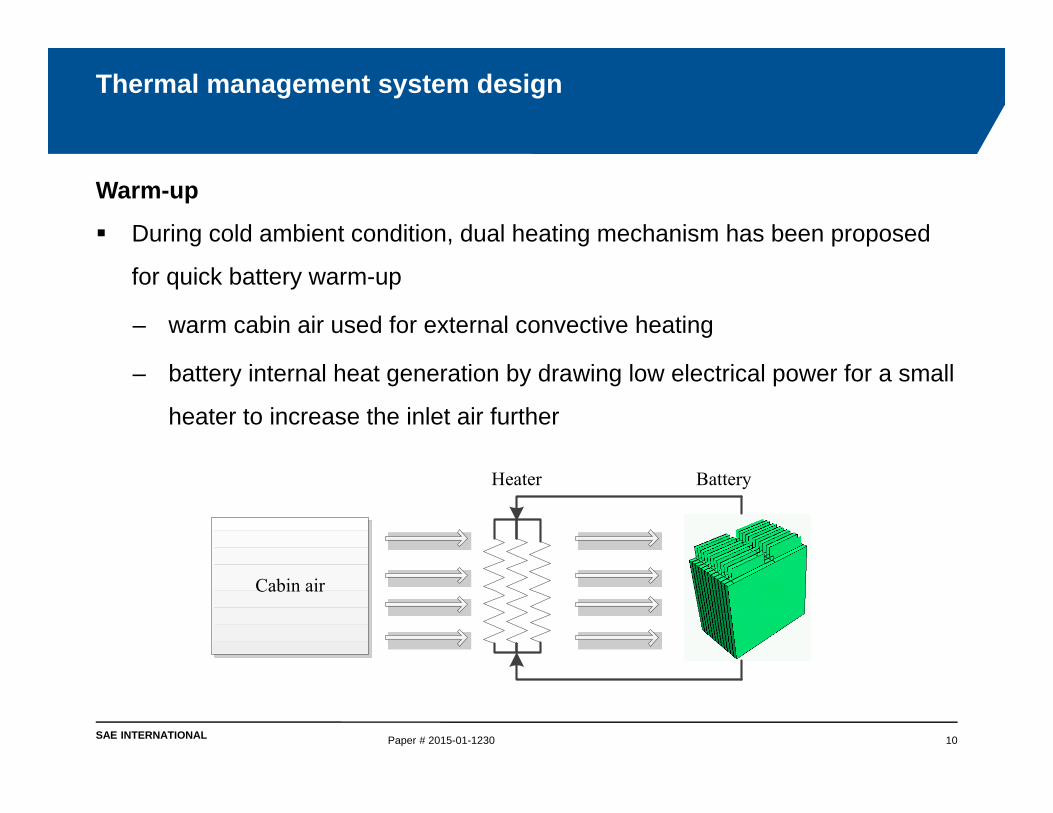
Warm-up
During cold ambient condition, dual heating mechanism has been proposed
for quick battery warm-up
– warm cabin air used for external convective heating
– battery internal heat generation by drawing low electrical power for a small
heater to increase the inlet air further
Thermal management system design
Paper # 2015-01-1230 10
Cabin air
Heater Battery

SAE INTERNATIONAL
Assumptions and boundary condition
Paper # 2015-01-1230 11
Initial temperature of the Power Pack Unit (PPU) was assumed to be same as
the drive cycle ambient condition, which is 23.89oC.
No forced air cooling was introduced until the battery maximum temperature
reaches at 28oC.
US06 drive cycle was considered as the extreme driving condition/worst case
– air condition (AC) system is inactive (OFF)
– most aggressive one wherein harder acceleration and braking are included
– also has the highest speed of 80 mph
The inlet air temperature was same as ambient temperature.
SAE INTERNATIONAL
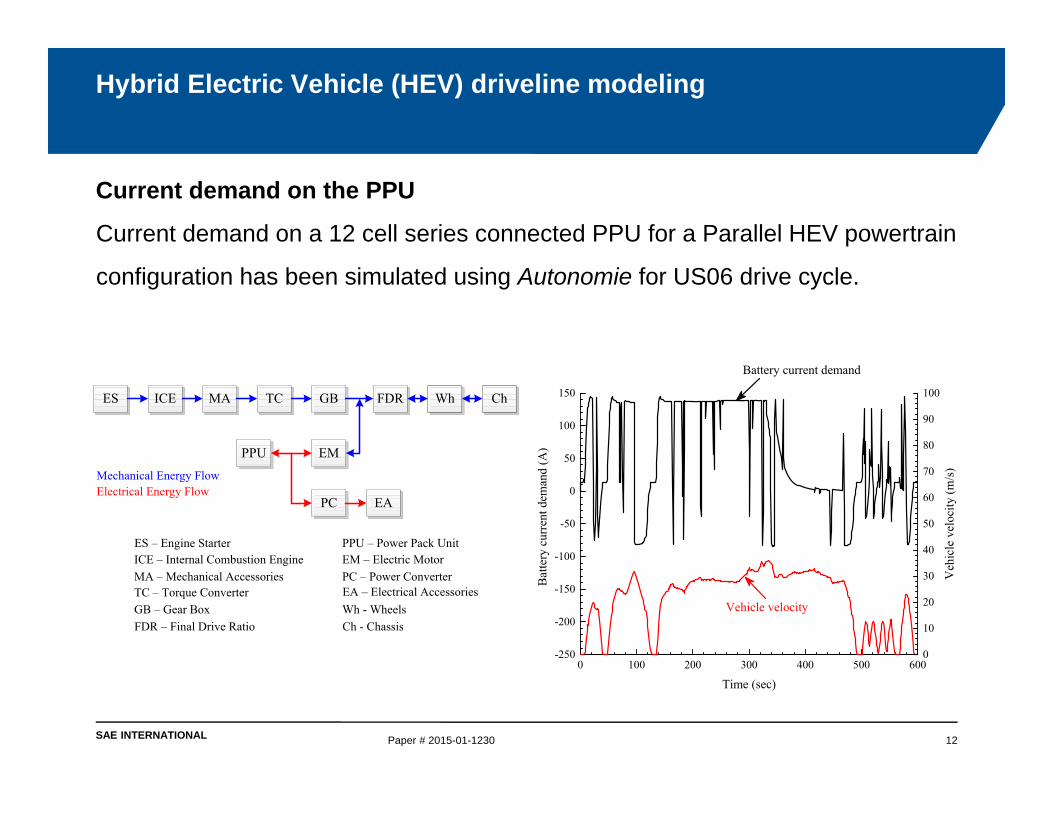
Hybrid Electric Vehicle (HEV) driveline modeling
Paper # 2015-01-1230 12
ES ICE MA TC GB FDR Wh Ch
PPU EM
PC EA
Mechanical Energy FlowElectrical Energy Flow
ES – Engine StarterICE – Internal Combustion EngineMA – Mechanical AccessoriesTC – Torque ConverterGB – Gear BoxFDR – Final Drive Ratio
Wh - WheelsCh - Chassis
PPU – Power Pack UnitEM – Electric MotorPC – Power ConverterEA – Electrical Accessories
0 100 200 300 400 500 600-250
-200
-150
-100
-50
0
50
100
150
Bat
tery
cur
rent
dem
and
(A)
Time (sec)
Battery current demand
0
10
20
30
40
50
60
70
80
90
100
Vehicle velocity
Veh
icle
vel
ocity
(m/s
)
Current demand on the PPU
Current demand on a 12 cell series connected PPU for a Parallel HEV powertrain
configuration has been simulated using Autonomie for US06 drive cycle.

SAE INTERNATIONAL
Constant current discharge of 0.3 C, 0.5 C, 1.0 C and 2.0 C at ambient condition has been
simulated and compared against the experimental data from literature.
DoD range of 0 – 80%, all discharge curves show good match with experimental data.
Maximum difference of 0.05 V was noticed for the 2.0 C discharge.
Results and discussions
Paper # 2015-01-1230 13
* Abdul‐Quadir, Yasir, Tomi Laurila, Juha Karppinen, Kirsi Jalkanen, Kai Vuorilehto, Lasse Skogström, and Mervi Paulasto‐Kröckel. "Heat generation in high power prismatic Li‐ion battery cell with LiMnNiCoO2 cathode material." International Journal of Energy Research 38, no. 11 (2014): 1424-1437
0 25 50 75 100 125 150 175 200 2253.0
3.2
3.4
3.6
3.8
4.0
4.2 Experiment* - 0.3C discharge Experiment* - 0.5C discharge Experiment* - 1.0C discharge Experiment* - 2.0C discharge Simulation - 0.3C discharge Simulation - 0.5C discharge Simulation - 1.0C discharge Simulation - 2.0C discharge
Vol
tage
(V)
Time (min)
SAE INTERNATIONAL
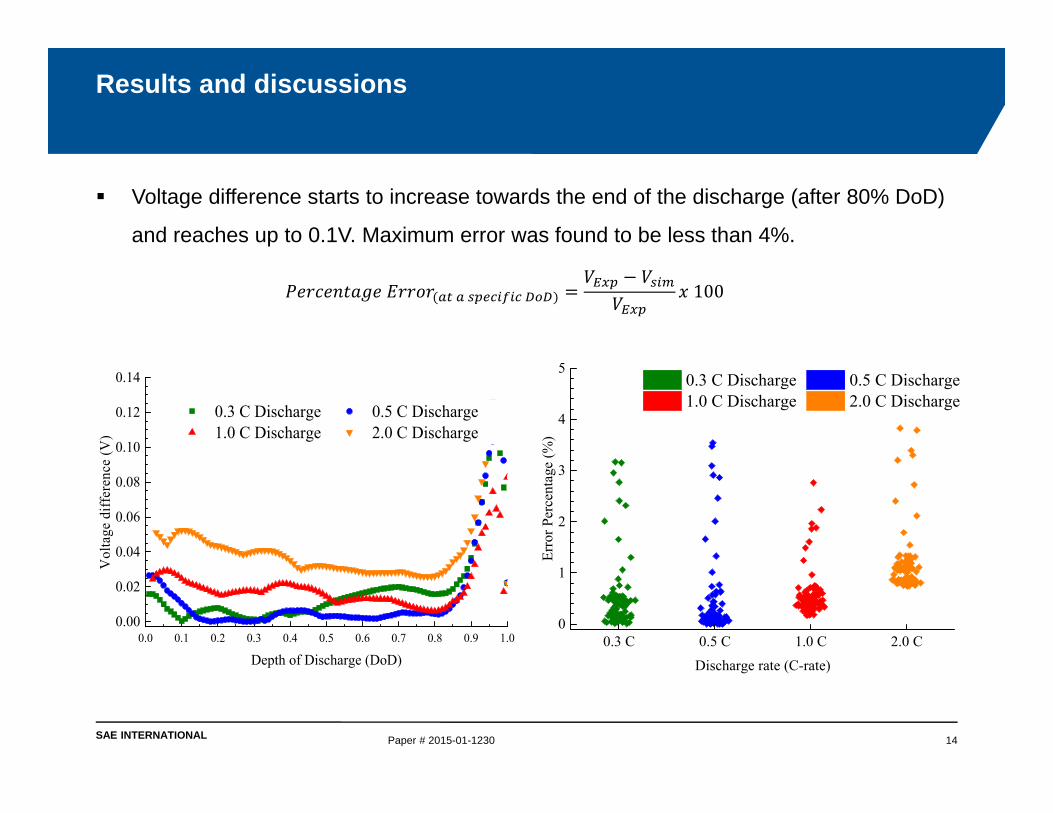
Voltage difference starts to increase towards the end of the discharge (after 80% DoD)
and reaches up to 0.1V. Maximum error was found to be less than 4%.
100
Results and discussions
Paper # 2015-01-1230 14
0.0 0.1 0.2 0.3 0.4 0.5 0.6 0.7 0.8 0.9 1.00.00
0.02
0.04
0.06
0.08
0.10
0.12
0.14
0.3 C Discharge 0.5 C Discharge 1.0 C Discharge 2.0 C Discharge
Vol
tage
diff
eren
ce (V
)
Depth of Discharge (DoD)0.3 C 0.5 C 1.0 C 2.0 C
0
1
2
3
4
5
Discharge rate (C-rate)
Erro
r Per
cent
age
(%)
0.3 C Discharge 0.5 C Discharge 1.0 C Discharge 2.0 C Discharge
SAE INTERNATIONAL
Results and discussions
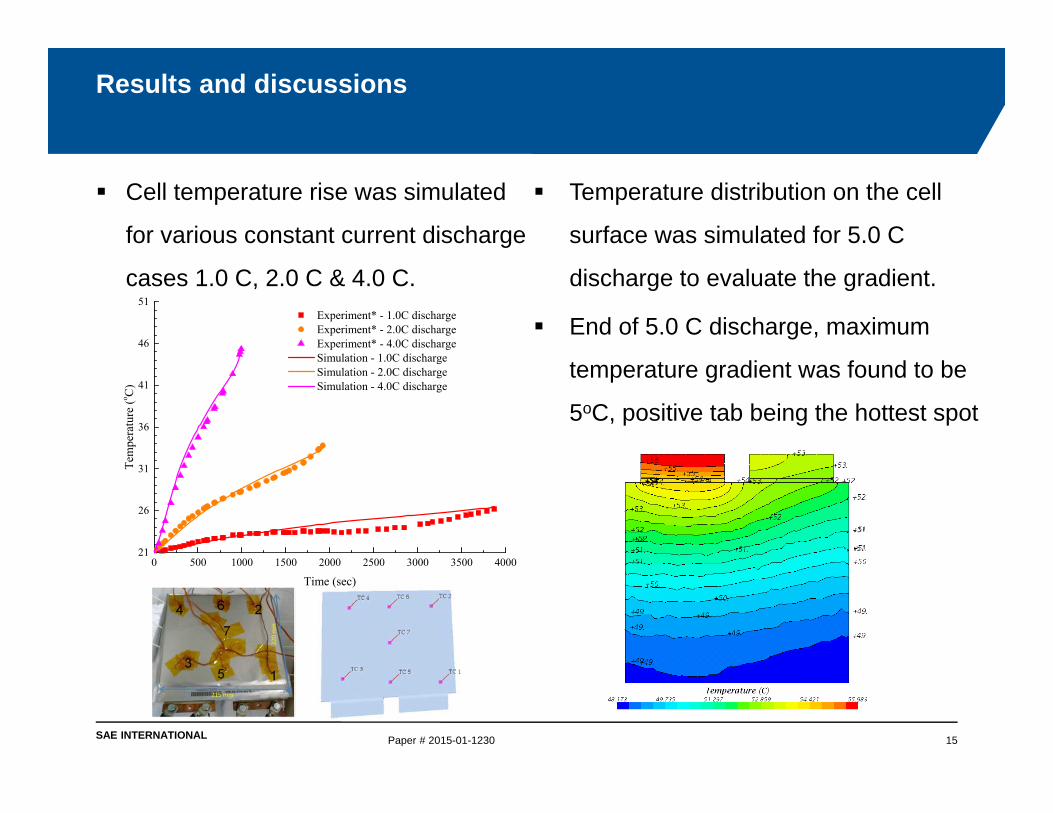
Cell temperature rise was simulated
for various constant current discharge
cases 1.0 C, 2.0 C & 4.0 C.
Temperature distribution on the cell
surface was simulated for 5.0 C
discharge to evaluate the gradient.
End of 5.0 C discharge, maximum
temperature gradient was found to be
5oC, positive tab being the hottest spot
Paper # 2015-01-1230 15
0 500 1000 1500 2000 2500 3000 3500 400021
26
31
36
41
46
51 Experiment* - 1.0C discharge Experiment* - 2.0C discharge Experiment* - 4.0C discharge Simulation - 1.0C discharge Simulation - 2.0C discharge Simulation - 4.0C discharge
Tem
pera
ture
(o C)
Time (sec)
SAE INTERNATIONAL
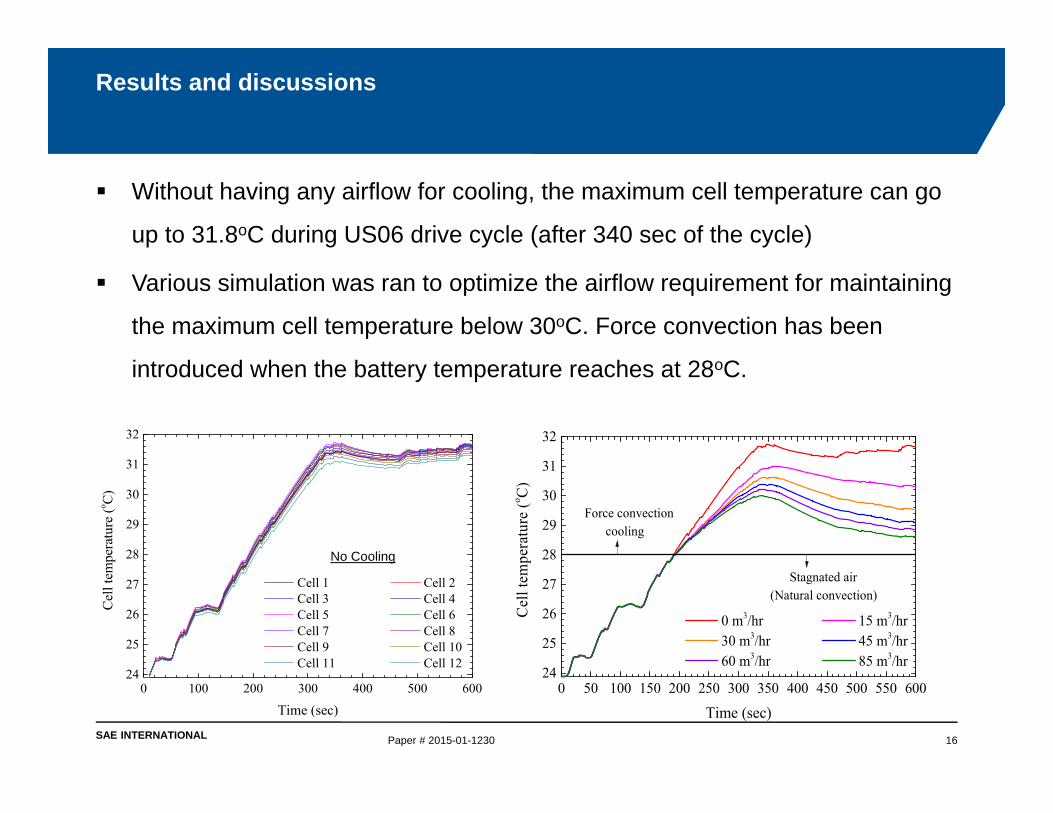
Without having any airflow for cooling, the maximum cell temperature can go
up to 31.8oC during US06 drive cycle (after 340 sec of the cycle)
Various simulation was ran to optimize the airflow requirement for maintaining
the maximum cell temperature below 30oC. Force convection has been
introduced when the battery temperature reaches at 28oC.
Results and discussions
Paper # 2015-01-1230 16
0 100 200 300 400 500 60024
25
26
27
28
29
30
31
32
Cel
l tem
pera
ture
(o C)
Time (sec)
Cell 1 Cell 2 Cell 3 Cell 4 Cell 5 Cell 6 Cell 7 Cell 8 Cell 9 Cell 10 Cell 11 Cell 12
No Cooling
0 50 100 150 200 250 300 350 400 450 500 550 60024
25
26
27
28
29
30
31
32
Stagnated air(Natural convection)
Cel
l tem
pera
ture
(o C)
Time (sec)
0 m3/hr 15 m3/hr 30 m3/hr 45 m3/hr 60 m3/hr 85 m3/hr
Force convection cooling

SAE INTERNATIONAL
Detailed temperature distribution on the cells
and the cooling plates show temperature
uniformity within the PPU.
Maximum temperature gradient of 1.4oC was
found within the cells during US06 drive cycle
(at 340 seconds) for airflow rate of 85m3/h.
Results and discussions
Paper # 2015-01-1230 17

SAE INTERNATIONAL
Coupled 3-D electro-thermal Computational Fluid Dynamics (CFD) analysis
was done on a 12 cell series connected Power pack Unit (PPU) for mild HEV
application to optimize the air flow requirement for minimizing the temperature
gradient within the module.
Proposed design comprised of 1.5mm thick aluminum plates sandwiched
between the adjacent cells and having 26mm extended surface area on both
sides as fins requires minimum airflow rate of 85 m3/h to meet the functional
objective.
Transient analysis for US06 dynamic drive cycle using NTG battery model
approach provides us the detail temperature distribution within the PPU unit
and can be useful for the “off-line” control calibration.
Conclusion
Paper # 2015-01-1230 18

SAE INTERNATIONAL
Model accuracy can be improved by adopting high fidelity detailed
electrochemical modeling approach, which can predict electrochemical and
thermal parameters more accurately.
Thermal management system can be designed and optimized more efficiently
by running Design of Experiment (DoE) while considering more variable
parameters.
Future recommendations
Paper # 2015-01-1230 19
Acknowledgement
I would like to thank the Department of Energy, EcoCAR organizers from
Argonne National Laboratory, as well as competition sponsor CD-adapco for
providing all their software and technical supports.
Also I would like to thank Dr. Jerry Ku for all his valuable suggestions in this
study.

SAE INTERNATIONAL Paper # 2015-01-1230 20