Design and Performance of Crack-Free Environmentally ...
145
Design and Performance of Crack-Free Environmentally Friendly Concrete “Crack-Free Eco-Crete” by Kamal H. Khayat, Ph.D., P.Eng. Principal Investigator, Professor and Iman Mehdipour Ph.D. Candidate August 2014 A National University Transportation Center at Missouri University of Science and Technology NUTC R322
Transcript of Design and Performance of Crack-Free Environmentally ...

Design and Performance of Crack-Free Environmentally Friendly
Concrete “Crack-Free Eco-Crete”
by
Kamal H. Khayat, Ph.D., P.Eng. Principal Investigator, Professor
and
Iman Mehdipour Ph.D. Candidate
August 2014
A National University Transportation Center at Missouri University of Science and Technology
NUTC R322

Disclaimer
The contents of this report reflect the views of the author(s), who are responsible for the facts and the
accuracy of information presented herein. This document is disseminated under the sponsorship of
the Department of Transportation, University Transportation Centers Program and the Center for
Transportation Infrastructure and Safety NUTC program at the Missouri University of Science and
Technology, in the interest of information exchange. The U.S. Government and Center for
Transportation Infrastructure and Safety assumes no liability for the contents or use thereof.
NUTC ###

Technical Report Documentation Page
1. Report No. NUTC R322
2. Government Accession No. 3. Recipient's Catalog No.
4. Title and Subtitle Design and Performance of Crack-Free Environmentally Friendly Concrete “Crack-Free Eco-Crete”
5. Report Date August 2014
6. Performing Organization Code 7. Author/s Kamal H. Khayat and Iman Mehdipour
8. Performing Organization Report No. Project #00040518
9. Performing Organization Name and Address Center for Transportation Infrastructure and Safety/NUTC program Missouri University of Science and Technology 220 Engineering Research Lab Rolla, MO 65409
10. Work Unit No. (TRAIS) 11. Contract or Grant No. DTRT06-G-0014
12. Sponsoring Organization Name and Address U.S. Department of Transportation Research and Innovative Technology Administration 1200 New Jersey Avenue, SE Washington, DC 20590
13. Type of Report and Period Covered Final
14. Sponsoring Agency Code
15. Supplementary Notes 16. Abstract High-performance concrete (HPC) is characterized by high content of cement and supplementary cementitious materials (SCMs). Using high binder content, low water-to-cementitious material ratio (w/cm), and various chemical admixtures in the HPC can result in higher material cost and greater risk of thermal and shrinkage cracking, thus reducing service life of the structure. This project seeks to investigate the feasibility of producing crack-free and environmentally friendly concrete (crack-free and Eco-Crete) for building and transportation infrastructure applications. Two types of concrete materials, including Eco-super workable concrete (Eco-SWC) and Eco-self-consolidating concrete (Eco-SCC) are of special interest in this project. Eco-Crete mixtures are developed with a binder content lower than 315 kg/m3 (530 lb/yd3). The concrete should develop 56-day compressive strength greater than 30 MPa (>4350 psi). Given the low binder content compared to the targeted performance level, binder composition and aggregate proportion are optimized based on the packing density to reduce the voids between particles. The optimized concretes exhibit low shrinkage given the low paste content and use of shrinkage mitigation approach, such as the use of a shrinkage reducing admixture (SRA), a Type G or K expansive agent (EX), and a lightweight sand (LWS), as well as using fibers to reduce cracking. A factorial design approach was also employed to quantify the effect of such materials on mechanical and shrinkage properties. The results indicate that, the combined use of 10% silica fume with either 40% fly ash or 40% slag exhibited the highest packing density of 0.66 compared to 0.52 for cement paste. The modified Andreasen packing model with distribution modulus (q) of about 0.29 fits reasonable well to express the particle size distribution (PSD) of aggregate for SCC with low binder content. Binary shrinkage reducing materials containing 7.5% Type G EX and 20% LWS or ternary system including 12.5% Type K EX, 2% SRA, and 20% LWS can be quite effective for developing Eco-Crete mixtures to exhibit crack-free properties.
17. Key Words Crack-free; Early-age cracking; Eco-Crete; Packing density; Shrinkage reducing strategies, Supplementary cementitious materials.
18. Distribution Statement No restrictions. This document is available to the public through the National Technical Information Service, Springfield, Virginia 22161.
19. Security Classification (of this report) unclassified
20. Security Classification (of this page) unclassified
21. No. Of Pages
145
22. Price
Form DOT F 1700.7 (8-72)

Final Report
Design and Performance of Crack-Free Environmentally Friendly Concrete
“Crack-Free Eco-Crete”
Prepared by
Kamal H. Khayat, Ph.D., P.Eng., Principal Investigator, Professor
Iman Mehdipour, Ph.D. Candidate
August 2014
A National University Transportation Center at Missouri University of Science and Technology

ABSTRACT
High-performance concrete (HPC) is characterized by high content of cement and supplementary
cementitious materials (SCMs). Using high binder content, low water-to-cementitious material
ratio (w/cm), and various chemical admixtures in the HPC can result in higher material cost and
greater risk of thermal and shrinkage cracking, thus reducing service life of the structure. This
project seeks to investigate the feasibility of producing crack-free and environmentally friendly
concrete (crack-free and Eco-Crete) for building and transportation infrastructure applications.
Two types of concrete materials, including Eco-super workable concrete (Eco-SWC) and Eco-
self-consolidating concrete (Eco-SCC) are of special interest in this project. Eco-Crete mixtures
are developed with a binder content lower than 315 kg/m3 (530 lb/yd3). The concrete should
develop 56-day compressive strength greater than 30 MPa (>4350 psi). Given the low binder
content compared to the targeted performance level, binder composition and aggregate
proportion are optimized based on the packing density to reduce the voids between particles. The
optimized concretes exhibit low shrinkage given the low paste content and use of shrinkage
mitigation approach, such as the use of a shrinkage reducing admixture (SRA), a Type G or K
expansive agent (EX), and a lightweight sand (LWS), as well as using fibers to reduce cracking.
A factorial design approach was also employed to quantify the effect of such materials on
mechanical and shrinkage properties. The results indicate that, the combined use of 10% silica
fume with either 40% fly ash or 40% slag exhibited the highest packing density of 0.66
compared to 0.52 for cement paste. The modified Andreasen packing model with distribution
modulus (q) of about 0.29 fits reasonable well to express the particle size distribution (PSD) of
aggregate for SCC with low binder content. Binary shrinkage reducing materials containing
7.5% Type G EX and 20% LWS or ternary system including 12.5% Type K EX, 2% SRA, and
20% LWS can be quite effective for developing Eco-Crete mixtures to exhibit crack-free
properties.
Keywords:
Crack-free; Early-age cracking; Eco-Crete; Packing density; Shrinkage reducing strategies,
Supplementary cementitious materials.

ACKNOWLEDGEMENT
The authors would like to thank to the Center for Transportation Infrastructure and Safety, a
National University Transportation Center (NUTC) at the Missouri University of Science and
Technology (Missouri S&T), the Icelandic Road Administration, and the Innovation Center
Iceland (ICI) for providing financial support (reference number R322). The authors are also
grateful to Dr. Ólafur H. Wallevik from ICI for his support and assistance in this project. The
assistance of Dr. Nicolas Ali Libre and Dr. Soo-Duck Hwang in analyzing the experimental data
is deeply appreciated. The cooperation and support from Abigayle Sherman, Gayle Spitzmiller,
and Cheryl Geisler staff members of Centre for Infrastructure Engineering Studies (CIES) is
greatly acknowledged. The assistance from Jason Cox (Sr. Research Specialist) and John
Bullock (Research/Lab Technician) in performing experiments is also deeply appreciated.

Executive summary
High-performance concrete (HPC) is characterized by high content of cement and supplementary
cementitious materials (SCMs). Using high binder content, low water-to-cementitious material
ratio (w/cm), and various chemical admixtures in the HPC can result in higher material cost and
greater risk of thermal and shrinkage cracking, thus reducing service life of the structure.
The aim of research presented in this report was to investigate the feasibility of producing crack-
free and environment-friendly concrete materials for building and transportation infrastructure
applications. Two types of concrete materials, including Eco-super workable concrete (Eco-
SWC) and Eco-self-consolidating concrete (Eco-SCC) were of special interest in this project.
Eco-Crete mixtures were developed with a binder content lower than 315 kg/m3 (530 lb/yd3).
The concrete exhibited 56-day compressive strength greater than 30 MPa (>4350 psi). Given the
low binder content compared to the targeted performance level, binder composition and
aggregate proportions were optimized based on the packing density to reduce the voids between
particles. The optimized concretes exhibited low shrinkage, given the low paste content and use
of shrinkage mitigation approach, such as the use of a shrinkage reducing admixture (SRA), a
Type G expansive agent (calcium sulfoaluminate-based), a Type K expansive agent (calcium
oxide-based), and a lightweight sand (LWS), as well as the use of fibers to reduce cracking. A
factorial design approach was also employed to quantify the effect of such materials on
mechanical and shrinkage properties.
Based on the obtained results from experimental study the following conclusions can be drawn:
Partial replacement of cement by fly ash, slag or silica fume significantly improves the packing
density of paste mixtures. Given higher packing density and lower water demand of SCMs, the
Eco-Crete mixtures prepared with binary and ternary of binders necessitated lower HRWRA
demand to achieve the required fluidity compared to the control mixture made with 100%
cement.
The proportion of blended aggregate had substantial influence on the packing density of
concrete. Based on the obtained results from this study, packing density of different aggregate
proportions varied from 0.65 to 0.815 and 0.64 to 0.80 for rounded and crushed aggregates,
respectively. The difference between packing density of poorly-graded aggregate and well-
graded aggregate was about 0.15, which significantly affected the required paste volume to fill
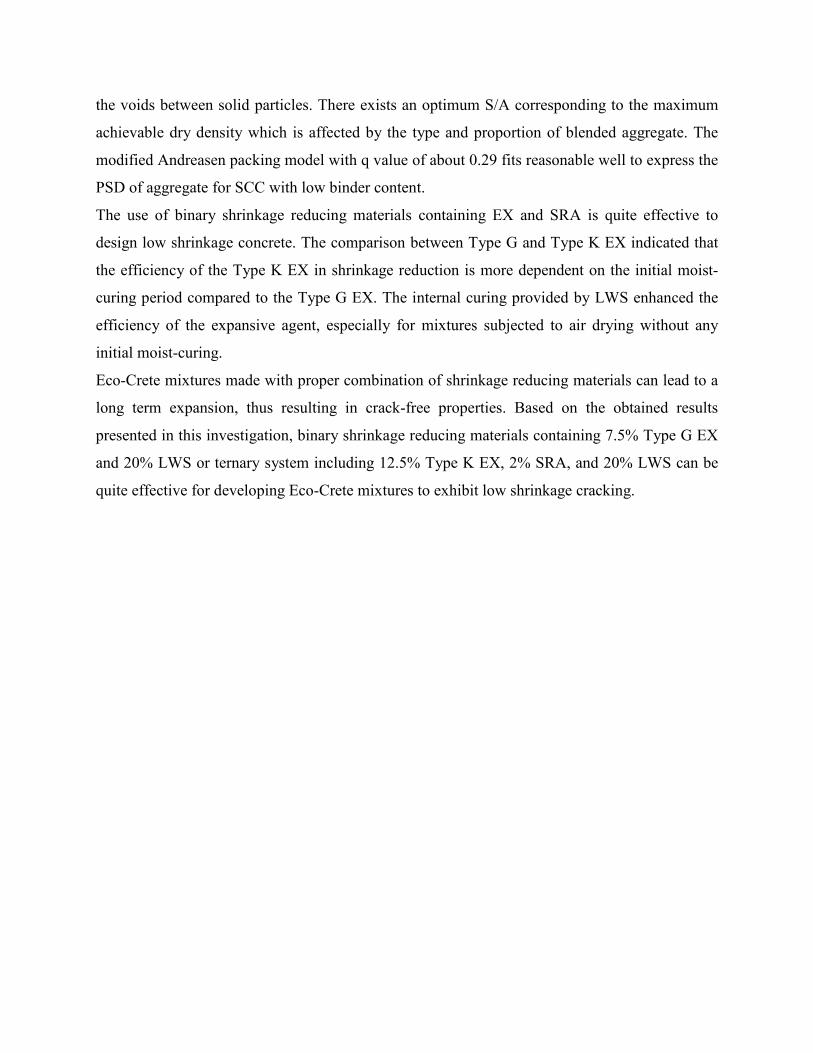
the voids between solid particles. There exists an optimum S/A corresponding to the maximum
achievable dry density which is affected by the type and proportion of blended aggregate. The
modified Andreasen packing model with q value of about 0.29 fits reasonable well to express the
PSD of aggregate for SCC with low binder content.
The use of binary shrinkage reducing materials containing EX and SRA is quite effective to
design low shrinkage concrete. The comparison between Type G and Type K EX indicated that
the efficiency of the Type K EX in shrinkage reduction is more dependent on the initial moist-
curing period compared to the Type G EX. The internal curing provided by LWS enhanced the
efficiency of the expansive agent, especially for mixtures subjected to air drying without any
initial moist-curing.
Eco-Crete mixtures made with proper combination of shrinkage reducing materials can lead to a
long term expansion, thus resulting in crack-free properties. Based on the obtained results
presented in this investigation, binary shrinkage reducing materials containing 7.5% Type G EX
and 20% LWS or ternary system including 12.5% Type K EX, 2% SRA, and 20% LWS can be
quite effective for developing Eco-Crete mixtures to exhibit low shrinkage cracking.

I
CONTENTS 1. INTRODUCTION................................................................................................... 1
1.1. Problem statement ................................................................................................. 1
1.2. Research objectives ............................................................................................... 2
1.3. Research methodology .......................................................................................... 3
2. LITERATURE REVIEW ...................................................................................... 6
2.1. Introduction ........................................................................................................... 6
2.2. Supplementary cementitious materials (SCMs) .................................................... 8
2.2.1. Effect of SCMs on fresh properties ................................................................. 8
Workability and rheological properties ....................................................................... 8
Packing density ............................................................................................................ 9
Setting time and air content ....................................................................................... 11
2.2.2. Effect of SCMs on hardened properties ........................................................ 12
Mechanical properties ................................................................................................ 12
Transport properties ................................................................................................... 13
Shrinkage and cracking resistance ............................................................................. 14
2.3. Aggregates ........................................................................................................... 15
2.3.1. Particle packing and gradation ...................................................................... 16
2.3.2. Particle optimization ...................................................................................... 19
2.4. Shrinkage and cracking potential ........................................................................ 21
2.4.1. Factors affecting shrinkage and cracking ...................................................... 22
Effect of cement and w/cm ........................................................................................ 22
Effect of aggregate ..................................................................................................... 22
Effect of shrinkage reducing admixture .................................................................... 24
Effect of expansive cement ........................................................................................ 25
Effect of Fiber ............................................................................................................ 26
Effect of combined use of shrinkage reducing materials .......................................... 27
3. EXPERIMENTAL PROGRAM .......................................................................... 30
3.1. Materials .............................................................................................................. 30

II
Cementitious materials .............................................................................................. 30
Chemical admixtures ................................................................................................. 31
Fibers ......................................................................................................................... 32
Aggregate ................................................................................................................... 32
3.2. Experimental program ......................................................................................... 36
Phase 1- Optimization of binder composition ........................................................... 36
Phase 2- Optimization of aggregate characteristics ................................................... 38
Phase 3- Comparison of shrinkage reducing strategies ............................................. 39
Phase 4- Development of crack-free Eco-Crete ........................................................ 41
3.3. Mixing and test methods ..................................................................................... 43
3.3.1. Mixing procedure .......................................................................................... 43
3.3.2. Test methods for paste mixtures .................................................................... 44
Flow characteristics ................................................................................................... 44
Wet packing density .................................................................................................. 45
Compressive strength ................................................................................................ 47
3.3.3. Test method for aggregate characteristics ..................................................... 47
3.3.4. Test methods for mortar mixtures ................................................................. 48
Autogenous shrinkage ............................................................................................... 49
Drying shrinkage ....................................................................................................... 50
3.3.5. Test methods for concrete mixtures............................................................... 50
Workability, rheology, and stability .......................................................................... 51
Mechanical properties ................................................................................................ 54
Durability ................................................................................................................... 54
Shrinkage and cracking resistance ............................................................................. 57
4. TEST RESULTS AND DISCUSSION ................................................................ 59
4.1. Optimization of binder composition ................................................................... 59
4.1.1. Flow characteristics of paste mixtures........................................................... 61
4.1.2. Packing density of paste mixtures ................................................................. 62
4.1.3. Selection of optimum binder composition..................................................... 66
4.2. Optimization of aggregate characteristics ........................................................... 70
4.2.1. Aggregate optimization using packing density approach .............................. 70

III
4.2.2. Theoretical model for PSD optimization ....................................................... 73
4.2.3. Selection of optimum aggregate type and proportion ................................... 75
4.3. Comparison of shrinkage reducing strategies ..................................................... 76
4.3.1. Autogenous shrinkage ................................................................................... 77
4.3.2. Total shrinkage .............................................................................................. 79
4.3.3. Mechanical properties.................................................................................... 80
4.3.4. Derived statistical models .............................................................................. 82
4.3.5. Selection of optimum shrinkage reducing strategies ..................................... 86
4.4. Development of crack-free Eco-Crete ................................................................. 86
4.4.1. Performance of Eco-SWC made with various binder compositions ............. 87
Workability characteristics ........................................................................................ 87
Mechanical properties ................................................................................................ 88
Shrinkage ................................................................................................................... 90
Electrical resistivity ................................................................................................... 92
Estimation of cracking potential of SWC mixtures ................................................... 94
4.4.2. Performance of Eco-SCC containing shrinkage reducing materials ............. 95
Fresh concrete properties ........................................................................................... 97
Mechanical properties ................................................................................................ 98
Durability ................................................................................................................. 104
Autogenous and drying shrinkage ........................................................................... 107
Restrained shrinkage and cracking potential ........................................................... 109
5. CONCLUSIONS ................................................................................................. 113
5.1. Optimization of binder composition ................................................................. 113
5.2. Optimization of aggregate characteristics ......................................................... 114
5.3. Comparison of shrinkage reducing strategies ................................................... 115
5.4. Development of crack-free Eco-Crete ............................................................... 116
Future work ................................................................................................................. 118
REFERENCES .............................................................................................................. 119

IV
LIST OF FIGURES Figure 1.1. Outline of the research investigation ................................................................ 5
Figure 2.1. Packing density of ternary grout mixtures (Kwan and Wong, 2008) ............. 10
Figure 2.2. Effect of packing density on excess water (Khayat and Mehdipour, 2014) ... 11
Figure 2.3. Coarseness factor chart ................................................................................... 19
Figure 3.1. PSD of cementitious materials ....................................................................... 30
Figure 3.2. Synthetic and steel fibers used in this study ................................................... 32
Figure 3.3. Different aggregate quarries in MO ............................................................... 33
Figure 3.4. Aggregate samples taken from different quarries .......................................... 34
Figure 3.5. Aggregate types used in this study (one sand and four coarse aggregates) .... 34
Figure 3.6. PSD of investigated aggregates ...................................................................... 35
Figure 3.7. Variation of mini-slump flow with w/cm by volume ..................................... 45
Figure 3.8. Packing density measurement ........................................................................ 46
Figure 3.9. Gyratory intensive compaction tester (ICT) ................................................... 48
Figure 3.10. Autogenous shrinkage measurement device ................................................ 49
Figure 3.11. Determination of the setting time ................................................................. 49
Figure 3.12. Measurement of free drying shrinkage ......................................................... 50
Figure 3.13. Modified J-ring used for FR-SCC ................................................................ 52
Figure 3.14. Surface settlement test .................................................................................. 53
Figure 3.15. Test setup for flexural toughness measurement of FRC beams ................... 54
Figure 3.16. Freeze-thaw chamber (left) and ultrasonic velocity instrument (right) ........ 55
Figure 3.17. Bulk electrical conductivity (left) and surface resistivity (right) ................. 56
Figure 3.18. Shrinkage measurement of sealed (right) and unsealed specimens (left) ..... 58
Figure 4.1. Determination of HRWRA saturation point for Portland cement .................. 59
Figure 4.2. Effect of binder composition on flow characteristics ..................................... 62
Figure 4.3. Effect of binder composition on packing density of grout mixtures .............. 64
Figure 4.4. Effect packing density of SCMs on optimum water demand ......................... 64
Figure 4.5. Relationship between MWD and OWD ......................................................... 65
Figure 4.6. Overall performance of paste mixtures .......................................................... 68
Figure 4.7. Variation in normalized ranking with strength category ................................ 69
Figure 4.8. Effect of S/A on packing density .................................................................... 71

V
Figure 4.9. TPD of the combined aggregate ..................................................................... 72
Figure 4.10. PSD of selected aggregate combination ....................................................... 75
Figure 4.11. Autogenous shrinkage of mortar mixtures ................................................... 78
Figure 4.12. Total shrinkage of mortar mixtures .............................................................. 80
Figure 4.13. Effect of shrinkage reducing materials on compressive strength ................. 81
Figure 4.14. Effect of shrinkage reducing materials on splitting tensile strength ............ 82
Figure 4.15. Effect of initial moist-curing on the performance of expansive agents ........ 85
Figure 4.16. Mechanical properties of SWC mixtures ..................................................... 90
Figure 4.17. Autogenous and drying shrinkage of SWC mixtures ................................... 92
Figure 4.18. Electrical resistivity of SWC mixtures at 56-day ......................................... 93
Figure 4.19. Variation in surface settlement of SCC mixtures ......................................... 98
Figure 4.20. Mechanical properties of SCC mixtures..................................................... 100
Figure 4.21. Load-deflection curve of SCC mixtures ..................................................... 102
Figure 4.22. Comparison of 56-day flexural strength of SCC mixtures ......................... 103
Figure 4.23. Comparison of 56-day flexural toughness of SCC mixtures ...................... 104
Figure 4.24. 56-day water absorption and permeable void of SCC mixtures ................. 105
Figure 4.25. Comparison of 56-day electrical resistivity of SCC mixtures .................... 106
Figure 4.26. Frost durability of SCC mixtures ............................................................... 107
Figure 4.27. Autogenous and drying shrinkage of SCC mixtures .................................. 108
Figure 4.28. Restrained shrinkage results ....................................................................... 109
Figure 4.29. Average restrained shrinkage of SCC mixtures ......................................... 110
Figure 4.30. Average strain rate factor of SCC mixtures ............................................... 112

VI
LIST OF TABLES
Table 1.1. Targeted performance specifications for Eco-Crete .......................................... 2
Table 3.1. Physical and chemical characteristics of cementitious materials and expansive
agents .............................................................................................................. 31
Table 3.2. Characteristics of chemical admixtures ........................................................... 32
Table 3.3. Characteristics of investigated aggregates ....................................................... 36
Table 3.4. Mixture proportioning for paste mixtures ........................................................ 37
Table 3.5. Aggregate blends investigated in this study .................................................... 38
Table 3.6. Coded and actual values of investigated parameters ....................................... 39
Table 3.7. Experimental factorial program for mixtures containing Type K EX ............. 40
Table 3.8. Experimental factorial program for mixtures containing Type G EX ............. 41
Table 3.9. Experimental matrix for SWC mixtures .......................................................... 42
Table 3.10. Experimental matrix for SCC mixtures ......................................................... 43
Table 3.11. Selected testing parameters for ICT ............................................................... 48
Table 3.12. Test methods used for concrete mixtures ...................................................... 51
Table 4.1. Flow characteristics, packing density, and compressive strength of paste
mixtures ......................................................................................................... 60
Table 4.2. Evaluation of investigated pastes using performance rank analysis ................ 67
Table 4.3. Selected binder compositions .......................................................................... 70
Table 4.4. Optimum aggregate proportions based on the packing density measurement . 73
Table 4.5. Determined q value for selected aggregate combination ................................. 74
Table 4.6. Mixture proportions of mortar mixtures containing Type K EX ..................... 76
Table 4.7. Mixture proportions of mortar mixtures containing Type G EX ..................... 77
Table 4.8. Derived statistical models for mortar mixtures containing Type K EX .......... 83
Table 4.9. Derived statistical models for mortar mixtures containing Type G EX .......... 84
Table 4.10. Selected shrinkage reducing strategies from statistical analysis ................... 86
Table 4.11. Mixture proportions of Eco-SWC mixtures ................................................... 87
Table 4.12. Fresh properties of investigated SWC mixtures ............................................ 88
Table 4.13. Correlation between the surface resistivity and chloride ion permeability
proposed by Chini et al. (2003).................................................................... 94

VII
Table 4.14. Estimation of cracking potential for selected binders .................................... 95
Table 4.15. Mixture proportions of Eco-SCC mixtures .................................................... 96
Table 4.16. Fresh properties of SCC mixtures .................................................................. 97
Table 4.17. Cracking potential classification of SCC mixtures ...................................... 111

1
1. INTRODUCTION
1.1. Problem statement
Since concrete is the most used construction material, it accounts for a considerable part of CO2
emissions. This means that besides to its appreciable roles, it may be considered as a significant
source of emission of greenhouse gases. The solution of this problem is to reduce the
environmental impact of concrete through the approach of using ecological concrete mixtures
(Eco-Crete). Besides its environmental benefits, Eco-Crete is also important from the economical
perspective because, incorporating high volume of industrial by-products as replacements for
Portland cement makes the Eco-Crete more energy efficient and more cost effective to produce.
The aim of research presented in this report is to investigate the feasibility of producing
environment-friendly concrete materials for building and transportation infrastructure
applications. Two types of concrete materials, including Eco-super workable concrete (Eco-
SWC) and Eco-self-consolidating concrete (Eco-SCC) are of special interest in this project. The
target upper value for the binder content of Eco-Crete mixtures in this project is 315 kg/m3 (530
lb/yd3) and the targeted 56-day compressive strength is 30 to 40 MPa (4350 to 5800 psi).
It should be noted that due to the higher water-to-cementitious materials ratio (w/cm) needed to
increase the paste volume of Eco-Crete, the material may exhibit higher shrinkage, thus resulting
in higher risk of cracking. Therefore, this project also seeks to develop crack-free Eco-Crete
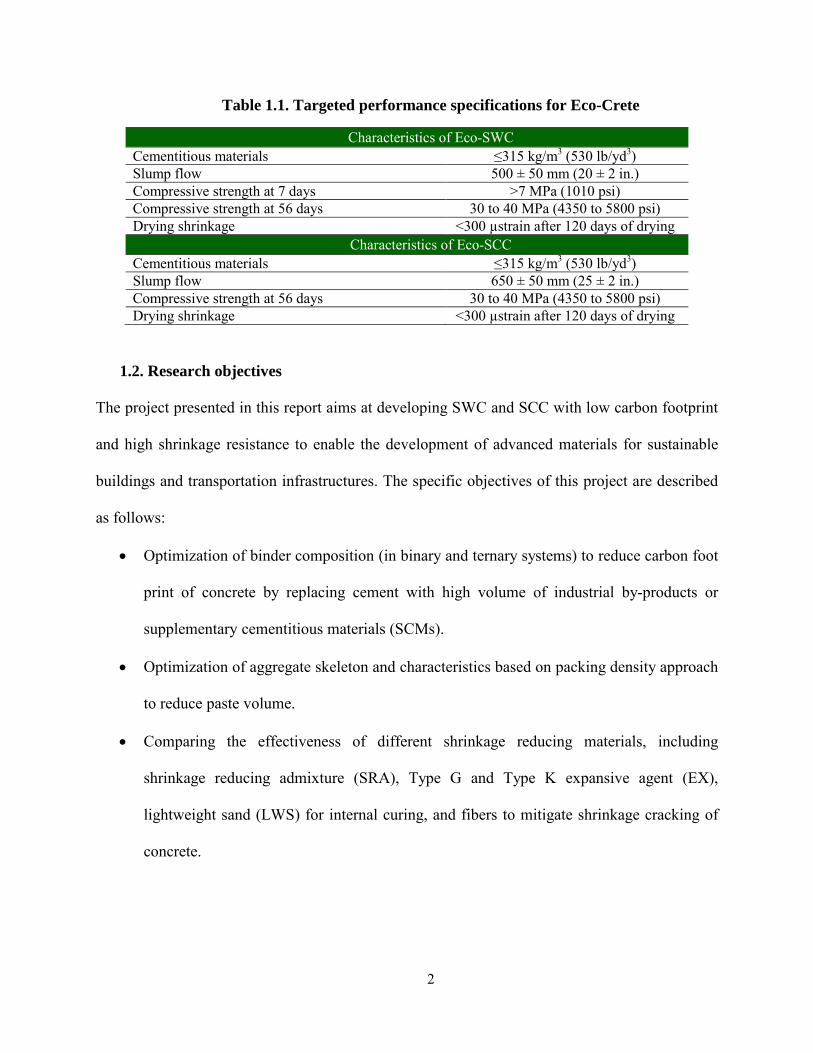
which has high resistance to shrinkage cracking. Table 1.1 summarizes the performance
specifications that are required for this novel concrete material.
2
Table 1.1. Targeted performance specifications for Eco-Crete
Characteristics of Eco-SWC Cementitious materials ≤315 kg/m3 (530 lb/yd3) Slump flow 500 ± 50 mm (20 ± 2 in.) Compressive strength at 7 days >7 MPa (1010 psi) Compressive strength at 56 days 30 to 40 MPa (4350 to 5800 psi) Drying shrinkage <300 µstrain after 120 days of drying
Characteristics of Eco-SCC Cementitious materials ≤315 kg/m3 (530 lb/yd3) Slump flow 650 ± 50 mm (25 ± 2 in.) Compressive strength at 56 days 30 to 40 MPa (4350 to 5800 psi) Drying shrinkage <300 µstrain after 120 days of drying
1.2. Research objectives
The project presented in this report aims at developing SWC and SCC with low carbon footprint
and high shrinkage resistance to enable the development of advanced materials for sustainable
buildings and transportation infrastructures. The specific objectives of this project are described
as follows:
• Optimization of binder composition (in binary and ternary systems) to reduce carbon foot
print of concrete by replacing cement with high volume of industrial by-products or
supplementary cementitious materials (SCMs).
• Optimization of aggregate skeleton and characteristics based on packing density approach
to reduce paste volume.
• Comparing the effectiveness of different shrinkage reducing materials, including
shrinkage reducing admixture (SRA), Type G and Type K expansive agent (EX),
lightweight sand (LWS) for internal curing, and fibers to mitigate shrinkage cracking of
concrete.

3
• Producing new class of crack-free environmentally friendly concrete materials with low
cracking potential and various consistency; namely Eco-SCC and Eco-SWC for building
and transportation infrastructure applications.
1.3. Research methodology
The research project divided into four tasks as presented below:
Task I: Literature review
The purpose of this task is to review relevant literature, specifications, current practices, and
other information relative to the development of crack-free Eco-Crete. This literature review
included the effect of binder composition and aggregate characteristics on rheology, stability,
mechanical properties, and durability of SWC and SCC mixtures. Particular attention was given
to means to mitigate shrinkage and early-age cracking (e.g. autogenous, drying, and restrained
shrinkage) of cement-based materials.
Task II: Experimental program
A comprehensive investigation was undertaken to evaluate the influence of mixture
proportioning and constitutive material characteristics on various concrete properties, including
workability, rheology, mechanical properties, shrinkage, and durability. This task consists of four
subtasks, as described below:
Subtask II-1 Optimization of binder composition
This subtask focuses on the optimization of the binder composition based on the packing density
approach to achieve minimum water demand and increase mechanical properties of blended
cement paste. Different types of binary and ternary blends of SCMs were used in various
replacement levels to optimize the binder composition based on the packing density of powder

4
materials, minimum water demand of cement paste, and appropriate compressive strength of the
blended cement paste.
Subtask II-2 Optimization of aggregate characteristics
The effect of various physical characteristics of coarse and fine aggregates, including shape,
texture, PSD, and sand-to-total aggregate ratio (S/A) on the packing density of aggregate
skeleton was evaluated. Aggregate type and S/A that yield the highest packing density were
selected to develop the Eco-SCC and Eco-SWC novel materials.
Subtask II-3 Comparison of various shrinkage reducing strategies
This subtask aimed at evaluating the effect of different shrinkage reducing materials, including
EX (calcium sulfoaluminate-based and calcium oxide-based), SRA, LWS for internal curing, and
initial moist-curing period (MCP) on autogenous shrinkage, drying shrinkage, and mechanical
properties of mortars. A factorial design approach was employed to quantify the effect of the
various shrinkage reducing materials on mechanical properties and shrinkage. The factorial
design analysis modeled the relation between the considered variables and targeting response,
and the estimated coefficient of each factor was determined.
Subtask II-4 Development of crack-free Eco-Crete
The aim of this subtask was to develop and optimize Eco and crack-free high performance
materials to meet the targeted properties presented in Table 1.1. Based on the obtained results
from Subtasks II-1, II-2, and II-3, the optimized binder compositions, aggregate, and shrinkage
reducing strategies were used to design crack-free Eco-Crete. The first part of the optimization
was to evaluate the effect of six binder compositions selected from Subtasks II-1 on shrinkage,

5
mechanical properties, and durability of Eco-SWC mixtures. The second part aimed at assessing
the influence of shrinkage reducing strategies selected from Subtasks II-3 on key engineering
properties of Eco-SCC mixtures. These properties include workability, rheology, shrinkage,
mechanical properties, cracking resistance, and durability.
The outline of the research project is presented in Figure 1.1.
Figure 1.1. Outline of the research investigation

6
2. LITERATURE REVIEW
2.1. Introduction
In general, HPC is characterized by high content of cementitious materials and/or fillers. In case
of highly flowable HPC, such as SCC, a high paste volume is also required to increase
flowability, passing ability, and segregation resistance. In the case of SCC, the content of
cementitious materials and fillers usually ranges between 425 to 550 kg/m3 (720 to 930 lb/yd3).
The high binder content along with low w/cm in HPC can result in higher material cost and
greater risk of thermal and drying shrinkage cracking, thus reducing service life of the structure.
When induced tensile stresses exceed the tensile strength of the material, cracking occurs. The
risk of early-age cracking in concrete infrastructures, such as pavement and bridge decks,
increases the ingress of various deleterious substances that can lead to deterioration and potential
structural deficiencies.
Eco-Crete is an environmentally friendly concrete in which the total binder content is
substantially lower than that used for HPC (Wallewik et al., 2010). Given the lower amount of
binders and higher water content needed to increase the paste volume, the mix design of Eco-
Crete involves typically high w/c. This can lead to greater risk of bleeding and segregation
compared to typical HPC. Therefore, special attention is needed in the selection of material
constituents and mix design to produce stable and robust Eco-Crete mixtures that can meet the
required performance specifications.
An essential step of producing Eco-Crete is to enhance the packing density of the aggregate
skeleton. The increase in aggregate packing reduces water demand, thus leading to greater

7
strength. For a given paste volume, increasing the packing density can improve workability due
to the increase in the excess paste thickness around aggregate particles (Kwan and Li, 2012). In
other words, for a given workability, the increase in packing density of aggregate can reduce the
minimum paste volume which is essential for the mix design of ecological concrete.
The use of SCMs as a partial replacement for Portland cement plays a significant role in reducing
cost and carbon footprint of concrete while enhancing the required rheology, mechanical
properties, and durability of the material. Another important factor in designing Eco-Crete is to
enhance the packing density characteristics of the binder to reduce water demand, thus leading to
reducing cement content and need for dispersive admixture.
Given the higher water content required to increase the paste volume of Eco-Crete, such
materials develop higher drying shrinkage, leading to higher risk of cracking. The risk of
cracking can be evaluated by understanding the shrinkage behavior. A number of parameters can
influence the shrinkage cracking potential of concrete, including mix design, binder type and
content, aggregate type and content, fiber type and volume, and use of chemical admixtures.
Therefore, it is important to evaluate the effect of these material constituents and mixture
proportioning on the resistance of cement-based material to early-age cracking.
Based on the above mentioned parameters which can significantly affect the mix design and
selection of material constituents of crack-free Eco-Crete, the literature review presented here
focused on: (1) evaluating the effect of SCMs on packing density, minimum water demand,
workability, rheology, shrinkage, mechanical properties, and durability of concrete; (2)
reviewing the effect of aggregate characteristics, including shape, texture, and PSD on packing
density, rheology, stability, and mechanical properties of concrete; and (3) reviewing studies

8
dealing with factors and materials influencing autogenous, drying, and restrained shrinkage, as
well as shrinkage cracking tendency of cement-based materials.
2.2. Supplementary cementitious materials (SCMs)
One of the major strategies to reduce CO2 emission of cement-based materials is to substitute
some of the cement by SCMs. Depending on their physical properties (particle gradation and
shape) or chemical composition, SCMs will have either hydraulic activity and/or a pozzolanic
activity. Three types of SCM are commonly used in the construction of structures and
infrastructures: blast furnace slag (SL), fly ash (FA), and silica fume (SF). The effect of such
SCMs on fresh and hardened properties of concrete are reviewed in the next section.
2.2.1. Effect of SCMs on fresh properties
Workability and rheological properties
Fly ash (FA) is one of the most common SCMs used in concrete. The use of FA can enhance
rheology given the lubricating effect of spherical particle shape and smooth surface
characteristics which tend to reduce friction between solid particles. For a given cementitious
material content, partial substitution of cement with FA results in an increase in the paste volume
due to the lower specific gravity of FA compared to Portland cement. The higher paste volume
provides greater plasticity and cohesiveness to the concrete (Ramseyer and Kiamanesh, 2009). In
general, Class C FA has a higher fraction of fine particles smaller than 10 μm, which
significantly enhances the workability of mixture. Kwan and Chen (2013) reported that for a
given w/cm, the flow-spread and flow rate of grout mixtures increase as the superfine FA content
increases up to 40%. Hwang and Khayat (2006) reported that, regardless of the type of HRWRA,
concrete equivalent mortars (CEM) made with ternary blends of 25% SL and 5% SF necessitated
the lowest minimum water demand in CEM with w/cm of 0.42. This can be due to greater

9
packing density and less water adsorption of such blended cement compared to Portland cement.
Similarly, SCC mixtures made with the ternary blended cement had lower HRWRA demand.
In general, concrete prepared with SF exhibits higher cohesiveness and lower tendency to
segregation compared to concrete made with 100% cement. Khayat et al. (2008) investigated the
effect of various types of SCMs on plastic viscosity and yield stress for grout mixtures. Their
results showed that the partial replacement of cement by FA, SF or SL increased the plastic
viscosity, regardless of the dosage of HRWRA. In the case of ternary systems, the combination
of 20% FA with 40% SL resulted in the highest increase in viscosity (90%) among the tested
mixtures.
Packing density
The packing density characteristics of the cementitious materials have marked influence on the
performance of cement-based materials. Packing density in concrete is usually dominated by
gravitation and shear forces between the particles. However, for small particles the presence of
electrostatic and van der Waals forces at the particle surfaces cause agglomeration, thus
loosening packing of such particles. The solution to this problem is to modify the surface forces
by adding surface active agents, such as water and superplasticizers to measure the wet packing
density of cementitious materials (Wong and Kwan, 2008). Lange et al. (1997) reported that
improving the packing density of the cementitious materials by blending cement with fine SL
can significantly reduce the water demand and enhance the overall properties of the mixture.
Park et al. (2005) showed that FA, SL, and SF can fill the voids between cement particles and
increase the amount of excess water, thus enhancing the rheological properties of the paste.
Kwan and Wong (2008) reported that the ternary blends of cement with FA and SF can
significantly enhance the wet packing density of grout mixtures. The variation of the packing
10
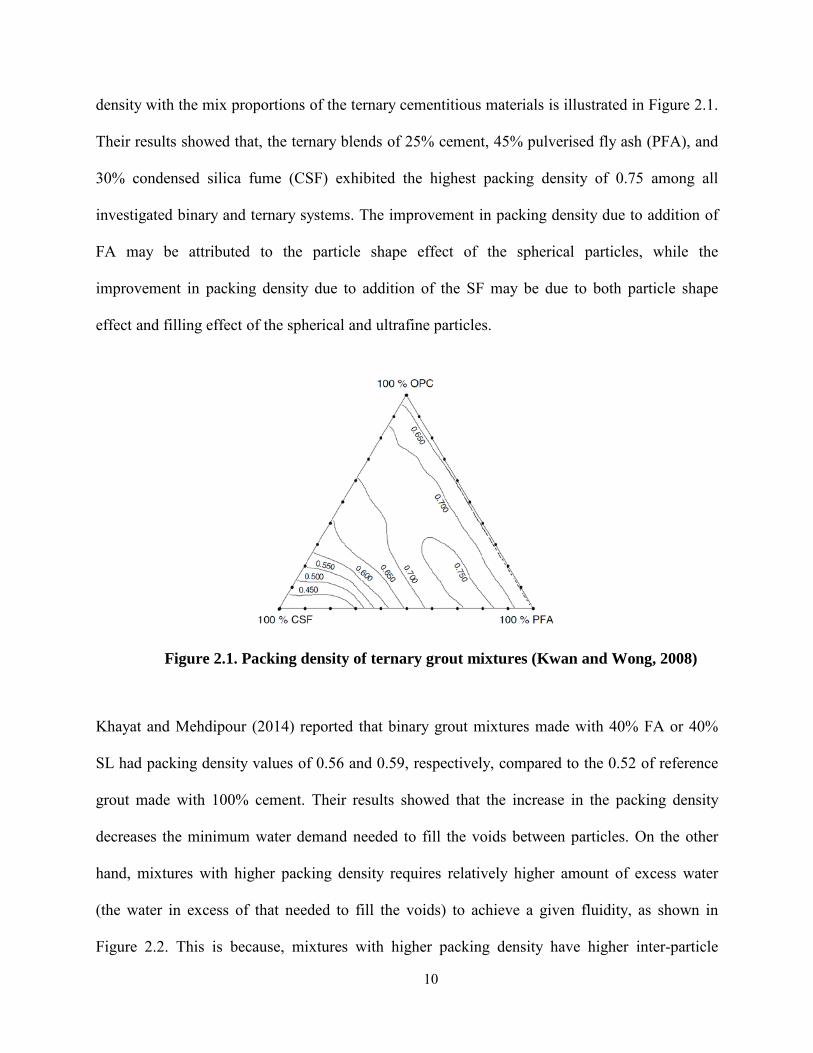
density with the mix proportions of the ternary cementitious materials is illustrated in Figure 2.1.
Their results showed that, the ternary blends of 25% cement, 45% pulverised fly ash (PFA), and
30% condensed silica fume (CSF) exhibited the highest packing density of 0.75 among all
investigated binary and ternary systems. The improvement in packing density due to addition of
FA may be attributed to the particle shape effect of the spherical particles, while the
improvement in packing density due to addition of the SF may be due to both particle shape
effect and filling effect of the spherical and ultrafine particles.
Figure 2.1. Packing density of ternary grout mixtures (Kwan and Wong, 2008)
Khayat and Mehdipour (2014) reported that binary grout mixtures made with 40% FA or 40%
SL had packing density values of 0.56 and 0.59, respectively, compared to the 0.52 of reference
grout made with 100% cement. Their results showed that the increase in the packing density
decreases the minimum water demand needed to fill the voids between particles. On the other
hand, mixtures with higher packing density requires relatively higher amount of excess water
(the water in excess of that needed to fill the voids) to achieve a given fluidity, as shown in
Figure 2.2. This is because, mixtures with higher packing density have higher inter-particle

11
friction, and so it needs more water to overcome the interlock between particles and provide
shear deformation.
Figure 2.2. Effect of packing density on excess water (Khayat and Mehdipour, 2014)
Setting time and air content
In general, both Class F and Class C FAs extend the time of setting of concrete. The effect of SL
on concrete setting time depends on curing temperature, replacement level, and composition. The
SL replacement at a lower temperature delays the setting time, especially for SL replacement
higher than 40% (Brooks et al., 2000). Hooton (2000) reported that with 50% SL replacement,
the setting time can be extended 1 to 2 hours at low temperatures (less than 15 °C). On the other
hand, for temperature greater than 20 oC, 50% SL replacements decreased the setting time of
concrete (Eren et al., 1995).
The composition of the SCMs may have a significant influence on the effectiveness of air-
entraining admixture (AEA) and stability of air voids in plastic concrete. In general, materials
with smaller particle size tend to increase the dosage of AEA required for a given air content

12
(Lawler et al., 2007). The use of SF has a significant effect on the AEA demand, which in most
cases increases with an increase in the amount of SF in use. Using SL may also reduce air
content for a given dosage of AEA (ACI Committee 234 1996).
2.2.2. Effect of SCMs on hardened properties
Mechanical properties
Generally, mixtures made with Class F FA exhibit slower strength development than similar
mixtures prepared with only Portland cement. The 28-day mechanical properties may be lower
for concrete containing FA, particularly Class F FA, however, FA continues to hydrate over
time, and the long-term strength of FA concrete can be equal as those of similar mixtures made
with 100% Portland cement (Lawler et al., 2007). Depending on the mixture proportions,
chemical composition, and Blain fineness, some FAs may require up to 90 days to exceed a 28-
day strength of control mixture. Jaturapitakkul et al. (2002) compared the compressive strength
of concrete made with coarse FA particles (90-100 μm) with those of concrete made with fine
FA (3.8 μm). They concluded that concretes prepared with 15% to 50% fine FA can achieve
higher strength compared to concrete mixture containing coarse FA. Concrete proportioned with
Class C FA generally develops higher early-age strength than concrete with Class F FA
(Kosmatka and Panarese, 2002, Uysal and Akyuncu, 2012). However, at later ages (beyond 28
days), concrete made with Class C FA may exhibit lower strength development compared to
concrete containing Class F FA. Şahmaran et al. (2009) reported that substitution of cement by
FA can reach up to 60% to 70% for SCC with 28-day compressive strength of 33 to 40 MPa
(4800 to 5800 psi).
Ternary SCM blends of SF or SL with FA can be used to enhance the rate of strength
development at early-age. Khayat et al. (2008) reported that the combination of 3% SF with

13
either 10% or 20% FA resulted in higher 28-day strength compared to the reference grout made
with 100% cement and w/cm of 0.40. Hwang and Khayat (2009) pointed out that for SCC
mixtures made w/cm of 0.35 and 0.42, the use of 25% SL and 5% SF resulted in 15% to 22%
higher compressive strength at 28 days compared to those prepared with 25% Class F FA and
5% SF. This can be due to the relatively high reactivity of the SL compared to the FA. The
modulus of elasticity results of such mixtures made with various binder combinations had similar
trends as those of compressive strength results for both of w/cm of 0.35 and 0.42.
Transport properties
The use of proper type and content of SCMs can fill the voids between cement particles, and
thus, enhance the density of the microstructure. In addition, SCMs may react with calcium
hydroxide to form secondary hydration products which can block the capillary pores in the
concrete (Lawler et al., 2007). Hwang and Khayat (2009) showed that for mixtures prepared with
w/cm of 0.35 and 0.42, the use of 25% SL and 5% SF led to 8% higher frost durability compared
to those prepared with the 25% Class F FA and 5% SF. Şahmaran et al. (2009) reported that,
regardless of FA type, SCC mixtures containing FA exhibited lower chloride-ion migration
compared to similar mixture made with 100% cement. Their results also indicated that sorptivity
of the concretes containing Class C and Class F FAs decreased with the increase in FA content.
Hwang and Khayat (2009) reported that for SCC mixtures made with w/cm of 0.35 and 0.42, the
use of the quaternary blend of FA, SL, and SF resulted in substantial reduction in capillary
porosity and critical pore diameter. This can be due to greater synergistic effect of using three
supplementary cementitious materials. El-Chabib and Syed (2012) reported that, for mixtures
made with binder content of 450 kg/m3 (760 lb/yd3) and w/cm of 0.37, the use of binary or
ternary blends of SL and SF resulted in superior resistance to chloride ingress from 200 to 2100

14
coulombs compared to 3710 coulombs for the control mixture. Yurdakul et al. (2013) reported
that for a given w/b, the increase in the replacement level of Class F FA in binary mixtures can
lead to higher electrical resistivity, whereas binary mixtures with Class C FA exhibited similar
results to control mixtures. They reported that binary mixtures with slag cement exhibited the
greatest resistivity among all evaluated mixtures. In their experimental program, in total 54
mixtures were prepared with a binder content of 356 kg/m3 (600 lb/yd3) and w/cm of 0.40 and
0.45.
Shrinkage and cracking resistance
The shrinkage of the concrete is the function of several parameters, such as the paste volume,
water content, cement type and content, pore size distribution, and aggregate type and content.
Due to the lower specific gravity of the FA, the addition of FA increases the paste volume which
may increase the drying shrinkage. Sounthararajan and Sivakumar (2013) reported that concrete
made with binary blend of cement and FA had higher resistance to drying shrinkage. For a given
workability, mixture containing FA has lower water demand which can contribute to lower
drying shrinkage of concrete mixtures (Tangtermsirikul, 1995).
Lee et al. (2006) reported that for the given w/cm, autogenous shrinkage of concrete made with
SL increases as the replacement level of SL increases from 0 to 50%. On the other hand, partial
substitution of cement by SL can result in lower drying shrinkage due to the greater density of
microstructure and lower capillary porosity (Li and Yao, 2001). Li et al. (2010) investigated the
autogenous shrinkage and the pore structure of the hardened cement paste with ternary blends of
FA and SF, or FA and SL. Their results indicated that the use of FA can reduce autogenous
shrinkage, but using SF can increase autogenous shrinkage.

15
The effect of SCMs on cracking resistance of concrete under restrained shrinkage is not well
known. A delay in the early-age hydration of the concrete may lower cracking potential due to
the increase in the early-age creep and higher stress relaxation. Replacement of cement with
Class F FA is typically more effective in delaying the strength gain compared to Class C FA or
SL replacement.
Shrinkage cracking may be reduced if the improved workability of the mixture containing the
SCM contributes to a decrease in water demand and paste volume (Lawler et al., 2007). Li et al.
(1999) indicated that the use of SF as a partial replacement of cement not only increases the
cracking tendency, but also increases the crack width in the restrained shrinkage test. Hwang and
Khayat (2010) evaluated the cracking potential of SCC made with two w/cm values of 0.35 and
0.42, and three blended binder types, including FA, SL, and SF. Instrumented shrinkage ring test
results were compared with those of HPC and conventional concrete (CC) mixtures. Test results
revealed that SCC mixtures exhibited relatively higher cracking potential than the HPC and CC
mixtures. For example, SCC had shorter cracking time (restrained shrinkage ring test) of 4 to 9
days compared with 10 to 14 days for the CC and HPC mixtures due to higher drying shrinkage
of the SCC. The authors also pointed out that relatively high tensile creep coefficient (ratio of
creep strain to elastic strain) for the SCC was not enough to compensate for the large difference
in shrinkage between SCC and either HPC or CC mixtures.
2.3. Aggregates
The volume of fine and coarse aggregates often represents more than 60% of total concrete
volume. Therefore, the characteristics of aggregate, such as shape, angularity, texture, PSD, fine
particle content, S/A, and packing density significantly affect fresh and hardened properties of
concrete. In general, aggregate blends with well-graded, rounded, and smooth particles require
16
less paste volume to yield a given workability compared to those with flat, elongated, angular,
and rough particles. Concretes made with combined aggregate of continuous grain size
distribution exhibit higher packing density, and thus requiring less cement demand for a given
workability. Therefore, the optimization of aggregate characteristics plays a major factor to
produce cost-effective and durable concrete.
2.3.1. Particle packing and gradation
The optimization of the aggregate skeleton for conventional concrete is reported by several
studies (Chouicha, 2006, de Larrard and Buil, 1987, de Larrard, 1999). Their results showed that
the packing density of aggregate skeleton is an important parameter to optimize the mixture
composition for conventional concrete. Several studies (de Larrard, 2000, Anderson, 1997,
Quiroga and Fowler, 2004) indicated that mixtures with good overall performance have packing
densities close to the maximum packing density of aggregate. The packing density is an
important factor of mixture optimization, but the optimization of HPC mixtures involves several
other factors such as workability, rheology, stability, and placeability. Khayat et al. (2000) found
that coarse aggregate with lightly discontinuous PSD yielded greater packing density of SCC
than similar SCC with more continuous PSD of aggregates which had a lower packing density.
The higher packing density resulted in lower HRWRA demand. Kwan and Mora (2001) also
reported that maximum particle packing density does not necessarily ensure a workable concrete.
They reported that a dense particle structure has higher inter-particle friction which can lead to a
harsh concrete.
There has been many attempts to provide guidelines for ideal gradations which ensure fresh and
hardened requirements. The most popular methods to optimize aggregate gradation include the
power chart, the coarseness factor chart, and the 8-18 band approach.

17
Fuller and Thompson (1907) showed that a continuous gradation of aggregate in concrete can
help to improve concrete properties. Based on the investigation of Fuller and Thompson (1907)
and Andreasen and Andersen (1929), a minimal porosity can be theoretically achieved by using
ideal gradation curve as shown in Eq. (2-1).
max
( )
=
qdP d
d ( 2-1)
where ( )P d is a fraction of the particle size smaller than diameter d , and maxd and q are the
maximum particle size diameter and distribution modulus, respectively. The Federal Highway
Administration adopted the 0.45 power chart in the 1960s for use in the asphalt industry, and the
chart was later adjusted for the concrete industry by reducing the optimum percentage of
materials finer than the 2.36 mm (No. 8) sieve to account for the fine cementitious materials.
Funk and Dinger (1994) modified the Andreasen and Andersen (A&A) equation using the
minimum particle size concept, as follows:
min
max min
( ) −=
−
q q
q q
d dP dd d
( 2-2)
where mind is the minimum particle size. The modified A&A packing model has already been
successfully employed to optimize the mix design of conventional concrete (Hüsken, 2010), SCC
(Hunger, 2010, Mueller et al., 2014), and lightweight concrete (Yu et al., 2013, Spiesz, 2013).
Different types of concrete can be designed using Eq. (2.2) by applying different values of q,
which varies with the proportioning between the fine and coarse particles in concrete to ensure
required fresh and hardened properties. It should be noted that, these ideal gradation curves do
18
not take into account the physical properties of aggregate, including shape and surface texture.
The particle shape and texture, however, have a considerable influence on packing density,
especially, when different types and characteristics of aggregates are combined (Walker, 2003,
Zheng et al., 1990).
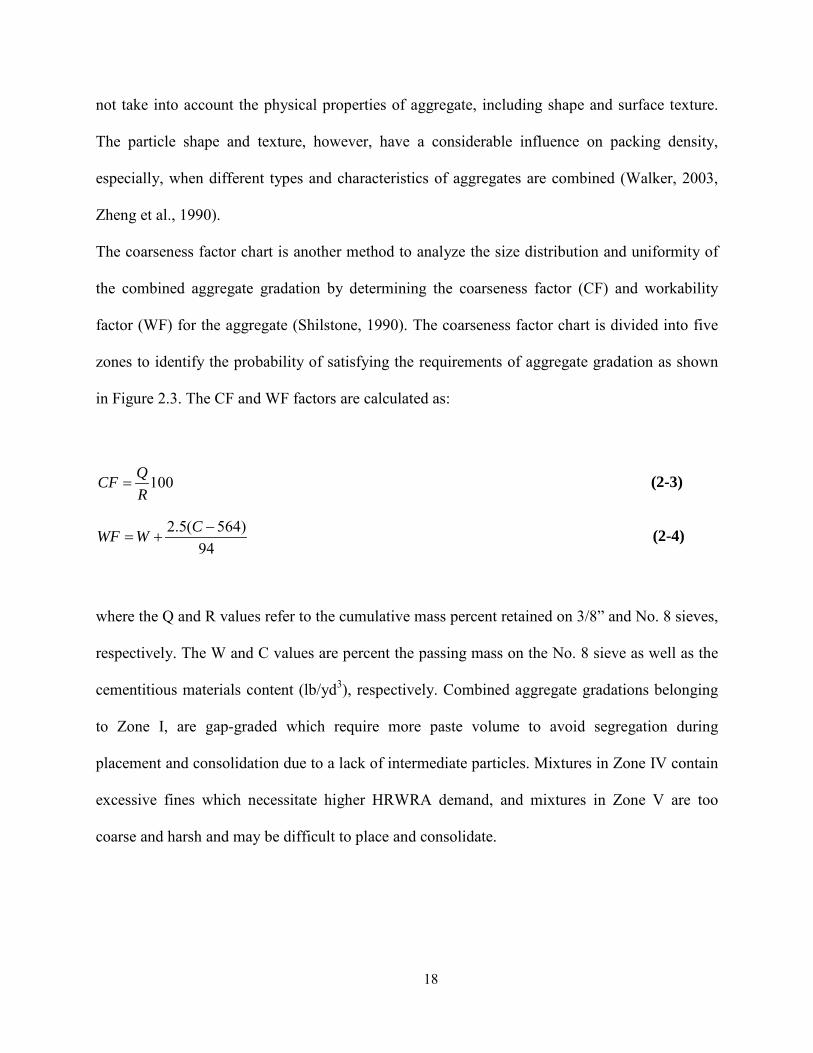
The coarseness factor chart is another method to analyze the size distribution and uniformity of
the combined aggregate gradation by determining the coarseness factor (CF) and workability
factor (WF) for the aggregate (Shilstone, 1990). The coarseness factor chart is divided into five
zones to identify the probability of satisfying the requirements of aggregate gradation as shown
in Figure 2.3. The CF and WF factors are calculated as:
100=QCFR
( 2-3)
2.5( 564)94−
= +CWF W ( 2-4)
where the Q and R values refer to the cumulative mass percent retained on 3/8” and No. 8 sieves,
respectively. The W and C values are percent the passing mass on the No. 8 sieve as well as the
cementitious materials content (lb/yd3), respectively. Combined aggregate gradations belonging
to Zone I, are gap-graded which require more paste volume to avoid segregation during
placement and consolidation due to a lack of intermediate particles. Mixtures in Zone IV contain
excessive fines which necessitate higher HRWRA demand, and mixtures in Zone V are too
coarse and harsh and may be difficult to place and consolidate.

19
Figure 2.3. Coarseness factor chart
The third method that can be used to optimize aggregate gradation is the 8-18 distribution chart
proposed by Holland (1990). The method specifies the limits corresponding to the 8% minimum
and 18% maximum values of the total combined fine and coarse aggregates retained on each
sieve. The aim of this method is to improve concrete performance, durability, and workability for
critical structural elements, like high tolerance floor slabs. The results showed that concrete
optimized with this method required less paste, thus leading to lower shrinkage (Shilstone,
1990).
2.3.2. Particle optimization
Koehler (2007) reported that aggregate gradation as well as shape and angularity of aggregate
significantly affect SCC characteristics. In general, the 0.45 power curve of the combined
aggregate gradation can result in an increase in packing density, thus leading to lower paste for a
given workability. SCC made with coarser aggregate gradation may exhibit lower HRWRA
demand and plastic viscosity, but may be harsh and less cohesive due to a lack of fine particles.
Finer gradations contribute to higher HRWRA demand and plastic viscosity, but reduced

20
harshness of SCC mixtures. Gap-graded mixtures can result in higher packing density and lower
HRWRA demand, but they may increase the susceptibility to aggregate segregation. SCC
prepared with rounded aggregates can develop higher packing density and less inter-particle
friction, which results in lower HRWRA demand and improved passing ability.
Brouwers and Radix (2005), and Hunger and Brouwers (2006) reported that the modified
Andreasen packing model with q values between 0.25 and 0.30 yields appropriate PSD for
design of SCC. Mueller et al. (2014) recently used the gyratory intensive compaction test to
determine the packing density of all solid particles of the SCC mixture constituents, including
aggregate and cementitious materials. Their results showed that the modified A&A model with q
of about 0.27 fits reasonable well to express the PSD of all solids on SCC with a low powder
content. An improved particle packing with an enhanced lattice effect can minimize the lubricant
demand and enhance the stability of the SCC mixtures. Nanthagopalan and Santhanam (2012)
indicated that for a given paste volume and paste composition, when packing density was
increased from 0.64 to 0.68, the slump flow increased from 420 to 615 mm (16.5 to 24.2 in.) and
the slump flow with J-ring increased from 380 to 600 mm (15 to 23.6 in.). Positive influence of
packing density was also observed on the hardened properties with an increase in compressive
strength from 40.5 to 45.6 MPa (5880 to 6600 psi).
Hüsken and Brouwers (2008) reported that a general relationship between the distribution
modulus of the modified A&A model and the packing fraction of earth-moist concrete can be
derived. They results showed that the highest packing fractions of such concrete can be achieved
for a distribution modulus of 0.35. Yu et al. (2014) reported that by enhancing packing density, it
is possible to design ultra-high performance fiber reinforced concrete with a relatively low
binder content. Using the modified A&A model, it is possible to produce a dense and

21
homogeneous skeleton of such concrete with relatively low binder content of about 650 kg/m3
(1100 lb/yd3) to achieve 28-day compressive and flexural strengths of 150 MPa (21750 psi) and
30 MPa (4350 psi), respectively.
Wong and Kwan (2008) developed a wet packing method for measuring the packing density of
cementitious materials under wet condition. This method has been extended to measure the
packing density of fine aggregate and combination of fine and coarse aggregate (Fung et al.,
2009). Kwan and Fung (2009) showed that the packing density of fine aggregate is significantly
higher and less sensitive to compaction under wet condition compared to the dry condition.
Kwan et al. (2012) reported that the optimum fine-to-total aggregate ratio for achieving
maximum packing density is relatively lower under wet condition compared to the measured
packing density under dry condition.
2.4. Shrinkage and cracking potential
The shrinkage cracking potential of concrete depends on the development of mechanical
properties and visco-elastic properties of the material. These properties vary with mixture
proportioning and raw material characteristics, including binder type and content, aggregate
content and type, fiber type and volume, and chemical admixtures. SCC mix design often
involves the use of high paste volume and low coarse aggregate content, thus leading to
relatively higher shrinkage compared to conventional concrete. On the other hand, SCC mix
design containing higher paste volume may have a positive effect on restrained shrinkage
cracking due to the greater stress relaxation in tension (Hwang and Khayat, 2010).

22
2.4.1. Factors affecting shrinkage and cracking
Effect of cement and w/cm
Type of cement has a considerable effect on the cracking potential. In general, Type II cement
reduces cracking potential due to the lower thermal gradient during the early-stage of hydration.
Type III cement, on the other hand, may considerably increase cracking potential due to the rapid
setting and higher heat of hydration. Higher early-age stiffness also results in lower stress
relaxation (Mehta and Monteiro, 2006). In most studies, given the higher plastic and autogenous
shrinkage as well as lower stress relaxation at early-age, concrete mixtures containing SF
exhibited higher risk of shrinkage cracking. Brown et al. (2001) show that concrete made with
low w/cm tends to an increase in early-age shrinkage cracking. This is mainly due to the higher
heat of hydration, autogenous shrinkage, and stiffness which result in higher magnitudes of stress
development and lower stress relaxation.
Effect of aggregate
Babaei and Purvis (1995) evaluated the effect of mineralogy of aggregate on the drying
shrinkage. Concrete containing sandstone coarse aggregate (low stiffness) was found to have
higher drying shrinkage than that made with dolomite coarse aggregate (high stiffness).
Optimization of aggregate packing and PSD to achieve a higher aggregate content can result in
higher stiffness of concrete and lower drying shrinkage (Hwang and Khayat, 2008). Lightweight
aggregate have higher porosity and generally lower stiffness than normal weight aggregates. Pre-
wetted lightweight aggregate (LWA) serves as internal water reservoirs which can reduce
autogenous and drying shrinkage. The efficiency of the LWA varies with the pore structure of
aggregate. Generally, larger LWA has a larger pore structure, which results in more efficient
internal curing (Hammer et al., 2004). However, it should be noted that well dispersed LWA

23
provides efficient internal curing. This is similar case that properly dispersed air voids improves
durability. Several studies proved that smaller LWA are better distributed than larger LWA
(Bentz and Snyder, 1999, Bentz et al., 2005).
Şahmaran et al. (2009) studied the effect of replacement rate of saturated lightweight sand
(LWS) as an internal curing agent on the shrinkage and mechanical behavior of engineered
cementitious composites. The addition of saturated LWS was found to be very beneficial in
controlling the development of autogenous shrinkage for mixtures made with w/cm of 0.27.
They reported that, 67% reduction in autogenous shrinkage at 28 days compared to control
mixture can be attained with 20% substitution of normal sand by saturated LWS. In addition, the
use of 20% LWS delivered 37% reduction in drying shrinkage at 90 days compared to control
specimens. Henkensiefken et al. (2009) investigated the influence of replacement rates of
saturated LWA on the performance of self-curing concrete. The inclusion of a sufficient volume
of pre-wetted LWA can significantly reduce autogenous shrinkage and delay the elapsed time to
cracking. They concluded that mixture containing low volume of LWA exhibited similar free
shrinkage and cracking behavior to the control mixture without any LWA. This may be due to
the fact that in the case of low replacement rate, the LWA particles are dispersed too far from
each other to effectively supply internal curing water to the paste.
De la Varga et al. (2012) investigated the application of internal curing for mixtures containing
low w/cm and high volumes of FA which are more susceptible to high shrinkage and cracking.
They reported that the slower hydration reaction in the high volume FA mixtures results in less
initial autogenous shrinkage deformations at early ages. However, due to the pozzolanic reaction
and refining the porosity, the rate of autogenous shrinkage increases in the FA mixtures at later
ages. This behavior can increase their cracking potential at later ages. Their results showed that

24
the use of internal curing can be a beneficial method to develop expansion and reduce tensile
stress development caused by restrained shrinkage for such type of concrete.
Golias et al. (2012) studied the performance of LWA with different initial moisture content.
Their results indicated that the oven-dried LWA is able to absorb water from the paste prior to
setting, then absorbed water will be returned to the system as internal curing water. When
mixture proportion adjustments are properly made to account for the water absorbed by the oven-
dried LWA before setting, the mixture can provide internal curing benefits. Cortas et al. (2014)
also evaluated the effect of the water saturation of limestone aggregates on the shrinkage and
early-age cracking potential of conventional concrete. Three degrees of saturation were applied,
including 0% (dry aggregates), 50% (partially saturated aggregates) and 100% (saturated
aggregates). The test results indicated that the early-age shrinkage behavior and mechanical
properties of the concrete strongly depend on the water saturation level of aggregates. Concrete
made with partially saturated aggregates does not have intermediate behavior between concrete
made with dry aggregates and saturated aggregates. Mixture made with partially saturated
aggregates did not take advantage of the internal curing compared to the mixture prepared with
saturated aggregates.
Effect of shrinkage reducing admixture
Shrinkage reducing admixtures are used to reduce the rate and magnitude of both autogenous and
drying shrinkage of concrete. Several studies have shown that the use of SRA in concrete
reduced the shrinkage and cracking potential (Weiss and shah, 2002, Radlinska et al., 2008,
Rajabipour et al., 2008). Weiss et al. (1998), Hwang and Khayat (2008) showed that the use of
SRA significantly reduced drying shrinkage and increased the elapsed time to cracking by
reducing the rate and magnitude of the shrinkage.

25
Tritsch et al. (2005) studied the shrinkage and cracking behavior of concrete using the restrained
ring and free shrinkage tests and showed that the ultimate free shrinkage and early-age cracking
potential increases with an increase in the paste volume of concrete. They recommended that the
SRA can be used to reduce shrinkage cracking to produce low cracking potential concrete.
Shah et al. (1992) evaluated the effect of three different SRAs on the restrained shrinkage using
the ring-type test. Restrained shrinkage was shown to decrease with the increase in SRA dosage,
thus resulting in a delay in shrinkage cracking. The incorporation of SRA also resulted in a
reduction in restrained shrinkage crack width. Weiss et al. (2002, 2003) reported that concrete
made with SRA significantly develops higher cracking resistance by reducing the magnitude and
rate of shrinkage. On the other hand, some studies (Folliard and Berke, 1997, Weiss et al., 2003)
found that the incorporation of SRA might cause a slight decrease in the compressive strength of
concrete.
Lura et al. (2007) investigated the effect of SRA on the plastic shrinkage cracking of mortars in
accordance with ASTM C 1579 test. They found that mortars containing SRA exhibited fewer
and narrower plastic shrinkage cracks compared to those made without any SRA. Given the
lower surface tension of the pore fluid in the mortars containing SRA results in less evaporation,
settlement, and capillary tension.
Effect of expansive cement
Expansive cements can lead to the early-age expansion which later counteracts the tensile
stresses developed by drying shrinkage. Type K expansive cement contains Portland cement and
calcium sulfoaluminate (CSA-based system) cement. The expansion is achieved through
formation of ettringite crystals. CSA-based cement also provides a sustainable alternative to
Portland cement by reducing CO2 emission during manufacturing. The other type of expansive

26
cement is Type G cement (CaO-based system) in which the formation of calcium hydroxide
(Ca(OH)2) crystals results in an expansion.
Effect of Fiber
Grzybowski and Shah (1990) evaluated the efficiency of different types and volumes of fibers on
the reduction in the shrinkage cracking potential of concrete using ring-type specimens. Concrete
mixtures were proportioned with steel fibers measuring 25 mm (1 in.) in length and 0.4 mm
(0.016 in.) in diameter as well as 19 mm (0.75 in.) fibrillated polypropylene fibers. The dosage
rates of the steel fibers were 0.25%, 0.5%, 1%, and 1.5%, by volume. These values were 0.1%,
0.25%, 0.5%, and 1% for the polypropylene fiber. Test results revealed that a steel fiber content
of 0.25% can substantially reduce the crack width resulting from restrained shrinkage. Such fiber
was more effective than polypropylene fiber.
Voigt et al. (2004) investigated the effect of different fiber types and geometry on shrinkage and
early-age cracking potential. Their results indicated that, for a given type of fiber, an increase in
the number of fibers increases their effectiveness to reduce cracking potential. They reported that
the steel fiber with flat end 30 mm was the best-performing reinforcement in prolonging the age
of the first crack and reducing the maximum crack width and proposed a formula for calculating
the average thickness of the lubricant layer surrounding fibers and aggregate particles. They
concluded that the correlation of the maximum crack width to the mortar thickness provides the
best measure to characterize the shrinkage cracking behavior of the steel fiber-reinforced
composites.
Hwang and Khayat (2008) compared the restrained shrinkage results of SCC mixtures made with
various synthetic fiber volumes. Two types of polypropylene synthetic fibers: a monofilament
fiber with a circular cross section measuring 50 mm (1.97 in.) in length and 0.67 mm (0.026 in.)

27
in diameter (SyF1) and straight fiber with a rectangular cross section measuring 40 mm (1.57 in.)
in length (SyF2). They pointed out that, regardless of fiber type, FR-SCC made with 0.25% and
0.50% fiber volume developed longer time to cracking than similar SCC made without any
fibers. This is due to the increase in the tensile creep coefficient resulting from the use of
synthetic fibers. Their results also indicated that the type of synthetic fiber appears to have a
considerable influence on the restrained shrinkage cracking potential. SCC made with 0.25%
SyF2 fiber exhibited a longer time to cracking of 8.3 days compared to 5.2 days for the same
SCC with 0.25% SyF1 fiber.
Effect of combined use of shrinkage reducing materials
Hwang and Khayat (2008) studied the effect of various shrinkage reducing materials on
shrinkage cracking of high-performance SCC designated for structural repair. A ring-type test
(ASTM C 1581) was used to evaluate the potential for restrained shrinkage cracking and tensile
creep behavior of the concrete. Their study showed that, an increase in SRA dosage led to
significant enhancement in the resistance to restrained shrinkage cracking. For example,
mixtures made with moderate and high concentrations of SRA (4 and 8 L/m3 [0.8 and 1.6
gal./yd3], respectively) exhibited considerably longer elapsed time before cracking of 13.3 and
20.7 days, respectively, compared to 8.8 days for similar SCC prepared without any SRA. The
elapsed time before cracking of SCC made with combined use of fibers and SRA was
approximately 2.5 times longer than that of the similar SCC prepared without SRA. This is
mainly due to the synergistic effect of fiber and SRA that can increase the tensile creep
coefficient and reduce the risk of cracking.
Passuello et al. (2009) evaluated the effect of combined use of fibers and SRA on shrinkage and
cracking potential of concrete mixtures. The risk of cracking was evaluated in accordance with

28
the standard ASTM C 1581, however, some geometry modifications were made. In their study,
the thickness of the concrete ring was increased from 38 mm (1.5 in.) suggested by the ASTM C
1581 to 50 mm (2 in.) to provide better situation for casting and vibration for the fiber reinforced
concrete made with macro fibers. They reported that the incorporation of SRA delays the time to
cracking and reduces the crack width by 40% compared to the control mixture. The addition of
fibers on the other hand, does not greatly increase elapsed time before cracking, but it can reduce
the crack width by about 70% and 90% by the use of micro and macro fibers, respectively. The
addition of SRA to the fiber-reinforced concrete produced a better cracking behavior, even when
the fiber dosage had been reduced.
Kassimi and Khayat (2013) investigated the effect of combination of fibers, SRA, and EX on
shrinkage cracking of SCC mixtures. The highest resistance to restrained cracking was obtained
with the SCC mixture made with steel fibers and EX with a elapsed time to cracking of 36 days.
Such concrete also exhibited the narrowest crack width of 83 μm (0.0033 in.).
Soliman and Nehdi (2014) evaluated the effect of SRA and wollastonite microfibers on the early-
age shrinkage behavior and cracking potential of ultra HPC. The combined use of wollastonite
microfibers and SRA in such concretes prolonged the time of cracking through synergistic effect
of reducing shrinkage strains and bridging micro cracks. They found that the use of wollastonite
microfibers can promote pore discontinuity, thus leading to lower mass loss and drying
shrinkage.
Meddah et al. (2011) evaluated the induced stress development during the autogenous shrinkage
of HPC mixtures prepared with combined use of EX and SRA. In this study, the self-induced
stress measurement was performed using reinforcing bar embedded in the center of a specimen
measuring 100 × 100 × 1400 mm to provide partial restraint to the concrete specimen. They

29
reported that a substantial reduction up to 50% of autogenous shrinkage and self-tensile stress
induced were obtained using a combination of SRA and EX for concrete with a w/cm of 0.15.
Meddah and Sato (2010) investigated the effect of different shrinkage reducing materials,
including binary system of SRA and EX and ternary system of internal curing provided by the
porous ceramic coarse aggregate and SRA and EX on autogenous shrinkage and internal self-
stress of HPC mixtures. Their results indicated that the ternary shrinkage reducing system
containing SRA, EX and 20% of the porous aggregate significantly mitigated the both
autogenous shrinkage and induced tensile stress compared to the binary curing system of SRA
and EX.

30
3. EXPERIMENTAL PROGRAM
3.1. Materials
Cementitious materials
In the study presented in this investigation, Type I Portland cement (C) was used. Class C FA
(CFA), Class F FA (FFA), SL, and SF were used for designing binary and ternary systems.
Figure 3.1 shows the PSD of cementitious materials.
Two commercially available expansive agents were used: Type K and Type G. Type K
expansive agent (Type K EX) contains Portland cement and calcium sulfoaluminate (CSA-based
system) cement. The expansion is achieved through formation of ettringite crystals. Type G
expansive agent (Type G EX) is CaO-based system in which the formation of calcium hydroxide
(Ca(OH)2) crystals results in an expansion. The physical and chemical characteristics of the
cementitious materials are given in Table 3.1.
Figure 3.1. PSD of cementitious materials

31
Table 3.1. Physical and chemical characteristics of cementitious materials and
expansive agents
Type I cement
Class C FA
Class F FA SL SF Type K EX Type G EX
SiO2, % 19.8 36.5 49.4 36.8 85 7.7 12.6
Al2O3, % 4.5 24.8 20.2 9.2 0.4 7 5.7
Fe2O3, % 3.2 5.2 15 0.76 0.5 1.2 1.9
CaO, % 64.2 28.1 6.8 37.1 50.1 62.60
MgO, % 2.7 5 1.08 9.5 0.1 0.1
SO3 3.4 2.5 2.12 0.06 26.0
Na2O eq., % 0.34 0.6 0.9
Blaine surface area, m2/kg 385 465 365 590
Specific gravity 3.14 2.71 2.45 2.86 2.3 2.9 3.1
LOI, % 1.5 0.5 0.95 2 2.1
Chemical admixtures
The chemical admixtures used in this study included a polycarboxylate-based HRWRA, a liquid-
based cellulose viscosity-enhancing admixture (VEA), and an synthetic-based air-entraining
agent (AEA). A commercially available SRA made of propylene glycol ethers was also
incorporated to mitigate shrinkage. The AEA and HRWRA dosages were adjusted to secure
fresh air volume of 6% ± 2% and initial slump flow of 500 ± 25 mm (20 ± 1 in.) and 660 ± 25
mm (26 ± 1 in.) for the SWC and SCC mixtures, respectively. Table 3.2 presents the
characteristics of the chemical admixtures.

32
Table 3.2. Characteristics of chemical admixtures
Solid content (%) Specific gravity HRWRA 23 1.05 VEA 1.5 1 AEA 12.5 1.01 SRA - 0.98
Fibers
Two types of fibers, including synthetic and steel fibers were used (Figure 3.2). The synthetic
fiber is straight monofilament fiber with a rectangular cross section measuring 40 mm (1.57 in.)
in length and 0.44 mm (0.018 in.) in thickness. The specific gravity of the synthetic fiber is 0.92.
The hooked-end fiber with length and diameter of 30 mm (1.18 in.) and 0.55 mm (0.021 in.),
respectively, was used. It has a specific gravity of 7.85. The synthetic and steel fibers have
tensile strength of 620 MPa (90 ksi) and 1500 MPa (218 ksi), respectively.
Figure 3.2. Synthetic and steel fibers used in this study
Aggregate
Both crushed and rounded aggregates were investigated to evaluate the effect of physical
characteristics of aggregate on packing density. As indicated in Figure 3.3 and Figure 3.4,

33
different aggregate samples were taken from various aggregate quarries in Jefferson City and
Rolla, MO.
(a) Capital Sand Company in Jefferson City, MO
(b) Capital Quarries in Jefferson City, MO (c) Capital Quarries in Rolla, MO
Figure 3.3. Different aggregate quarries in MO

34
Figure 3.4. Aggregate samples taken from different quarries
The aggregate gradation of all aggregates was determined. Six different aggregates were selected
for this study, including a lightweight sand, a normal weight sand, and four types of coarse
aggregates (Figure 3.5).
Figure 3.5. Aggregate types used in this study (one sand and four coarse aggregates)
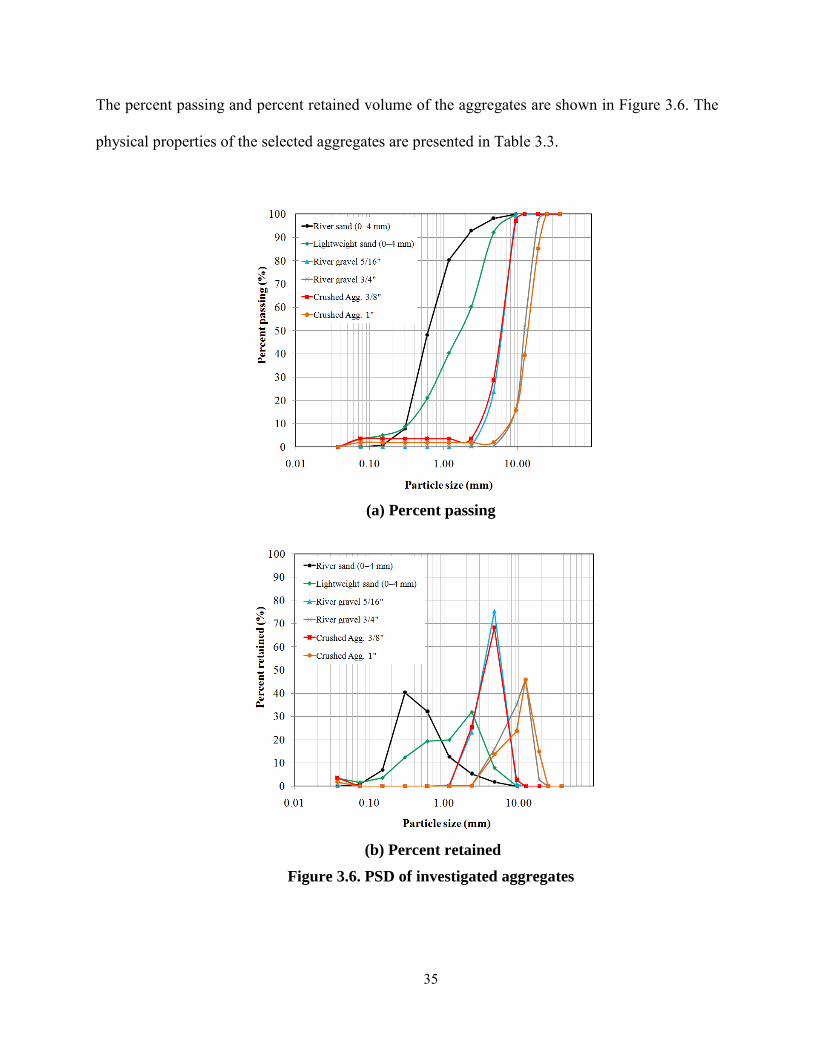
35
The percent passing and percent retained volume of the aggregates are shown in Figure 3.6. The
physical properties of the selected aggregates are presented in Table 3.3.
(a) Percent passing
(b) Percent retained
Figure 3.6. PSD of investigated aggregates

36
Table 3.3. Characteristics of investigated aggregates
Texture Angularity Absorption (%) Specific gravity
River sand (0–4 mm) Smooth Rounded 0.6 2.51
Lightweight sand (0–4 mm) Rounded 13 1.65
River gravel 5/16" Smooth Rounded 1.1 2.53
River gravel 3/4" Smooth Rounded 2 2.455
Crushed Agg. 3/8" Rough Crushed 3.0 2.46
Crushed Agg. 1" Rough Crushed 2.7 2.58
3.2. Experimental program
The development of crack-free and Eco-Crete was carried out through four phases, as described
below:
Phase 1- Optimization of binder composition
The first phase aims of optimizing the binder composition of Eco-Crete based on the packing
density, flow characteristics, and mechanical properties in cement paste level. In total, 38 various
binder compositions using different types and replacement levels of binary and ternary SCMs
were tested, as indicated in Table 3.4.

37
Table 3.4. Mixture proportioning for paste mixtures
Binder type Mixture code Cementitious material replacement (% by volume)
C FFA CFA SL SF Control C 100 0 0 0 0
Binary system
FFA30 70 30 0 0 0 FFA40 60 40 0 0 0 FFA50 50 50 0 0 0
SL30 70 0 0 30 0 SL40 60 0 0 40 0 SL50 50 0 0 50 0
SF5 95 0 0 0 5 SF10 90 0 0 0 10 SF15 85 0 0 0 15
CFA30 70 0 30 0 0 CFA40 60 0 40 0 0 CFA50 50 0 50 0 0 CFA60 40 0 60 0 0 CFA70 30 0 70 0 0
Ternary system
FFA30SF5 65 30 0 0 5 FFA40SF5 55 40 0 0 5 FFA50SF5 45 50 0 0 5 FFA30SF10 60 30 0 0 10 FFA40SF10 50 40 0 0 10 FFA50SF10 40 50 0 0 10 FFA30SF15 55 30 0 0 15 FFA40SF15 45 40 0 0 15 FFA50SF15 35 50 0 0 15
SL30SF5 65 0 0 30 5 SL40SF5 55 0 0 40 5 SL50SF5 45 0 0 50 5 SL30SF10 60 0 0 30 10 SL40SF10 50 0 0 40 10 SL50SF10 40 0 0 50 10 SL30SF15 55 0 0 30 15 SL40SF15 45 0 0 40 15 SL50SF15 35 0 0 50 15
CFA30SF5 65 0 30 0 5 CFA40SF5 55 0 40 0 5 CFA50SF5 45 0 50 0 5 CFA50SF7.5 42.5 0 50 0 7.5 CFA60SF7.5 32.5 0 60 0 7.5
C: Type I cement, FFA: Class F fly ash, CFA: Class C fly ash, SL: slag, and SF: silica fume

38
Phase 2- Optimization of aggregate characteristics
This phase of the investigation aims at evaluating the effect of various aggregate characteristics,
including shape, texture, PSD, S/A on the packing density of the aggregate skeleton. The PSD of
aggregate was optimized using theoretical model (modified A&A packing model) and empirical
method (gyratory compactor) to minimize paste volume needed to fill the voids between
aggregate particles. Both crushed and rounded aggregates with various proportions of S/A were
investigated. In total, 22 combinations of aggregate were tested to cover a wide range of binary
(sand/coarse Agg.) and ternary (sand/medium Agg./coarse Agg.) blends, as presented in Table
3.5.
Table 3.5. Aggregate blends investigated in this study
Type Mix # River sand (0–4 mm)
River gravel 5/16"
River gravel 3/4"
Crushed Agg. 3/8"
Crushed Agg. 1"
Com
bina
tion
of r
ound
ed
aggr
egat
e
R1 30% 40% 30% - - R2 40% 30% 30% - - R3 50% 20% 30% - - R4 60% 10% 30% - - R5 30% 30% 40% - - R6 40% 20% 40% - - R7 50% 10% 40% - - R8 60% 0% 40% - - R9 30% 20% 50% - - R10 40% 10% 50% - - R11 50% 0% 50% - -
Com
bina
tion
of c
rush
ed
ag
greg
ate
C1 40% - - 40% 20% C2 48% - - 32% 20% C3 55% - - 25% 20% C4 60% - - 20% 20% C5 40% - - 30% 30% C6 55% - - 15% 30% C7 60% - - 10% 30% C8 40% - - 20% 40% C9 48% - - 12% 40% C10 55% - - 5% 40% C11 60% - - 0% 40%

39
Phase 3- Comparison of shrinkage reducing strategies
Factorial design approach was used to evaluate the effect of different shrinkage reducing
materials on autogenous shrinkage, drying shrinkage, and mechanical properties of mortars. The
modeled parameters included the use of Type G and Type K EX, SRA, LWS, as well as changes
in the initial moist-curing period (initial MCP). This statistical design enables the evaluation of
the selected parameters with each evaluated at two distinct levels of −1 and +1 (minimum and
maximum levels). The actual and coded values of the investigated parameters are presented in
Table 3.6.
Table 3.6. Coded and actual values of investigated parameters
Factor Coded factor -1 0 1
Type K EX (%) 0 7.5 15
Type G EX (%) 0 5 10
SRA (%) 0 1 2
LWS (%) 0 10 20
Initial MCP (day) 0 3 6
The coded test parameters can be expressed as follows:
( 7.5) / 7.5( 5) / 5
( 1) /1( 10) /10( 3) / 3
Coded Type K EX absolute EXCoded TypeG EX absolute EXCoded SRA absolute SRACoded LWS absolute LWSCoded MCP absolute MCP
= −= −
= −= −= −
Two different series of experimental factorial programs were formed. The first one presented in
Table 3.7 uses Type K EX, and the second program in Table 3.8 includes Type G EX.

40
Table 3.7. Experimental factorial program for mixtures containing Type K EX
No. mix description
Coded value Absolute value
SRA Type K EX LWS Initial
MCP SRA (%)
Type K EX (%)
LWS (%)
Initial MCP (day)
1 C -1 -1 -1 -1 0 0 0 0 2 C-6 -1 -1 -1 1 0 0 0 6 3 F -1 -1 1 -1 0 0 20 0 4 F-6 -1 -1 1 1 0 0 20 6 5 S 1 -1 -1 -1 2 0 0 0 6 S-6 1 -1 -1 1 2 0 0 6 7 SF 1 -1 1 -1 2 0 20 0 8 SF-6 1 -1 1 1 2 0 20 6 9 EK -1 1 -1 -1 0 15 0 0
10 EK-6 -1 1 -1 1 0 15 0 6 11 EKF -1 1 1 -1 0 15 20 0 12 EKF-6 -1 1 1 1 0 15 20 6 13 EKS 1 1 -1 -1 2 15 0 0 14 EKS-6 1 1 -1 1 2 15 0 6 15 EKSF 1 1 1 -1 2 15 20 0 16 EKSF-6 1 1 1 1 2 15 20 6
C: Type I cement, F: fine lightweight aggregate, S: shrinkage reducing admixture, EK: Type K expansive agent Codification: EKSF-6 = Type K expansive agent + shrinkage reducing admixture + fine lightweight aggregate + 6 days of moist-curing.

41
Table 3.8. Experimental factorial program for mixtures containing Type G EX
No. mix description
Coded value Absolute value
SRA Type G EX LWS Initial
MCP SRA (%)
Type G EX (%)
LWS (%)
Initial MCP (day)
1 C -1 -1 -1 -1 0 0 0 0 2 C-6 -1 -1 -1 1 0 0 0 6 3 F -1 -1 1 -1 0 0 20 0 4 F-6 -1 -1 1 1 0 0 20 6 5 S 1 -1 -1 -1 2 0 0 0 6 S-6 1 -1 -1 1 2 0 0 6 7 SF 1 -1 1 -1 2 0 20 0 8 SF-6 1 -1 1 1 2 0 20 6 9 EG -1 1 -1 -1 0 10 0 0
10 EG-6 -1 1 -1 1 0 10 0 6 11 EGF -1 1 1 -1 0 10 20 0 12 EGF-6 -1 1 1 1 0 10 20 6 13 EGS 1 1 -1 -1 2 10 0 0 14 EGS-6 1 1 -1 1 2 10 0 6 15 EGSF 1 1 1 -1 2 10 20 0 16 EGSF-6 1 1 1 1 2 10 20 6
C: Type I cement, F: fine lightweight aggregate, S: shrinkage reducing admixture, EG: Type G expansive agent Codification: EGSF-6 = Type G expansive agent + shrinkage reducing admixture + fine lightweight aggregate + 6 days of moist-curing.
Phase 4- Development of crack-free Eco-Crete
Based on the obtained results from the three previous phases, selected binder compositions,
aggregate type and gradation, and shrinkage reducing strategies was used to design crack-free
Eco-Crete. Crack free refers to hairline crack with opening lower than 0.1 mm (0.004 in.). This
phase includes two parts, as follows:
The first part included the evaluation of the influence of six optimized different binder
compositions on workability, shrinkage and mechanical properties of SWC mixtures.

42
The second part of this phase is to investigate key engineering properties of SCC mixtures
prepared with optimum binder compositions and shrinkage reducing strategies. These properties
include workability, rheology, shrinkage, mechanical properties, cracking resistance, and
durability. Table 3.9 and Table 3.10 present the mixture parameters evaluated in this phase.
Table 3.9. Experimental matrix for SWC mixtures
Mix. #
w/cm Binder type Binder content Admixture
0.45
100%
cem
ent
sele
cted
bin
der 1
sele
cted
bin
der 2
sele
cted
bin
der 3
sele
cted
bin
der 4
sele
cted
bin
der 5
315 kg/m3
(530 lb/yd3)
HR
WR
A
AEA
1 x x x
To be adjusted to secure fresh air volumes of 6 ± 2% and initial
slump flow values of 500 ± 25 (20 ± 1 in.).
2 x x x
3 x x x
4 x x x
5 x x x
6 x x x

43
Table 3.10. Experimental matrix for SCC mixtures
Mix Description
w/cm Binder type Binder content Fiber
Shrinkage reducing strategies
0.45
0.50
100%
cem
ent
sele
cted
bin
der 1
sele
cted
bin
der 2
315
kg/m
3
(5
30 lb
/yd3 )
425
kg/m
3
(716
lb/y
d3 )
Stee
l (0.
5%)
Synt
hetic
(0.3
%)
Sele
cted
stra
tegy
1
Sele
cted
stra
tegy
2
RSCC Typical SCC x x x
Eco-SCC-0.45
Eco-SCC x x x
Eco-SCC-0.5 Effect of w/c x x x
Eco-FRSCC
Effect of selected SCMs
x x x x
x x x x
Effect of fiber type x x x x
Crack-free and Eco-FR-
SCC
Effect of selected
shrinkage reducing strategies
x x x x x
x x x x x
x x x x x
x x x x x
3.3. Mixing and test methods
3.3.1. Mixing procedure
The mixing sequence for the paste mixtures consisted of homogenizing the powder materials for
60 sec before the introducing of half of the mixing water. A Hobart mixer with a capacity of 2 L

44
was used. The, HRWRA was then diluted in the remaining water and introduced gradually in the
mixture. The paste was mixed for 60 sec at low rotation speed of 140 rpm and then continued for
additional 60 sec at high rotation speed of 285 rpm.
The mixing procedure for the concrete mixtures that were prepared using a drum mixer with 150
L capacity is as follows:
1. Homogenize sand and lightweight sand (if used) for 60 sec.
2. Incorporate coarse aggregate, fibers (if used), half of the mixing water, and AEA and mix for
1 min.
3. Add the powder materials (and EX if used) and mix for 30 sec.
4. Add half of remaining water and VEA, and mix for 1 min.
5. Add the remaining water and HRWRA, and mix for 3 min (and SRA if used).
6. Keep the concrete at rest for 2 min, then remix for additional 2 min.
3.3.2. Test methods for paste mixtures
Flow characteristics
The mini slump flow test (Okamura and Ouchi, 2003) was used to evaluate the flow
characteristics of grout mixtures. As shown in Figure 3.7, the test consists of determining the
variations of fluidity (relative slump flow) of a given mixture with changes in water-to-
cementitious material ratio, by volume ( /w cmV V ). From the spread-flow of the paste, using the
average of two perpendicular diameters (d1 and d2) can be determined, and the relative slump
flow ( pΓ ) is calculated as:

45
21 2
1 22 1 (d andd in cm)
10p
d d+
Γ = −
( 3-1)
The intercept of the relationship between /w cmV V and pΓ with the Y axis ( /w cmV V ) is used to
express minimum water demand (MWD) to initiate flow, and the slope of the relationship
represent the relative water demand (RWD) to increase fluidity. The MWD and the RWD are
relatively correlated to packing density and robustness of the mixture, respectively (Hwang and
Khayat, 2006).
Figure 3.7. Variation of mini-slump flow with w/cm by volume
Wet packing density
The packing density of cementitious materials was measured based on the wet packing approach.
As presented in Figure 3.8, this method involves preparing paste mixtures with different
moisture contents and measuring the variation of wet unit weight with moisture content. Packing
density was determined using a cylindrical mold of 400 ml in volume which was filled, then
consolidated on vibration table for 30 sec. As can be seen, there exists a moisture content

46
corresponding to the maximum achievable density of paste, which is defined as the optimum
water demand (OWD). The obtained data are used to determine the packing density of powder
materials, which depends on dry density of solid particles, as follows:
( 3-2)
where ρ , V , and M refer to the density of the paste sample, volume of mold to be filled with the
paste sample, and mass of the paste sample in mold, respectively. The packing density of
powder materials (φ ) is then obtained as follows:
cVV
=φ ( 3-3)
( / ) ...cw w cm
MVV V R R
=+ + +α α β βρ ρ ρ
( 3-4)
where wρ and cV are the density of water and solid volume of cementitious materials in mold,
respectively. αρ and βρ refer to specific gravity of different cementitious materials used in the
paste mixture and Rα and Rβ are the volumetric ratios of α and β to the total cementitious
materials.
Figure 3.8. Packing density measurement
MV
=ρ

47
Compressive strength
The 7 and 28-day compressive strengths of the paste mixtures were measured using 50 mm (2
in.) cube specimens according to ASTM C 109/C 109M.
3.3.3. Test method for aggregate characteristics
The packing density of the investigated sand and coarse aggregates were determined using the
gyratory intensive compaction tester (ICT), shown in Figure 3.9. In general, the ICT is employed
for the research and testing of compaction of granular materials, such as soil and concrete. A
constant vertical pressure is applied on a sample placed inside the cylinder mold that rotates at a
gyratory angle for a maximum of 512 cycles. Due to the gyratory inclination, a shear body
develops during the measurement. Shear movement under vertical pressure allows solid particles
to get closer to each other, thus leading to achieving a higher packing density. The packing
density of granular materials (φ ) is calculated as follows:
max
d
d
=ρ
φρ
( 3-5)
max31 2
1 2 3
1
...d PP P=
+ + +ρ
ρ ρ ρ
( 3-6)
where 1P , 2P , and 3P are weight percentages of the various materials used in the mixture, and 1ρ ,
2ρ , and 3ρ refer to specific gravity values of the different materials. The applying vertical
pressure should be selected below a critical value that would lead to grinding or crushing of the
particles. The critical pressure for tested granular material can be determined using the difference
between its PSD before and after applying various pressures. After preliminary studies on
various types of aggregates under different pressure values and consolidation cycles, the

48
parameters of ICT were fixed, as presented in Table 3.11. The vertical pressure was adjusted to 2
bar to avoid aggregate crushing or grinding during the IC-testing.
Figure 3.9. Gyratory intensive compaction tester (ICT)
Table 3.11. Selected testing parameters for ICT
Parameter Unit Available range Selected Vertical pressure bar 0.5-10 2 Number of cycles 2-512 512 Velocity rpm 0-60 60 Gyratory angle mrad 0-50 40
3.3.4. Test methods for mortar mixtures
Mortar mixtures were used to evaluate the effect of different shrinkage reducing materials on
autogenous shrinkage, drying shrinkage, and mechanical properties. Mortars had binder content
of 315 kg/m3 (530 lb/yd3), similar as those of SCC and SWC mixtures. All of the mortar
mixtures were prepared with the w/cm and sand-to-total cementitious material ratio (S/cm) of
0.40 and 2.8, respectively. The HRWRA dosage was adjusted to secure the mini slump flow of
220 ± 25 mm (8.7 ± 1 in.).
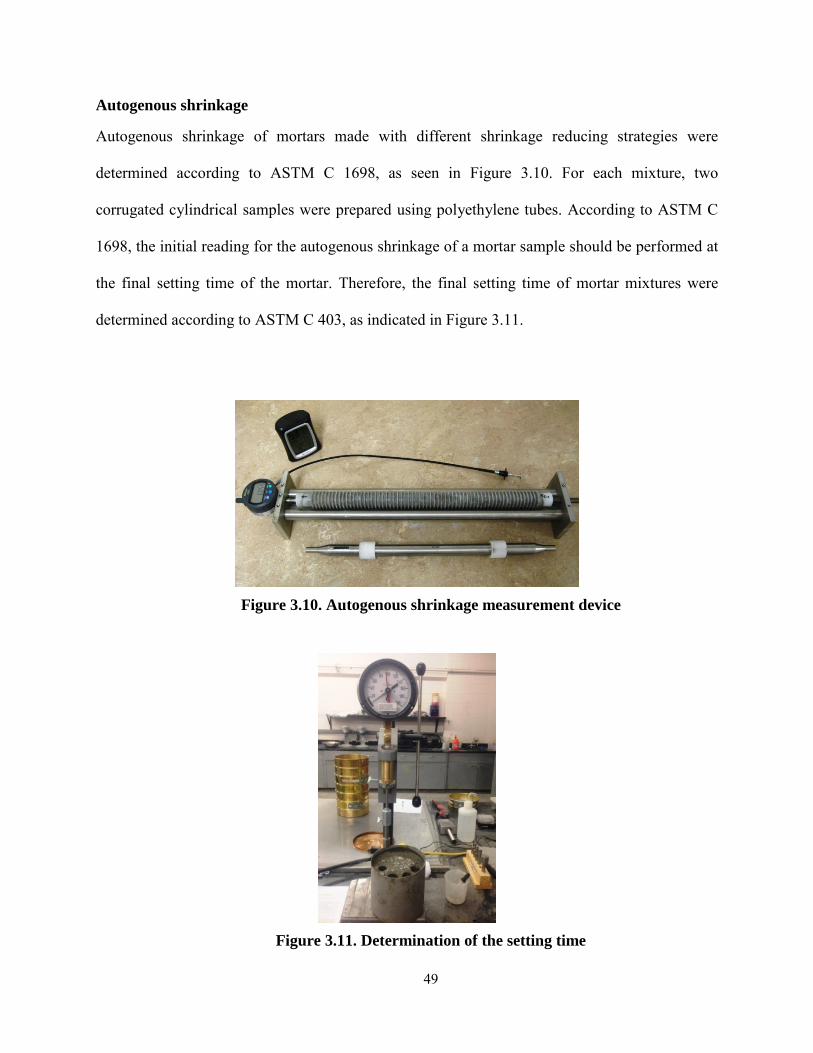
49
Autogenous shrinkage
Autogenous shrinkage of mortars made with different shrinkage reducing strategies were
determined according to ASTM C 1698, as seen in Figure 3.10. For each mixture, two
corrugated cylindrical samples were prepared using polyethylene tubes. According to ASTM C
1698, the initial reading for the autogenous shrinkage of a mortar sample should be performed at
the final setting time of the mortar. Therefore, the final setting time of mortar mixtures were
determined according to ASTM C 403, as indicated in Figure 3.11.
Figure 3.10. Autogenous shrinkage measurement device
Figure 3.11. Determination of the setting time

50
Drying shrinkage
Drying shrinkage of the mortar (ASTM C 596) was determined using a digital type extensometer
to measure changes in length of prismatic specimens measuring 25 × 25 × 285 mm (1 × 1 ×
11.25 in.), as shown in Figure 3.12. After demolding at 24 h, the beam specimens were immersed
in water for 6 days, then the samples were transferred to temperature and humidity controlled
room set at 23 ± 1°C and 50% ± 3% RH, and the shrinkage was monitored until the age of 56
days.
Figure 3.12. Measurement of free drying shrinkage
3.3.5. Test methods for concrete mixtures
The test methods carried out on concrete are summarized in Table 3.12.

51
Table 3.12. Test methods used for concrete mixtures
Concrete property Test method
Workability Unit weight (ASTM C 138), Air content (ASTM C 231)
Slump flow and T-50 (ASTM C 1611), V-funnel, J-ring (ASTM C 1621), Modified J-ring (Khayat et al. 2014)
Rheology ICAR rheometer
Stability Surface settlement, Sieve stability, Bleeding (ASTM C 232), Column segregation (ASTM C 1610)
Mechanical properties
Compressive strength (ASTM C 39) at 3, 28, 56, and 91 days
Modulus of elasticity (ASTM C 469), Splitting tensile strength (ASTM C 496) at 3, 28, and 56 days
Flexural performance of FRC beams (ASTM C 1609) at 56 days
Durability
Freeze-thaw resistance (ASTM C 666) at 56 days
Water absorption (ASTM C 642) at 56 days
Electrical bulk conductivity (ASTM C 1760) at 56 days
Surface resistivity (AASHTO TP 95) at 56 days
Shrinkage and cracking resistance
Autogenous and drying shrinkage (ASTM C 157)
Restrained shrinkage (ASTM C 1581)
Workability, rheology, and stability
The slump flow test (ASTM C 1611) was used to evaluate the ability of SCC to deform under its
own weight. The T-50, time needed for the concrete to spread 500 mm (20 in.) in the slump flow
test, was also determined. The J-ring test (ASTM C 1621) and modified J-ring (Khayat et al.
2014) were used to assess the passing ability of SCC and fiber-reinforced SCC (FR-SCC),
respectively. The modified J-ring involves the use of 8 bars instead of 16 bars in the standard test

52
to increase clearance between adjacent bars from the standard value of 43 mm (1.69 in.) to 105
mm (4.13 in.) in FR-SCC, as shown in Figure 3.13. Rheological properties of concrete mixtures
were determined using the ICAR rheometer. The Rheometer enables the measurement of the
yield stress and plastic viscosity of concrete according to the Bingham’s model.
Figure 3.13. Modified J-ring used for FR-SCC
The surface settlement test was used to evaluate the static stability of concrete and its ability to
ensure proper suspension of aggregate and fines (Manai, 1995). The test involves the monitoring
of the settlement of concrete cast in a polyvinyl chloride (PVC) column measuring 200 mm (7.9
in.) in diameter and 800 mm (31.5 in.) in height. The column was filled with concrete to a height
of 600 mm (23.6 in.). A linear variable differential transformer (LVDT) is fixed on top of a thin
acrylic plate placed at the upper surface of the concrete sample to monitor surface settlement
(Figure 3.14). Changes in concrete height are monitored until reaching steady state conditions,
which corresponded to the beginning of hardening. The surface settlement is calculated as
follows:

53
(%) 100I F
C
H HSH−
= × ( 3-7)
where S, HI, HF, and HC are the surface settlement, initial reading of the LVDT, final reading of
the LVDT, and height of the concrete in the column, respectively.
Figure 3.14. Surface settlement test
The column segregation (ASTM C 1610) was used to determine static segregation of concrete by
measuring the homogeneity of coarse aggregate content in column after a given period of rest.
This test consists of PVC pipes separated into three sections with 200 mm (8 in.) diameter. The
top and bottom sections are 165 mm (6.5 in.) in height and the middle section is 330 mm (13 in.)
in height. After 15 min of filling of the column, the concrete in the top and bottom sections of the
column are washed over a No. 4 sieve to collect a coarse aggregate. The aggregate is then
surface-dried and weighed, and the static segregation index (SI) is calculated according to Eq. (3-
8), where CAtop and CAbot represent the mass of the coarse aggregate from the top and bottom
sections of the column, respectively.

54
(%) 2 100bot tob
bot tob
CA CASICA CA −
= × + ( 3-8)
Mechanical properties
Cylindrical specimens measuring 100 × 200 mm (4 × 8 in.) were cast to determine compressive
strength (ASTM C 39), modulus of elasticity (ASTM C 469), and splitting tensile strength
(ASTM C 496) at 3, 28, 56, and 91 days. Prismatic specimens measuring 75 × 75 × 400 mm (3 ×
3 × 16 in.) were cast to determine the flexural toughness of fiber-reinforced concrete (FRC)
according to ASTM C1609 (Figure 3.15). In the test, the toughness of the FRC is calculated from
the load-deflection curve using displacement control.
Figure 3.15. Test setup for flexural toughness measurement of FRC beams
Durability
Prisms measuring 75 × 75 × 400 mm (3 × 3 × 16 in.) were prepared to evaluate freeze-thaw
resistance of concrete mixtures according to the ASTM C 666, procedure A. Given pozzolanic
reactivity of SCMs, concrete made with high replacement rate of SCMs requires higher curing

55
time compared to concrete made with 100% cement. In general, the use of longer period of
moist-curing for concrete containing high volume of SCMs can result in a higher density of
microstructure and lower capillary porosity compared to the similar mixture with lower moist-
curing period. Therefore, the prisms were moist-cured for 56 days before freeze-thaw testing.
Specimens were subjected to 300 freeze-thaw cycles, and after every 36 cycles, the mass loss
and transverse frequency of concrete specimens were monitored. The ultrasonic pulse velocity
test was used to determine the dynamic modulus of elasticity of the specimens. Figure 3.16
shows the freeze-thaw chamber and ultrasonic pulse velocity instrument.
Figure 3.16. Freeze-thaw chamber (left) and ultrasonic velocity instrument (right)
The electrical resistivity measurement is used to classify the concrete according to the corrosion
rate. The measurement of electrical resistivity can be obtained using two different methods;
direct two-electrode method (ASTM C 1760) and the four-point Wenner probe method
(AASHTO TP 95-11), corresponding to bulk electrical conductivity and surface resistivity,
respectively (Figure 3.17). The electrical resistivity was measured using cylindrical samples
measuring 100 mm (4 in.) in diameter and 200 mm (8 in.) in height and cured in saturated lime
water until the age of testing. The electrical resistivity is calculated as follows:

56
R k= ×ρ ( 3-9)
where ρ is the resistivity, and R and k refer to measured resistance and geometry correction
factor, respectively. The geometry correction factor for surface resistivity and bulk electrical
conductivity can be calculated as:
( )2
2( ) 0.73 7.821.1/ /
ak surface resistivity
d a d a
=− +
π
( 3-10)
( ) Ak bulk electrical conductivityL
= ( 3-11)
where d, A, a, and L refer to diameter, cross section area, probe spacing, and length of the
specimen, respectively.
Figure 3.17. Bulk electrical conductivity (left) and surface resistivity (right)
Cylindrical specimens measuring 100 × 100 mm (4 × 4 in.) were prepared to determine the water
absorption and permeable void content of concrete according to ASTM C 642. This test method
determines the water absorption after immersion in water and after immersion in boiling water

57
for five hours. The high temperature affects both the viscosity and the mobility of the water
molecules, which may lead to the greater displacement of water within the pore structure of the
hardened concrete. Samples were dried in an oven at a temperature of 110 ± 5°C until the
difference between any two consecutive mass values is less than 0.5% of the obtained lowest
value. The specimens were then immersed in water at approximately 21°C for not less than 48 h
to determine the saturated surface dried (SSD) mass (B). The specimens were then immersed in
boiling water for five hours, and the SSD mass after boiling was determined (C). The apparent
mass (D) of specimens was measured to determine the permeable void content. The water
absorption and permeable void volume of concrete specimens are calculated using the following
equations:
Absorption after immersion = [(B-A)/A] ×100 ( 3-12)
Absorption after immersion and boiling = [(C-A)/A] ×100 ( 3-13)
Permeable void volume (%) = (C-A)/(C-D) ×100 ( 3-14)
Shrinkage and cracking resistance
Drying shrinkage of concrete mixtures (ASTM C 157) was determined with a digital type
extensometer using prismatic specimens measuring 75 × 75 × 285 mm (3 × 3 × 11.25 in.). After
demolding at 24 h, the beam specimens were immersed in water for 6 days. The samples were
then stored in a temperature and humidity controlled room set at 23 ± 1 °C and 50% ± 3% RH.
Shrinkage was then measured until the age of 56 days. Similarly, beams were cast and sealed after
demolding at 24 h using adhesive aluminum tape to determine autogenous shrinkage. Figure 3.18
shows the shrinkage setup used for sealed and unsealed specimens.

58
Figure 3.18. Shrinkage measurement of sealed (right) and unsealed specimens (left)
A ring-type test (ASTM C 1581) was used to evaluate the resistance of concrete to restrained
shrinkage. The test consists of casting concrete in an annular spacing with two concentric rings
with an inner rigid steel ring instrumented with three electrical strain gauges. The gauges are used
to monitor stress development induced by restrained shrinkage in the concrete. The steel strain is
monitored starting immediately after casting with subsequent readings taken every 20 min until
the concrete shell element begins to crack. A sudden decrease in steel strain refers to shrinkage
cracking of the concrete ring. Two concrete ring specimens were cast for each mixture. The
concrete rings were moist-cured for 24 h under wet burlap after casting. The specimens were
demolded and moist-cured for additional two days before the initiation of the drying process.
After the curing process, the top surface of the ring specimen was sealed with adhesive aluminum
tape, thus restricting drying to the outer circumferential surface of the concrete ring. The ring
specimens were stored at 23 ± 1°C and 50 ± 3% RH until the onset of restrained shrinkage
cracking.

59
4. TEST RESULTS AND DISCUSSION
4.1. Optimization of binder composition
The minimum water demand (MWD), relative water demand (RWD), packing density (φ),
optimum water demand (OWD) corresponding to maximum packing density, and compressive
strength results of the investigated paste mixtures are summarized in Table 4.1. The HRWRA
dosage was fixed at 0.5% (by mass of cementitious materials) for all mixtures. This HRWRA
content was determined from the evaluation of the saturation point of the HRWRA which was
carried out on cement paste using the mini slump flow and flow cone test (ASTM C 939). For
/w cmV V of 0.8, mixture having 0.5% HRWRA exhibited slump flow and flow rate of 145 mm and
16 sec, respectively, as shown in Figure 4.1 The increase in the HRWRA dosage from 0.5% to
1% did not provide higher flowability and lower flow rate, thus 0.5% corresponding to the
saturation point of the HRWRA. The cement paste mixture without any HRWRA had no fluidity
and blockage behavior through the mini slump and flow cone tests, respectively.
Figure 4.1. Determination of HRWRA saturation point for Portland cement

60
Table 4.1. Flow characteristics, packing density, and compressive strength of paste mixtures
Mixture code
Cementitious material (% by volume) MWD RWD OWD φ
fc at 7 days
(MPa)
fc at 28 days
(MPa) OPC FFA CFA SL SF C 100 0 0 0 0 0.84 0.046 0.63 0.519 56.5 74.5 FFA30 70 30 0 0 0 0.70 0.042 0.50 0.540 48.5 55.7 FFA40 60 40 0 0 0 0.56 0.043 0.41 0.553 43.0 50.4 FFA50 50 50 0 0 0 0.54 0.048 0.34 0.555 27.4 45.7 SL30 70 0 0 30 0 0.64 0.042 0.49 0.55 51.1 62.9 SL40 60 0 0 40 0 0.54 0.043 0.38 0.575 51.3 58.7 SL50 50 0 0 50 0 0.52 0.047 0.34 0.553 48.0 52.8 SF5 95 0 0 0 5 0.65 0.046 0.54 0.580 63.7 87.3 SF10 90 0 0 0 10 0.95 0.064 0.69 0.621 67.0 90.7 SF15 85 0 0 0 15 1.02 0.098 0.73 0.587 65.9 88.4 CFA30 70 0 30 0 0 0.66 0.04 0.48 0.548 54.7 63.0 CFA40 60 0 40 0 0 0.56 0.037 0.45 0.568 48.0 56.0 CFA50 50 0 50 0 0 0.58 0.034 0.45 0.556 40.5 49.0 CFA60 40 0 60 0 0 0.56 0.035 0.42 0.547 36.5 41.0 CFA70 30 0 70 0 0 0.62 0.037 0.45 0.523 24.0 32.0 FFA30SF5 65 30 0 0 5 0.60 0.048 0.51 0.582 51.6 62.0 FFA40SF5 55 40 0 0 5 0.53 0.046 0.50 0.610 46.7 60.0 FFA50SF5 45 50 0 0 5 0.62 0.043 0.48 0.587 32.1 51.0 FFA30SF10 60 30 0 0 10 0.73 0.06 0.54 0.638 53.9 68.3 FFA40SF10 50 40 0 0 10 0.71 0.05 0.50 0.663 49.5 64.0 FFA50SF10 40 50 0 0 10 0.66 0.048 0.48 0.646 38.7 57.0 FFA30SF15 55 30 0 0 15 0.75 0.091 0.52 0.553 51.6 65.2 FFA40SF15 45 40 0 0 15 0.73 0.073 0.49 0.578 47.1 63.0 FFA50SF15 35 50 0 0 15 0.69 0.06 0.49 0.587 37.0 54.5 SL30SF5 65 0 0 30 5 0.6 0.045 0.45 0.595 56.7 69.3 SL40SF5 55 0 0 40 5 0.52 0.048 0.41 0.620 54.0 64.1 SL50SF5 45 0 0 50 5 0.43 0.046 0.34 0.587 55.0 59.3 SL30SF10 60 0 0 30 10 0.65 0.056 0.51 0.612 57.0 78.3 SL40SF10 50 0 0 40 10 0.58 0.052 0.44 0.646 58.0 73.5 SL50SF10 40 0 0 50 10 0.43 0.059 0.35 0.604 55.5 65.2 SL30SF15 55 0 0 30 15 0.69 0.08 0.49 0.553 53.7 75.3 SL40SF15 45 0 0 40 15 0.62 0.07 0.44 0.612 56.7 70.6 SL50SF15 35 0 0 50 15 0.55 0.07 0.37 0.587 54.1 61.1 CFA30SF5 65 0 30 0 5 0.61 0.058 0.49 0.591 54.5 70.0 CFA40SF5 55 0 40 0 5 0.53 0.05 0.48 0.617 50.2 64.5 CFA50SF5 45 0 50 0 5 0.49 0.052 0.46 0.573 45.4 58.5 CFA50SF7.5 42.5 0 50 0 7.5 0.69 0.049 0.50 0.605 47.0 61.5 CFA60SF7.5 32.5 0 60 0 7.5 0.78 0.046 0.53 0.554 40.5 50.2
Note: 1 MPa = 145.04 psi C: Type I cement, FFA: Class F fly ash, CFA: Class C fly ash, SL: slag, SF: silica fume
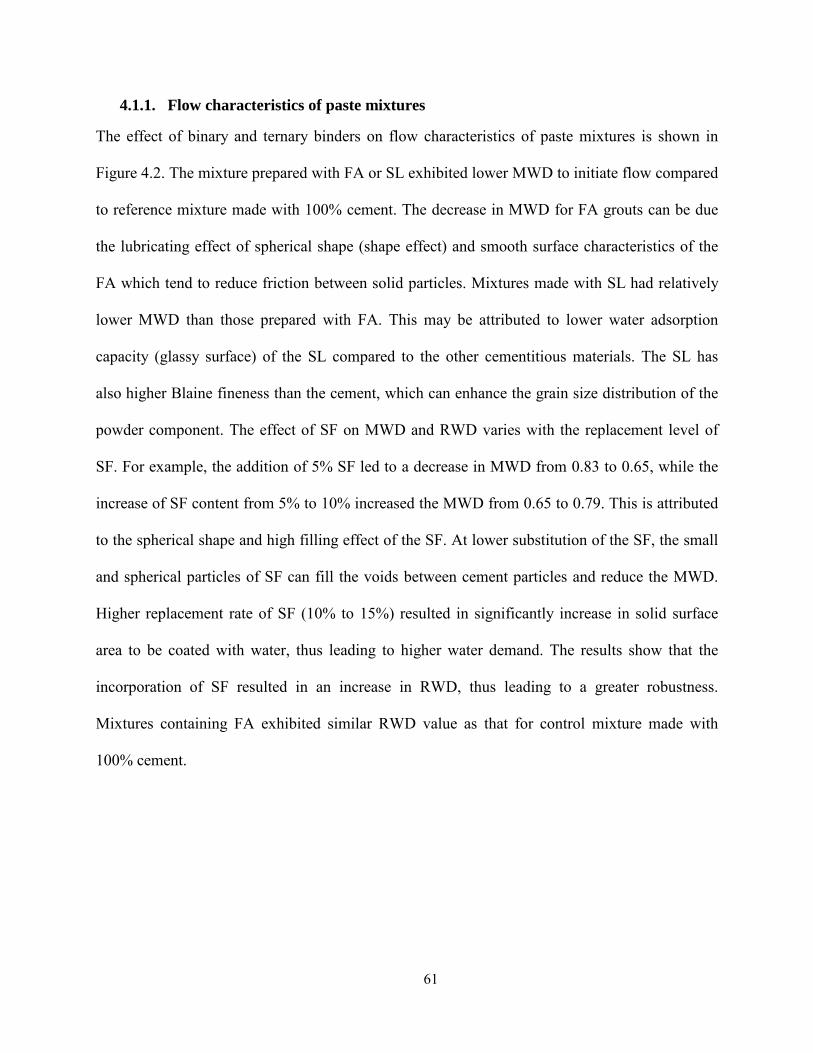
61
4.1.1. Flow characteristics of paste mixtures
The effect of binary and ternary binders on flow characteristics of paste mixtures is shown in
Figure 4.2. The mixture prepared with FA or SL exhibited lower MWD to initiate flow compared
to reference mixture made with 100% cement. The decrease in MWD for FA grouts can be due
the lubricating effect of spherical shape (shape effect) and smooth surface characteristics of the
FA which tend to reduce friction between solid particles. Mixtures made with SL had relatively
lower MWD than those prepared with FA. This may be attributed to lower water adsorption
capacity (glassy surface) of the SL compared to the other cementitious materials. The SL has
also higher Blaine fineness than the cement, which can enhance the grain size distribution of the
powder component. The effect of SF on MWD and RWD varies with the replacement level of
SF. For example, the addition of 5% SF led to a decrease in MWD from 0.83 to 0.65, while the
increase of SF content from 5% to 10% increased the MWD from 0.65 to 0.79. This is attributed
to the spherical shape and high filling effect of the SF. At lower substitution of the SF, the small
and spherical particles of SF can fill the voids between cement particles and reduce the MWD.
Higher replacement rate of SF (10% to 15%) resulted in significantly increase in solid surface
area to be coated with water, thus leading to higher water demand. The results show that the
incorporation of SF resulted in an increase in RWD, thus leading to a greater robustness.
Mixtures containing FA exhibited similar RWD value as that for control mixture made with
100% cement.

62
(a) Binary blends of SCMs
(b) Ternary blends of SCMs
Figure 4.2. Effect of binder composition on flow characteristics
4.1.2. Packing density of paste mixtures
The effect of binder composition on the packing density is demonstrated in Figure 4.3. In
general, the partial replacement of cement by FA, SL or SF is shown to significantly improve the
packing density of mixtures. For example, binary paste made with 40% FA or 40% SL, by

63
volume, had packing density of 0.56 and 0.59, respectively, compared to the 0.52 of mixture
made with 100% cement. Mixture containing SF exhibited substantially higher packing density
compared to the other types of binary mixtures. This can be due to the filling effect of SF which
is a predominant factor in improving the packing density.
The results of ternary binders showed that combination of 40% FA and 10% SF developed
significantly greater packing density (φ = 0.64) compared to 0.56 for the binary blend of 40%
FA. This can be due to the combination of shape and filling effects which can reduce friction
between particles, also fill the voids between cement particles. It should be noted that the shape
and filling effects of FA and SF on packing density varies with the replacement rate of SF. For
instance, for a given FA replacement of 40%, the increase in SF content from 5% to 10%
resulted in an increase in packing density from 0.60 to 0.66, while the incorporation of 15% SF
decreased the packing density to 0.58. When the amount of SF is beyond its optimum dosage, it
tends to loosen the packing of larger solid particles, and so the filling effect of SF would be
negligible.
(a) Binary SCMs

64
(b) Ternary SCMs
Figure 4.3. Effect of binder composition on packing density of grout mixtures
Figure 4.4 shows the effect of packing density on optimum water demand (OWD) required to
achieve a maximum packing density. As expected, an increase in the packing density reduces the
optimum water demand needed to fill the voids between particles. Therefore, for a given
workability, the increase in the packing density of cementitious materials can result in a decrease
in the paste volume, which is essential in the design of ecological concrete.
Figure 4.4. Effect packing density of SCMs on optimum water demand
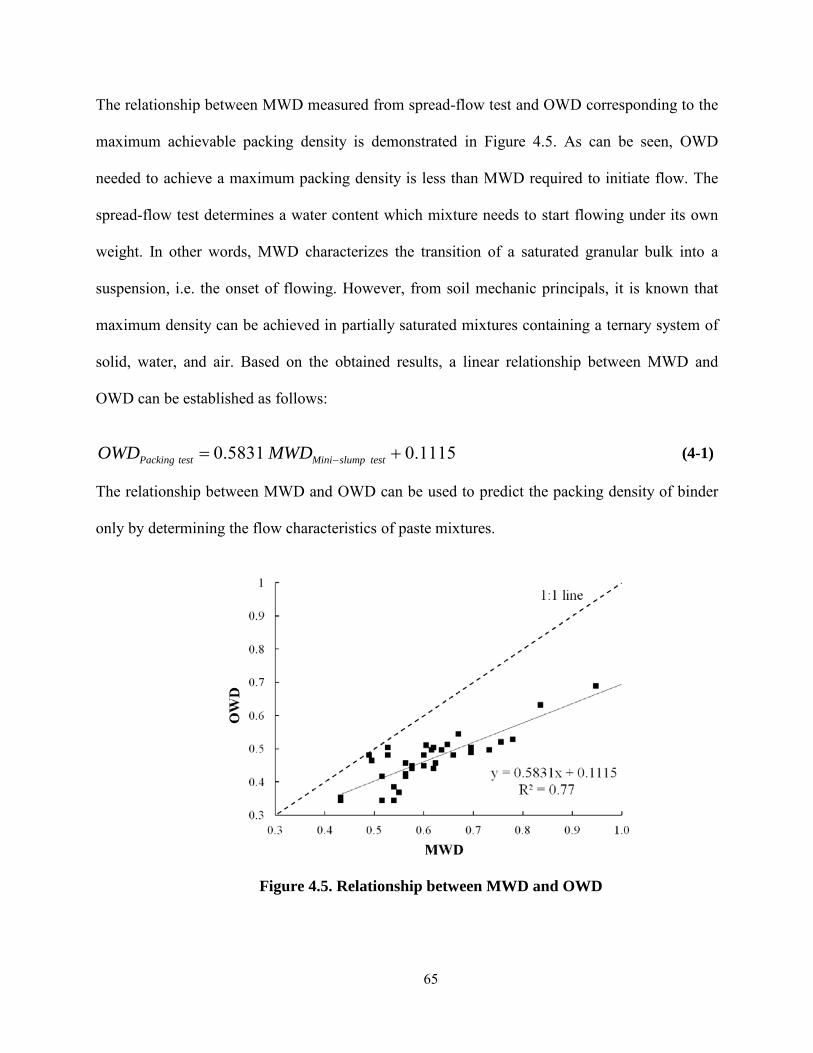
65
The relationship between MWD measured from spread-flow test and OWD corresponding to the
maximum achievable packing density is demonstrated in Figure 4.5. As can be seen, OWD
needed to achieve a maximum packing density is less than MWD required to initiate flow. The
spread-flow test determines a water content which mixture needs to start flowing under its own
weight. In other words, MWD characterizes the transition of a saturated granular bulk into a
suspension, i.e. the onset of flowing. However, from soil mechanic principals, it is known that
maximum density can be achieved in partially saturated mixtures containing a ternary system of
solid, water, and air. Based on the obtained results, a linear relationship between MWD and
OWD can be established as follows:
0.5831 0.1115Packing test Mini slump testOWD MWD −= + ( 4-1)
The relationship between MWD and OWD can be used to predict the packing density of binder
only by determining the flow characteristics of paste mixtures.
Figure 4.5. Relationship between MWD and OWD

66
4.1.3. Selection of optimum binder composition
Based on the obtained results from the flow characteristics of pastes and packing density of
binders, all investigated mixtures were ranked using performance rank analysis. Table 4.2
summarizes the ranking of the investigated mixtures in descending order for the following four
properties: MWD, RWD, OWD, and φ. The lowest value in ranking indicates the best
performance for each property. The sum of the final rankings given in Table 4.2 is normalized as
follows:
max
max min
( )(%)( )
iSR SRNormalized sumof rankingSR SR
−=
− ( 4-2)
where iSR is the sum of ranking for investigated mixture. maxSR and minSR are maximum and
minimum sum of ranking among mixtures.
It is noted that, the compressive strength of paste mixtures was not considered in this rank
analysis. As mentioned earlier, concrete with lower modulus of elasticity and stiffness at early-
age has higher resistance to shrinkage cracking due to the greater stress relaxation. Similarly it
can be stated that concrete with higher early-age strength can exhibit higher cracking potential.
The results of the 7-day compressive strength are classified into four categories, as presented in
Table 4.2. Mixtures in category 4 ( 7' 50daysf MPa> ) correspond to high early-age strength.
Mixtures classified under category 3 ( 740 ' 50daysMPa f MPa< < ) reflect moderate-to-high early-
age strength. Category 2 ( 730 ' 40daysMPa f MPa< < ) includes mixtures which can be
considered as moderate strength. Mixtures placed in category 1 ( 7' 30daysf MPa< ) are
considered to have low-to-moderate early-age strength.

67
Table 4.2. Evaluation of investigated pastes using performance rank analysis
Mix description
Ranking of
MWD
Ranking of
RWD
Ranking of
OWD
Ranking of φ
Sum of ranking
Normalized ranking
Strength category at 7days
C 36 23 36 38 133 0.0 4 FFA30 27 32 26 36 121 12.4 3 FFA40 11 29 7 28 75 59.8 3 FFA50 9 18 1 28 56 79.4 1 SL30 22 32 22 26 102 32.0 4 SL40 9 29 6 15 59 76.3 4 SL50 5 22 1 30 58 77.3 3 SF5 24 23 35 22 104 29.9 4 SF10 37 7 37 5 86 48.5 4 SF15 38 1 38 15 92 42.3 4 CFA30 25 34 17 34 110 23.7 4 CFA40 11 35 14 25 85 49.5 3 CFA50 11 38 12 27 88 46.4 2 CFA60 14 35 9 35 93 41.2 2 CFA70 20 37 14 37 108 25.8 1 FFA30SF5 18 18 32 21 89 45.4 4 FFA40SF5 32 8 34 4 78 56.7 3 FFA50SF5 34 2 31 30 97 37.1 2 FFA30SF10 7 23 26 10 66 69.1 4 FFA40SF10 31 15 26 1 73 61.9 4 FFA50SF10 32 4 22 23 81 53.6 2 FFA30SF15 20 29 17 15 81 53.6 4 FFA40SF15 25 18 17 2 62 73.2 3 FFA50SF15 27 8 2 15 52 83.5 2 SL30SF5 17 28 12 13 70 64.9 4 SL40SF5 23 12 30 8 73 61.9 4 SL50SF5 27 3 21 30 81 53.6 4 SL30SF10 5 18 7 6 36 100.0 4 SL40SF10 14 13 10 2 39 96.9 4 SL50SF10 16 5 10 8 39 96.9 4 SL30SF15 17 23 1 15 56 79.4 4 SL40SF15 20 10 4 12 46 89.7 4 SL50SF15 20 5 5 15 45 90.7 4 CFA30SF5 19 11 22 14 66 69.1 4 CFA40SF5 7 15 17 7 46 89.7 3 CFA50SF5 4 13 16 24 57 78.4 3 CFA50SF7.5 27 17 26 11 81 53.6 3 CFA60SF7.5 35 23 32 29 119 14.4 2
Figure 4.6 indicates the normalized ranking and strength category of the investigated mixtures.
The control paste made with 100% cement exhibited the lowest performance, and the mixture

68
proportioned with 30% SL and 10% SF (SL30SF10) had the highest overall performance among
the investigated mixtures.
(a) Mixture arranged based on normalized ranking
(b) Mixture arranged based on strength category
Figure 4.6. Overall performance of paste mixtures

69
Figure 4.7 shows the variation in normalized ranking for the different strength categories.
Mixture belonging to category 4 of strength exhibited the highest variation in normalized
ranking, while mixtures in category 1 had the lowest variation in normalized ranking based on
the four properties: MWD, RWD, OWD, and φ. In other words, mixtures classified under first
strength category ( 7' 30daysf MPa< ) exhibited higher average of normalized ranking compared
to other categories.
Figure 4.7. Variation in normalized ranking with strength category
Table 4.3 presents the selected binder compositions from rank analysis. The selected binders
correspond to appropriate overall performance based on the flow characteristics and packing
density with various categories of early-age strength. It should be noted that ternary paste
mixtures made with 10% SF exhibited higher overall performance for each strength category
among investigated mixtures. However, due to the relatively higher risk of shrinkage cracking,
such mixtures were not selected. The effect of early-age strength of the selected binders on
modulus of elasticity and shrinkage cracking potential of concrete mixtures will be discussed in
Section 4.

70
Table 4.3. Selected binder compositions
Binder composition
Overall performance
(%)
Category of compressive
strength at 7 days
C 0 4 SL50 77 3 CFA50 46 2 FFA50SF5 37 2 FFA50 79 1 CFA70 26 1
4.2. Optimization of aggregate characteristics
The aim of this phase is to optimize the PSD of aggregates by the use experimental method
(gyratory compactor) to maximize the packing density of aggregate. The use of optimized
packing density of granular mixture results in a decrease in the amount of lubricant volume
needed to fill the void spaces between aggregate particles. Two different categories of aggregates
(category I: smooth and rounded aggregate, category II: crushed aggregate) with various
proportions of S/A were investigated, as given in Table 3.5. For each category, 11 different
proportions of combined aggregate (sand/medium Agg./coarse Agg.) were tested in order to
cover a wide range of binary and ternary blends of aggregate.
4.2.1. Aggregate optimization using packing density approach
The effect of aggregate characteristics on packing density was empirically evaluated to
determine the optimum PSD of various blends of aggregate. The variation of packing density for
different types of aggregate and S/A combinations are presented in Figure 4.8. Regardless of
aggregate type, the packing density of blended aggregate increases with the increase in S/A, up
to the maximum packing density and thereafter it decreases with further increase in S/A. Such
decrease in packing density is due to the loosening and wall effect, which can push the large

71
particles away, thus leading to lower packing density. For instance, aggregates proportioned with
40% river gravel, the increase of S/A content from 30% to 40% resulted in an increase in the
packing density from 0.79 to 0.81, while the use of 50% S/A reduced the packing density to 0.80.
Therefore, there exists an optimum S/A corresponding to the maximum achievable dry density
which is affected by the type and proportions of the combined aggregate. Mixtures made with
rough and angular aggregate needs more volume of sand to reach similar packing density as
those of mixtures proportioned with smooth and rounded aggregate. This can be attributed to the
higher internal friction between crushed aggregate which requires more fines to reduce the inter-
particle friction and achieve maximum packing density.
(a) Rounded aggregate
(b) Crushed aggregate
Figure 4.8. Effect of S/A on packing density

72
A ternary packing diagram (TPD) was developed based on the packing density of measured and
interpolated data, as shown in Figure 4.9. Given different aggregate proportions, packing density
varied from 0.65 to 0.815 and 0.65 to 0.80 for rounded and crushed aggregates, respectively.
The maximum packing density of rounded and crushed aggregates were 0.815 and 0.809,
respectively. Smooth and rounded blends had higher packing density compared to the crushed
aggregate combinations. In case of rounded aggregates, the difference between minimum and
maximum packing density is 0.16 which should be filled with the paste. Therefore, optimum
aggregate proportions can substantially affect the packing density of the mixture which is
essential in the design of Eco-Crete.
(a) Rounded aggregate (b) Crushed aggregate
Figure 4.9. TPD of the combined aggregate (Note: red points refer to the experimental points)
The packing density contours in Figure 4.9 indicates that, higher packing density of blended
aggregate was obtained with low volume of medium aggregate, regardless of the aggregate
types. In other words, coarse and fine aggregates play a more dominant role in the increase of

73
packing density of concrete. Based on the results from experimental packing density
measurement, the optimum blended aggregate corresponding to maximum packing density is
presented in Table 4.4.
Table 4.4. Optimum aggregate proportions based on the packing density measurement
Type River sand Medium Agg. Coarse Agg.
Rounded aggregate 42% 20% 38%
Crushed aggregate 48% 17% 35%
4.2.2. Theoretical model for PSD optimization
The distribution modulus (q) of modified Andreasen packing model has significant influence on
packing density of aggregate, and thus fresh and hardened properties of concrete. The use of a
lower q value results in a mixture with higher content of fine materials that can improve the
packing density by reducing the inter-particle friction and reduces the risk of segregation. On the
other hand, the PSD of the combined aggregate can influence the mean particle size and specific
surface area of the aggregate. For a given lubricant volume, an increase in the specific surface
area will result in a smaller paste film thickness around the aggregates, thus leading to a lower
workability. Investigations on highly flowable mixtures showed that the Andreasen model with
0.22<q<0.30 provides appropriate PSD for SCC mixtures. Mueller et al. (2014) recently reported
that the modified Andreasen model with q of 0.27 fits reasonable well to express the PSD of all
solids on Eco-SCC. An improved particle packing with an enhanced lattice effect can minimize
the lubricant demand and enhance the stability of the SCC mixtures. Brouwers and Radix (2005),

74
and Hunger and Brouwers (2006) also pointed out that the modified Andreasen packing model
with q values between 0.25 and 0.30 yield appropriate PSD to enhance passing ability, filling
stability, and stability of SCC mixtures.
An optimization algorithm was developed to determine q value of modified Andreasen equation
which relatively fits well to express the densely packed PSD determined from gyratory
compactor testing. This optimization was carried out in MATLAB program by minimizing the
difference between combined gradation of blended aggregate and Andreasen packing model.
Least squares technique was employed to minimize the residual between the gradation of the
densely packed mixture and the Andreasen model as follows:
[ ] [ ]
modified A&A
modified A&A
2 2( ) target mixture
1 1
min( ) min max
max min
( ( ) ( )) min
( ) , and 0.01,0.5
i
i i
i i i
n n
i q i ii i
q qi
q i i iq q
RSS e P d P d
d dP d d d d qd d
= =
= = − →
−= ∀ ∈ ∈
−
∑ ∑ ( 4-3)
where RSS is sum of the squares of residuals. modified A&A( )iqP is the fraction of the particle size
smaller than diameter d for the modified Andreasen with iq , and target mixtureP refers the fraction of
the particle size smaller than diameter id for the gradation of the target mixture, respectively.
Table 4.5 presents the appropriate q value corresponding to PSD of blended aggregate with
maximum packing density.
Table 4.5. Determined q value for selected aggregate combination
Type River sand Medium Agg. Coarse Agg. q (Andreasen
model)
Rounded aggregate 42% 20% 38% 0.29
Crushed aggregate 48% 17% 35% 0.32

75
4.2.3. Selection of optimum aggregate type and proportion
In addition to the maximum packing density and PSD optimization criteria, there are some other
factors that affect the selection of aggregate type and optimum proportions. Given lower inter-
locking between particles, the smooth texture and spherical shape of the river aggregate improve
the packing density, which can result in higher workability characteristics of SCC mixtures.
Therefore, for a given workability, the use of such aggregate decreases the required paste volume
which is very important in the design of ecological concrete. In addition, crushed aggregate
requires higher fine content to achieve the maximum packing density which results in higher
specific surface area to be coated with paste volume. For a given paste content, an increase in the
specific surface area of aggregates can result in lower paste film thickness surrounding the
aggregate, thus leading to a decrease in workability.
Based on the obtained results from different types and proportions of aggregate investigated in
this study, the combination of river sand, river gravel 5/16”, and river gravel 1” with the
proportions of 42%, 20%, and 38%, respectively, was selected. The PSD of the selected
aggregate combination is depicted in Figure 4.10. The selected aggregate blend had a packing
density of 0.815 and its PSD was close to Andreasen model with q value of 0.29.
Figure 4.10. PSD of selected aggregate combination

76
4.3. Comparison of shrinkage reducing strategies
Factorial design analysis was employed to model the effect of different shrinkage reducing
materials on autogenous shrinkage, drying shrinkage, and mechanical properties of mortars. The
modeled parameters included Type K EX, Type G EX, SRA, LWS, and initial MCP. Table 4.6
and Table 4.7 summarize the mixture proportions of the mortar mixtures containing Type K and
Type G EX, respectively. The HRWRA dosage was adjusted to secure the mini slump flow of
220 ± 25 mm (8.7 ± 1 in.). The EX and SRA contents were considered as a part of cement and
mixing water, respectively.
Table 4.6. Mixture proportions of mortar mixtures containing Type K EX
No. Codification Cement (lb/yd3)
Type K EX
(lb/yd3)
Sand (lb/yd3)
LWS (lb/yd3)
water (lb/yd3)
SRA (%)
HRWRA (oz/yd3) w/cm
Initial MCP (day)
1 C 530 0 1490 0 212 0 37 0.4 0 2 C-6 530 0 1490 0 212 0 37 0.4 6 3 F 530 0 1222 270 212 0 34 0.4 0 4 F-6 530 0 1222 270 212 0 34 0.4 6 5 S 530 0 1490 0 207 2 35 0.4 0 6 S-6 530 0 1490 0 207 2 35 0.4 6 7 SF 530 0 1222 270 207 2 39 0.4 0 8 SF-6 530 0 1222 270 207 2 39 0.4 6 9 EK 450 80 1490 0 212 0 55 0.4 0 10 EK-6 450 80 1490 0 212 0 55 0.4 6 11 EKF 450 80 1222 270 212 0 55 0.4 0 12 EKF-6 450 80 1222 270 212 0 55 0.4 6 13 EKS 450 80 1490 0 207 2 55 0.4 0 14 EKS-6 450 80 1490 0 207 2 55 0.4 6 15 EKSF 450 80 1222 270 207 2 61 0.4 0 16 EKSF-6 450 80 1222 270 207 2 61 0.4 6
C: Type I cement, F: fine lightweight aggregate, S: shrinkage reducing admixture, EK: Type K expansive agent For example: EKSF-6 = Type K expansive agent + shrinkage reducing admixture + fine lightweight aggregate + 6 days of moist-curing.

77
Table 4.7. Mixture proportions of mortar mixtures containing Type G EX
No. Codification Cement (lb/yd3)
Type G EX
(lb/yd3)
Sand (lb/yd3)
LWS (lb/yd3)
water (lb/yd3)
SRA (%)
HRWRA (oz/yd3) w/cm
Initial MCP (day)
1 C 530 0 1490 0 212 0 37 0.4 0 2 C-6 530 0 1490 0 212 0 37 0.4 6 3 F 530 0 1222 270 212 0 34 0.4 0 4 F-6 530 0 1222 270 212 0 34 0.4 6 5 S 530 0 1490 0 207 2 35 0.4 0 6 S-6 530 0 1490 0 207 2 35 0.4 6 7 SF 530 0 1222 270 207 2 39 0.4 0 8 SF-6 530 0 1222 270 207 2 39 0.4 6 9 EG 477 53 1490 0 212 0 49 0.4 0
10 EG-6 477 53 1490 0 212 0 49 0.4 6 11 EGF 477 53 1222 270 212 0 43 0.4 0 12 EGF-6 477 53 1222 270 212 0 43 0.4 6 13 EGS 477 53 1490 0 207 2 53 0.4 0 14 EGS-6 477 53 1490 0 207 2 53 0.4 6 15 EGSF 477 53 1222 270 207 2 52 0.4 0 16 EGSF-6 477 53 1222 270 207 2 52 0.4 6
C: Type I cement, F: fine lightweight aggregate, S: shrinkage reducing admixture, EG: Type G expansive agent For example: EGSF-6 = Type G expansive agent + shrinkage reducing admixture + fine lightweight aggregate + 6 days of moist-curing.
4.3.1. Autogenous shrinkage
The autogenous shrinkage results of mortars made with different shrinkage reducing materials
are compared in Figure 4.11. Based on ASTM C 1698, time zero or starting point for autogenous
shrinkage measurement was set at the final setting time of the investigated mixtures. Mixtures
made with either SRA or LWS exhibited lower autogenous shrinkage of 50 µstrain compared to
250 µstrain for the control mixture made without any shrinkage reducing material. The use of
Type K EX resulted in 230 µstrain expansion within the first 5 days and then, it turned to
shrinkage development to reach autogenous shrinkage of 25 µstrain. The incorporation of Type
G EX led to a significant expansion; mixture containing 10% Type G EX exhibited expansion of

78
1500 µstrain compared to 285 µstrain autogenous shrinkage for the control mixture (C). The
highest expansion was observed for the mixture made with the combination of Type G EX, SRA,
and LWS. The combined effects of reducing surface tension, internal curing, and developing
compressive stress result in a significant expansion in mixture. Similar results were observed by
Meddah and Sato (2010) who reported that concrete made with combination of SRA and the
recycled porous ceramic coarse aggregate as an internal water curing system is more efficient to
reduce shrinkage than that of mixture made with a mono system using SRA. It should be noted
that, the major difference between the results of the mixtures made with Type K and Type G EX
lie in the rate of early-age expansion, magnitude of expansion, and duration of expansion. As
presented in Figure 4.11, the autogenous shrinkage behavior can be classified into two modes.
The first mode consists of mixtures made with Type G EX where a significant expansion at the
early-age is followed for a long time expansion. The second mode includes mixtures containing
Type K EX, where a shorter duration of expansion is turned into shrinkage development.
Figure 4.11. Autogenous shrinkage of mortar mixtures

79
4.3.2. Total shrinkage
Figure 4.12 shows that the total shrinkage of mortars made with different shrinkage reducing
materials and initial curing conditions. Similar to the autogenous shrinkage results, mixture
proportioned with Type G EX exhibited the greatest expansion compared to the other mixtures,
regardless of the initial moist-curing period. On the other hand, the effect of Type K EX on
shrinkage reduction depends on initial moist-curing period. For example, for a given content of
Type K EX, mixture moist-cured for 6 days exhibited expansion of 430 µstrain compared to 650
µstrain drying shrinkage for the mixture without any moist-curing. This can be due to the higher
water demand of Type K expansive agent to produce ettringite crystals compared to the Type G
material. Beretka et al. (1996) reported that at a low w/cm, mixture made with Type K EX was
adversely affected due to the less water for the hydration of CSA.
Mixtures made with Type K EX and LWS exhibited lower drying shrinkage of 600 µstrain at 75
days compared to the 710 µstrain for a similar mixture made without any LWS. This is because
the internal moisture supplied by the LWS can maintain greater degree of saturation of the
cement paste. Therefore, the internal curing provided by LWS can enhance the efficiency of the
shrinkage reducing materials, especially for mixtures subjected to air drying without any initial
moist-curing. For a given moist-curing of 6 days, the combination of Type K EX and SRA
resulted in a further increase in expansion, from 460 µstrain to 710 µstrain compared with the
mortar mixture made with only Type K EX.

80
(a) Without moist-curing (1 day in the mold then air dried)
(b) With moist-curing (1 day in the mold then moist cured for 6 days)
Figure 4.12. Total shrinkage of mortar mixtures
4.3.3. Mechanical properties
Figure 4.13 and Figure 4.14 present the effect of shrinkage reducing materials and initial moist-
curing on the compressive and splitting tensile strengths, respectively. Regardless of the LWS

81
replacement, moist-cured mixtures developed higher mechanical properties than similar mixtures
exposed to air-drying at 23°C and 50% RH. The combined use of 20% LWS and 6 days of
moist-curing led to greater increase in mechanical properties compared to the use of 20% LWS
without moist-curing or 6 days of moist-curing without LWS. Mixture made with SRA had
approximately 13% lower compressive strength compared to the control mixture. The
replacement of cement by Type K EX resulted in 10% higher 28-day compressive strength than
the control mixture made with 100% cement. Similarly, for a given initial moist-curing period,
the incorporation of Type EX resulted in higher splitting tensile strength of 4.4 MPa (640 psi)
compared to 3.5 MPa (510 psi) of control mixture. The greatest enhancement in the 28-day
splitting tensile strength was obtained for mortar made with the combination of Type K EX and
LWS. This may be due to the expansion behavior of expansive cement which can fill the voids
between the cement particles and increase the density of the microstructure, leading to higher
mechanical properties. On the other hand, the use of Type G EX did not have significant effect
on mechanical properties compared to the mixtures containing Type K EX.
Figure 4.13. Effect of shrinkage reducing materials on compressive strength
(Note: 1 MPa = 145.04 psi)

82
Figure 4.14. Effect of shrinkage reducing materials on splitting tensile strength
(Note: 1 MPa = 145.04 psi)
4.3.4. Derived statistical models
Derived statistical models developed by factorial design approach are summarized in Table 4.8
and Table 4.9 for mixtures containing Type K and Type G EX, respectively. All factors are
expressed in terms of absolute values. The estimated coefficients in the models reflect the level
of significance of each response. A negative estimate indicates that an increase in the modeled
parameter can lead to a reduction in the measured response. The derived models for autogenous
shrinkage of mixtures containing Type K EX are mainly affected by the SRA dosage and EX
content. On the other hand, SRA concentration, initial MCP, interaction between Type K EX and
MCP, as well as Type K EX and SRA have significant effect on total shrinkage. It is important to
note that the estimated coefficients for Type K EX indicates that such shrinkage compensating
material is more efficient in reducing autogenous shrinkage compared to the drying shrinkage.
Initial moist-curing period was shown to have higher effect on shrinkage reduction than LWS
replacement. In other words, moist-cured mixture exhibit lower drying shrinkage compared to
the use of 20% LWS without moist-curing. Type G EX has considerable effect in reducing

83
autogenous and drying shrinkages, regardless of the initial moist-curing period. The comparison
of estimated coefficients between Type G and Type K EX indicate that the efficiency of Type K
EX in shrinkage reduction is more dependent on the initial moist-curing compared to Type G
EX.
Table 4.8. Derived statistical models for mortar mixtures containing Type K EX
Property Age Derived equation (actual values) R2 R2adj
Compressive
strength (MPa) 28
52.49 3.40( ) 0.02( ) 0.35( )2.22( ) 0.39( )( ) 0.03( )( )
SRA EK FLWAMCP SRA EK EK FLWA− + +
+ + − 0.94 0.89
Splitting tensile
strength (MPa) 28 2.90 0.05( ) 0.02( ) 0.09( )EK FLWA MCP+ + + 0.83 0.78
Autogenous
shrinkage (µstrain) 3 174.25 38.25( ) 21.33( ) 4.5( )SRA EK FLWA− + + + 0.97 0.97
Autogenous
shrinkage (µstrain) 14 191 28.62( ) 18.7 ( ) 6.21( )SRA EK FLWA− + + + 0.98 0.98
Total shrinkage
(µstrain) 7
517.75 107.75( ) 1( ) 56.91( )4.61( )( ) 2.8( )
SRA EK MCPMCP EK FLWA
− + + ++ + 0.96 0.94
Total shrinkage
(µstrain) 28
650.2 88.87 ( ) 11.54( ) 5.32( )( )4.21( )( ) 2.2( )
SRA MCP SRA EKMCP EK FLWA
− + + ++ + 0.97 0.95
Total shrinkage
µstrain) 56
693.31 130.81( ) 3( ) 5.25( )4.14( )( ) 1.3( )
SRA EK MCPMCP EK FLWA
− + + ++ + 0.92 0.89
Note: 1 MPa = 145.04 psi

84
Table 4.9. Derived statistical models for mortar mixtures containing Type G EX
Property Age Derived equation (actual values) R2 R2adj
Compressive
strength (MPa) 28
49.62 1.95( ) 0.54( ) 0.37 ( )3.52( ) 0.03( )( ) 0.8( )( )
SRA EG LWSMCP EG MCP SRA MCP− − +
+ + − 0.96 0.92
Splitting tensile
strength (MPa) 28 3.15 0.12( ) 0.01( ) 0.07 ( )SRA LWS MCP− + + 0.83 0.79
Autogenous
shrinkage (µstrain) 3
176.5 46.5( ) 137.22( ) 3.9( )18.27 ( )( ) 1.99( )( )
SRA EG LWSSRA EG EG LWS
− + + ++ +
0.99 0.99
Autogenous
shrinkage (µstrain) 14
272.87 27.75( ) 171.8( )14.48( ) 18.97 ( )( )
SRA EGLWS SRA EG
− + ++ +
0.99 0.99
Total shrinkage
(µstrain) 7 410 42( ) 47.62( ) 20.18( )( )EG MCP MCP EG− + + + 0.92 0.89
Total shrinkage
(µstrain) 28 527.5 76.12( ) 10.04( ) 13.1( )( )EG MCP EG MCP− + + + 0.93 0.91
Total shrinkage
(µstrain) 56 562.5 95.05( ) 4.91( ) 10.04( )( )EG MCP MCP EG− + + + 0.88 0.85
Note: 1 MPa = 145.04 psi
The 7-day drying shrinkage (total shrinkage) surface response is depicted in Figure 4.15 to
indicate the interaction between the initial moist-curing and expansive agent. Mixture made with
the combination of initial moist-curing and Type K EX has expansion compared to the mixture
prepared with only Type K EX without any moist-curing. For instance, mixture made with 15%
Type K EX exhibited approximately 500 µstrain of total shrinkage at 7 days compared to 350
µstrain expansion for mixture made with the 15% Type K EX and 6 days of moist-curing. On the
other hand, the use of 10% Type G EX and without moist-curing can lead to slightly expansion
of 25 µstrain compared to the 410 µstrain of drying shrinkage for control mixture. The combined
use of 10% Type G EX and 6 days of moist-curing resulted in a significant expansion of 1600
µstrain after 7 days of drying. The results confirm that the efficiency of the both Type K and

85
Type G EX are highly dependent on initial moist-curing. However, in case of without moist-
curing, mixture containing Type G EX exhibited slightly expansion of 10 µstrain compared to
400 µstrain shrinkage for mixture prepared with 15% Type K EX.
(b) Type K EX
(b) Type G EX
Figure 4.15. Effect of initial moist-curing on the performance of expansive agents

86
4.3.5. Selection of optimum shrinkage reducing strategies
Mixture made with partial replacement of Type K EX combined with SRA and LWS exhibited
lower shrinkage and longer duration of expansion which can increase the resistance to early-age
cracking. However, the Type K EX requires higher water demand to produce ettringite crystals
for expansion. Therefore, mixtures containing CSA-based EX should be moist-cured to enhance
the efficiency of such material on higher expansion and lower shrinkage. The incorporation of
Type G EX combined with LWS, and initial moist-curing also lead to substantial reduction in
shrinkage. Mixture made Type G EX required lower demand of initial moist-curing compared to
those prepared with Type K EX.
Based on the obtained results from statistical analysis, mixtures were ranked using performance
rank analysis. Two shrinkage reducing strategies with the highest overall performance were
selected, as presented in Table 4.10. The performance of selected shrinkage reducing strategies
on shrinkage and early-age cracking of concrete mixtures will be discussed in the next Section.
Table 4.10. Selected shrinkage reducing strategies from statistical analysis
Shrinkage reducing strategies
Type K EX (%)
Type G EX (%)
SRA (%)
LWA (%)
Compressive strength at
28 days (MPa)
Tensile strength at
28 days (MPa)
Total shrinkage at 7 days (µstrain)
Total shrinkage
at 56 days
(µstrain)
Overall performance
(%)
1 12.5 0 2 20 68.5 4.5 (+) 453.5 (-) 25.9 70 2 0 7.5 0 20 75.5 3.8 (+) 1098 (+) 631 81 Note: 1 MPa = 145.04 psi (+) and (-) refer to expansion and shrinkage, respectively.
4.4. Development of crack-free Eco-Crete
This phase is to develop and optimize crack-free Eco-Crete to meet the targeted performance
specifications. The optimized binder compositions, PSD of blended aggregate, and shrinkage
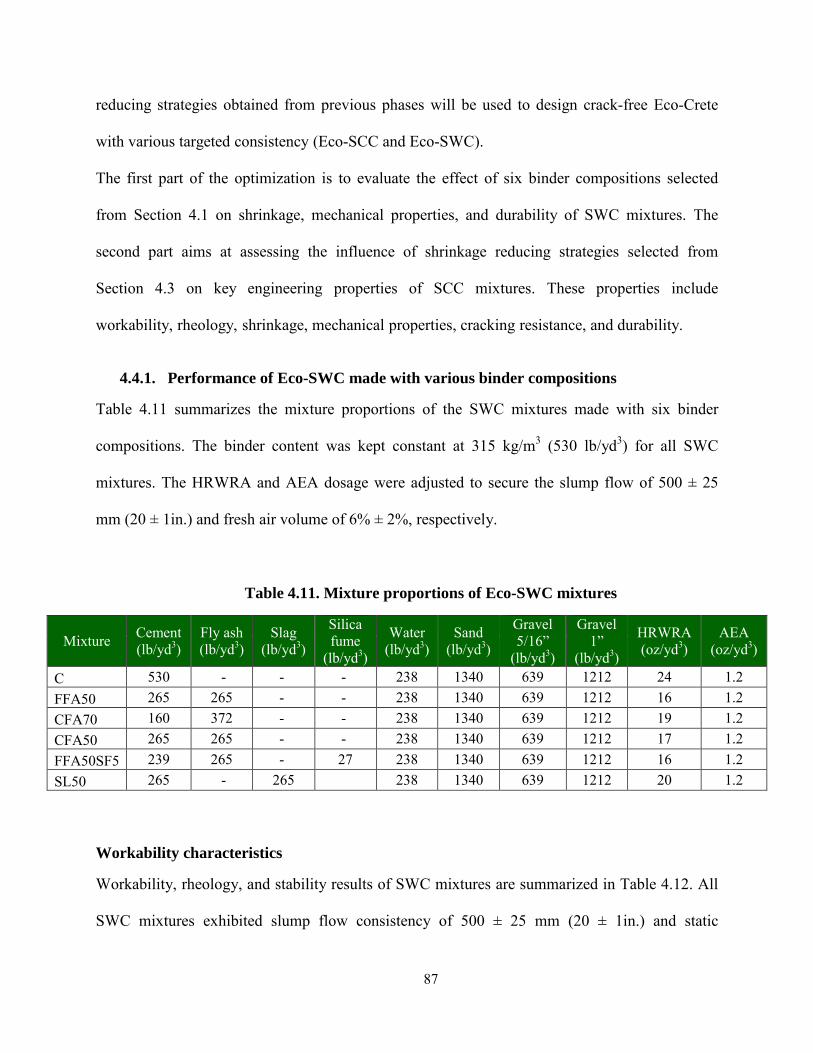
87
reducing strategies obtained from previous phases will be used to design crack-free Eco-Crete
with various targeted consistency (Eco-SCC and Eco-SWC).
The first part of the optimization is to evaluate the effect of six binder compositions selected
from Section 4.1 on shrinkage, mechanical properties, and durability of SWC mixtures. The
second part aims at assessing the influence of shrinkage reducing strategies selected from
Section 4.3 on key engineering properties of SCC mixtures. These properties include
workability, rheology, shrinkage, mechanical properties, cracking resistance, and durability.
4.4.1. Performance of Eco-SWC made with various binder compositions
Table 4.11 summarizes the mixture proportions of the SWC mixtures made with six binder
compositions. The binder content was kept constant at 315 kg/m3 (530 lb/yd3) for all SWC
mixtures. The HRWRA and AEA dosage were adjusted to secure the slump flow of 500 ± 25
mm (20 ± 1in.) and fresh air volume of 6% ± 2%, respectively.
Table 4.11. Mixture proportions of Eco-SWC mixtures
Mixture Cement (lb/yd3)
Fly ash (lb/yd3)
Slag (lb/yd3)
Silica fume
(lb/yd3)
Water (lb/yd3)
Sand (lb/yd3)
Gravel 5/16”
(lb/yd3)
Gravel 1”
(lb/yd3)
HRWRA (oz/yd3)
AEA (oz/yd3)
C 530 - - - 238 1340 639 1212 24 1.2 FFA50 265 265 - - 238 1340 639 1212 16 1.2 CFA70 160 372 - - 238 1340 639 1212 19 1.2 CFA50 265 265 - - 238 1340 639 1212 17 1.2 FFA50SF5 239 265 - 27 238 1340 639 1212 16 1.2 SL50 265 - 265 238 1340 639 1212 20 1.2
Workability characteristics
Workability, rheology, and stability results of SWC mixtures are summarized in Table 4.12. All
SWC mixtures exhibited slump flow consistency of 500 ± 25 mm (20 ± 1in.) and static
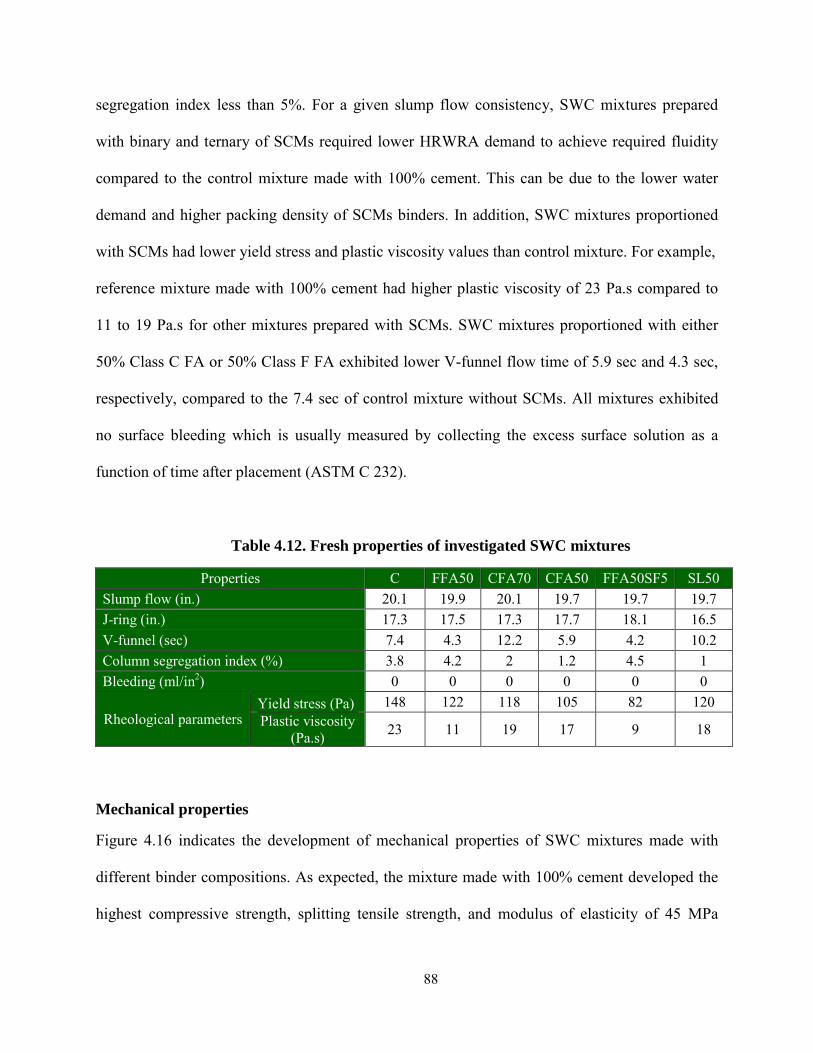
88
segregation index less than 5%. For a given slump flow consistency, SWC mixtures prepared
with binary and ternary of SCMs required lower HRWRA demand to achieve required fluidity
compared to the control mixture made with 100% cement. This can be due to the lower water
demand and higher packing density of SCMs binders. In addition, SWC mixtures proportioned
with SCMs had lower yield stress and plastic viscosity values than control mixture. For example,
reference mixture made with 100% cement had higher plastic viscosity of 23 Pa.s compared to
11 to 19 Pa.s for other mixtures prepared with SCMs. SWC mixtures proportioned with either
50% Class C FA or 50% Class F FA exhibited lower V-funnel flow time of 5.9 sec and 4.3 sec,
respectively, compared to the 7.4 sec of control mixture without SCMs. All mixtures exhibited
no surface bleeding which is usually measured by collecting the excess surface solution as a
function of time after placement (ASTM C 232).
Table 4.12. Fresh properties of investigated SWC mixtures
Properties C FFA50 CFA70 CFA50 FFA50SF5 SL50 Slump flow (in.) 20.1 19.9 20.1 19.7 19.7 19.7 J-ring (in.) 17.3 17.5 17.3 17.7 18.1 16.5 V-funnel (sec) 7.4 4.3 12.2 5.9 4.2 10.2 Column segregation index (%) 3.8 4.2 2 1.2 4.5 1 Bleeding (ml/in2) 0 0 0 0 0 0
Rheological parameters Yield stress (Pa) 148 122 118 105 82 120 Plastic viscosity
(Pa.s) 23 11 19 17 9 18
Mechanical properties
Figure 4.16 indicates the development of mechanical properties of SWC mixtures made with
different binder compositions. As expected, the mixture made with 100% cement developed the
highest compressive strength, splitting tensile strength, and modulus of elasticity of 45 MPa

89
(6500 psi), 3.4 MPa (500 psi), and 38.5 GPa (5.6 × 10⁶ psi), respectively. The concrete mixtures
made with SCMs developed 28 and 56-day compressive strengths of 18 to 36 MPa (2600 to 5200
psi) and 22 to 40 MPa (3200 to 5800 psi), respectively. Depending on the binder type, mixtures
made with binary and ternary of SCMs exhibited 9% to 45% lower compressive strength, 6% to
43% lower splitting tensile strength, and 4% to 29% lower modulus of elasticity at 56 days
compared to the control concrete made with 100% cement. Mixtures prepared with either 50%
slag or 50% Class C FA had higher compressive strength, splitting tensile strength, and modulus
of elasticity compared to the other mixtures having SCMs. The mixtures containing Class F FA
exhibited the lowest compressive strength, splitting tensile strength, and modulus of elasticity
than the other mixtures containing SCMs. Based on the obtained results, mixtures proportioned
with 50% Class F fly ash replacement did not achieve the required 56-day compressive strength
of 30 to 40 MPa (4350 to 5800 psi).
(a) Compressive strength

90
(b) Splitting tensile strength
(c) Modulus of elasticity
Figure 4.16. Mechanical properties of SWC mixtures (Note: 1 MPa = 145.04 psi)
Shrinkage
The autogenous and drying shrinkage of reference and SWC mixtures are presented in Figure
4.17. Mixture made with 100% cement exhibited the highest autogenous and drying shrinkages

91
of 210 and 361 µstrain, respectively, compared to other concrete mixtures made with SCMs.
Mixtures proportioned with SCMs exhibited drying shrinkage values ranging between 290 and
315 µstrain after 120 days of drying. Mixture containing 50% slag had the lowest autogenous
and drying shrinkage values of 45 and 215 µstrain, respectively, at 60 and 120 days compared to
other mixtures. This can be due higher pozzolanic reactivity of slag which can produce the
denser microstructure and reduce capillary porosity. Furthermore, this can also be caused by
higher modulus of elasticity of SWC mixture made with slag replacement. Mixture having higher
modulus of elasticity can develop lower drying shrinkage compared to those with lower elastic
modulus (Hwang and Khayat 2010). Replacement of cement by 50% of Class C fly ash resulted
in 57% and 41% decrease in autogenous and drying shrinkage values, respectively, compared to
control mixture made with 100% cement. Similarly, the use of 50% Class F fly ash led to 30%
and 26% reduction in autogenous and drying shrinkage, respectively.
(a) Autogenous shrinkage
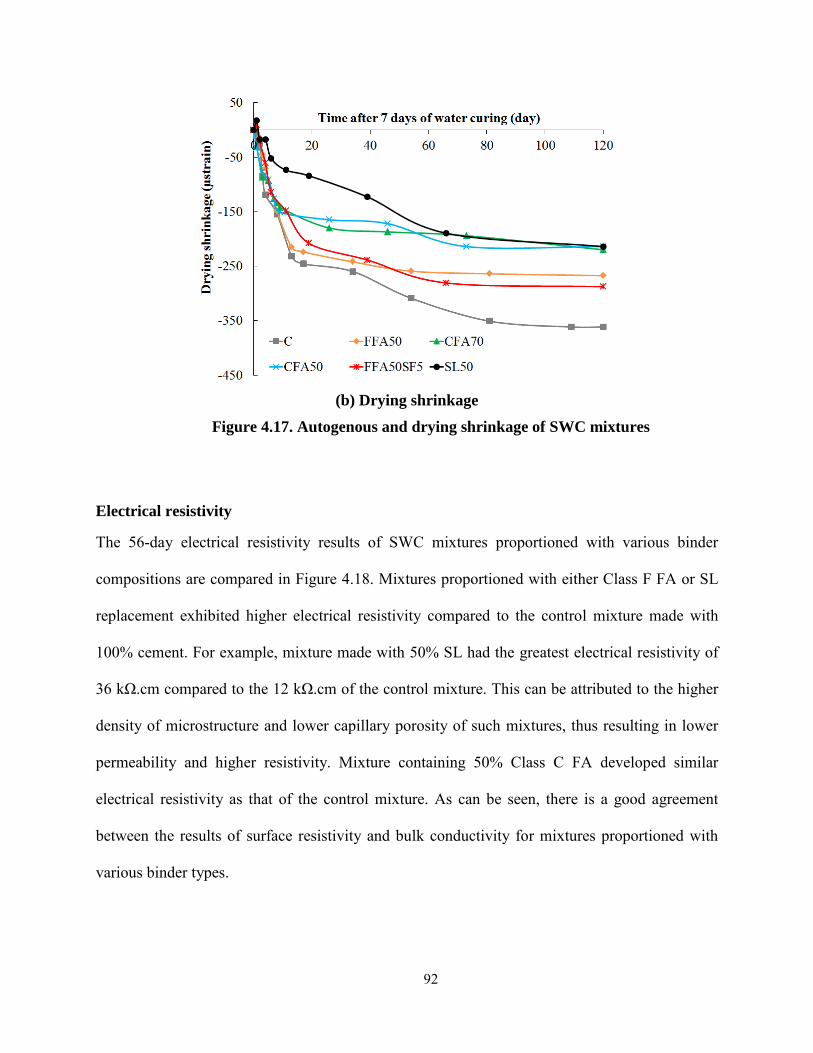
92
(b) Drying shrinkage
Figure 4.17. Autogenous and drying shrinkage of SWC mixtures
Electrical resistivity
The 56-day electrical resistivity results of SWC mixtures proportioned with various binder
compositions are compared in Figure 4.18. Mixtures proportioned with either Class F FA or SL
replacement exhibited higher electrical resistivity compared to the control mixture made with
100% cement. For example, mixture made with 50% SL had the greatest electrical resistivity of
36 kΩ.cm compared to the 12 kΩ.cm of the control mixture. This can be attributed to the higher
density of microstructure and lower capillary porosity of such mixtures, thus resulting in lower
permeability and higher resistivity. Mixture containing 50% Class C FA developed similar
electrical resistivity as that of the control mixture. As can be seen, there is a good agreement
between the results of surface resistivity and bulk conductivity for mixtures proportioned with
various binder types.

93
Figure 4.18. Electrical resistivity of SWC mixtures at 56-day
Chini et al. (2003) investigated the correlation between surface resistivity and rapid chloride ion
permeability. The experimental program included a wide range of concrete mixtures made
various binder types, binder contents, and w/cm. Table 4.13 presents the relationship between the
surface resistivity and the rapid chloride ion permeability which was proposed by proposed by
Chini et al. (2003). According to the proposed correlation, mixtures containing either 50% SL or
combined use of 50% Class F FA and 5% SF can be considered to exhibit low chloride ion
permeability. Mixtures made with either 100% cement or 50% Class C FA replacement ash are
classified with moderate chloride ion permeability.

94
Table 4.13. Correlation between the surface resistivity and chloride ion permeability proposed by Chini et al. (2003)
Chloride ion permeability
RCP test Surface resistivity
Coulomb (kΩ.cm)
High ˃4000 ˂12
Moderate 2000-4000 12-21
Low 1000-2000 21-37
Very low 100-1000 37-254
Negligible ˂100 ˃254
Estimation of cracking potential of SWC mixtures
Special care should be taken to select the binder compositions to limit compressive strength and
elastic modulus of concrete. Otherwise, high strength and stiffness could lead to early-age
cracking due to the lower tensile stress relaxation. Hwang and Khayat (2008) pointed out that the
results of drying shrinkage after 7 or 56 days and modulus of elasticity at 3 days can be used to
assess the shrinkage cracking potential of concrete. The cracking potential can be expressed as a
function of drying shrinkage and modulus of elasticity, as follows (Hwang and Khayat 2008):
[ ] 13.48
(%) 1.58 0.161 ( )526 0.0122 ( ) 1.059Cracking potential drying shrinkage strain
Modulus of elasticity GPa= + µ −
× − + ( 4-4)
It should be noted that mixtures made with 50% Class F FA did not meet the targeted
compressive strength. As presented in Table 4.14, mixture made with 50% Class C FA exhibited
lower cracking potential of 3.3% compared to the 44.7% for the control mixture made with
100% cement. Furthermore, the use of 50% Class C FA resulted in lower elastic modulus at

95
early-age compared with mixture proportioned with 50% SL, thus leading to a lower cracking
potential due to a higher stress relaxation.
Table 4.14. Estimation of cracking potential for selected binders
Investigated parameters to estimate cracking potential
Mixture C CFA50 SL50
Drying shrinkage at 7 days (μstrain) 174 126 55 Drying shrinkage at 56 days (μstrain) 274 180 170 Autogenous shrinkage at 7 days (μstrain) 81 25 10 Compressive strength at 7 days (MPa) 29 21 22.5 Splitting tensile strength at 7 days (MPa) 2.3 2 2.2 MOE at 3 days (GPa) 28 21 25 Estimated cracking potential (Hwang and Khayat 2008) 45% 3% 17 %
(Note: 1 MPa = 145.04 psi)
4.4.2. Performance of Eco-SCC containing shrinkage reducing materials
The aim of this part is to assess the influence of selected shrinkage reducing strategies from
Section 4.3 on key engineering properties of Eco-SCC mixtures. These properties include
workability, rheology, shrinkage, mechanical properties, cracking resistance, and durability.
Table 4.15 summarizes the mixture proportions of the SCC mixtures made with different binder
types and shrinkage reducing strategies. The RSCC-425 reference mixture was made with 100%
cement and relatively higher binder content of 425 kg/m3 (716 lb/yd3). The RSCC-315 reference
mixture was made with the same mixture proportioning as RSCC-425, except for a lower cement
content of 315 kg/m3 (530 lb/yd3). 45-B1-F1 and 45-B2-F1 were proportioned with 0.3%
synthetic fiber and 315 kg/m3 (530 lb/yd3) of blended cement of B1 and B2, respectively. The B1
blended cement contains 50% cement and 50% Class C FA, while the B2 cement includes 50%
cement and 50% SL. The last four mixtures were prepared with blended cements of B1 and B2

96
and shrinkage reducing strategies of C1 and C2. The C1 contains 12.5% Type K EX, 2% SRA,
and 20% LWS, while the C2 incorporates 7.5% Type G EX and 20% LWS. The HRWRA and
AEA dosage were adjusted to secure the slump flow of 650 ± 50 mm (25 ± 2 in.) and fresh air
volume of 6 ± 2%. The binder content of all Eco-SCC mixtures was kept constant at 315 kg/m3
(530 lb/yd3).
Table 4.15. Mixture proportions of Eco-SCC mixtures
45-
RSCC-425
45-RSCC-
315
50-RSCC-
315 45-B1-F1 45-B2-F1 45-B2-
F2 45-B1-F1-
C1 45-B1-F1-
C2 45-B2-F1-
C1 45-B2-F1-
C2
Cement (lb/yd3) 716 530 530 265 265 265 199 226 226 199
Fly ash (lb/yd3) — — — 265 — — 265 265 — —
Slag (lb/yd3) — — — — 265 265 — — 265 265 Water (lb/yd3) 322 238 265 238 238 238 228 238 228 238
Sand (lb/yd3) 1227 1340 1330 1340 1340 1340 1072 1072 1072 1072 Gravel 5/16” (lb/yd3) 585 639 634 836 836 1078 836 836 836 836
Gravel 1” (lb/yd3) 1112 1212 1200 1015 1015 775 1015 1015 1015 1015
LWS (lb/yd3) — — — — — — 270 270 270 270 Type K EX(lb/yd3) — — — — — — 66 — 66 —
Type G EX (lb/yd3) — — — — — — — 40 — 40
Fiber, by volume (Type)
— — — 0.3 (synthetic)
0.3 (synthetic)
0.5 (steel)
0.3 (synthetic)
0.3 (synthetic)
0.3 (synthetic)
0.3 (synthetic) — — —
SRA (oz/yd3) — — — — — — 162.6 — 162.6 — HRWRA (oz/yd3) 18 28 19 28 35 35 37 30 46 33
VEA (oz/yd3) — 16 32 20 81 51 75 81 130 101 AEA (oz/yd3) 1.52 1 1.6 1 1 1 1 1 1 1
B1 = Type I/II cement + 50% Class C fly ash; B2 = Type I/II cement + 50% slag F1 and F2 refer to synthetic and steel fibers, respectively. C1 = 12.5% Type K EX, 2% SRA, and 20% LWS; C2 = 7.5% Type G EX and 20% LWS.
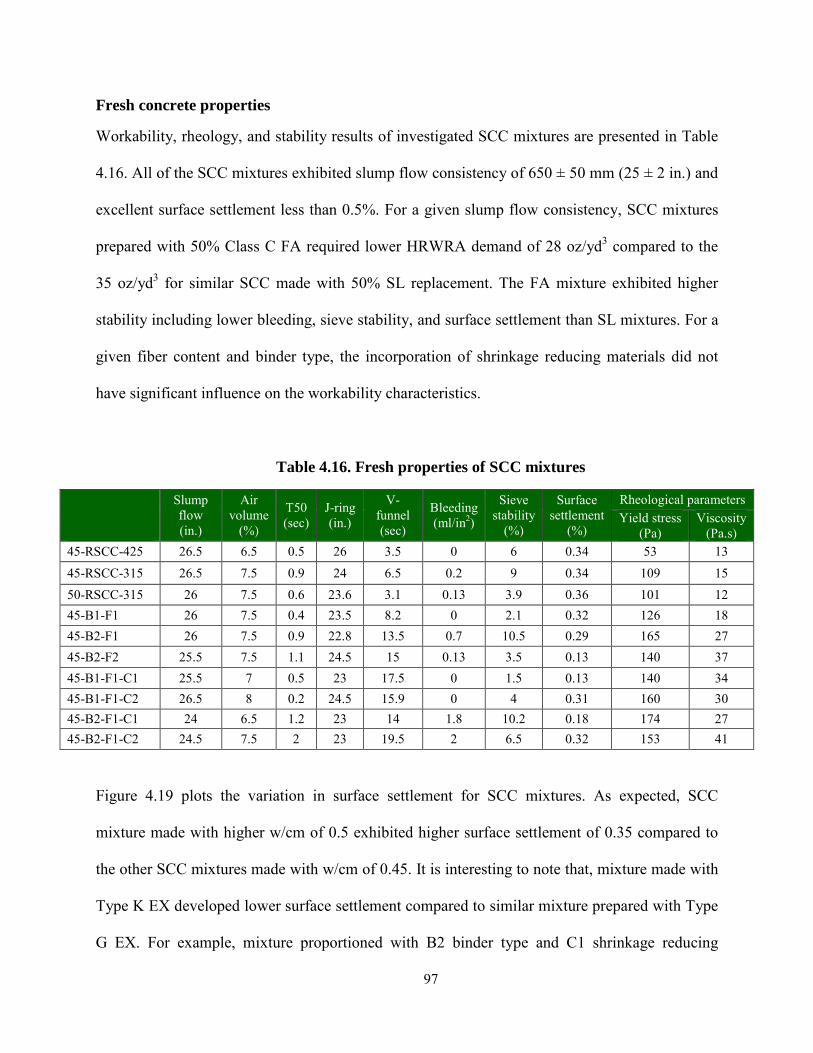
97
Fresh concrete properties
Workability, rheology, and stability results of investigated SCC mixtures are presented in Table
4.16. All of the SCC mixtures exhibited slump flow consistency of 650 ± 50 mm (25 ± 2 in.) and
excellent surface settlement less than 0.5%. For a given slump flow consistency, SCC mixtures
prepared with 50% Class C FA required lower HRWRA demand of 28 oz/yd3 compared to the
35 oz/yd3 for similar SCC made with 50% SL replacement. The FA mixture exhibited higher
stability including lower bleeding, sieve stability, and surface settlement than SL mixtures. For a
given fiber content and binder type, the incorporation of shrinkage reducing materials did not
have significant influence on the workability characteristics.
Table 4.16. Fresh properties of SCC mixtures
Slump flow (in.)
Air volume
(%)
T50 (sec)
J-ring (in.)
V-funnel (sec)
Bleeding (ml/in2)
Sieve stability
(%)
Surface settlement
(%)
Rheological parameters Yield stress
(Pa) Viscosity
(Pa.s) 45-RSCC-425 26.5 6.5 0.5 26 3.5 0 6 0.34 53 13 45-RSCC-315 26.5 7.5 0.9 24 6.5 0.2 9 0.34 109 15 50-RSCC-315 26 7.5 0.6 23.6 3.1 0.13 3.9 0.36 101 12 45-B1-F1 26 7.5 0.4 23.5 8.2 0 2.1 0.32 126 18 45-B2-F1 26 7.5 0.9 22.8 13.5 0.7 10.5 0.29 165 27 45-B2-F2 25.5 7.5 1.1 24.5 15 0.13 3.5 0.13 140 37 45-B1-F1-C1 25.5 7 0.5 23 17.5 0 1.5 0.13 140 34 45-B1-F1-C2 26.5 8 0.2 24.5 15.9 0 4 0.31 160 30 45-B2-F1-C1 24 6.5 1.2 23 14 1.8 10.2 0.18 174 27 45-B2-F1-C2 24.5 7.5 2 23 19.5 2 6.5 0.32 153 41
Figure 4.19 plots the variation in surface settlement for SCC mixtures. As expected, SCC
mixture made with higher w/cm of 0.5 exhibited higher surface settlement of 0.35 compared to
the other SCC mixtures made with w/cm of 0.45. It is interesting to note that, mixture made with
Type K EX developed lower surface settlement compared to similar mixture prepared with Type
G EX. For example, mixture proportioned with B2 binder type and C1 shrinkage reducing

98
materials (Type K EX) exhibited 65% lower surface settlement and 10% lower bleeding
compared to the similar mixture containing C2 shrinkage reducing materials (Type G EX). This
can be attributed to the formation of ettringite crystals of Type K expansive agent.
Figure 4.19. Variation in surface settlement of SCC mixtures
Mechanical properties
Mechanical properties of SCC mixtures are presented in Figure 4.20. Regardless of the binder
type, mixture containing type K EX developed higher mechanical properties than Type G EX.
For example, mixture made with 50% SL and 12.5% Type K EX exhibited 56-day compressive
and splitting tensile strengths of 34 MPa (4930 psi) and 2.9 MPa (421 psi), respectively,
compared to 28 MPa (4061 psi) and 2.4 MPa (348 psi) for similar mixture made with 7.5% Type
G EX.
The 45-RSCC-425 mixture developed the highest 56-day compressive strength and modulus of
elasticity of 48.5 MPa (7050 psi) and 39.2 GPa (5.7 × 10⁶ psi), respectively. On the other hand,
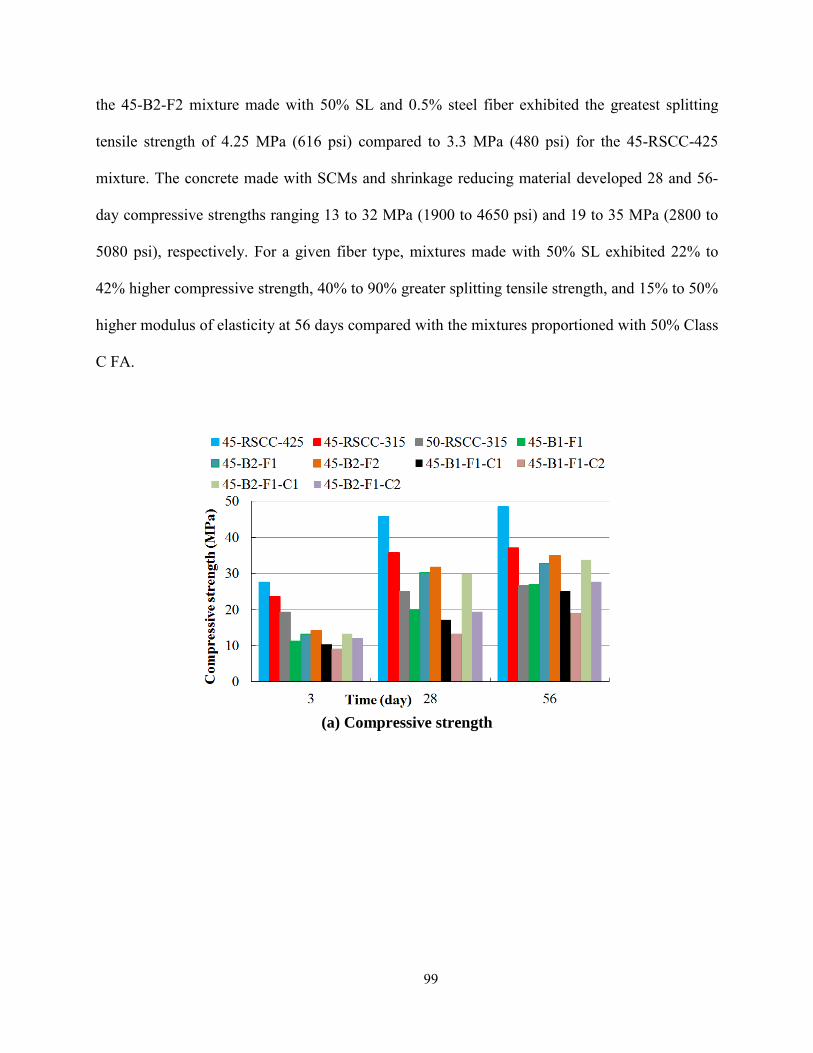
99
the 45-B2-F2 mixture made with 50% SL and 0.5% steel fiber exhibited the greatest splitting
tensile strength of 4.25 MPa (616 psi) compared to 3.3 MPa (480 psi) for the 45-RSCC-425
mixture. The concrete made with SCMs and shrinkage reducing material developed 28 and 56-
day compressive strengths ranging 13 to 32 MPa (1900 to 4650 psi) and 19 to 35 MPa (2800 to
5080 psi), respectively. For a given fiber type, mixtures made with 50% SL exhibited 22% to
42% higher compressive strength, 40% to 90% greater splitting tensile strength, and 15% to 50%
higher modulus of elasticity at 56 days compared with the mixtures proportioned with 50% Class
C FA.
(a) Compressive strength

100
(b) Splitting tensile strength
(c) Modulus of elasticity
Figure 4.20. Mechanical properties of SCC mixtures (Note: 1 MPa = 145.04 psi)
Figure 4.21 shows the 56-day load-deflection responses of SCC mixtures. Mixture made with
0.5% steel fiber had the greatest area under load-deflection curve compared to other mixtures
proportioned with synthetic fiber. On the other hand, the 45-RSCC-425 mixture developed the

101
highest peak strength and the lowest ductility behavior and residual strength among all mixtures.
Regardless of the shrinkage reducing materials, mixture proportioned with 50% SL exhibited
higher peak load and residual strength compared to the mixture made with 50% FA.

102
Figure 4.21. Load-deflection curve of SCC mixtures
Figure 4.22 compares the 56-day flexural strength of SCC mixtures. For a given fiber type and
content, mixture containing 50% SL developed 20% to 36% higher flexural strength than
mixture made with 50% FA. Regardless of the binder type, mixture containing Type K EX
developed 15% to 20% higher flexural strength compared to the mixture made with Type G EX.
Mixture made with the combined use of Type K EX and binary SCMs exhibited similar flexural
strength as those of mixture made with only binary SCMs. However, mixtures containing Type
G EX and SCMs had 6% to 17% lower flexural strength than similar mixture made without
shrinkage reducing materials.

103
Figure 4.22. Comparison of 56-day flexural strength of SCC mixtures
(Note: 1 MPa = 145.04 psi)
The 56-day flexural toughness (area under the load-deflection curve) results of SCC mixtures
made with fibers are compared in Figure 4.23. It is interesting to note that, for the 45-B2-F1
mixture, the use of Type G and Type K EX resulted in 9% to 12% and 26% to 49% increase in
flexural toughness, respectively. This may be due to the induced compressive stress provided by
expansive cements which can lead to forming of internal pre-stressed condition in concrete.
Internal pre-stressed concrete may result in higher residual strength and flexural toughness.
Bentz and Jensen (2004) also reported that as long as proper restraint is provided, the expansion
of self-stressing materials can pre-stress concrete and improve its tensile capacity. As expected,
mixture made with 0.5% steel fiber (F2) substantially developed higher flexural toughness of 7.5
N.m (66.4 lb.in) compared to the other mixture made with synthetic fiber.

104
Figure 4.23. Comparison of 56-day flexural toughness of SCC mixtures
(Note: 1 N.m = 8.85 lb.in)
Durability
The 56-day water absorption and permeable void volume of SCC mixtures are compared in
Figure 4.24. Water absorption is mainly influenced by the interconnected capillary porosity in
the paste. For a given w/cm, concrete mixtures with higher paste contents are susceptible to have
higher absorption values than concretes with lower paste content. Mixture made 315 kg/m3 (530
lb/yd3) cement had 13.5% and 15.5% lower water absorption and permeable void, respectively,
compared to the mixture with 425 kg/m3 (716 lb/yd3) cement. For a given binder content,
mixtures made with SCMs had slightly lower water absorption and permeable void than
reference mixture made with 100% cement. The influence of shrinkage reducing materials on the
water absorption and permeable void volume was negligible, as presented in Figure 4.24.

105
Figure 4.24. 56-day water absorption and permeable void of SCC mixtures
Figure 4.25 compares the 56-day electrical resistivity. As in the case of water absorption, the
lowest electrical resistivity (5.2 kΩ.cm) was observed in RSCC-425 reference mixture. Mixtures
proportioned with 50% SL substantially exhibited the highest electrical resistivity of 30 kΩ.cm
among the mixtures. Mixture containing 50% Class C FA developed similar electrical resistivity
of 8 kΩ.cm as that of control mixture made with 315 kg/m3 (530 lb/yd3).
Based on the obtained results, the influence of shrinkage reducing materials on electrical
resistivity varies with binder composition. For example, the incorporation of shrinkage reducing
materials in mixture made with 50% FA led to 13% to 39% decrease in electrical resistivity
compared to the similar mixture without any shrinkage reducing materials. However, in the case
of 50% SL, the incorporation of shrinkage reducing materials resulted in 10% to 38% increase in
electrical resistivity compared to the similar binary mixture made without any shrinkage
reducing materials. According to the proposed relationship between surface resistivity and rapid

106
chloride ion permeability by Chini et al. (2003), mixtures containing 50% SL can be considered
to exhibit low chloride ion permeability, regardless of shrinkage reducing materials.
Figure 4.25. Comparison of 56-day electrical resistivity of SCC mixtures
The variation in durability factor of SCC mixtures after 100 freeze–thaw cycles is shown in
Figure 4.26. Mixture with durability factor greater than 80% after 300 freeze-thaw cycles
(ASTM C 666, Proc. A) can be considered to exhibit adequate frost durability. Freeze-thaw
testing is currently underway and results of SCC mixtures will be discussed ones the test is done.

107
Figure 4.26. Frost durability of SCC mixtures
Autogenous and drying shrinkage
Figure 4.27 presents the autogenous and drying shrinkage results of SCC mixtures. Regardless of
binder type, the incorporation of shrinkage reducing strategies resulted in early-age expansion
and lower shrinkage compared to the control mixture. As expected, the 45-RSCC-315 reference
mixture exhibited higher drying shrinkage of 350 µstrain compared to 100 µstrain for mixtures
prepared with shrinkage reducing materials. The results of drying shrinkage show that, mixtures
made with shrinkage reducing materials exhibited expansion from 50 to 150 µstrain within the
first 3 days compared to 75 µstrain shrinkage for control mixture without any shrinkage reducing
material. The major differences between the results of the mixtures made with Type K and Type
G EX lie in the magnitude of early-age expansion and duration of expansion. The use of Type G
EX can lead to higher expansion with higher duration of expansion compared to the mixture
made with Type K EX. The use of 12.5% Type K EX resulted in 50 µstrain expansion within the
first 2 days, and then it turned into to shrinkage of 120 µstrain after 55 days of drying. On the

108
other hand, mixture containing 7.5% Type G EX exhibited 150 µstrain expansion, and it tuned
into 120 µstrain shrinkage after 55 days.
(a) Autogenous shrinkage
(b) Drying shrinkage
Figure 4.27. Autogenous and drying shrinkage of SCC mixtures
(C1 = 12.5% Type K EX, 2% SRA, and 20% LWS; C2 = 7.5% Type G EX and 20% LWS)
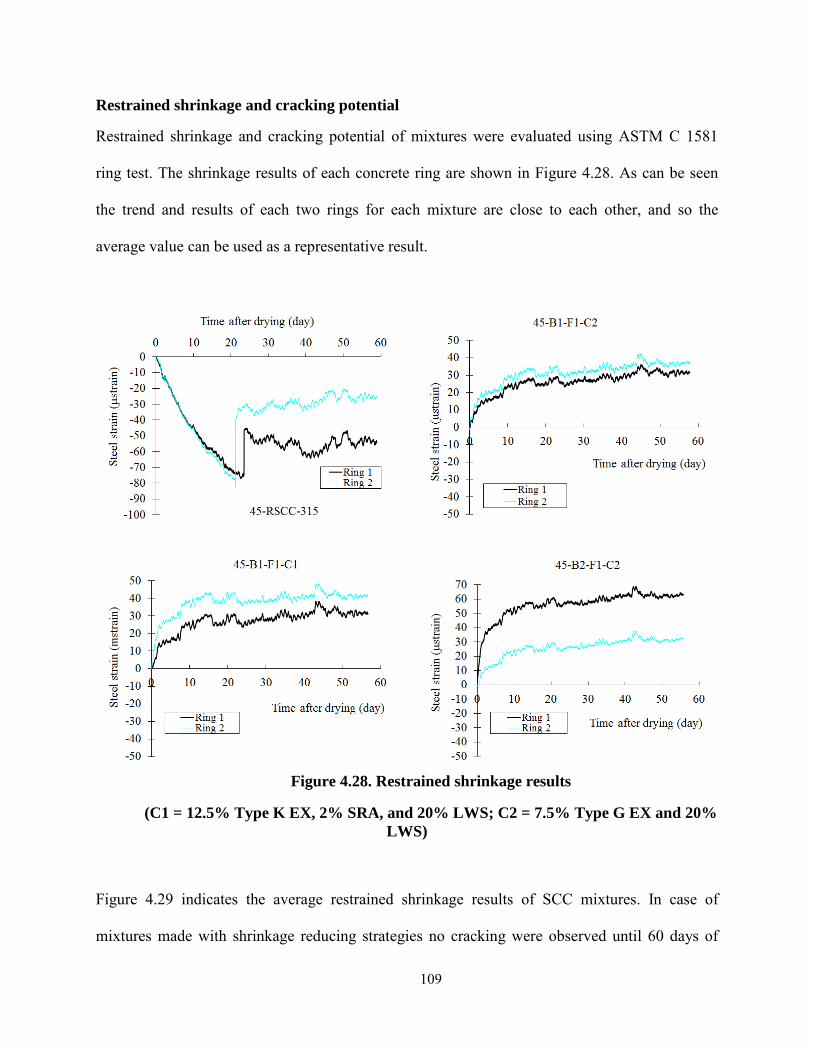
109
Restrained shrinkage and cracking potential
Restrained shrinkage and cracking potential of mixtures were evaluated using ASTM C 1581
ring test. The shrinkage results of each concrete ring are shown in Figure 4.28. As can be seen
the trend and results of each two rings for each mixture are close to each other, and so the
average value can be used as a representative result.
Figure 4.28. Restrained shrinkage results
(C1 = 12.5% Type K EX, 2% SRA, and 20% LWS; C2 = 7.5% Type G EX and 20% LWS)
Figure 4.29 indicates the average restrained shrinkage results of SCC mixtures. In case of
mixtures made with shrinkage reducing strategies no cracking were observed until 60 days of

110
testing. Regardless of the binder type, mixture made with shrinkage reducing material exhibited
expansion of 20 to 40 µstrain after 60 days of drying compared to the 60 µstrain of shrinkage for
the reference 45-RSCC-315 mixture. Therefore, tensile stress induced by restrained shrinkage
was overcome by induced expansion of such materials, thus indicating no cracking after 60 days.
In addition, mixtures containing shrinkage reducing materials had lower modulus of elasticity
ranged from 20.5 to 30.5 GPa (from 2.9 × 10⁶ to 4.4 × 10⁶ psi) compared to 36.2 GPa (5.2 × 10⁶
psi) for the 45-RSCC-315 reference mixture, thus resulting in a greater stress relaxation. The 45-
RSCC-315 reference mixture made with 100% cement exhibited elapsed time to cracking of 21
days, as shown in Figure 4.29.
Figure 4.29. Average restrained shrinkage of SCC mixtures
(C1 = 12.5% Type K EX, 2% SRA, and 20% LWS; C2 = 7.5% Type G EX and 20% LWS)

111
Average stress rate and cracking potential classification of investigated SCC mixtures are
summarized in Table 4.17. In accordance with ASTM C 1581, the stress rate development
induced by restrained shrinkage at the age of cracking can be calculated as follows:
2avg
r
Gq
t
α= ( 4-5)
where q is the stress rate in each test specimen, MPa/day (psi/day), G is a constant based on the
ring dimension 72.2 GPa (10.5 × 10⁶ psi), and tr is the elapsed time to cracking or elapsed time
when the test is terminated for each test specimen. |αavg| is the absolute value of the average
strain rate factor for each test specimen, (µstrain/day1/2) which is determined as a slope of fitted
line between steel strain and square root of elapsed time, as shown in Figure 4.30. Except for the
45-RSCC-315 reference SCC mixture, mixtures made with shrinkage reducing materials had
positive strain rate factor due to the expansion of such mixtures.
In accordance with ASTM C 1581, the 45-RSCC-315 reference mixture made with 315 kg/m3
(530 lb/yd3) cement is considered to exhibit moderate-low shrinkage cracking potential with
tensile stress rate of 0.155 MPa/day (22.5 psi/day). On the other hand, mixtures proportioned
with shrinkage reducing materials have low cracking potential with compressive stress rate from
0.040 to 0.053 MPa/day (5.8–7.7 psi/day).
Table 4.17. Cracking potential classification of SCC mixtures
Mixture Time to cracking
(day)
Average strain rate factor
(µstrain/day1/2)
Average stress rate (MPa/day)
Potential of cracking (ASTM C 1581)
45-RSCC-315 21 -19.7 0.155 (tension) Moderate-Low 45-B1-F1-C1 — 6.2 0.045 (compression) Low 45-B1-F1-C2 — 5.6 0.040 (compression) Low 45-B2-F1-C2 — 7.4 0.053 (compression) Low
Note: 1 MPa = 145.04 psi C1 = 12.5% Type K EX, 2% SRA, and 20% LWS; C2 = 7.5% Type G EX and 20% LWS

112
Figure 4.30. Average strain rate factor of SCC mixtures

113
5. CONCLUSIONS
The main objective of this research was to investigate the feasibility of producing crack-free and
Eco-Crete with different workability levels (Eco-SWC and Eco-SCC) for building and
transportation infrastructure applications. The target value for the binder content of Eco-Crete
mixtures was 315 kg/m3 (530 lb/yd3). A number of parameters affecting shrinkage and cracking
potential of concrete, including binder type and content, aggregate type, fiber type, and shrinkage
reducing materials were investigated. Based on the results from research presented in this
project, the following conclusions can be drawn:
5.1. Optimization of binder composition
• The packing characteristics of the combined cement and SCMs plays important factor to
reduce water demand, and thus leading to a decrease in cement content which is essential
in the design of Eco-Crete. Mixture containing 40% SL or 40% FA significantly exhibits
lower MWD to initiate flow compared to mixture prepared with 100% cement.
• Partial replacement of cement by FA, SL or SF significantly improves the packing
density of paste mixtures. The combined use of 10% SF with either 40% FA or 40% SL
exhibited the highest packing density of 0.66 compared to 0.52 for cement paste. Such
packing density value can significantly lead to a decrease in minimum water demand to
fill the voids between solid particles, thus leading to lower cement content.
• The effect of SF on packing density varies with the replacement rate of SF. For example,
for a given FA replacement of 40%, the increase in SF content from 5% to 10% resulted
114
in the increase in the packing density from 0.60 to 0.66, while the incorporation of 15%
SF decreased the packing density to 0.58.
• Optimum water demand needed to achieve a maximum packing density is less than
minimum water demand required to initiate flow. Maximum particle density can be
achieved in partially saturated mixtures containing a ternary system of solid, water and
air.
• The relationship between minimum water and optimum water demand can be used to
predict the packing density of binder only by determining the flow characteristics of
paste.
5.2. Optimization of aggregate characteristics
• The proportion of blended aggregate has substantial influence on the packing density of
concrete. Based on the obtained results, the packing density of various aggregate
proportions varied from 0.65 to 0.815 and 0.65 to 0.80 for rounded and crushed
aggregates, respectively. The difference between the packing density of poorly-graded
aggregate and well-graded aggregate is about 0.15 which significantly affects the
required paste volume to fill the voids between solid particles.
• The maximum packing density of rounded and crushed aggregates were 0.815 and 0.809,
respectively. Smooth and rounded aggregate had higher packing density compared to the
crushed aggregate.
• There exists an optimum S/A corresponding to the maximum achievable dry density
which is affected by the type and proportion of blended aggregate.

115
• A crushed aggregate requires higher fine content to achieve the maximum packing
density, which results in higher specific surface area to be coated with paste volume, thus
leading to a decrease in paste film thickness.
• The modified Andreasen packing model with q of about 0.29 fits reasonable well to
express the PSD of aggregate for SCC with low binder content.
5.3. Comparison of shrinkage reducing strategies
• The use of binary shrinkage reducing materials containing EX and SRA is quite effective
to design low shrinkage concrete.
• The incorporation of Type G EX led to a significant expansion against shrinkage; mixture
with 10% of Type G EX exhibited expansion of 1500 µstrain compared to 285 µstrain
autogenous shrinkage for control mortar made with 100% cement.
• The synergetic effect of the combination of Type G EX with LWS can lead to a
significant expansion for a long time, thus resulting in non-shrinkage concrete.
• The comparison between Type G and Type K EX indicate that the efficiency of the Type
K EX in shrinkage reduction is more dependent on the initial moist-curing period
compared to the Type G EX. This can be due to the higher water demand of Type K
expansive agent to produce ettringite crystals compared to the Type G material. For
example, mixture containing 15% Type K EX and moist-curing for 6 days exhibited
expansion of 430 µstrain compared to 650 µstrain drying shrinkage for the mixture
without any moist-curing.
• The internal curing provided by LWS can enhance the efficiency of the expansive agent,
especially for mixtures subjected to air drying without any initial moist-curing. For
example, mixture made with the combination of Type K EX and LWS exhibited lower

116
drying shrinkage of 600 µstrain after 75 days compared to the 710 µstrain for a similar
mixture made without any LWS.
• The derived statistical models for the Type K EX indicated that, this material is more
efficient in reducing autogenous shrinkage compared to the drying shrinkage.
5.4. Development of crack-free Eco-Crete
• Given higher packing density and lower water demand of SCMs, the Eco-Crete mixtures
prepared with binary and ternary of binders necessitate lower HRWRA demand to
achieve the required fluidity compared to the control mixture made with 100% cement.
• Eco-Crete mixtures made with SCMs can exhibit lower autogenous and drying shrinkage
compared to the reference mixture made with 100% cement. Mixture containing 50%
slag had autogenous and drying shrinkage values of 45 and 215 µstrain, respectively,
compared to 210 and 360 µstrain for similar mixture made without SCMs.
• Mixture proportioned with either Class F FA or SL replacement has higher electrical
resistivity compared to the control mixture made with 100% cement. Mixture containing
50% Class C FA developed similar electrical resistivity of 13 kΩ.cm to that of the control
mixture.
• Eco-Crete mixtures containing Type K EX exhibited 65% lower surface settlement and
10% lower bleeding compared to the mixture containing Type G expansive agent.
• Regardless of the binder type, Eco-Crete mixtures containing Type K EX developed 15%
to 20% higher mechanical properties compared to the mixture made with Type G EX.
• The combined use of synthetic fibers with either Type G or Type K EX resulted in 9% to
12% and 26% to 49% increase in flexural toughness, respectively, compared to the
mixture made with only synthetic fibers.

117
• The 45-RSCC-315 reference mixture made with 100% cement exhibited elapsed time to
cracking of 21 days. In case of mixtures made with shrinkage reducing materials no
cracking were observed until 60 days of testing. Regardless of binder type, mixture made
with shrinkage reducing materials exhibited expansion behavior of 20–40 µstrain
compared to the 60 µstrain of shrinkage for the reference mixture.
• Eco-Crete mixtures made with proper combination of shrinkage mitigation materials can
lead to a long term expansion, thus resulting in crack-free properties. Based on the
obtained results from this study, binary shrinkage reducing materials containing 7.5%
Type G EX and 20% LWS or ternary system including 12.5% Type K EX, 2% SRA, and
20% LWS can be quite effective for developing Eco-Crete mixtures with low risk of
cracking.
118
Future work
Test results presented and discussed in this investigation confirm the effectiveness of PSD of
SCMs and aggregate for developing Eco-Crete materials. Further research is still required to
study the theoretical packing models and determining the proper packing parameters for SCC
mixtures with low binder content to improve particle packing and reduce lubricant volume.
Binary, ternary, and quaternary combination of aggregate is recommended in the future work.
The use of recycled waste materials, including glass powder from recycled waste glass or rubber
particles recovered from scrap tires can be also evaluated to reduce environmental impact and
material cost.
Investigation of full-scale specimens, including slab and beam elements is recommended to
evaluate the shrinkage deformation, cracking resistance, and structural performance of Eco-
Crete. In addition, it is recommended to investigate the performance of such concretes made in
local concrete batching plants to confirm the ability of proposed concrete to apply in the field.
The field implementation and in-situ testing are also required to assess the performance of Eco-
Crete in construction of bridge elements, including decks or cast-in-place substructure elements.
Cracking of concrete bridge decks is a common problem which necessitates monitoring the
cracking resistance, mechanical properties, durability, and in-situ deformation to validate the
behavior of Eco-Crete compared to conventional reference concrete.

119
REFERENCES
AASHTO TP 95, Standard Method of Test for Surface Resistivity Indication of Concrete’s
Ability to Resist Chloride Ion Penetration, 2011.
ACI Committee 234, “234R-96: Guide for the Use of Silica Fume in Concrete,” Manual of
Concrete Practice, American Concrete Institute, Farmington Hills, MI, 1996.
Andreasen, A.H.M., Anderson, J., The Relation of Grading to Interstitial Voids in Loosely
Granular Products (With Some Experiments). Kolloid-Z., 49, 1929, 217-228.
ASTM C 109, Standard Test Method for Compressive Strength of Hydraulic Cement Mortars
(using 2-in. or [50-mm] Cube Specimens), 1999.
ASTM C 1581, Standard Test Method for Determining Age at Cracking and Induced Tensile
Stress Characteristics of Mortar and Concrete under Restrained Shrinkage, 2009.
ASTM C 1698, Standard Test Method for Autogenous Strain of Cement Paste and Mortar, 2010.
ASTM C 1760, Standard Test Method for Bulk Electrical Conductivity of Hardened Concrete,
2012.
ASTM C 232, Standard Test Methods for Bleeding of Concrete, 2012.
ASTM C 39, Standard Test Method for Compressive Strength of Cylindrical Concrete
Specimens, 2005.
ASTM C 403, Standard Test Method for Time of Setting of Concrete Mixtures by Penetration
Resistance, 2008.
ASTM C 496, Standard Test Method for Splitting Tensile Strength of Cylindrical Concrete
Specimens, 2011.
ASTM C 596, Standard Test Method for Drying Shrinkage of Mortar Containing Hydraulic
Cement, 2001.

120
ASTM C 642, Standard Test Method for Density, Absorption, and Voids in Hardened Concrete,
2006.
ASTM C 666/C666M, Standard Test Method for Resistance of Concrete to Rapid Freezing and
Thawing, 2008.
ASTM C 939, Standard Test Method for Flow of Grout for Preplaced-Aggregate Concrete
(Flow Cone Method).
ASTM C157/C157M, Standard Test Method for Length Change of Hardened Hydraulic-Cement
Mortar and Concrete, 2008.
ASTM C1609/C1609M, Standard Test Method for Flexural Performance of Fiber-Reinforced
Concrete (Using Beam With Third-Point Loading), 2012.
ASTM C1610/C1610M, Standard Test Method for Static Segregation of Self-Consolidating
Concrete Using Column Technique, 2010.
Bentz, D.P., Jensen, O., Mitigation Strategies for Autogenous Shrinkage Cracking. Cement and
Concrete Composites, 26(6), 2004, 677-685.
Bentz, D.P., Lura, P., Roberts, J.W., Mixture Proportioning for Internal Curing. Concrete
International, 27 (2), 2005, 35-40.
Bentz, D.P., Snyder, K.A., Protected Paste Volume in Concrete: Extension to Internal Curing
Using Saturated Lightweight Fine Aggregate. Cement and Concrete Research, 29(11), 1999,
1863-1867.
Beretka, J., Marroccoli, M., Sherman, N., Valenti, G.L., Influence of C4A3S Content and W/S
Ratio on the Performance of Calcium Sulfoaluminate-Based Cements." Cement and Concrete
Research 26 (11), 1996, 1673-1681.

121
Brooks, J.J., Megat Johari, M.A., Mazloom, M., Effect Of Admixtures on the Setting Times of
High-Strength Concrete. Cement and Concrete Composites, 22, 2000, 293-301.
Brouwers, H.J.H., Radix, H.J., Self Compacting Concrete: Theoretical and Experimental Study,
Cem. Concr. Res. 35, 2005, 2116–2136.
Brouwers, H.J.H., Particle-Size Distribution and Packing Fraction of Geometric Random
Packings. Phys. Rev. E 74, 2006.
Brown, M., Sellers, G., Folliard, K., Fowler, D., Restrained Shrinkage Cracking of Concrete
Bridge Decks: State-of-the-art Review. Texas Department of Transportation, 2001.
Chini, A.R., Muszynski, L.C., Hicks, J., Determination Of Acceptance Permeability
Characteristics For Performance-Related Specifications for Portland Cement Concrete, final
report submitted to Florida Department of Transportation, 2003, 116-118.
Chouicha, K., The Fractal Dimension and the Granular Range as Parameters of Identification of
Granular Mixes; Materials and Structures 39, 2006, 665-681.
Cortas, R., Rozière, E., Staquet, S., Hamami, A., Loukili, A., Delplancke-Ogletree, M.P., Effect
of the Water Saturation of Aggregates on the Shrinkage Induced Cracking Risk of Concrete at
Early Age. Cement and Concrete Composites, 50, 2014, 1-9.
Courard, L., Darimont, A., Schouterden, M., Ferauche, F., Willem, X., Degeimbre, R., Durability
of Mortars Modified with Metakaolin, CemConcr Res., 33, 2003.
De la Varga, I., Castro, J., Bentz, D., & Weiss, J., Application of Internal Curing for Mixtures
Containing High Volumes of Fly Ash. Cement and Concrete Composites, 34(9), 2012, 1001-
1008.
De Larrard, F., Buil, M., Particle Size and Compactness in Civil Engineering Materials;
Materials and Structures, 20, 1987, 117-126.
122
De Larrard, F., Structures Granulaires Et Formulation Des Bétons. 414, 1999.
El-Chabib, H., Syed, A., Properties of Self-Consolidating Concrete Made with High Volumes of
Supplementary Cementitious Materials. Journal of Materials in Civil Engineering, 25(11), 2012,
1579-1586.
Eren, O., Brooks, J.J., and Celik, T., Setting Times of Fly Ash and Slag-Cement Concretes as
Affected by Curing Temperature. Cement, Concrete, and Aggregates, 17(1), 1995, 11-17.
Folliard, K.J., Berke, N.S., Properties of High-Performance Concrete Containing Shrinkage-
Reducing Additives, Cement and Concrete Research, 24(3), 1997, 424–432.
Fuller, W.B., Thompson, S.E., The Laws of Proportioning Concrete, Trans. Am. Soc. Civ. Eng.
33, 1907, 222–298.
Fung, W.W.S., Kwan, A.K.H., Wong, H.H.C., Wet Packing of Crushed Rock Fine
Aggregate. Materials and structures, 42(5), 2009, 631-643.
Funk, J.E., Dinger, D.R., Predictive Process Control of Crowded Particulate Suspensions,
Applied to Ceramic Manufacturing, Kluwer Academic Publishers, Boston, the United States,
1994.
Germann Instruments Inc. ICAR Rheometer Manual. Evanston, Illinois, USA; 2007.
Golias, M., Castro, J., Weiss, J., The Influence of the Initial Moisture Content of Lightweight
Aggregate on Internal Curing. Construction and Building Materials, 35, 52-62, 2012.
Grzybowski, M., Shah, S.P., Shrinkage Cracking of Fiber Reinforced Concrete. ACI Materials
Journal, 87 (2), 1990, 138-148.
Habert, G., Roussel, N., Study of Two Concrete Mix-Design Strategies to Reach Carbon
Mitigation Objectives. CemConcr Compos, 31, 2009, 397–402.

123
Hammer, T.A., Bjontegaard, O., Sellevold, E.G., Internal Curing—Role of Absorbed Water in
Aggregates. High-Performance Structural Lightweight Concrete, SP-218, J. Ries and T. Holm,
eds., American Concrete Institute, Farmington Hills, MI, 2004, 131-142.
Henkensiefken, R., Bentz, D., Nantung, T., Weiss, J., Volume Change and Cracking in Internally
Cured Mixtures Made with Saturated Lightweight Aggregate under Sealed And Unsealed
Conditions. Cement and Concrete Composites, 31(7), 2009, 427-437.
Holland, J.A. Mixture Optimization. Concrete International, 12(10), 1990.
Yu, R., Spiesz, P., Brouwers, H.J.H., Mix Design and Properties Assessment of Ultra-High
Performance Fibre Reinforced Concrete (UHPFRC). Cement and Concrete Research, 56, 2014,
29-39.
Hooton, R.D., Canadian Use of Ground Granulated Blast-Furnace Slag as a Supplementary
Cementing Material for Enhanced Performance of Concrete. Canadian Journal of Civil
Engineering, 27(4), 2000, 754–760.
Hunger, M., An Integral Design Concept for Ecological Self-Compacting Concrete. PhD thesis
Eindhoven University of Technology, Eindhoven, the Netherlands, 2010.
Hunger, M., Brouwers, H.J.H., Development of Self-Compacting Eco-Concrete, in: H.B.
Fischer, F.A. Finger (Eds.), Proceedings 16th Ibausil, International Conference on Building
Materials (Internationale Baustofftagung),Weimar, F.A. Finger-Institut für Baustoffkunde,
Weimar, Germany, 2006, 2-0189–2-0198.
Hüsken, G., Amultifunctional design approach for sustainable concrete with application to
concrete mass products. PhD thesis Eindhoven University of Technology, Eindhoven, the
Netherlands, 2010.

124
Hüsken, G., Brouwers, H.J.H., A New Mix Design Concept For Earth-Moist Concrete: A
Theoretical And Experimental Study. Cement and Concrete Research, 38(10), 2008, 1246-1259.
Hwang, S.D., Khayat, K.H., Durability Characteristics of Self-Consolidating Concrete
Designated for Repair Applications. Materials and Structures, 42(1), 2009, 1-14.
Hwang, S.D., Khayat, K.H., Effect of Mix Design on Restrained Shrinkage of Self-Consolidating
Concrete. Materials and structures, 43(3), 2010, 367-380.
Hwang, S.D., Khayat, K.H., Effect of Mixture Composition on Restrained Shrinkage Cracking of
Self-Consolidating Concrete Used In Repair. ACI Materials journal, 105(5) 2008.
Hwang, S-D., Khayat, K.H., Effect of Various Admixture-Binder Combinations on Workability
of Ready-Mix Self-Consolidating Concrete. ACI Special Publication 233 2006.
Jaturapitakkul, C., Kiattikomol, K., Sata, V., Leekeeratikul, T., Use of Ground Fly Ash as a
Replacement of Condensed Silica Fume in Producing High-Strength Concrete. Concrete and
Cement Research, 2003, 549-555.
Kassimi, F., Khayat, K.H., Effect of Fiber and Admixture Types on Restrained Shrinkage
Cracking of Self Consolidating Concrete. Fifth North American Conference on the Design and
Use of Self-Consolidating Concrete, Chicago, Illinois, USA, 2013.
Khayat, K.H., Kassimi, F., Ghoddousi, P., Mixture Design and Testing of Fiber-Reinforced
Self-Consolidating Concrete. ACI Materials Journal,111(2), 2014.
Khayat, K.H., Mehdipour, I., Optimization of Binder Compositions to Design Ecological
Concrete; Wet Packing Density Approach. ECO-CRETE, International Symposium on
Sustainability, Icelend, 2014.

125
Khayat, K.H., Yahia, A., Sayed, M., Effect of Supplementary Cementitious Materials on
Rheological Properties, Bleeding, and Strength of Structural Grout. ACI Materials
Journal, 105(6) 2008.
Khayat. K.H., Hu, C., Laye, J.M., Influence of Aggregate Grain-Size Distribution on
Workability of Self-Consolidating Concrete. International Symposium on High Performance
Concrete 1, 2000, 641-658.
Koehler, E.P. Aggregates in Self-Consolidating Concrete. ProQuest, 2007.
Kosmatka, S.H., Panarese, W.C. Design and Control Of Concrete Mixtures. 2002.
Kwan, A.K.H., Chen, J.J., Adding Fly Ash Microsphere to Improve Packing Density,
Flowability and Strength of Cement Paste. Powder Technology, 234, 2013, 19-25.
Kwan, A.K.H., Fung, W.W.S., Packing Density Measurement and Modelling of Fine Aggregate
and Mortar. Cement and Concrete Composites, 31(6), 2009, 349-357.
Kwan, A.K.H., Li, L.G., Combined Effects of Water Film Thickness and Paste Film Thickness
on Rheology of Mortar. Mater. Struct., 45(9), 2012, 1359–74.
Kwan, A.K.H., Li, L.G., Fung, W.W.S., Wet Packing of Blended Fine and Coarse
Aggregate. Materials and structures, 45(6), 2012, 817-828.
Kwan, A.K.H., Mora, C.F., Effects of Various Shape Parameters on Packing of Aggregate
Particles. Magazine of Concrete Research, 53 (2), 2001, 91-100.
Kwan, A.K.H., Wong, H.H.C., Packing Density of Cementitious Materials: Part 2—Packing and
Flow Of OPC+ PFA+ CSF. Materials and structures, 41(4), 2008, 773-784.
Lange, F., Mo¨rtel, H., Rudert, V., Dense Packing of Cement Pastes and Resulting Consequences
on Mortar Properties. Cem.Concr Res., 27(10), 1997, 1481–1488.

126
Lawler, J.S., Connolly, J.D., Krauss, P.D., Tracy, S.L., Ankenman, B.E., Guidelines for Concrete
Mixtures Containing Supplementary Cementitious Materials to Enhance Durability of Bridge
Decks. Transportation Research Board, 566, 2007.
Lee, K.M., Lee, H.K., et al., Autogenous Shrinkage of Concrete Containing Granulated Blast-
Furnace Slag. Cement and Concrete Research, Vol.3, 2006, 1279-1285.
Li, J., Yao, Y., A Study on Creep and Drying Shrinkage of High Performance Concrete. Cement
and Concrete Research, 31(8), 2001, 1203-1206.
Li, Y., Bao, J., Guo, Y., The Relationship between Autogenous Shrinkage and Pore Structure of
Cement Paste with Mineral Admixtures. Construction and Building Materials, 24, 2010, 1855-
1860.
Li, Z., Qi, M., Li, Z., Ma, B., Crack Width of High-Performance Concrete Due to Restrained
Shrinkage. Journal of Materials in Civil Engineering, 11(3), 1999, 214–223.
Lura, P., Pease, B., Mazzotta, G., Rajabipour, F., Weiss, J., Influence of Shrinkage Reducing
Admixtures on the Development of Plastic Shrinkage Cracks. ACI Materials Journal. 104(2),
2007, 187-194.
Manai, K., Evaluation of the Effect of Chemical and Mineral Admixtures on the Workability,
Stability, and Performance of Self-Compacting Concrete. master’s thesis, Université de
Sherbrooke, Québec, Canada, 1995.
Meddah, M.S., Sato, R., Effect of Curing Methods on Autogenous Shrinkage and Self-Induced
Stress of High-Performance Concrete. ACI Materials Journal, 107(1), 2010.
Meddah, M.S., Suzuki, M., Sato, R., Influence of a Combination of Expansive and Shrinkage-
Reducing Admixture on Autogenous Deformation and Self-Stress of Silica Fume High-
Performance Concrete. Construction and Building Materials, 25(1), 2011, 239-250.

127
Mehta, P.K., Monteiro, P.J.M., Concrete: Microstructure, Properties, and Materials. 3rd Ed.
McGraw Hill, New York, 2006.
Mueller, F.V., Wallevik, O.H., Khayat, K.H., Linking Solid Particle Packing of Eco-SCC to
Material Performance. Cement and Concrete Composites, 2014.
Nanthagopalan, P., Santhanam, M., An Empirical Approach for the Optimisation Of Aggregate
Combinations for Self-Compacting Concrete. Mater. Struct., 45, 2012, 1167-1179.
Okamura H., Ouchi, M., Self-Compacting Concrete. J. Adv. Concr. Technol., 1(1), 2003 5–15.
Park, C.K., Noh, M.H., Park, T.H., Rheological Properties of Cementitious Materials Containing
Mineral Admixtures. Cem.Concr. Res., 35(5), 2005, 842–849.
Passuello, A., Moriconi, G., Shah, S.P., Cracking Behavior of Concrete with Shrinkage Reducing
Admixtures and PVA Fibers. Cement and Concrete Composites, 31(10), 2009, 699-704.
Pera, J., Boumaza, R., Ambroise, J., Development of Pozzolanic Pigment from Red Mud.
CemConcr Res., 27, 1997, 1513–22.
Quiroga, P.N., Fowler, D.W., The Effects of Aggregates Characteristics on The Performance of
Portland Cement Concrete (No. ICAR 104-1F,). International Center for Aggregates Research,
University of Texas at Austin, 2004.
Radlinska, A., Rajabipour, F., Bucher, B., Henkensiefken, R., Sant, G., Weiss, J., Shrinkage
Mitigation Stategies in Cementitious Systems: A Closer Look at Differences in Sealed and
Unsealed Behavior. Transportation Research Record. 2070. 2008, 59-67.
Rajabipour, F., Sant, G., Weiss, J., Interactions between Shrinkage Reducing Admixtures and
Cement Paste’s Pore Solution. Cement and Concrete Research, 38 (5), 2008, 606-615.

128
Ramseyer, C.C., Kiamanesh, R., Optimizing Concrete Mix Designs to Produce Cost Effective
Paving Mixes (No. FHWA-OK-08-11). Civil Engineering and Environmental Science,
University of Oklahoma, 2009.
Şahmaran, M., Lachemi, M., Hossain, K., Li, V.C., Internal Curing of Engineered Cementitious
Composites for Prevention of Early Age Autogenous Shrinkage Cracking. Cement and Concrete
Research, 39(10), 2009, 893-901.
Şahmaran, M., Yaman, İ. Ö., Tokyay, M., Transport and Mechanical Properties of Self
Consolidating Concrete with High Volume Fly Ash. Cement and concrete composites, 31(2),
2009, 99-106.
Sata, V., Jaturapitakkul, C., Kiattakomol, K., Influence of Pozzolan from Various Byproduct
Materials on Mechanical Properties of High-Strength Concrete. ConstrBuild Mater, 21,
2007,1589–98.
Shah, S.P.; Karaguler, M.E., Sarigaphuti, M., Effects of Shrinkage Reducing Admixtures on
Restrained Shrinkage Cracking of Concrete. ACI Materials Journal, 89(3), 1992, 291-295.
Shayan, A., Xu, A., Value-Added Utilisation of Waste Glass in Concrete. CemConcrRes., 34,
2004, 81–9.
Shilstone, J. M. Sr., Concrete Mixture Optimization, Concrete International: Design and
Construction. 12(6), 1990.
Soliman, A.M., Nehdi, M.L., Effects of Shrinkage Reducing Admixture and Wollastonite
Microfiber on Early-Age Behavior of Ultra-High Performance Concrete. Cement and Concrete
Composites, 46, 2014, 81-89.

129
Sounthararajan, V.M., Sivakumar, A., Drying Shrinkage Properties of Accelerated Fly Ash
Cement Concrete Reinforced with Hooked Steel Fiber. ARPN Journal of Engineering and
Applied Sciences, 8 (1), 2013.
Spiesz, P., Yu, Q.L., Brouwers, H.J.H., Development of Cement-Based Lightweight
Composites—Part 2: Durability Related Properties, Cem. Concr. Comput. 44, 2013, 30–40.
Tangtermsirikul, S., Class C Fly Ash as a Shrinkage Reducer for Cement Paste. ASTM Special
Publication, American Society for Testing and Materials, 153, 1995.
Tritsch, N., Darwin, D., Browning, J., Evaluating Shrinkage and Cracking Behavior of Concrete
Using Restrained Ring and Free Shrinkage Tests. The Transportation Pooled Fund Program
Project No. TPF-5(051), Structural Engineering and Engineering Materials SM Report No.77,
The University of Kansas Center for Research, Inc. at Kansas, 2005.
Uysal, M., Akyuncu, V., Durability Performance of Concrete Incorporating Class F and Class C
Fly Ashes. Construction and Building Materials, 34, 2012, 170-178.
Voigt, T., Bui, V.K., Shah, S.P., Drying Shrinkage of Concrete Reinforced with Fibers and
Welded-Wire Fabric. ACI Materials Journal, 101(3), 2004.
Vu, D.D., Stroeven, P., Bui, V.B., Strength and Durability Aspects of Calcinedkaolin Blended
Portland Cement Mortar and Concrete. CemConcr Compos, 23, 2001, 471–8.
Walker, W.J., Persistence of Granular Structure During Compaction Processes. KONA, 21,
2003,133-142.
Wallevik, O.H., Mueller, F.V., Hjartarson, B., and Kubens, S., The Green Alternative of Self-
Compacting Concrete, Eco-SCC, 35th conference on our world in concrete and structures,
Singapore, 2010.

130
Weiss, J., Yang, W., Shah, P., Shrinkage Cracking of Restrained Concrete Slabs. Journal of
Engineering Mechanics, 124(7), 1998, 765-774.
Weiss, W.J., Berke, N.S., Admixtures for Reduction of Shrinkage and cracking. Early Age
Cracking In Cementitious Systems, Chapter 7.5, RILEM Report 25, A. Bentur, ed., Bagneux,
France, 2003, 323-338.
Weiss, W.J., Shah, S.P., Restrained Shrinkage Cracking: The Role of Shrinkage Reducing
Admixtures and Specimen Geometry. Materials and Structures, 35(246) 2012, 85-91.
Wong, H.H.C., Kwan, A.K.H., Packing density of Cementitious Materials: Part 1– Measurement
Using a Wet Packing Method. Mater Struct., 41(4), 2008, 689–701.
Yu, Q.L., Spiesz, P., Brouwers, H.J.H., Development of Cement-Based Lightweight
Composites—Part 1: Mix Design Methodology and Hardened Properties. Cem. Concr. Comput.
44, 2013, 17–29.
Yurdakul, E., Taylor, P. C., Ceylan, H., Bektas, F., Effect of Water-to-Binder Ratio, Air Content,
and Type of Cementitious Materials on Fresh and Hardened Properties of Binary and Ternary
Blended Concrete. Journal of Materials in Civil Engineering, 2013.
Zheng, J., Johnson, P.F. Reed, J.S., Improved Equation of the Continuous Particle Size
Distribution for Dense Packing. Journal of the American Ceramic Society, 73 (5), 1990, 1392-
1398.