
Design and Optimization of Medium Frequency, Medium ... · PDF fileDesign and Optimization of...
11
Design and Optimization of Medium Frequency, Medium Voltage Transformers Peng Shuai, Jürgen Biela Laboratory for High Power Electronic Systems, ETH Z¨urich Email: [email protected] URL: http://www.hpe.ee.ethz.ch „This material is posted here with permission of the IEEE. Such permission of the IEEE does not in any way imply IEEE endorsement of any of ETH Zürich’s products or services. Internal or personal use of this material is permitted. However, permission to reprint/republish this material for advertising or promo- tional purposes or for creating new collective works for resale or redistribution must be obtained from the IEEE by writing to [email protected]. By choosing to view this document you agree to all provisions of the copyright laws protecting it.”
Transcript of Design and Optimization of Medium Frequency, Medium ... · PDF fileDesign and Optimization of...

Design and Optimization of Medium Frequency, Medium Voltage Transformers
Peng Shuai, Jürgen Biela Laboratory for High Power Electronic Systems, ETH Z¨urich
Email: [email protected] URL: http://www.hpe.ee.ethz.ch
„This material is posted here with permission of the IEEE. Such permission of the IEEE does not in any way imply IEEE endorsement of any of ETH Zürich’s products or services. Internal or personal use of this material is permitted. However, permission to reprint/republish this material for advertising or promo-tional purposes or for creating new collective works for resale or redistribution must be obtained from the IEEE by writing to [email protected]. By choosing to view this document you agree to all provisions of the copyright laws protecting it.”

Design and Optimization of Medium Frequency, MediumVoltage Transformers
Peng Shuai, Jurgen BielaLaboratory for High Power Electronic Systems, ETH Zurich
Email: [email protected]: http://www.hpe.ee.ethz.ch
Keywords<<Transformer>>, <<Optimisation>>, <<Thermal design>>, <<Insulation>>
AbstractMedium voltage, medium frequency transformers (MFTs) are much smaller in size and weight comparedto conventional low frequency transformers. The MFTs are very attractive for applications where fullcontrol of the power flow and high power density are required, such as power electronic interface insmart grids and traction converter system. With reduced size, the optimal design of MFTs becomesmore challenging due to the high isolation requirement and thermal stress. This paper presents a designand optimization methodology for MFTs with emphasis on thermal and insulation design. The improvedthermal model for multi-layer windings consisting of litz-wire and the analytical calculation of maximumelectric field in core window area are included in the optimization process. By using the methodology,the optimal designs of a 25 kW/4 kHz MFT with two commonly used core materials are compared. Thepossibility of volume reduction by increasing the operating frequency is also investigated.
IntroductionNowadays, renewable energy sources are increasingly integrated into the electric power system. Asinterface between the inherently fluctuating power sources and the grid, the power conversion systemsbased on medium frequency DC-DC converter (isolated with MFTs) shown in Fig. 1 are becomingmore and more important. Compared with conventional line frequency transformers, medium frequencypower conversion systems operating at the kilo-hertz range feature significant reduction of weight andsize, dynamic control of power flow and power quality improvement. Such a compact system is alsoattractive for railway applications where space is limited.For high power applications, the DC-DC converters are usually cascaded and connected to mediumvoltage (MV) grid. The design challenges are mainly high efficiency requirement, thermal management
Figure 1: Medium frequency power conversion system.
and high voltage insulation due to reduced size and higher frequency. Previous research focusing onMFT design has been introduced in [1] [2] [3] for traction applications and in [4] [5] for renewableenergy and smart grid applications. Although transformer design and optimization is widely discussed innumerous publications, the detailed design and optimization procedure for MFT can be found only in afew recent publications. In [6], a design methodology for MFT based on amorphous alloy is proposed, asimplified thermal model is used and the heat dissipation capability is considered for optimization. In [7],different core materials are considered for design and temperature calculation is included in optimizationprocess. However, as simplified thermal models for windings are employed in these studies, the heattransfer between different layers of windings is not included and the electric field distribution which isessential for insulation design is also not included in the optimization procedure.Therefore, this paper presents an improved design and optimization methodology for MFT. The mainefforts are devoted to the improvement of thermal model for multi-layer windings and analytical calcu-lation of electric field distribution to determine the maximum electric field strength. In order to obtaina more accurate thermal and loss mode, the temperature dependence of coefficients are also consideredfor optimization, where iterations are required.Due to the low computation expenses, these models are able to be included in optimization processesand improve the accuracy of the results. The specifications of the Dual-Active-Bridge (DAB) converteras shown in Fig. 1 are given in Table I, which are used for optimal design of the MFT.
Table I: Specifications of DAB converter
Voltage at MV DC-link VMV 2400 VVoltage at LV DC-link VLV 400 V
Nominal power Pn 25 kWSwitching frequency fs 4 kHz
Leakage inductance of transformer Lσ 115 µHTurns ratio of transformer Nw 43:14
Isolation voltage level Viso 24 kVa
aConsidering 5 modules cascaded and connect to 6.6 kV AC grid on MV side. For safety reason,the isolation voltage is defined as two times of the MV DC-link voltage level.
Design and optimization procedureThe proposed design procedure for MFT is illustrated in Fig. 2 and explained in the following. In thepre-design phase of the MFT, the converter system specifications must be defined and the DAB converteroperation (modulation, etc.) is optimized for minimum semiconductor losses. The details of optimizationprocedure for DAB converter is out of the scope of this paper and therefore is not shown in Fig. 2. Withthe optimal design of the converter, the basic parameters (Lσ,Nw, fs) for MFT and the current waveformsat nominal power are given. In addition, the materials for magnetic core, conductor and insulation aswell as the structure of the transformer (U-core, winding arrangement, etc.) are selected during the pre-design. Since the total losses of the transformer continuously decrease with the increasing volume, thetotal volume Voltot must be limited in the loss minimization. (Here Voltot is defined as the boxed volumeof the transformer).In the optimization phase, the goal is to find a solution that satisfies all constraints at minimum totallosses. The Pareto front of efficiency and power density for a given set of materials and structure can befound by optimization with different values of Voltot . If cost should also be included in optimization, thecost factors can be added in the pre-design phase.For MFT operated in a few kilo-Hertz range, amorphous or nanocrystalline alloy are chosen as core ma-terial due to their high saturation flux density and relative low loss density [6]. In this paper, amorphousalloy 2605SA1 [8] and nanocrystalline alloy VITROPERM500F [9] are considered and the winding isassumed to consist of round litz-wire. To achieve high power density and the required isolation voltagelevel, epoxy resin casting for the winding and heat sinks with forced air-cooling for the transformer areused. The leakage inductance value of the MFT is an important parameter for the performance of DABconverters. Therefore, the shell-type structure with concentric winding as shown in Fig. 3 is selected forthe design to limit the leakage flux. The LV winding is located inside of MV winding since this giveslower length for the LV winding which carries higher current.There are in total 9 free parameters to be optimized for the MFT design. N1 and NL1 are the turns numberand number of turns per layer for MV winding. Others are geometry parameters as defined Fig. 3. Theisolation distance d f between LV winding and core is defined as 1 mm (thickness of isolation foil).Some parameters are integers and in order to reduce the number of possible parameter combinations, allthe parameters to be optimized are set and scaled to integers as explained in the following. For example,

Figure 2: Flow chart for MFT design and optimization procedure.
for the geometry parameter A ranges of 1 mm to 50 mm with a resolution of 0.1 mm, a factor 10 is appliedand A is scaled as integer from 10 to 500 with totally 491 possible values. At the end of the optimization,A is divided by 10 to obtain the actual value.In the first step, the genetic algorithm (GA) optimizer assigns a population containing a number ofindividuals within defined range of parameters, where an individual means a complete set of the 9 freeparameters introduced above.The optimization phase consists of 6 steps. The order of computation tasks are arranged according totheir computational efforts as indicated on the right side of Fig. 2. If the constraints is not satisfied at onestep, the calculation restarts immediately with new population. This prevents executing the high effortcalculations later and thus saves calculation time. The calculation steps are briefly described below:Step 1: Winding and core dimensions. The conductor outer diameters da1,da2 are calculated basedon Ns1,ds1 and Ns2,ds2. The turns number of LV winding is determined by N2 = N1/Nw. The height ofMV winding is calculated as HwMV = NL1 · da1. The number of turns per layer for LV winding can bedetermined as the integer part of HwMV/da2, then the complete winding geometry is defined. The corewindow size B,C are determined by winding width and height together with the isolation distances d f ,

Figure 3: Structure and geometry parameters of MFT.
diso, and dleak shown in Fig. 3. The total volume of the transformer is defined as Voltot =Wtot ·Htot ·Dtotand the thickness of the core D can be calculated with known A,B,C and winding dimensions. The heatsinks are placed on the limbs and yokes around the winding as illustrated in Fig. 3. Finally, the totalvolume of the heat sinks is calculated as Voltot = 4 ·A ·B · (2B+C) and can be used further to derive thethermal resistance of the heat sink.Step 2: Maximum flux density. The effective core cross-section is calculated by Ac= 2 ·A ·D ·KL, whereKL is the core lamination factor. Then the maximum flux density Bmax can be evaluated and comparedwith the saturation flux density Bsat with a safety margin of 20%.Step 3: Leakage inductance. In this step, the leakage inductance is calculated by analytical equationswith the well known 1D approximation method [6]. To achieve higher accuracy, the porosity factor istaken into account. Furthermore, the circular length of each winding layer and gap between layers arecalculated separately instead of using a common mean length. As the resolution of the parameter dleak isset to be 0.1 mm, there might be no solution if the calculated leakage inductance is set to be exactly thedesired value. Therefore, the constraints is set as |Lσ−Lσ,target |/Lσ,target < 1%. This 1% deviation is sosmall that the influence on the electrical model of the converter can be neglected.Step 4: Maximum electric field strength. This step is to check if the maximum electric field strengthEmax exceeds the maximum allowable value. The electric field distribution is calculated by charge simu-lation method and the details are discussed later.Step 5: Losses & step 6: Temperatures. These two steps include iterative calculations of temperatureand have the highest computational effort. Before the iteration, all thermal resistances are calculated withknown geometry parameters and defined material properties. Then the starting values of temperaturesare given for each unknown temperature node of the thermal model. The core loss, the temperaturedependent winding loss and thermal resistances are calculated under these temperatures. The losses arethen applied as the thermal sources together with all thermal resistance values to the thermal model tosolve the node temperatures. The calculated temperatures are then compared with the assumed valuesand step 5 and 6 will be repeated iteratively until the temperatures converge. At last, the converged valuesof temperature are compared with the limits.If all the constraints described above are fulfilled, the calculated losses are compared with the best valueso far and the better solution is saved.
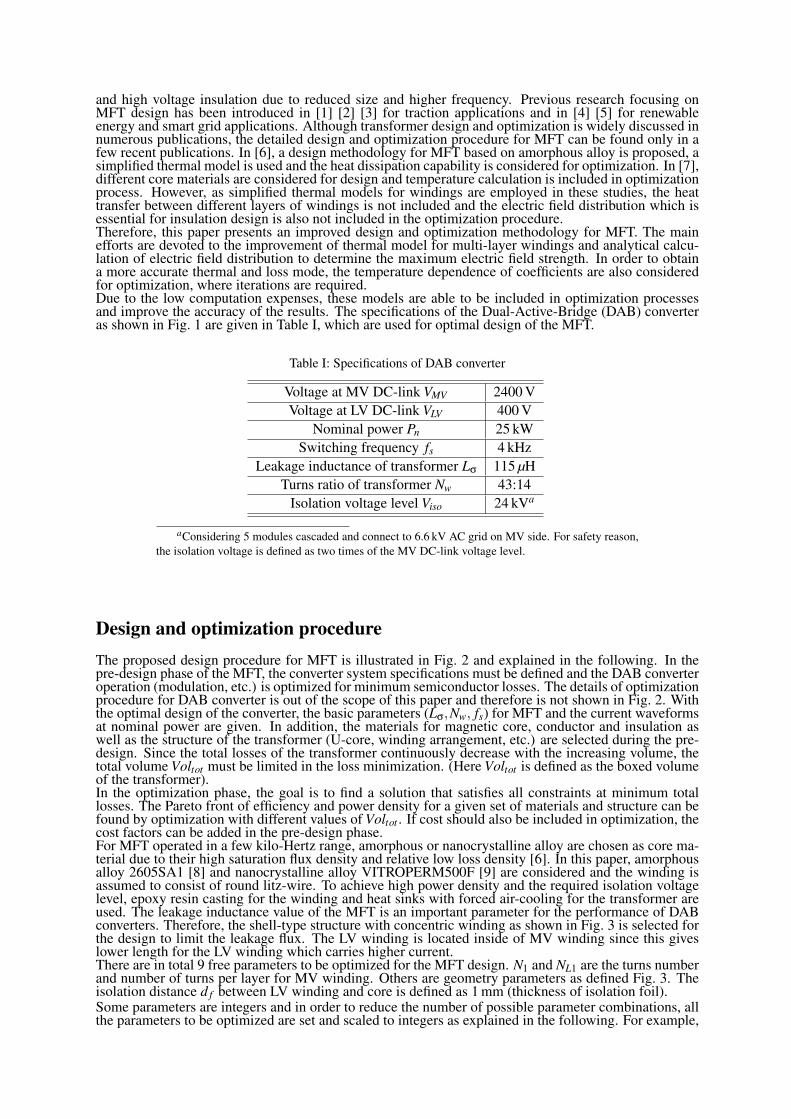
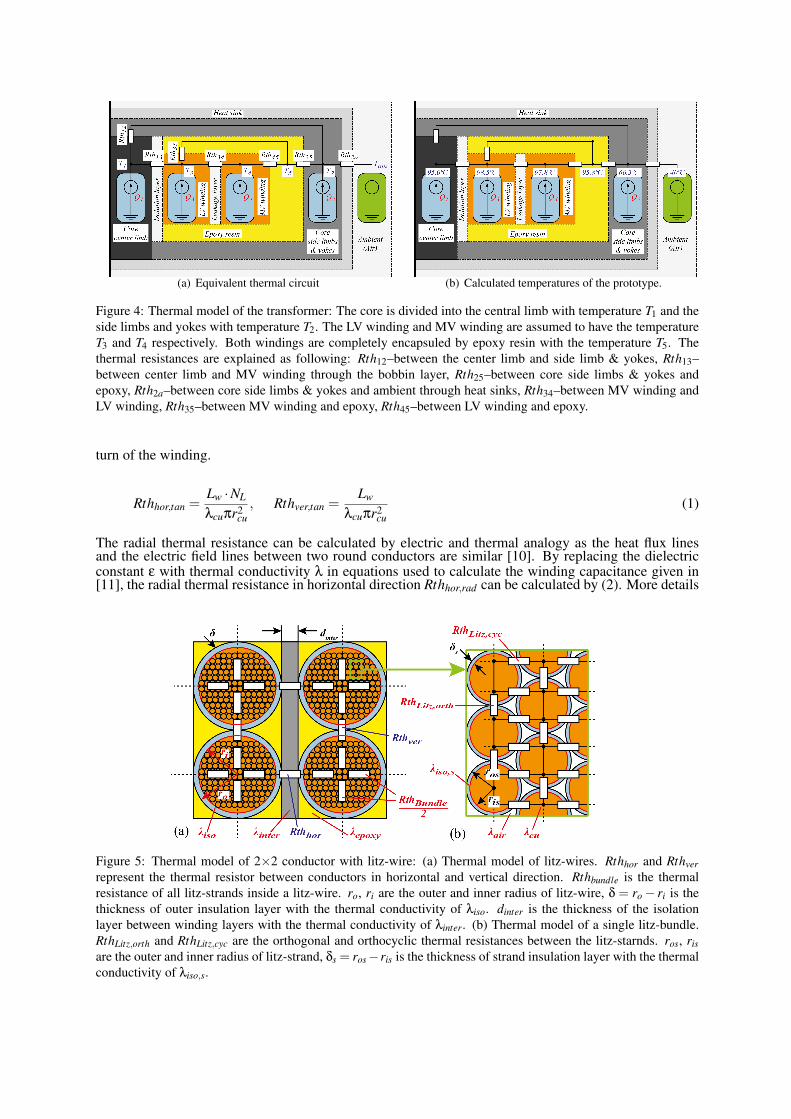
Thermal modeling and temperature calculationThe thermal model used in this paper is illustrated in Fig. 4(a). The core losses are assumed to be equallydistributed in the core. As the calculation of thermal resistance has already been presented in manypublications, e.g. [6], only the determination of winding thermal resistances is discussed here.As an example, the cross section of 2×2 conductor composed of litz-wire is shown in Fig. 5. For awinding with m layers and each layer consists of NL turns, there are m×NL thermal resistors in total.The heat transfer from a turn to its adjacent turn is simultaneously via two ways: in the tangentialdirection through the conductor and in the radial direction through the isolation layer. The tangentialthermal resistance for horizontal and vertical direction is given by (1), where Lw is the mean length per
(a) Equivalent thermal circuit (b) Calculated temperatures of the prototype.
Figure 4: Thermal model of the transformer: The core is divided into the central limb with temperature T1 and theside limbs and yokes with temperature T2. The LV winding and MV winding are assumed to have the temperatureT3 and T4 respectively. Both windings are completely encapsuled by epoxy resin with the temperature T5. Thethermal resistances are explained as following: Rth12–between the center limb and side limb & yokes, Rth13–between center limb and MV winding through the bobbin layer, Rth25–between core side limbs & yokes andepoxy, Rth2a–between core side limbs & yokes and ambient through heat sinks, Rth34–between MV winding andLV winding, Rth35–between MV winding and epoxy, Rth45–between LV winding and epoxy.
turn of the winding.
Rthhor,tan =Lw ·NL
λcuπr2cu, Rthver,tan =
Lw
λcuπr2cu
(1)
The radial thermal resistance can be calculated by electric and thermal analogy as the heat flux linesand the electric field lines between two round conductors are similar [10]. By replacing the dielectricconstant ε with thermal conductivity λ in equations used to calculate the winding capacitance given in[11], the radial thermal resistance in horizontal direction Rthhor,rad can be calculated by (2). More details
Figure 5: Thermal model of 2×2 conductor with litz-wire: (a) Thermal model of litz-wires. Rthhor and Rthverrepresent the thermal resistor between conductors in horizontal and vertical direction. Rthbundle is the thermalresistance of all litz-strands inside a litz-wire. ro, ri are the outer and inner radius of litz-wire, δ = ro− ri is thethickness of outer insulation layer with the thermal conductivity of λiso. dinter is the thickness of the isolationlayer between winding layers with the thermal conductivity of λinter. (b) Thermal model of a single litz-bundle.RthLitz,orth and RthLitz,cyc are the orthogonal and orthocyclic thermal resistances between the litz-starnds. ros, risare the outer and inner radius of litz-strand, δs = ros−ris is the thickness of strand insulation layer with the thermalconductivity of λiso,s.

of the calculations can be found in [12].
Rthhor,rad =
[2λairLw
α
(V +
18λiso/λair
(2δ
ra
)2 Zα
)]−1
(2)
where
V = arctan
(√β+1β−1
)β√
β2−1− π
4, Z =
β(β2−2)(β2−1)3/2 arctan
(√β+1β−1
)− β
2(β2−1)− π
4(3)
α = 1− δ
raλiso/λair, β =
1α
(1+
dinter
2raλinter/λair
)(4)
The total thermal resistance between two conductors in horizontal direction is then given as
Rthhor = Rthhor,tan ‖ Rthhor,rad (5)
Finally, the total thermal resistance of the winding in horizontal direction is determined by total resistanceof NL×m resistors as
Rthhor,tot =mNL
Rthhor (6)
Similarly, the total thermal resistance in vertical direction can be calculated with dinter = 0 as there existsno additional isolation layer. For the thermal model, it is assumed that the heat transfer in horizontal andvertical directions in the winding are independent. Furthermore, to simplify the analysis, the incompletelast layer is assumed to be a full layer. Since the thermal conductivity of a conductor is much higher thanthat of the isolation material, the thermal resistance of the conductor in radial direction can be neglected.The thermal resistance of the litz-bundle RthBundle consists of the orthogonal part RthLitz,orth and theorthocyclic part RthLitz,cyc as shown in Fig. 5. The calculation of RthLitz,orth and RthLitz,cyc is introducedin [12] and will not be discussed here. The related thermal conductivities of materials for winding thermalmodel utilized in this paper are given in Table II.
Table II: Thermal conductivities related to the thermal model of multi-layer windings consisting of litz-wires
Element MaterialThermal conductivity
W/(m·K)Medium inside litz-wire Air 0.0272 (@40 ◦C)[13]
Medium between winding layersEpoxy resin
(Araldite CY221 & Aradur HY2966)0.15 [14]
Bobbin, leakage layerisolation layer between windings
Star-Therm W (PA66) 10 [15]
Additional isolation layer of litz-wire Polyester foil (Mylar) 0.155 [16]Isolation layer of litz-strand Modified Polyurethane(PU) 0.245 [17]
Conductor Copper 401[13]
Insulation designFor insulation design, it is important to determine the electric field distribution in the core window area.For litz-wires, there exists air between the litz-strands. To obtain a homogeneous electric filed distribu-tion inside the litz-wire, the litz-bundle can be coated with electrical semi-conductive materials beforewrapped by outer insulation layer. In this way, the litz-wire can be considered as round conductor forelectric field calculation. Since the electrical conductivity of the semi-conductive layer is relative low,the influence on the magnetic field distribution and the loss behaviour due to skin and proximity effectscan be neglected. According to the data from litz-wire manufacturer [18], the outer insulation layer ismade of 2 polyester band with total thickness of 46 µm.The calculation of the electric field strength in this paper is based on a 2D model under following as-sumptions: the core is connected to the negative DC-link terminal of LV side converter, the winding
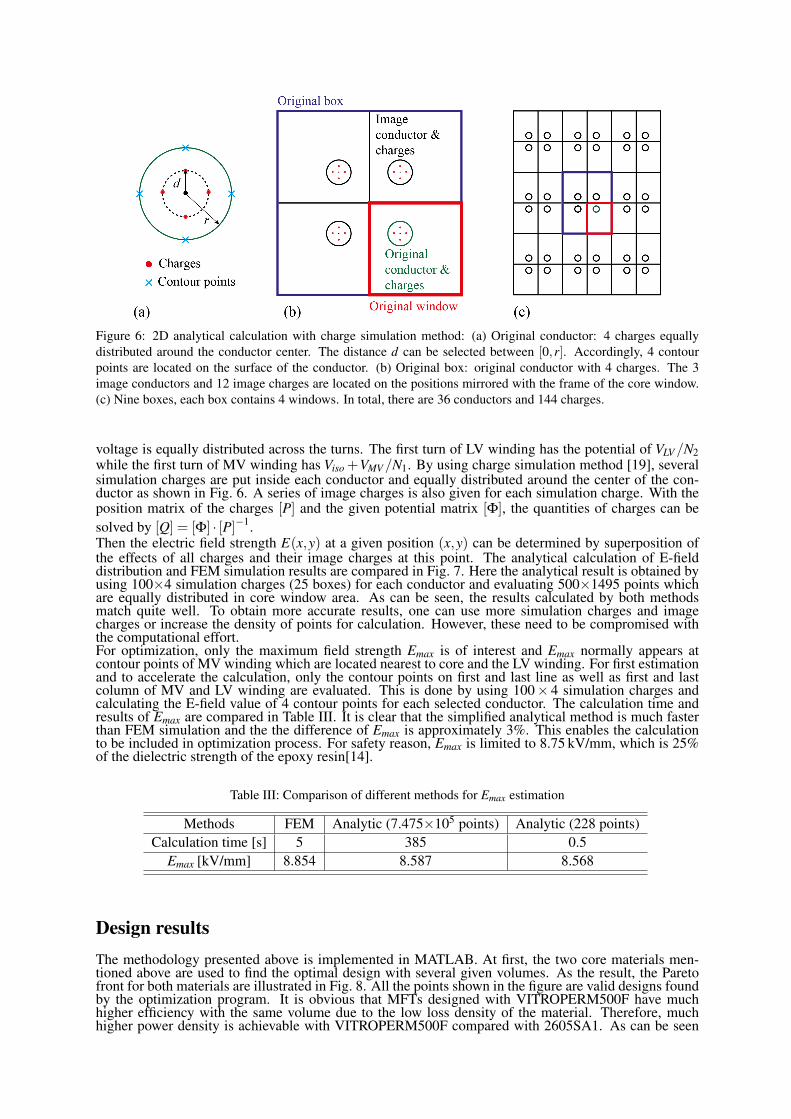
Figure 6: 2D analytical calculation with charge simulation method: (a) Original conductor: 4 charges equallydistributed around the conductor center. The distance d can be selected between [0,r]. Accordingly, 4 contourpoints are located on the surface of the conductor. (b) Original box: original conductor with 4 charges. The 3image conductors and 12 image charges are located on the positions mirrored with the frame of the core window.(c) Nine boxes, each box contains 4 windows. In total, there are 36 conductors and 144 charges.
voltage is equally distributed across the turns. The first turn of LV winding has the potential of VLV/N2while the first turn of MV winding has Viso +VMV/N1. By using charge simulation method [19], severalsimulation charges are put inside each conductor and equally distributed around the center of the con-ductor as shown in Fig. 6. A series of image charges is also given for each simulation charge. With theposition matrix of the charges [P] and the given potential matrix [Φ], the quantities of charges can besolved by [Q] = [Φ] · [P]−1.Then the electric field strength E(x,y) at a given position (x,y) can be determined by superposition ofthe effects of all charges and their image charges at this point. The analytical calculation of E-fielddistribution and FEM simulation results are compared in Fig. 7. Here the analytical result is obtained byusing 100×4 simulation charges (25 boxes) for each conductor and evaluating 500×1495 points whichare equally distributed in core window area. As can be seen, the results calculated by both methodsmatch quite well. To obtain more accurate results, one can use more simulation charges and imagecharges or increase the density of points for calculation. However, these need to be compromised withthe computational effort.For optimization, only the maximum field strength Emax is of interest and Emax normally appears atcontour points of MV winding which are located nearest to core and the LV winding. For first estimationand to accelerate the calculation, only the contour points on first and last line as well as first and lastcolumn of MV and LV winding are evaluated. This is done by using 100× 4 simulation charges andcalculating the E-field value of 4 contour points for each selected conductor. The calculation time andresults of Emax are compared in Table III. It is clear that the simplified analytical method is much fasterthan FEM simulation and the the difference of Emax is approximately 3%. This enables the calculationto be included in optimization process. For safety reason, Emax is limited to 8.75 kV/mm, which is 25%of the dielectric strength of the epoxy resin[14].
Table III: Comparison of different methods for Emax estimation
Methods FEM Analytic (7.475×10⁵ points) Analytic (228 points)Calculation time [s] 5 385 0.5
Emax [kV/mm] 8.854 8.587 8.568
Design resultsThe methodology presented above is implemented in MATLAB. At first, the two core materials men-tioned above are used to find the optimal design with several given volumes. As the result, the Paretofront for both materials are illustrated in Fig. 8. All the points shown in the figure are valid designs foundby the optimization program. It is obvious that MFTs designed with VITROPERM500F have muchhigher efficiency with the same volume due to the low loss density of the material. Therefore, muchhigher power density is achievable with VITROPERM500F compared with 2605SA1. As can be seen
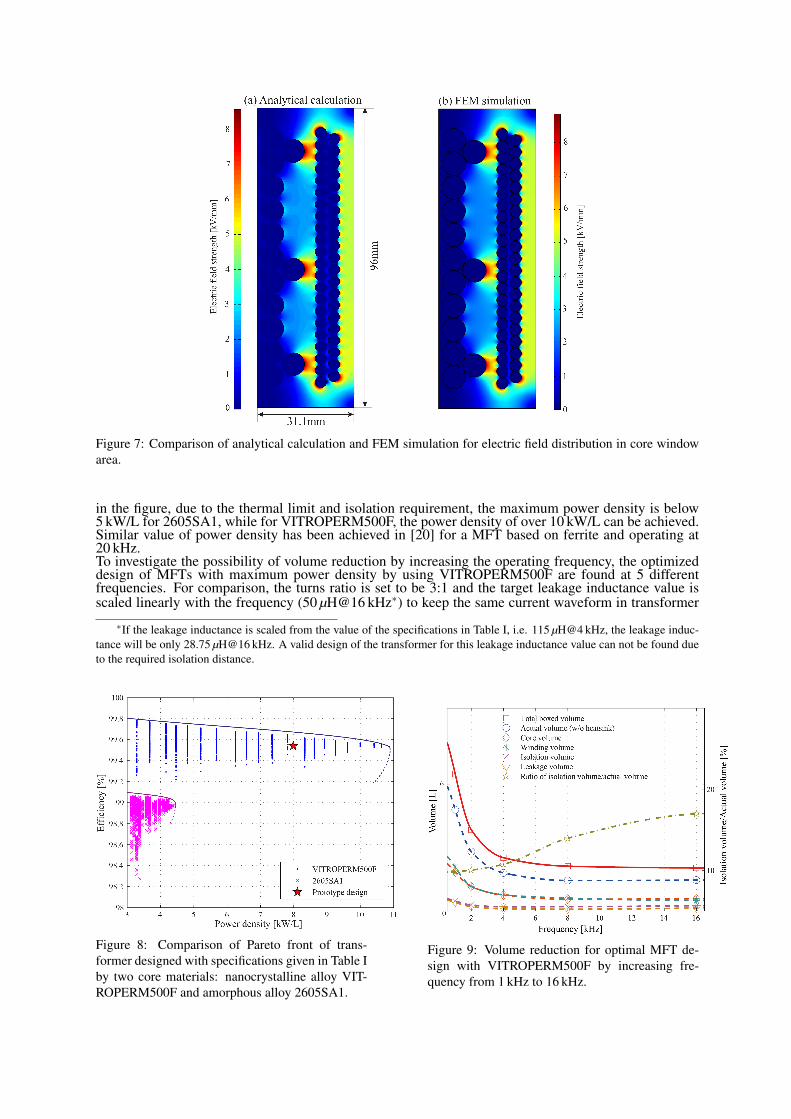
Figure 7: Comparison of analytical calculation and FEM simulation for electric field distribution in core windowarea.
in the figure, due to the thermal limit and isolation requirement, the maximum power density is below5 kW/L for 2605SA1, while for VITROPERM500F, the power density of over 10 kW/L can be achieved.Similar value of power density has been achieved in [20] for a MFT based on ferrite and operating at20 kHz.To investigate the possibility of volume reduction by increasing the operating frequency, the optimizeddesign of MFTs with maximum power density by using VITROPERM500F are found at 5 differentfrequencies. For comparison, the turns ratio is set to be 3:1 and the target leakage inductance value isscaled linearly with the frequency (50 µH@16 kHz∗) to keep the same current waveform in transformer
∗If the leakage inductance is scaled from the value of the specifications in Table I, i.e. 115 µH@4 kHz, the leakage induc-tance will be only 28.75 µH@16 kHz. A valid design of the transformer for this leakage inductance value can not be found dueto the required isolation distance.
Figure 8: Comparison of Pareto front of trans-former designed with specifications given in Table Iby two core materials: nanocrystalline alloy VIT-ROPERM500F and amorphous alloy 2605SA1.
Figure 9: Volume reduction for optimal MFT de-sign with VITROPERM500F by increasing fre-quency from 1 kHz to 16 kHz.
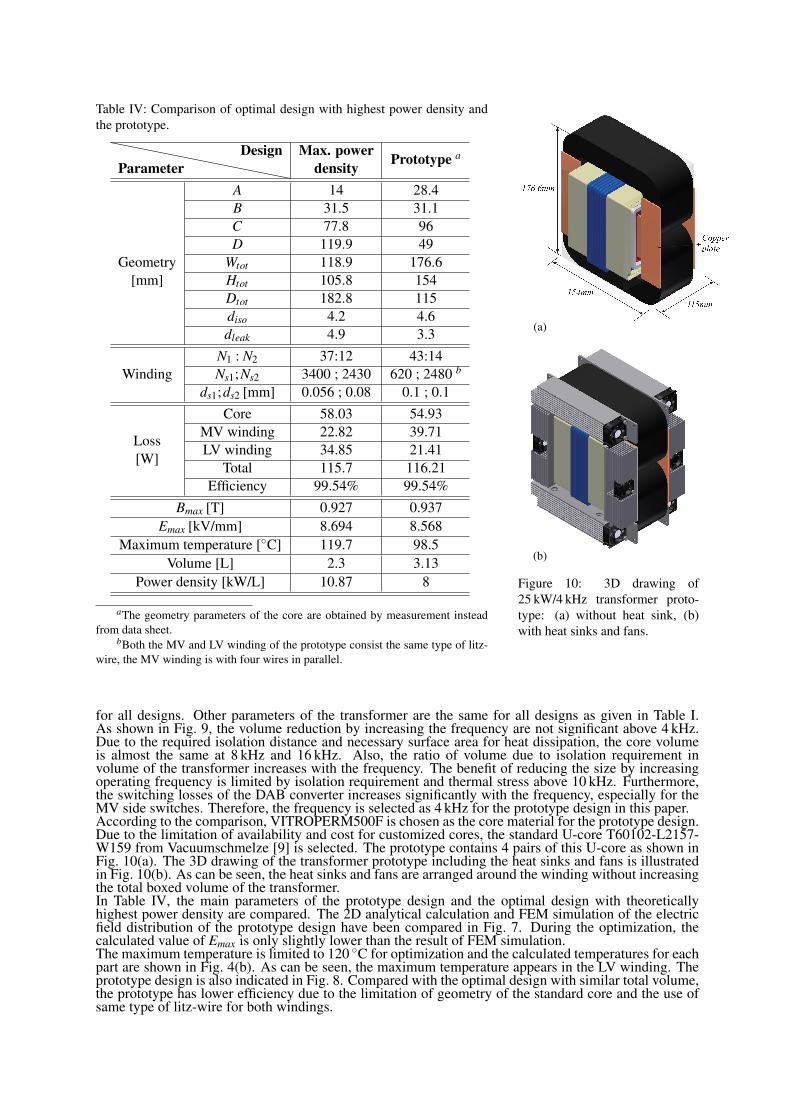
Table IV: Comparison of optimal design with highest power density andthe prototype.
ParameterDesign Max. power
density Prototype a
Geometry[mm]
A 14 28.4B 31.5 31.1C 77.8 96D 119.9 49
Wtot 118.9 176.6Htot 105.8 154Dtot 182.8 115diso 4.2 4.6dleak 4.9 3.3
WindingN1 : N2 37:12 43:14Ns1;Ns2 3400 ; 2430 620 ; 2480 b
ds1;ds2 [mm] 0.056 ; 0.08 0.1 ; 0.1
Loss[W]
Core 58.03 54.93MV winding 22.82 39.71LV winding 34.85 21.41
Total 115.7 116.21Efficiency 99.54% 99.54%
Bmax [T] 0.927 0.937Emax [kV/mm] 8.694 8.568
Maximum temperature [◦C] 119.7 98.5Volume [L] 2.3 3.13
Power density [kW/L] 10.87 8
aThe geometry parameters of the core are obtained by measurement insteadfrom data sheet.
bBoth the MV and LV winding of the prototype consist the same type of litz-wire, the MV winding is with four wires in parallel.
(a)
(b)
Figure 10: 3D drawing of25 kW/4 kHz transformer proto-type: (a) without heat sink, (b)with heat sinks and fans.
for all designs. Other parameters of the transformer are the same for all designs as given in Table I.As shown in Fig. 9, the volume reduction by increasing the frequency are not significant above 4 kHz.Due to the required isolation distance and necessary surface area for heat dissipation, the core volumeis almost the same at 8 kHz and 16 kHz. Also, the ratio of volume due to isolation requirement involume of the transformer increases with the frequency. The benefit of reducing the size by increasingoperating frequency is limited by isolation requirement and thermal stress above 10 kHz. Furthermore,the switching losses of the DAB converter increases significantly with the frequency, especially for theMV side switches. Therefore, the frequency is selected as 4 kHz for the prototype design in this paper.According to the comparison, VITROPERM500F is chosen as the core material for the prototype design.Due to the limitation of availability and cost for customized cores, the standard U-core T60102-L2157-W159 from Vacuumschmelze [9] is selected. The prototype contains 4 pairs of this U-core as shown inFig. 10(a). The 3D drawing of the transformer prototype including the heat sinks and fans is illustratedin Fig. 10(b). As can be seen, the heat sinks and fans are arranged around the winding without increasingthe total boxed volume of the transformer.In Table IV, the main parameters of the prototype design and the optimal design with theoreticallyhighest power density are compared. The 2D analytical calculation and FEM simulation of the electricfield distribution of the prototype design have been compared in Fig. 7. During the optimization, thecalculated value of Emax is only slightly lower than the result of FEM simulation.The maximum temperature is limited to 120 ◦C for optimization and the calculated temperatures for eachpart are shown in Fig. 4(b). As can be seen, the maximum temperature appears in the LV winding. Theprototype design is also indicated in Fig. 8. Compared with the optimal design with similar total volume,the prototype has lower efficiency due to the limitation of geometry of the standard core and the use ofsame type of litz-wire for both windings.

ConclusionIn this paper, a design and optimization methodology is proposed for MFT with emphasis on thermaland insulation design. The main contribution of this methodology is to include the thermal model of thelitz-wire and analytical calculation of maximum electric field strength during the optimization processof the transformer. The methodology is implemented in MATLAB and the design results with two dif-ferent core materials by using this methodology are compared. It is verified that the thermal model withtemperature iteration and maximum electric field calculation can be included in the optimization processwith acceptable calculation time. The investigation on the possibility of size reduction by increasingthe operating frequency of the transformer designed with the nanocrystalline alloy VITROPERM500Fshows that at higher frequency range, the volume of the transformer is limited by the isolation require-ment and thermal stress. Finally, a design for a 25 kW/4 kHz transformer using standard nanocrystallinecore is presented.In future, the dependency of size and frequency for the MFTs design can be further investigated forother core materials, e.g. amorphous alloy and ferrite. The optimal operating frequency range for MFTsconsidering the power density and the efficiency can be found for different materials.
References[1] L. Heinemann, “An actively cooled high power, high frequency transformer with high insulation capability,”
in 17th Annual IEEE Applied Power Electronics Conference and Exposition (APEC), vol. 1, March 10-142002, pp. 352–357 vol.1.
[2] T. Kjellqvist, S. Norrga, and S. Ostlund, “Design considerations for a medium frequency transformer in aline side power conversion system,” in IEEE 35th Annual Power Electronics Specialists Conference (PESC),vol. 1, June 20-25 2004, pp. 704–710.
[3] M. Steiner and H. Reinold, “Medium frequency topology in railway applications,” in Proc. European Conf.Power Electronics and Applications, 2007, pp. 1–10.
[4] S. Meier, T. Kjellqvist, S. Norrga, and H.-P. Nee, “Design considerations for medium-frequency power trans-formers in offshore wind farms,” in 13th European Conference on Power Electronics and Applications (EPE),Sept. 8-10 2009, pp. 1–12.
[5] Y. Du, S. Baek, S. Bhattacharya, and A. Huang, “High-voltage high-frequency transformer design for a 7.2kVto 120V/240V 20kVA solid state transformer,” in 36th Annual Conference on IEEE Industrial ElectronicsSociety (IECON), Nov. 7-10 2010, pp. 493–498.
[6] I. Villar, “Multiphysical characterization of medium-frequency power electronic transformers,” Ph.D. disser-tation, EPFL, Switzerland, 2010.
[7] G. Ortiz, J. Biela, and J. Kolar, “Optimized design of medium frequency transformers with high isolationrequirements,” in 36th Annual Conference on IEEE Industrial Electronics Society (IECON), Nov. 7-10 2010,pp. 631–638.
[8] [Online]. Available: http://www.metglas.com/[9] [Online]. Available: http://www.vacuumschmelze.de/
[10] P. Wallmeier, “Automatisierte Optimierung von induktiven Bauelementen fr Stromrichteranwendungen,”Ph.D. dissertation, Universitat Paderborn, 2001.
[11] J. Koch, “Berechnung der Kapazitat von Spulen, insbesondere in Schalenkernen,” Valvo Berichte, vol. XIV,no. 3, pp. 99–119, 1968.
[12] M. Jaritz and J. Biela, “Analytical model for the thermal resistance of windings consisting of solid or litzwire,” in EPE 2013, Lille, France, Sep. 3–5 2013.
[13] VDI-Warmeatlas. Heidelberg, Berlin: Springer-Verlag, 2006.[14] [Online]. Available: http://www.huntsman.com/[15] [Online]. Available: www.epicpolymers.de/[16] [Online]. Available: http://www2.dupont.com/[17] [Online]. Available: http://www.kern-gmbh.de/[18] [Online]. Available: http://www.vonroll.ch/[19] H. Singer, H. Steinbigler, and P. Weiss, “A charge simulation method for the calculation of high voltage
fields,” IEEE Transactions on Power Apparatus and Systems, vol. PAS-93, no. 5, pp. 1660–1668, sept. 1974.[20] G. Ortiz, M. Leibl, J. Kolar, and O. Apeldoorn, “Medium frequency transformers for solid-state-transformer
applications design and experimental verification,” in IEEE 10th International Conference on Power Elec-tronics and Drive Systems (PEDS), Kitakyushu, Japan, April. 22-25 2013, pp. 1285–1290.