DESIGN AND OPTIMIZATION OF A FSAE VEHICLE of Record Initials: DCP Project Number:...
87
Advisor of Record Initials: DCP Project Number: MQP-DCPFSAE-E12-D13 DESIGN AND OPTIMIZATION OF A FSAE VEHICLE A Major Qualifying Project Report: Submitted to the Faculty of WORCESTER POLYTECHNIC INSTITUTE In partial fulfillment of the requirements for the Degree of Bachelor of Science By: _____________________________ _______________________________ David Alspaugh. [email protected] Alessandro Aquadro. [email protected] _____________________________ _____________________________ Dylan Barnhill. [email protected] Nicholas Beasley. [email protected] _____________________________ _____________________________ Andrew Bennett. [email protected] John Francis. [email protected] Date: April 23, 2013 Approved by: _______________________________ Professor David C. Planchard
Transcript of DESIGN AND OPTIMIZATION OF A FSAE VEHICLE of Record Initials: DCP Project Number:...
Advisor of Record Initials: DCP
Project Number: MQP-DCPFSAE-E12-D13
DESIGN AND OPTIMIZATION OF A FSAE VEHICLE
A Major Qualifying Project Report:
Submitted to the Faculty of
WORCESTER POLYTECHNIC INSTITUTE
In partial fulfillment of the requirements for the
Degree of Bachelor of Science
By:
_____________________________ _______________________________
David Alspaugh. [email protected] Alessandro Aquadro. [email protected]
_____________________________ _____________________________
Dylan Barnhill. [email protected] Nicholas Beasley. [email protected]
_____________________________ _____________________________
Andrew Bennett. [email protected] John Francis. [email protected]
Date: April 23, 2013
Approved by:
_______________________________
Professor David C. Planchard

2
Abstract This Major Qualifying Project (MQP) designed and manufactured a vehicle for the Formula SAE
Michigan collegiate competition. The Formula SAE (FSAE) competition is an annual collegiate
design series that challenges teams all over the world to conceive, design, fabricate and develop
formula style vehicles, which are validated through competition. The team built upon a vehicle
intended for the 2012 FSAE collegiate competition. Through baseline testing and component
evaluations, systems of the car were identified as areas that reduced performance and prohibited
predictable vehicle dynamics. These systems were the car’s rear suspension, component
packaging/ergonomics, continuously variable transmission (CVT), air intake, and exhaust. By
reducing vehicle weight in numerous areas and through modifying components and sub-systems,
the team was able to design and construct a more intuitively controlled vehicle. As a result, the
vehicle’s performance in static and dynamic competition events was improved while reducing
cost. An innovative approach was achieved utilizing an exoskeleton wrap for the vehicle body.
All components and sub-systems were designed and validated using computer-aided modeling
and simulation techniques.

3
Table of Contents
Abstract ................................................................................................................................................... 2
List of Figures ......................................................................................................................................... 6
List of Tables .......................................................................................................................................... 9
List of Equations ................................................................................................................................... 10
Summary of Formula SAE Competition ................................................................................................ 11
Analysis of 2012 Vehicle ....................................................................................................................... 11
Baseline Testing and Evaluation ........................................................................................................ 11
Testing Procedure Defined by Formula SAE .................................................................................. 12
Actual Testing Procedure ............................................................................................................... 14
Modifications of Baseline Vehicle ................................................................................................. 15
Results ........................................................................................................................................... 17
Conclusion .................................................................................................................................... 18
Goals and Objectives ............................................................................................................................. 19
Intake and Throttle Body ....................................................................................................................... 21
Introduction ....................................................................................................................................... 21
Previous Designs ............................................................................................................................... 21
Intake ............................................................................................................................................ 21
Throttle Body ................................................................................................................................ 23
Research & Design ............................................................................................................................ 24
Throttle Body ................................................................................................................................ 24
Intake ............................................................................................................................................ 24
Manufacturing ................................................................................................................................... 26
Throttle Body ................................................................................................................................ 26
Restrictor & Intake ........................................................................................................................ 27
Conclusion ........................................................................................................................................ 28
Exhaust System ..................................................................................................................................... 29
Previous Exhaust Design ................................................................................................................... 29
Exhaust Research .............................................................................................................................. 30
Exhaust Primary Research ............................................................................................................. 30
Calculations ................................................................................................................................... 30

4
Muffler Preliminary Research ........................................................................................................ 32
Exhaust System Design ..................................................................................................................... 32
Primary Exhaust Design Specifications .......................................................................................... 32
Primary Exhaust Design................................................................................................................. 33
Muffler Design Specifications ........................................................................................................ 34
Muffler Design .............................................................................................................................. 34
Exhaust System Fabrication ............................................................................................................... 36
Primary Exhaust Fabrication .......................................................................................................... 36
Muffler Fabrication ........................................................................................................................ 36
Exhaust System Conclusion ............................................................................................................... 37
Engine Position ..................................................................................................................................... 38
Previous Design................................................................................................................................. 38
Design of Engine Mounts .................................................................................................................. 39
Fabrication of Engine Mounts ............................................................................................................ 46
Engine Mount Conclusions ................................................................................................................ 47
Rear Suspension .................................................................................................................................... 47
2012 Vehicle’s Suspension Characteristics ........................................................................................ 47
Suspension Design Goals ................................................................................................................... 48
Investigating Solid-Axle Rear Suspension Solutions .......................................................................... 48
Investigating Independent Rear Suspension Solutions ........................................................................ 52
Semi-trailing Arm .......................................................................................................................... 53
Unequal Length Control Arm (Double A-Arm) .............................................................................. 56
Design Selection ............................................................................................................................ 58
Shock Actuation ................................................................................................................................ 59
Spring Medium .................................................................................................................................. 62
Manufacturing ................................................................................................................................... 63
Conclusions ....................................................................................................................................... 63
Intuitive Vehicle Operation ............................................................................................................ 63
Serviceability ................................................................................................................................. 64
Minimize Overall Weight .............................................................................................................. 64
Adjustability .................................................................................................................................. 64
Implications ................................................................................................................................... 65
5
Packaging and Ergonomics .................................................................................................................... 66
Pedal Plate ......................................................................................................................................... 66
CAD Model ....................................................................................................................................... 67
Engine CAD ...................................................................................................................................... 68
Body Design ...................................................................................................................................... 68
Fuel, Oil, and Coolant Tanks ............................................................................................................. 70
Seat ................................................................................................................................................... 74
Sway Bar ........................................................................................................................................... 76
Conclusions ........................................................................................................................................... 79
Intake, Exhaust, & Engine Position .................................................................................................... 79
Rear Suspension ................................................................................................................................ 79
Packaging and Ergonomics ................................................................................................................ 80
Continuously Variable Transmission ................................................................................................. 80
References............................................................................................................................................. 81
Appendix A: Baseline Testing ............................................................................................................... 82
Appendix B: Intake Calculations ........................................................................................................... 85
.............................................................................................................................................................. 85
6
List of Figures Figure 1: FSAE Skid-Pad Layout (2013 Formula SAE Rules) ................................................................ 13
Figure 2: Actual Endurance Track Layout .............................................................................................. 15
Figure 3: DashDAQ XL’s Data Display ................................................................................................. 16
Figure 4: Physical Mounting of DashDAQ XL ...................................................................................... 17
Figure 5 - 2012 FSAE Intake & Throttle Body ....................................................................................... 22
Figure 6 - 2009/2011 Throttle Body ....................................................................................................... 23
Figure 7 - 2013 Throttle Body and Restrictor ......................................................................................... 27
Figure 8 - Completed 2013 Intake .......................................................................................................... 28
Figure 9: Primary Exhausts on the 2012 FSAE Car ................................................................................ 29
Figure 10: Final Exhaust Header Design ................................................................................................ 33
Figure 11: Final Exhaust Headers .......................................................................................................... 34
Figure 12: Final Muffler Design ............................................................................................................ 35
Figure 13: Muffler Entrance and Exit Faceplates.................................................................................... 36
Figure 14: 2012 Engine Mounts ............................................................................................................. 38
Figure 15: Right Engine Mount ............................................................................................................. 40
Figure 16: Left Engine Mount................................................................................................................ 40
Figure 17: Engine Mount Setup ............................................................................................................. 41
Figure 18: 2013 Jackshaft ...................................................................................................................... 41
Figure 19: Stress under Lateral Load ..................................................................................................... 42
Figure 20: Deflection under Lateral Load .............................................................................................. 43
Figure 21: Stress und Acceleration Load ................................................................................................ 43
Figure 22: Maximum Deflection under Acceleration Load ..................................................................... 44
Figure 23: Stress under Downward Load ............................................................................................... 44
Figure 24: Deflection under Downward Load ........................................................................................ 45

7
Figure 25: Max Stress under Torque Load ............................................................................................. 45
Figure 26: Displacement under Torque Load ......................................................................................... 46
Figure 27: Water Jetted Engine Mount Components .............................................................................. 46
Figure 28: Semi-Trailing Arm Mounting Points (Material Between Points for Visual Purposes Only) .... 55
Figure 29: Determining Semi-Trailing Arm Instant Center Location ...................................................... 55
Figure 30: Length of Control Arms ........................................................................................................ 56
Figure 31: Camber Gain Under Bump and Droop .................................................................................. 57
Figure 32: Location of Instant Center and Roll Center ........................................................................... 57
Figure 33: Final Rear Suspension Geometry .......................................................................................... 58
Figure 34: Pushrod Actuated Shocks Mounted Within Rear Sub-Frame ................................................. 59
Figure 35: Rocker Shape - (Left to Right) Pushrod Mount, Pivot, Shock Mount ..................................... 60
Figure 36: Motion Ratio Over Wheel Travel – Progressive & Approximately Linear ............................. 61
Figure 37: 2012 Pedal Plate FEA Deflections ........................................................................................ 66
Figure 38: 2013 Pedal Plate FEA Deflections ........................................................................................ 67
Figure 39: 2012 Full CAD Assembly ..................................................................................................... 67
Figure 40: 2012 Engine Figure 41: 2013 Engine............................................................................... 68
Figure 42: 2012 Vehicle Fuel Tank Shape ............................................................................................. 70
Figure 43: Final Fuel Tank Design Sectioned to show baffling and clearance ......................................... 71
Figure 44: Fuel, Oil, and Coolant tank assembly .................................................................................... 72
Figure 45: View of tank assembly showing mounting rails & clips ......................................................... 73
Figure 46: Tank assembly mounted to chassis members ......................................................................... 73
Figure 47: Percy positioning in 2012 seat............................................................................................... 74
Figure 48: Percy in 2012 Seat ................................................................................................................ 75
Figure 49: Percy in New Seat with Tanks Assembly. ............................................................................. 75
Figure 50 Initial Sketch for Sway Bar Positioning With Front Suspension.............................................. 76
Figure 51 Sway Bar Shape and End Hookup Design .............................................................................. 77

8
Figure 52 1.0" Sway Bar Displacement Analysis ................................................................................... 78
Figure 53 0.75" Sway Bar Displacement Analysis ................................................................................. 78
Figure 54 0.50" Sway Bar Displacement Analysis ................................................................................. 78

9
List of Tables Table 1: 2012 Intake Calculations .......................................................................................................... 22
Table 2: Calculated Intake Runner Lengths ............................................................................................ 26
Table 3: FEA Test Data ......................................................................................................................... 39
Table 4: Estimated Solid-Axle Suspension Weights ............................................................................... 50
Table 5: Ranking of Solid-Axle Suspensions ......................................................................................... 51
Table 6: Endurance Baseline Testing Results ......................................................................................... 83
Table 7: Acceleration Baseline Testing Results ...................................................................................... 83
Table 8: Skid-Pad Baseline Testing Results ........................................................................................... 84

10
List of Equations Equation 1 ............................................................................................................................................. 25
Equation 2 ............................................................................................................................................. 25
Equation 3 ............................................................................................................................................. 26
Equation 4 ............................................................................................................................................. 31
Equation 5 ............................................................................................................................................. 31
Equation 6 ............................................................................................................................................. 53
Equation 7 ............................................................................................................................................. 53
Equation 8 ............................................................................................................................................. 54
Equation 9 ............................................................................................................................................. 59
Equation 10 ........................................................................................................................................... 62
Equation 11 ........................................................................................................................................... 62
Equation 12 ........................................................................................................................................... 62
Equation 13 ........................................................................................................................................... 62
Equation 14 ........................................................................................................................................... 62
Equation 15 ........................................................................................................................................... 62

11
Summary of Formula SAE Competition The Formula SAE (FSAE) competition is an annual collegiate design series that challenges
teams to conceive, design, fabricate, develop and compete with formula style vehicles. FSAE
teams are to assume that they work for a design firm that is designing, fabricating, testing and
demonstrating a prototype vehicle for the nonprofessional, weekend, competition market.
Competition rules state that the primary challenge to the design team is to develop a prototype
car that best meets the FSAE vehicle design goals and which can be profitably marketed.
To this end, the vehicle should have very high performance in terms of acceleration, braking and
handling and be sufficiently durable to successfully complete all static and dynamic competition
events. In evaluating vehicle designs FSAE judges also consider other design factors including:
aesthetics, cost, ergonomics, maintainability, manufacturability, and reliability.
Analysis of 2012 Vehicle Worcester Polytechnic Institute (WPI) last entered the Formula SAE Michigan competition with
a car that was designed and built between 2009 and 2011. This car was powered by a Yamaha
Phazer snowmobile engine and its continuously variable transmission (CVT). This car also
utilized a swing axle rear suspension and lacked a rear differential. During the 2011 Formula
SAE Michigan competition judges praised the car’s design for its relatively low weight and
mechanical simplicity. However, the judges also criticized the rear suspension and drivetrain’s
handling characteristics.
In 2012 a new Formula SAE vehicle was created by a WPI team using the existing engine, CVT,
rear suspension, and drivetrain from the 2009-2011 car. The design philosophy of low weight
and mechanical simplicity was carried into the design of the 2012 car; however it was
significantly different than its predecessor. Notable changes were made to numerous components
including the chassis, front suspension, intake, and exhaust. The 2012 FSAE team intended to
compete with this car in the 2012 Formula SAE Michigan event but an engine failure during
vehicle testing prevented this. As a result, the 2012 chassis is eligible for competing in the 2013
Formula SAE Michigan event. Subsequently, the purpose of this project was to optimize the
2012 vehicle using the existing chassis and engine.
Baseline Testing and Evaluation
The 2013 FSAE MQP team performed baseline testing and evaluation of the 2012 vehicle to
identify its driving characteristics and to measure the performance of its various components.
This information was used in conjunction with past input from FSAE competition judges to

12
identify areas of the 2012 vehicle that would benefit from a redesign. The purpose of our project
was to improve the 2012 FSAE vehicle for use in the Formula SAE Michigan competition. As
such, our testing and evaluation procedure was structured to reflect the dynamic events of this
competition.
Testing Procedure Defined by Formula SAE
Formula SAE organizes the dynamic portion of the Michigan competition into separate tests for
acceleration, autocross, skid-pad, and endurance.
Acceleration
Formula SAE regulations describe the acceleration test as an evaluation of the car’s acceleration
in a straight line on flat pavement. According to the 2013 competition rules, the acceleration
course length will be 75.00m (82.00yd) from starting line to finish line. The course will be at
least 4.90m (16ft) wide as measured between the inner edges of the bases of the course edge
cones. The 2013 rules also state that cones are placed along the course edges at intervals of about
5 paces (approximately 20.00ft). The time it takes the vehicle to travel from the starting line to
the finish line is recorded and a two second penalty is given for disturbed cones.
Autocross
Formula SAE defines the autocross event as an evaluation of the car's maneuverability and
handling characteristics on a tight course without the hindrance of competing cars. The autocross
course combines the performance features of acceleration, braking, and cornering into one event.
The time it takes the vehicle, at rest, to travel from the starting line to the finish line is recorded.
A two second penalty is added for each disturbed cone. The course layout is governed with the
following definitions of track features:
Straights: No longer than 60.00m (200.00ft) with hairpins at both ends (or) no longer than 45.00m
(150.00ft) with wide turns on the ends.
Constant Turns: 23.00m (75.00ft) to 45.00m (148.00ft) diameter.
Hairpin Turns: Minimum of 9.00m (29.50ft) outside diameter (of the turn).
Slaloms: Cones in a straight line with 7.62m (25.00ft) to 12.19m (40.00ft) spacing.
Miscellaneous: Chicanes, multiple turns, decreasing radius turns, etc. The minimum track width
will be 3.50m (11.50ft).
Endurance
The endurance event is designed to evaluate the overall performance of the car and to test the
car’s durability and reliability. The event measures how long it takes the vehicle to complete a

13
pre-determined number of laps on an endurance course. The course layout is governed with the
following definitions of track features:
Straights: No longer than 77.00m (252.60ft) with hairpins at both ends (or) no longer than 61.00m
(200.10ft) with wide turns on the ends.
Constant Turns: 30.00m (98.40ft) to 54.00m (177.20ft) diameter.
Hairpin Turns: Minimum of 9.00m (29.50ft) outside diameter (of the turn).
Slaloms: Cones in a straight line with 9.00m (29.50ft) to 15.00m (49.20ft) spacing
Miscellaneous: Chicanes, multiple turns, decreasing radius turns, etc. The standard minimum
track width is 4.50m (14.76ft).
Skid-Pad
Formula SAE defines the skid-pad event as an evaluation of the car’s cornering ability on a flat
surface while making a constant-radius turn. In this event two drivers each perform two laps of
the entire figure eight back to back. The time it takes the vehicle to travel each left and right turn
of the skid-pad track is recorded. Each cone disturbed during the event results in a 0.25 second
penalty. The skid-pad course consists of two pairs of concentric circles in a figure eight pattern.
The centers of these circles will be 18.25m (59.88ft) apart. The inner circles will be 15.25m
(50.03ft) in diameter, and the outer circles will be 21.25m (69.72ft) in diameter. The driving path
will be the 3.00m (9.84ft) path between the inner and outer circles. The cars will enter and exit
through gates on a 3.00m wide path that is tangential to the circles where they meet. The line
between the centers of the circles defines the start/stop line. A lap is defined as traveling around
one of the circles from the start/stop line and returning to the start/stop line. This course is
marked with sixteen cones around the inside of each inner circle thirteen cones positioned around
the outside of each outer circle. This layout can be seen in Figure 1 below.
Figure 1: FSAE Skid-Pad Layout (2013 Formula SAE Rules)

14
Actual Testing Procedure
Worcester Regional Airport hosted the dynamic baseline testing for the 2013 MQP team. The
space provided for the testing was approximately 90.00yd by 30.00yd of paved asphalt. The area
was relatively flat and elevation change did not significantly affect course layout or data
collection. However, the size of this space restricted our ability to perform dynamic events as
outlined in the Formula SAE rules. The adjustments made to each dynamic test are discussed
below.
Acceleration
Formula SAE regulations specify an 82.00yd long acceleration course. However, due to the size
of our testing facilities we reduced the length of the course by 7.00yd to allow for braking. This
resulted in an acceleration course which was 75.00yd long, 91.5% the length specified by
Formula SAE rules. Using a stopwatch, the time it took the vehicle to travel this 75.00yd course
from a standing start was recorded. The number of runs recorded was restricted by the limited
testing time.
Autocross and Endurance
The size of our testing facilities restricted the ability to construct a full-size endurance course.
The course layout meets the specifications defined by Formula SAE and stated in the sections
above. However, endurance course layouts at Formula SAE Michigan competitions are generally
longer overall, contain more turns, have longer slaloms, and longer straights. As a result, the
endurance course layout more closely resembled that of the autocross course seen at Formula
SAE Michigan competitions. Due to this similarity and time restrictions, the two events were
combined into on event so simplify testing. The purpose of the autocross event is to evaluate the
car's maneuverability on a tight course. The designed course layout, as seen below in Figure 2,
offers a hairpin turn and tight chicane. These tight features resemble those found in the Formula
SAE autocross competition and therefore measure the car’s handling characteristics on a tight
course. The layout also included a wide, decreasing radius turn and a long slalom with 32.00ft
spacing. Both of which are features commonly found on Formula SAE Michigan competitions’
endurance courses. The straight measures 176.00ft, which is between the lengths found on
common Formula SAE autocross and endurance courses. Since the layout contained features
from both autocross and endurance courses, it was an adequate evaluation of handling
characteristics for both events. However, the purpose of the endurance event is also to measure
the car’s reliability and dependability. In order to accomplish the endurance/autocross test was
performed over an extended period with each lap time recorded. This is a compromise between
the autocross, in which a standing start lap time is recorded, and the endurance event, in which

15
only an elapsed time is recorded. This process of recording lap times allows for evaluation of the
car’s handling characteristics while keeping the car running for an extended period of time.
Therefore, this event also evaluated the car’s reliability and dependability. The number of laps
recorded was restricted by limited time at the testing facilities.
Figure 2: Actual Endurance Track Layout
Skid-Pad
The size of the testing facilities restricted the ability to construct a full-size skid-pad course. The
diameter of each circle was reduced by 10.00ft to fit into the allotted space. This created an outer
diameter of 60.00ft and inner diameter of 40.00ft rather than the competition’s specifications of
roughly 70.00ft and 50.00ft, respectively. This maintained the 10.00ft track width between inner
and outer diameters. This adjustment modified the radius of the skid-pad’s turns but this radius
remained constant. This course layout therefore accomplishes the event’s purpose of evaluating
the car’s cornering ability on a flat surface while making a constant-radius turn. The time taken
for the vehicle to travel three laps of the course was recorded. Each lap consisted of two turns,
both left and right. Sets of three laps were recorded because in competition the driver completes
each lap continuously without interruption. With one stopwatch it was not possible to record the
time taken to travel each turn. Therefore, only an elapsed time was recorded. The number of sets
recorded was restricted by limited testing time.
Modifications of Baseline Vehicle
Before testing could be performed, the 2012 vehicle was modified for reliability and data
acquisition. These changes did not affect vehicle performance. They served only to record data
and to ensure that the vehicle’s dependability allowed it to complete an endurance test.
Data Acquisition
The 2012 Formula SAE car used an Innovate DL-1 device to log various data parameters. During
testing in 2012, this device had intermittent success in logging the desired data. The DL-1 was
also only loaned to the team for use in 2012. As such, there was no data logging device installed

16
on the car for the 2013 project. The group decided that a data acquisition unit was necessary for
baseline vehicle testing. A data acquisition unit was considered desirable because it allowed for
monitoring of engine functions and ensured that the vehicle was running safely. These data logs
also assisted in trouble shooting vehicle malfunctions.
The installed data logger is a Drew Technologies DashDAQ XL unit. This device was chosen
because it was compatible with the CAN signal used by the car’s Haltech ECU data stream. It
also provided two digital inputs and two analog inputs capable of logging all parameters
exported by the Haltech ECU. This combination of inputs allowed for future expansion and
additional sensors. The applicable parameters logged by the DashDAQ XL on the vehicle are as
follows:
Air-fuel ratio
Battery voltage
Engine RPM
Ignition Advance
Injector DC
Intake air temperature
Manifold pressure
Oil Pressure
Oil temperature
Water temperature
Throttle position
In addition to the DashDAQ XL’s technical ability to log data, it was also chosen for its user-
friendly interface, real time display, and recording medium. The unit uses a 4.30in touchscreen
interface that allows the driver to quickly and easily operate the device. This lets the driver start
and end logging without taking off their gloves or any other safety equipment. The large display
shows data in real-time via a digital set of gauges, as seen in Figure 3. This display, in
conjunction with the unit’s audio alerts, allowed the driver to monitor potential malfunctions
while driving. Lastly, the DashDAQ XL records to a removable SD card. This allows logs to be
transferred to and from the vehicle without removing the device.
Figure 3: DashDAQ XL’s Data Display

17
The car’s existing wiring for the Innovate DL-1 was used to power the DashDAQ, through its
accessory port. To connect the DashDAQ XL with the Haltech ECU a ten pin connector usually
reserved for OBD-II interfaces on production vehicles. Four pins of this connector were used to
wire the DashDAQ XL to CAN LO, CAN Hi, ground, and 120 Ohm terminating resistor loop
pins on the ECU.
To mount the DashDAQ XL to the car a new dash unit was manufactured, as seen in Figure 4.
The new dash was designed to retain all existing switches and warning lights. This component
also utilized existing dash mounting points on the secondary roll hoop. The new dash extended
horizontally to include a frame for the DashDAQ, angling the unit towards the driver. This
design was modeled in Solidworks and the final product was laser cut from acrylic.
Figure 4: Physical Mounting of DashDAQ XL
Results
Endurance
The team completed thirty-eight laps of the endurance course we constructed at Worcester
Regional Airport. Driving time during this test was divided between two drivers. Alessandro
Aquadro lapped the course thirty times and Dylan Barnhill finished the last eight. The car
averaged a lap time of 23.10s while Alessandro was driving with a fastest time of 18.30s and a
slowest of 56.30s. This large difference in times is due to excessive over-steer and occasional
spinning of the car. The median lap time during this session was 19.70s. The car averaged a lap
time of 19.50s during Dylan’s eight laps. This session had a fastest time of 18.10s and a slowest
of 25.2.0s with a median time of 18.90s. These lap times cannot be compared with recorded
times from previous competitions since track layouts change significantly from year to year. This
data recorded driver performance and observations made during this test were used for analysis
of the existing vehicle. The full results of the baseline acceleration test can be seen in Appendix
A.

18
Acceleration
Eighteen acceleration runs were completed over a 75yd course with one driver. The average time
for this test was 5.27s, which corresponds to an overall average speed of 29.10mph. The fastest
time recorded for acceleration was 4.26s and the slowest was 6.03s. The 2012 Formula SAE
Michigan competition’s acceleration event recorded a maximum time of 6.60s and a minimum
time of 4.10s. During the 2011 Formula SAE Michigan competition WPI’s car achieved a fastest
acceleration time of 6.20s using the same engine and transmission. However, our baseline
acceleration test track was 91.5% the length of the competition’s specified track length.
Adjusting for this difference in distance, our average pass time would have been approximately
5.78s. This is 0.44s faster than WPI’s 2011 car, but still 1.68s slower than the fastest time and
0.43s slower than the average time set during the 2012 Michigan competition and. The full
results of the baseline acceleration test can be seen in Appendix A.
Skid-Pad
Twelve sets of the skid-pad course were completed with one driver and each set consisting of
three laps. The average lap time for this test was 6.23s with a fastest time of 6.03s and slowest of
6.56s. In the 2012 Formula SAE Michigan competition’s skid-pad event the fastest recorded lap
time was 5.30 seconds and the slowest was 6.63s. However, our skid-pad track was 80.60%
shorter than that specified by competition specifications. Adjusting for this difference in
distance, WPI’s 2012 FSAE vehicle recorded an average lap time of 7.73s. This is 1.17s slower
than the slowest recorded time during the 2012 competition.
Conclusion
The FSAE Michigan competition’s acceleration and skid-pad track layouts are identical each
year. As such, the baseline skid-pad and acceleration lap times can be directly related to lap
times recorded during competition. During the baseline skid-pad test the 2012 WPI vehicle
averaged a lap time 1.17s slower than the slowest recorded time during the 2012 Michigan
competition. Furthermore, this vehicle was 2.43s slower than the fastest time set during the 2012
competition. Since this event is an evaluation of cornering ability, the car’s slow pace implied
poor performance of the vehicle’s handling characteristics.
Although the baseline acceleration test showed a 0.44s improvement over WPI’s 2011 vehicle,
our average pass time was 1.66s slower than the fastest time set in the 2012 Michigan
competition and 0.43s slower than the average time recorded. This shows that there is certainly
room for improvement in the vehicle’s acceleration capabilities. Additionally, those who drove
the car during the acceleration tests noted that the vehicle was difficult to launch. The drivers
observed that while launching the car there was only a very small window of induced throttle
19
positions that resulted in a successful launch. If the driver applied slightly too little throttle
before launching, the transmission and engine would slow below the power band, reducing the
car’s initial ability to produce power. On the other hand, if the driver applied marginally too
much throttle the transmission would engage harshly and over power the rear tires. This narrow
margin of successful initial throttle positions required drivers to be both precise and consistent
with vehicle control inputs. Lastly, drivers noted a perceived lack of torque and throttle response
from the 2012 car when compared to FSAE cars with alternative power-plants.
Track layouts for autocross and endurance events differ between each FSAE Michigan
competition. As a result, it is impossible to draw conclusions from only the car’s baseline lap
times during these events. For these tests driver feedback and general observations of the
vehicle’s behavior were used to draw conclusions. Throughout these dynamic events it was
observed that, during turn in, the vehicle would begin to under-steer. As the driver increased
steering angle to compensate, the car’s inside rear tire would begin to lift. The unloading of the
inside tire would then cause the car to rotate through mid-corner and induce an over-steer effect.
Drivers described this sharp transition between under-steer and over-steer as counterintuitive,
unpredictable, and difficult to control. The vehicle’s turn-in and mid-corner handling
characteristics required the driver to respond quickly to steering feedback while, again, being
extremely precise and consistent with vehicle control inputs.
Goals and Objectives The goal of this project was to optimize the 2012 FSAE car for performance in dynamic and
static FSAE Michigan competition events.
FSAE competition vehicles are defined by SAE to be prototype racecars for nonprofessional
weekend drivers. A nonprofessional target consumer is an inexperienced, amateur driver.
Therefore, the analysis of the 2012 FSAE vehicle by was accomplished by investigating systems
and components that could be more intuitively operated. However, an amateur driver still
requires a competitive vehicle. As such, use we also studied systems that could be optimized to
improve performance in the competition’s dynamic events by providing reductions in weight,
increases in power, and improved handling characteristics.
Through baseline testing and evaluations, five sub-systems of the car were identified as areas
which prohibited intuitive vehicle control and reduced performance during baseline testing. The
project’s primary objectives were to improve each of these sub-systems for performance in the
FSAE Michigan competition. These objectives, then, were to improve the car’s rear suspension,
20
component packaging and ergonomics, air intake, exhaust, and continuously variable
transmission (CVT) for performance in FSAE competition events.
The 2012 car exhibited unpredictable handling characteristics during corner entry and lacked
comparable pace in the baseline skid-pad test. The swing-axle design and lack of a rear
differential, in particular, were major contributors to these effects and have previously been
criticized by FSAE competition judges. Consequently, these were the most closely investigated
components of the rear suspension and drivetrain. This project sought to reduce the rear
suspension’s unsprung weight, to increase the amount of independent rear tire camber gain, and
to allow the rear tires to rotate at independent speeds.
The perceived lack of power, torque, and throttle response during testing was substantiated by
ECU data logs which showed the car to be running a rich air-fuel ratio and un-optimized ignition
tables. In addition, the intake manifold was poorly sealed with fiberglass and the exhaust was a
heavy unit adapted from a Ducatti 748 motorcycle. The exhaust and intake systems were also not
easily capable of being packaged with a radically redesigned rear suspension. As a result, the
project investigated the engine’s mounting position, the air intake, and the exhaust systems for
gains in power and reductions in vehicle weight. The project sought to increase clearance
between the engine and air intake to decrease bend angles of the intake runners. The project also
sought to reduce the weight of both the intake and exhaust systems while allowing them to be
packaged with the new rear suspension and drivetrain.
The packaging and ergonomics of the vehicle were investigated due to their apparent poor
layout. During testing shorter drivers noted that the pedals were difficult to reach while taller
drivers complained of having no place to rest their left foot while they were not braking. The oil
and gas tanks also suffered from leaks and fluid reservoirs were difficult to access. Additionally,
the 2012 vehicle did not have a functioning body and cockpit covering as required by FSAE
regulations. Therefore driver ergonomics, serviceability, and reliability due to component
packaging were identified as areas of potentially significant improvement. This project sought to
increase pedal plate stiffness, provide more room for the driver’s left foot, create a lightweight
body, relocate fluid tanks within the car’s frame, and allow the driver’s seat to be packaged with
the new engine position.
The 2012 car used a CVT to allow for simple vehicle operation. However, the engagement
characteristics observed during the acceleration baseline testing and the subsequent low
acceleration times identified the transmission as an area that could potentially be improved. This
project sought to decrease the CVT’s engagement speed and to maintain an operating speed
consistent with the intake and exhaust systems’ intended operating engine speed.

21
Intake and Throttle Body
Introduction
In order to limit the power produced by FSAE Teams, the FSAE competition rules state that a
20mm restrictor must be placed in line with the intake system. The restrictor is used so that
student teams are unable to make unreasonable amounts of power for the competition. This
restrictor, as a result, heavily influences engine intake design along with engine performance.
Due to the restrictor, the engine cannot get sufficient air mass at higher RPMs. Therefore, the
engine must be tuned to perform optimally at a RPM lower than designed for as stock.
The Intake system this year was optimized for a specific RPM of 7500; an RPM which past
MQP Research has shown to be below the point where the air passing through the restrictor
affects power generated by the Genesis 80 FI engine. Due to the fact that a CVT transmission is
being used, we can tune the transmission, engine and all accessory components associated with
both systems to perform best at 7500 RPM. This type of transmission will allow the engine to
hold at one specific RPM during acceleration, allowing for the engine to run in peak performance
range over the entire acceleration period. Being able to tune for a specific RPM is a preferred
method by tuners. This is due to the pressure wave tuning done when designing the intake. The
CVT allows us to hold near that specific range for the longest period of time, taking full
advantage of a tuned intake.
Previous Designs
Intake
The intake designed and manufactured for the 2012 car was effective for its basic design intent,
to funnel air into the engine, yet it fell short of a few goals. The 2012 team had four goals for
their design, the first of which was to perform calculations for the intake manifold using a range
of engine speeds from 7500 RPM to 8000 RPM. In this, the group was successful and produced
numbers for the intake runner diameters, lengths and volume. Although the calculations are
apparent, the actual sources for the calculations used are missing. This missing requires that the
calculations to be done again for the existing car. The calculated data used in the design of the
2012 car is listed in Table 1 on the next page.

22
Intake Parameter Result
Runner Cross-section Diameter of 1.28 in.
Runner Length Option 1 33.53 in.
Option 2 16.44 in.
Option 3 10.78 in.
Option 4 7.90 in.
Option 5 6.19 in.
Plenum Volume 1497cc
Table 1: 2012 Intake Calculations
The second goal for the 2012 vehicle’s intake was to perform calculations verifying that the
restrictor is not causing choked airflow at the desired RPM range stated above. These
calculations will be used to once again to provide validity to the RPM range which the team is
using this year. These calculations can be found in Appendix B.
The Third goal was to perform calculations that showed the fuel injectors could provide
sufficient fuel capacity for the engine. This calculation proved that the injectors were in fact
sufficient although that is to be expected because the engine will not be operating in the higher
RPM range that was possible from the factory due to the restrictor. These Calculations can be
found in Appendix B.
The last goal that the group set out to accomplish with their intake design was to accommodate
various packaging options. Although the true purpose or result of this goal is unclear, the group
attempted to design the intake so that it could be adjustable during testing. This adjustable intake
design is not uncommon in Formula SAE projects due to the discord between theoretical and
practical intake equations. Their design initially allowed for both runner length and plenum
volume to be adjustable. Unfortunately due to issues in manufacturing, these ideas had to be
scrapped in order to achieve a more basic need – a sealed intake manifold that did not allow air
to enter the intake from anywhere other than the throttle body. These issues were cause by the
manufacturing technique which was used, Fused Deposition Modeling (FDM) – a rapid
prototyping technique.
Due to the high
tolerances and the
porosity of the
material, dimensions
were not precise
enough to create seals
Figure 5 - 2012 FSAE Intake & Throttle Body

23
and the gaps in the surface allowed for air to travel through the connections. As a result, a
fiberglass layer had to be added to ensure the design would be properly sealed, thus not allowing
the intake to adjustable thereafter. This fiberglass layer also adds unnecessary weight to the
intake system.
Throttle Body
The current throttle is a barrel style unit produced for the 2009/2011 Formula SAE vehicle. This
design allows for excellent air flow at wide open throttle (WOT). Unfortunately, the unit
produced is bulky and actuates slightly too far. This over-opening inhibits airflow and ultimately
the power potential of the engine. Other potential designs include a butterfly style throttle body
which is commonly found in the automotive industry. This style provides excellent control and
smooth transfer through throttle positions. The smooth acceleration provided by the butterfly
valve style throttle body makes it very appealing in automotive industry due to the needs of the
everyday buyer. The butterfly valve style is not optimal for our purposes due to the obstruction
remaining in the path of the air even at WOT. Therefore, it was chosen that the throttle body also
be redesigned.
Figure 6 - 2009/2011 Throttle Body

24
Research & Design
Research for the 2013 FSAE Project began with the review of past designs and understanding the
purpose of an intake. The intake serves many purposes for the engine. First, it is critical that the
air be delivered to the engine efficiently and mixed properly with fuel. The intake also needs to
supply the engine with a sufficient immediate amount of air – usually slightly more than enough
for one firing cycle for each cylinder. The throttle body also must be designed with a vacuum
fitting so that the engine management system can calculate the airflow mass entering the engine.
Beyond these basic needs, a properly designed intake can also help increase the volumetric
efficiency of the engine by taking advantage of the pressure waves of air created by the rapid
opening and closing of the intake valve.
The intake is made up of a few critical components. The air travels through the throttle body
which is opened a certain amount by the throttle position designated by the driver. The next
piece is the restrictor which is unique to the Formula SAE rules and is 20mm maximum in
diameter. From the restrictor, the air travels into the plenum, which is a holding area for the air to
be fed into the intake runners. These runners divide the air from the plenum and feed each
cylinder independently. The intake also is made up of the necessary mounting hardware to hold
the injectors at a spot that allows for the injected fuel to mix well with the air and atomize
quickly upon hitting the hot intake valve.
Throttle Body
The design of the throttle body was based around a few design specifications. First, the throttle
body had to have zero impedance in the air flow at WOT. Second, the design had to simple –
containing a minimal amount of components – therefore, reducing manufacturing cost, time and
complexity. Third, the throttle body must have an adjustment for the idle air flow so that tuning
can be completed at idle throttle. Fourth, the throttle body must be designed so that the throttle
cable can act without the possibility of binding therefore causing a risk to the driver’s safety.
This year’s MQP utilized a rotational slide style throttle body. A spring retained slide will be
actuated by the pedal. This style throttle body satisfied the requirements of the design
specifications.
Intake
The design of the intake focused on a few guiding design parameters. First, in order for the
intake to operate properly, the design must be based around the calculations above for runner
diameter and runner length. It is also important that the runner lengths be equal so that the
pressure wave tuning is not different from one cylinder to another. Keeping with the design
25
intent of the car, cost effective and simple, the intake manifold must be a relatively simple design
and be easy and cheap to manufacture. Lastly, any components that will be exposed to fuel in
any way must be produced from a metal due to the possibility of degradation from plastic
components that are continuously exposed to fuel. Also, the point at which any two components
come together must be sealed by two gaskets to ensure a complete seal between the inside of the
intake and the atmosphere.
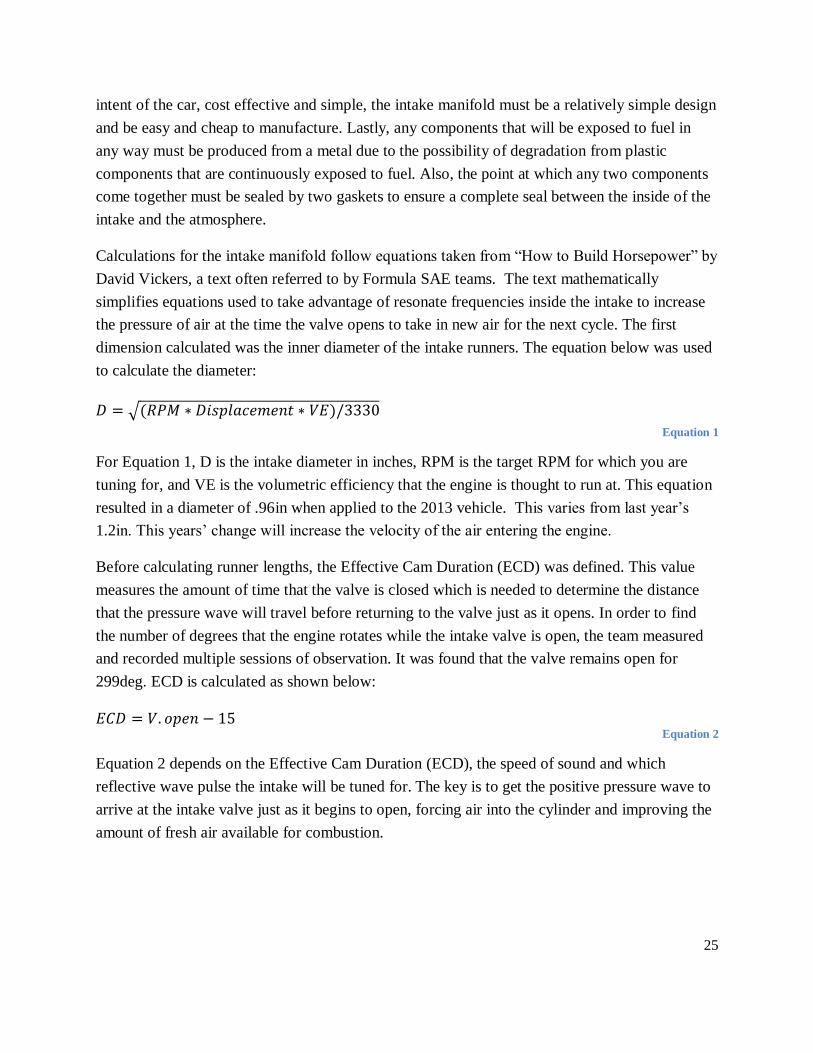
Calculations for the intake manifold follow equations taken from “How to Build Horsepower” by
David Vickers, a text often referred to by Formula SAE teams. The text mathematically
simplifies equations used to take advantage of resonate frequencies inside the intake to increase
the pressure of air at the time the valve opens to take in new air for the next cycle. The first
dimension calculated was the inner diameter of the intake runners. The equation below was used
to calculate the diameter:
√
Equation 1
For Equation 1, D is the intake diameter in inches, RPM is the target RPM for which you are
tuning for, and VE is the volumetric efficiency that the engine is thought to run at. This equation
resulted in a diameter of .96in when applied to the 2013 vehicle. This varies from last year’s
1.2in. This years’ change will increase the velocity of the air entering the engine.
Before calculating runner lengths, the Effective Cam Duration (ECD) was defined. This value
measures the amount of time that the valve is closed which is needed to determine the distance
that the pressure wave will travel before returning to the valve just as it opens. In order to find
the number of degrees that the engine rotates while the intake valve is open, the team measured
and recorded multiple sessions of observation. It was found that the valve remains open for
299deg. ECD is calculated as shown below:
Equation 2
Equation 2 depends on the Effective Cam Duration (ECD), the speed of sound and which
reflective wave pulse the intake will be tuned for. The key is to get the positive pressure wave to
arrive at the intake valve just as it begins to open, forcing air into the cylinder and improving the
amount of fresh air available for combustion.

26
Upon calculating the inner diameter of the intake runners and the ECD, the length of the intake
runners was then calculated. Equation 3 was used for calculating the length of the intake runners.
[ ]
Equation 3
This calculation resulted in the table of values below:
Reflective Wave # Length (in)
1 38.125
2 18.823
3 12.389
4 9.172
Table 2: Calculated Intake Runner Lengths
The intake design for the 2013 vehicle focused on either the 2nd
reflective wave pulse which
entails building a longer intake but allows for a greater effectiveness than using a higher number
of reflective wave.
Lastly, plenum volume must be considered with the design as changing the size drastically will
impede throttle response. If the intake plenum becomes too large, there is a discord between the
time the driver depresses the gas pedal, and the time the engine actually responds. If the plenum
becomes too small, the engine does not have enough air immediately available to accelerate and
lags while the plenum must be refilled. The plenum volume was chosen to be 2.5 times the
engine displacement, a common choice among FSAE Teams.
Manufacturing
Throttle Body
The two major components of the throttle body were made out of aluminum. These two parts are
the back plate of the intake and the rotating slide. Aluminum was chosen because of its low cost,
ease of machining, non-permeable nature, and low surface friction. These components were
manufactured in Washburn Laboratories at Worcester Polytechnic Institute by the students on the
team. CAM software was created using Esprit and machining was performed by the team using
CNC mills. To reduce friction between the components, the components were buffed and de-
burred.
The last components of the throttle body served to ensure the throttle position sensor would
properly read the position of the rotational slide. Due to the small forces these components would

27
be subject to, they were made form a rapid prototyping process. These components were made
off-site by a team sponsor, Synergeering. The finalized throttle body can be seen below with the
restrictor attached.
Figure 7 - 2013 Throttle Body and Restrictor
Restrictor & Intake
The restrictor, which must be a maximum of 20mm in diameter, will take a slightly different
approach from the 2012 MQP manufacturing strategy. Previously, the restrictor was made of
rapid prototype ABS on-site, a light and quick method of production. This choice however leads
to poor build quality and resulted in a restrictor that measured less than 19mm in diameter. For
the 2013 car, the restrictor will be once again made by a rapid prototyping process performed by
the team sponsor Synergeering. Their manufacturing expertise with this method has resulted in a
restrictor built to specification with a surface roughness much lower than the previous design.
This approach was chosen over machining a restrictor due to cost and time restraints from the
members of team. The restrictor can be seen in Figure 3.
Previous Formula SAE MQPs used a rapid prototyping method for producing their intake
manifolds. The same technique will be used for many of the components this year but will be
handled off-site by a sponsor who specializes in rapid prototyped intakes. This will help the team

28
avoid the issues the plagued the previous’ team manufacturing perils. The rapid prototyping
process used by Synergeering was Selective Laser Sintering. For the components that are to be
machined from metal, aluminum was chosen over steel due to its lower cost and ease of
machining. The aluminum components for the intake are being produced off-site by a team
vendor SpecMaster in Denver, Colorado. The finalized intake and throttle body can be seen
below.
Figure 8 - Completed 2013 Intake
Conclusion
The intake for this year will use the resonating “supercharging” effect of pressure waves, use a
smaller plenum size as the 2012 design, and include a new restrictor and throttle body. The
manufacturing techniques used to produce the intake manifold maintained tighter tolerances and
avoided FDM rapid prototyping. The 2013 intake focused on minimizing restriction of airflow
into the engine while maintaining tuned dimensions. With the tuned effects of the intake and
exhaust the engine will hopefully operate closer to 100% volumetric efficiency and therefore a
power that will allow the car to be successful at competition.

29
Exhaust System
Previous Exhaust Design
The exhaust designed for the 2012 FSAE vehicle was based on a maximum engine speed of
8,000 RPM. Based on exhaust cam duration of 242deg, the primary lengths were determined to
be 50in, 24in, or 16in. Due to packing constraints on the 2012 vehicle, the group chose to make
the primary headers 24 in. in length. Through background research, the team determined that a
two into one exhaust collector would not be ideal for the car’s Yamaha Genesis 80fi engine.
Since the Genesis 80fi is an odd firing engine, the pressure pulse does not line up the same way
as an even firing engine. This creates a scavenging effect that must be considered when tuning
exhausts for an odd-firing engine. This effect reduces the engine’s performance when compared
with the use of two singular primaries. With this knowledge the team investigated the use of an
exhaust plenum similar those used by other Formula SAE teams. After weighing both options,
the team decided to use to individual primaries with two separate mufflers, despite the additional
weight.
The primaries were designed to fit behind the engine and in front of the rear axle. This was
accomplished through the use of mandrel bends. The exhaust headers were comprised of four
pipes welded together. Mid-bend cuts are almost impossible to make perpendicular to the pipe
and were avoided in the design. To avoid this, the team attempted to keep bends at 90deg and
180deg. The final design included one 70deg bend that connected to the mufflers. The 2012 car’s
primaries can be seen in Figure 9.
Figure 9: Primary Exhausts on the 2012 FSAE Car

30
The mufflers chosen for the 2012 car are from a Ducati 748 motorcycle. The team had originally
planned to fabricate straight through mufflers with absorptive material. However, due to time
constraints, this did not occur. The Ducati mufflers were able to meet their task specifications by
muffling the exhaust to less than 110dB at 16in. from the exhaust exit at full throttle. The only
negative aspect of these mufflers is their relatively high weight. In retrospect, the team wanted to
provide something that would be slightly louder but weigh a considerable amount less.
Exhaust Research
Exhaust Primary Research
The exhaust system is essential to ensure that the exhaust gasses exit the engine cylinders as
quickly as possible. When considering an engine used in a race application, tuning the exhaust at
a specific engine speed can have a large impact on engine performance1. Tuning the exhaust is
achieved by syncing pressure pulses so that the exhaust gasses are pulled from the engine. An
engine’s pressure pulses have both a compression and expansion wave. When the engine fires
and the exhaust valve opens, a compression wave instantly bursts out of the cylinder and travels
down the exhaust pipe. As the compression wave reaches a significant change in pipe cross
sectional area and pressure, an expansion wave is then sent back toward the cylinder. An
expansion wave is an inverted wave of the compression wave. The time at which the expansion
wave reaches the exhaust valve is crucial to scavenging the exhaust gasses. If the expansion
wave reaches the valve while it is still open, the wave can force exhaust gasses back into the
cylinder which will reduce engine performance. If the wave reaches the exhaust valve while it is
closed, the reflected wave will help push the exhaust gases out of the exhaust system2. The
appropriate primary lengths and pipe diameter can be determined through a series of equations
based on engine speed and valve timing3.
Calculations
After a preliminary research was done on general exhaust function, the focus turned to
calculating the primary pipe lengths. Alexander Graham Bell published Performance Tuning in
Theory and Practice, a book that outlines a series of equations that determine pipe length and
diameter. The first equation was used to determine the primary length and can be seen in
Equation 4.
1 Vizard, David. How to Build Horsepower. North Branch: SA Desgin
2 Blair, Gordon P. Design and Simulation of Four-stroke Engines. Warrendale, PA: Society of Automotive
Engineers, 1999 3 Bell, A. Graham. Performance Tuning in Theory and Practice. Sparkford, Yeovil, Somerset, England: Haynes
Pub. Group, 1981.

31
Equation 4
The desired engine speed of the Genesis 80fi engine for this application is 7500 RPM. The 2012
MQP measured the valve timing, however to make sure these timings were correct; the 2013
MQP also measured the timing. This process was done by designing a degree wheel in
SolidWorks and fabricating it with WPI’s laser cutter. This degree wheel was then placed on the
crankshaft. When the cylinder is at top dead center (TDC) the degree on the valve timing is
considered to be 0 and 360. Bottom dead center (BDC) is at 180deg and 540deg. To measure the
valve timing, the crankshaft was manually rotated until the cam made contact with the intake
valve and when the valve starts opening. This value on the Genesis 80fi opens 30deg before
TDC. The crankshaft was then rotated until the intake valve closes. The Genesis 80fi intake
valve closes at 269deg. The exhaust valve was then done through the same process. The exhaust
valve opens at 487deg and closes at 47deg after TDC. This means that the exhaust valve opens
53deg before BDC. Applying the known information to Equation 4, the Genesis 80fi will have a
primary runner with the length of 23.41in.
After the primary length has been determined, the inside diameter of the pipe can be determined.
This equation depends on the displacement as well as the length of the primary runners. The
equation for the inside diameter can be seen in Equation 54.
√
Equation 5
The displacement of the Genesis 80fi is 499.00cm2. Since the Genesis 80fi is a two cylinder
engine, the displacement of one cylinder is 249.50cm2. As determined above the primary length
is 23.41in. Plugging in the know information gives an inside diameter of 1.29in. for the exhaust
4 Bell, A. Graham. Performance Tuning in Theory and Practice. Sparkford, Yeovil, Somerset, England: Haynes
Pub. Group, 1981.

32
primary. Knowing both the inside diameter and the primary length allows for the exhaust
primaries to be designed within the car.
Muffler Preliminary Research
A muffler or silencer is a device that reduces noise from an engine. The two major types of
mufflers are a reactive muffler and an absorptive muffler. A reactive muffler uses expansion
chambers to lower sound pressure within the muffler. This type of muffler also has perforated
inlet and outlets that are not in a straight line. This helps allow the pressure pulses to disperse
through the expansion chamber. An absorptive muffler uses a perforated steel pipe surrounded
by insulation. The insulation is then held together by an outer casing. As the pressure waves
move through an absorptive muffler, the perforated steel allows for the waves to disperse into the
insulation, deadening the sound.
Absorptive mufflers are usually a straight through pipe which is better for fluid flow through the
exhaust. Reactive mufflers generally create a higher pressure in the muffler which slows down
the flow of exhaust gases and reduces engine performance. However, reactive mufflers reduce
the sound created by pressure waves more than an absorptive muffler. Reactive mufflers are
generally used as a stock muffler in automotive applications as driver comfort is the primary
concern over engine performance. When applied on a Formula SAE car, the primary concern is
engine performance. The only requirement for Formula SAE is that the mufflers attenuate the
sound to a maximum of 110dB at 19.68in. from the exhaust opening at a 45deg angle with the
outlet in the horizontal plane. Considering these rules and engine performance, an absorptive
muffler is ideal for the 2013 Formula SAE car5.
Exhaust System Design
Primary Exhaust Design Specifications
The primary exhaust must be tuned to match the Genesis 80fi at 7500 revolutions per
minute.
There must be one primary for each cylinder and must be packaged to fit around the
independent rear suspension designed for the 2013 FSAE vehicle. It must also not
interfere with the CVT secondary, mounts, shaft or sprocket.
The paths of the primaries must be designed for the best flow of exhaust fluids through
the pipe while still adhering to the packaging constraints.
The primary exhaust must allow room for the mufflers to be added to the end.
5 Potente, Daniel. "General Design Principles for an Automotive Muffler." (2005): n. pag.Day Design.

33
Primary Exhaust Design
When designing the exhaust headers, the most important aspect was to make sure that the length
and pipe inside diameter was accurate to the calculated values. Allow though fluid flow is
important, packaging the headers within the limitations of the 2013 FSAE rules is a requirement.
With this in mind, the pipe length was kept the same and packaged to fit within the requirements.
The process to design the headers utilized SolidWorks to package the determined pipe size into
the 2013 vehicle.
Keeping fabrication in mind, it was important to make sure that all bends and lengths of pipe
segments were within the means of the MQP to manufacture. This meant keeping the bends
square to the vertical and horizontal planes. The final design included two 90deg bends and one
180deg bend. The inside pipe diameter on the headers was 1.33in. and final length was 23.39in.
This allowed the headers to meet the packaging requirements as well as the tuning requirements.
The final design of the headers can be seen in Figure 10. The same design was used for both
cylinders of the engine.
Figure 10: Final Exhaust Header Design
The two headers within the overall car model can be seen in Figure 11. The header mounts to the
engine were added after the swept paths had been determined. This allowed for an accurate

34
placement of the mounts on the round tubing. With this an angle it was easy to weld the headers
onto the mounts and making sure that they were packaged correctly.
Figure 11: Final Exhaust Headers
As can be seen, the headers avoid the engine mounts, the jackshaft and sprocket, CVT
secondary, and the drive sprocket on the axle. The header design also leaves enough room for the
muffler design, which will be discussed in the next section.
Muffler Design Specifications
The muffler must produce a sound less than 110dB at 19.68in. from the outlet and at an
angle of 45deg in the horizontal plane at its highest engine speed.
The exhaust outlet must not exceed 17.70in. behind the centerline of the rear axle.
The exhaust outlet must not exceed a height of 23.60 in. from the ground.
The muffler must weigh 25% less than the muffler on the 2012 FSAE vehicle.
Muffler Design
The most important aspect of the muffler design is to maximize engine performance while
reducing exhaust noise. In the case of the 2012 car, the MQP team was able to significantly
reduce the sound produced by the engine but the Ducati mufflers on the vehicle are extremely
heavy and there was room for improvement. The design for the 2013 was a single absorption
muffler with two inlets and two outlets. It contained two straight through steel perforated pipes
with sound deadening material on all sides. The casing for the muffler was an oval shape to

35
allow for both straight through pipes. The inlets were the same inside diameter as the outside
diameter of the primary pipes. The cross sectional area of the perforated steel pipe had a 60%
larger cross sectional area than the cross sectional area of the primary pipes. The reason for this
increase in cross sectional area was to allow the pressure pulses to reflect the expansion wave at
the tuned length that was calculated. If the perforated steel pipes had the same cross sectional
area as the primaries, the expansion wave would not be created until the pressure wave reached
the outlet at atmospheric pressure. This would add another 17.63in. to the primary length and
cause a significant loss in engine performance. The final design of the muffler can be seen in
Figure 12.
Figure 12: Final Muffler Design
The outlets of the muffler were 15.50in. behind the center of the rear axle, which is well within
the requirements of the FSAE requirements. Similarly, the muffler height was 22.93in. above the
ground that is also within the FSAE requirements. The headers entered the muffler 3.25in. apart
from each other and the muffler was attached to the headers through two small segments of
piping that slipped over the headers and were welded onto the muffler. This muffler was packed
with fiberglass as a sound deadening material and attenuated the sound below the maximum
required by FSAE.

36
Exhaust System Fabrication
Primary Exhaust Fabrication
The material purchased for the exhaust headers was a six foot long AISI 4130 steel round tubing.
With this the headers were cut to the length of each segment shown in the CAD model. Then
steel tubing was sent to a muffler shop in Worcester for bending. After the components were
bent, the header mounts could be made and welded. The header mounts were designed so that
they could be made using the CNC machines in Washburn Shops. These were made out of 1/8in
AISI 4130 steel. Once this was completed they were tack welded to the headers to ensure they
would meet the packaging requirements set by the rear suspension. Once the confirmation of the
packing occurred, the headers were TIG welded with the header mounts.
Muffler Fabrication
The faceplates of the muffler were made out of 1/8in. AISI 4130 steel plate. They were made
using the CNC machines located in Washburn Shops. These faceplates can be seen in Figure 13.
Once the face plates had been CNC’d, the perforated steel tubing that had been purchased for the
2012 FSAE MQP was welded to the front faceplate. The casing that wraps around the faceplates
was 1/16in. AISI 4130 steel. Once the perforated steel was attached, the 1/16in. steel was cut to
length and then wrapped and welded to the front faceplate.
With the casing around the front faceplate, the muffler was then packed with fiberglass as a
sound deadening material. This was done in steps in order to have the correct amount of sound
deadening material. If there was too much material, there would be excess weight in the muffler
and if there was too little material the muffler would not perform to the FSAE specifications.
Once the correct amount of material was placed into the muffler, the exit faceplate was welded
onto the muffler and the muffler system was complete.
Figure 13: Muffler Entrance and Exit Faceplates

37
Exhaust System Conclusion
The main reason for redesigning the exhaust system was to compensate for the new rear
suspension design, as well as the redesign of the engine mounts. The new sub frame design
would not allow for the old header design because the old headers traveled down below the rear
axle where the sub frame currently sits. On top of this, a major design goal of the engine mounts
was allow more room for the intake between the seat and engine. This meant that the engine
needed to move backwards, which would have made the old headers incompatible with the old
rear suspension.
Beyond this, the exhausts were tuned to 7500 RPM, which is 500 RPM less than the previous
MQP. The reason for this is that it is unlikely that the Genesis 80fi will be able to run higher than
7500 RPM. On top of this, the ECU was tuned for 7500 RPM. By using 7500 RPM for tuning
yielded different header lengths, and tube diameter than the previous year. The mufflers from last
year left a lot of room for improvement. At the last minute the MQP from 2012 used Ducati
mufflers on the 2012 car. While these mufflers did a great job of attenuating the sound produced
by the engine, they were quite heavy. The design goal with the 2013 mufflers was to meet the
FSAE requirements for sound level while being significantly lighter than the 2012 mufflers.
With a two into one muffler design, the 2013 muffler achieved the task specifications.
There were two small issues in redesigning the exhaust headers. The first of these was the
packaging with the rear suspension. Because of some redesign in the rear suspension, the exhaust
headers had to be redesigned multiple times to meet the packaging needs. Also, because the
engine was moved back two inches toward the rear axle, the exhaust system had two less inches
to be packaged behind the engine. Although two inches does not seem like a lot, it makes
packaging quite a bit more difficult. This is what caused such severe bends in the headers,
because there needed to be room for the muffler to sit behind them. Overall, the exhaust system
achieved its task specifications for the 2013 FSAE car.
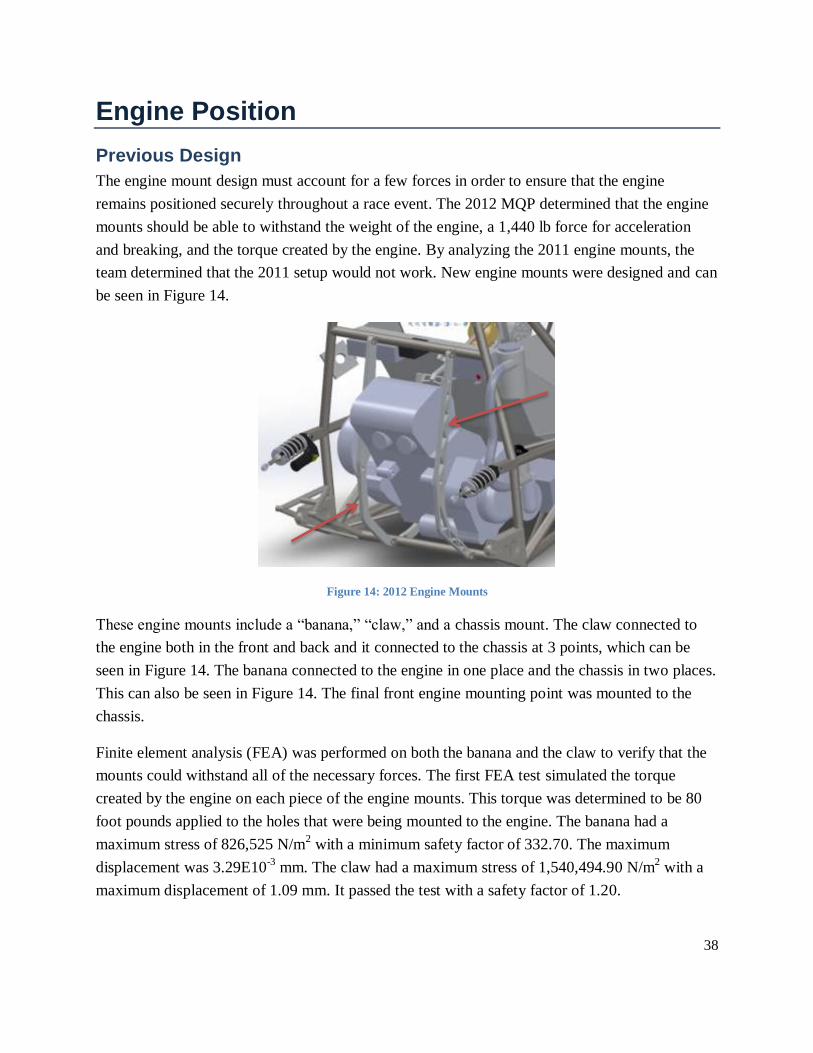
38
Engine Position
Previous Design
The engine mount design must account for a few forces in order to ensure that the engine
remains positioned securely throughout a race event. The 2012 MQP determined that the engine
mounts should be able to withstand the weight of the engine, a 1,440 lb force for acceleration
and breaking, and the torque created by the engine. By analyzing the 2011 engine mounts, the
team determined that the 2011 setup would not work. New engine mounts were designed and can
be seen in Figure 14.
Figure 14: 2012 Engine Mounts
These engine mounts include a “banana,” “claw,” and a chassis mount. The claw connected to
the engine both in the front and back and it connected to the chassis at 3 points, which can be
seen in Figure 14. The banana connected to the engine in one place and the chassis in two places.
This can also be seen in Figure 14. The final front engine mounting point was mounted to the
chassis.
Finite element analysis (FEA) was performed on both the banana and the claw to verify that the
mounts could withstand all of the necessary forces. The first FEA test simulated the torque
created by the engine on each piece of the engine mounts. This torque was determined to be 80
foot pounds applied to the holes that were being mounted to the engine. The banana had a
maximum stress of 826,525 N/m2 with a minimum safety factor of 332.70. The maximum
displacement was 3.29E10-3
mm. The claw had a maximum stress of 1,540,494.90 N/m2 with a
maximum displacement of 1.09 mm. It passed the test with a safety factor of 1.20.
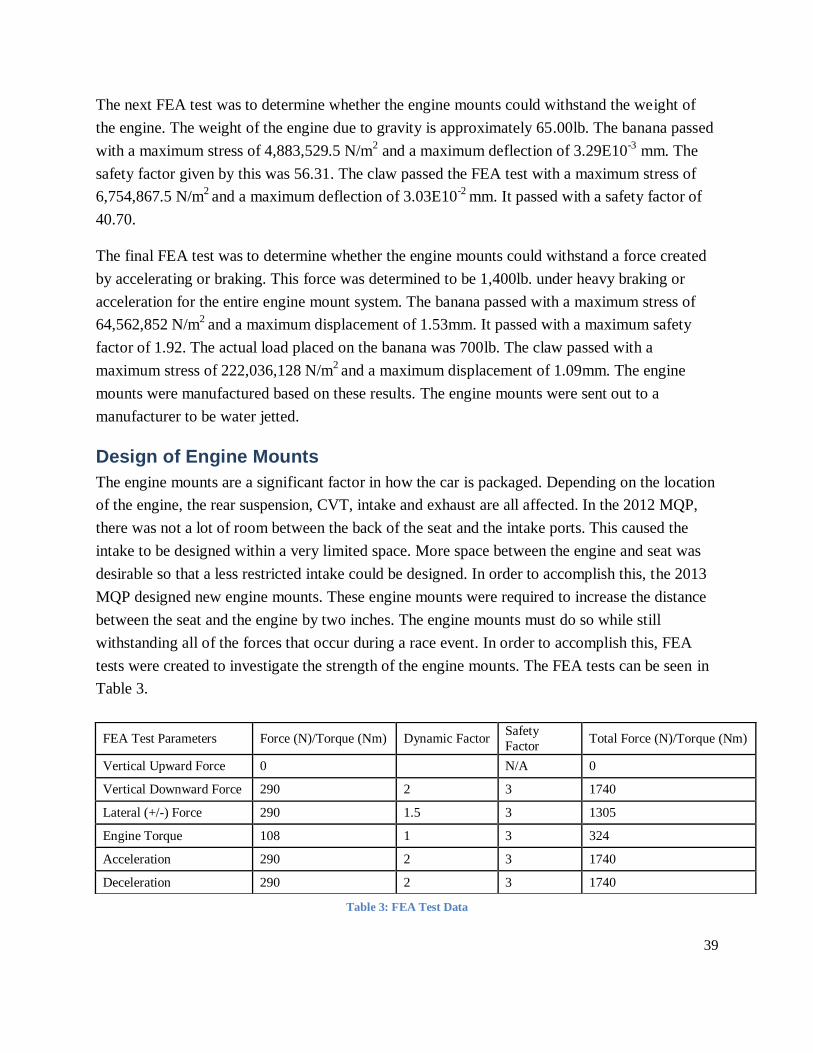
39
The next FEA test was to determine whether the engine mounts could withstand the weight of
the engine. The weight of the engine due to gravity is approximately 65.00lb. The banana passed
with a maximum stress of 4,883,529.5 N/m2 and a maximum deflection of 3.29E10
-3 mm. The
safety factor given by this was 56.31. The claw passed the FEA test with a maximum stress of
6,754,867.5 N/m2
and a maximum deflection of 3.03E10-2
mm. It passed with a safety factor of
40.70.
The final FEA test was to determine whether the engine mounts could withstand a force created
by accelerating or braking. This force was determined to be 1,400lb. under heavy braking or
acceleration for the entire engine mount system. The banana passed with a maximum stress of
64,562,852 N/m2
and a maximum displacement of 1.53mm. It passed with a maximum safety
factor of 1.92. The actual load placed on the banana was 700lb. The claw passed with a
maximum stress of 222,036,128 N/m2
and a maximum displacement of 1.09mm. The engine
mounts were manufactured based on these results. The engine mounts were sent out to a
manufacturer to be water jetted.
Design of Engine Mounts
The engine mounts are a significant factor in how the car is packaged. Depending on the location
of the engine, the rear suspension, CVT, intake and exhaust are all affected. In the 2012 MQP,
there was not a lot of room between the back of the seat and the intake ports. This caused the
intake to be designed within a very limited space. More space between the engine and seat was
desirable so that a less restricted intake could be designed. In order to accomplish this, the 2013
MQP designed new engine mounts. These engine mounts were required to increase the distance
between the seat and the engine by two inches. The engine mounts must do so while still
withstanding all of the forces that occur during a race event. In order to accomplish this, FEA
tests were created to investigate the strength of the engine mounts. The FEA tests can be seen in
Table 3.
Table 3: FEA Test Data
FEA Test Parameters Force (N)/Torque (Nm) Dynamic Factor Safety
Factor Total Force (N)/Torque (Nm)
Vertical Upward Force 0 N/A 0
Vertical Downward Force 290 2 3 1740
Lateral (+/-) Force 290 1.5 3 1305
Engine Torque 108 1 3 324
Acceleration 290 2 3 1740
Deceleration 290 2 3 1740

40
Beyond moving the engine back two inches the engine mounts also needed to attach to support
the sub frame of the new suspension and have a mount for the jackshaft to attach through the
engine mounts. The two pickup points from the 2012 FSAE car were utilized and then a third
pick up point was added to the sub frame to support it. The model of the two new engine mounts
can be seen in Figure 15 and Figure 16.
Figure 15: Right Engine Mount
Figure 16: Left Engine Mount
Along with these two engine mounts is a third piece of steel that runs across the front of the
engine that holds the front two engine mounting points. The overall engine mounting set up can
be seen in Figure 17.

41
Figure 17: Engine Mount Setup
Previously, the jackshaft was attached off center of the car to the left so that it could drive the
sprocket on the solid rear axle. In the 2013 FSAE car, this could not be done. Because of the
independent rear suspension, the drive sprocket needed to be placed in the center of the rear
suspension attached to the differential. This meant that the jackshaft had to be placed between
the engine mounts and the best way to do this was to incorporate and mount the jackshaft to the
engine mounts. Two holes were placed into each engine mount allowing for a bearing to be press
fit into each one. A new jackshaft was designed in order fit the new dimensions behind the
engine. The new jackshaft can be seen in Figure 18.
Figure 18: 2013 Jackshaft
This new jackshaft allows for play in the left and right directions so that the jackshaft sprocket
and driveshaft sprocket can line up perfectly, as well as the CVT primary and secondary. The

42
same spline sizes were used from the old jackshaft so that they fit the CVT secondary and the
jackshaft sprocket from the previous year could be used.
After the packing of the engine mounts was complete, the strength of the new engine mounts had
to be tested. Several iterations were made until the mounts met the requirements given by the
dynamic and static factors calculated. The FEA tests that were used are described below.
The first FEA test showed that the engine mount designs could withstand the lateral forces that
are experienced while cornering the car. This number was determined to be 1,305N due to the
engine’s approximate weight of 290N and multiplied by a dynamic factor of 1.50. Under race
conditions there wouldn’t be more than 1.50G’s through a corner. The dynamic factor was
therefore determined to be 1.50G’s. Lastly, the safety factor of three was multiplied by the
dynamic factor to get 1,305N. The lateral FEA test can be seen on the left engine mount in
Figure 19 and Figure 20. As seen with the acceleration test, the left engine mount also passes the
lateral FEA test. The maximum stress acting on the mount was 282,921,216 N/m2 and the
maximum deflection was 3.12mm.
Figure 19: Stress under Lateral Load

43
Figure 20: Deflection under Lateral Load
The next test that was performed simulated the forces experienced by the mounts under
acceleration and braking. The magnitude of this force was determined to be 1,740N. This value
was given by the weight of the engine, which is approximately 290N and multiplied by a
dynamic factor of two to account for the G forces that are applied to the mounts under
acceleration and deceleration. Finally, the magnitude of this force was multiplied by a safety
factor of three. This final value allows for error manufacturing to ensure that the engine is
securely on the car. The FEA results of the acceleration test on the left engine mount can be seen
in Figure 21 and Figure 22. The left engine mount passed this test with a maximum stress of
37,132,688 N/m2 and a maximum deflection of 0.21mm. Under heavy acceleration and
deceleration this steel link would be strong enough to hold the engine in place with a safety
factor of three.
Figure 21: Stress und Acceleration Load

44
Figure 22: Maximum Deflection under Acceleration Load
The next test verified that the engine mount designs could support the weight of the engine. This
value was determined to be 209N multiplied by a dynamic factor of three and the safety factor of
three. This gave a total force of 1740N to place downward on the engine mounts. The analysis of
the left engine mount can be seen in Figure 23 and Figure 24. The left engine mount again
passed the downward force test. There was a maximum stress of 39,343,680 N/m2
and a
maximum deflection of 0.16mm.
Figure 23: Stress under Downward Load

45
Figure 24: Deflection under Downward Load
The final engine mount FEA test analyzed the effects of torque created by the engine. This
moment was determined to be 324Nm by the engine producing approximately 108Nm while
running and a safety factor of 3 was used in calculating the total value. The analysis of the left
engine mount is shown in Figure 25 and Figure 26. The left engine mount passed with a
maximum stress of 21,635,964 N/m2 and a maximum deflection of 0.66mm.
Figure 25: Max Stress under Torque Load
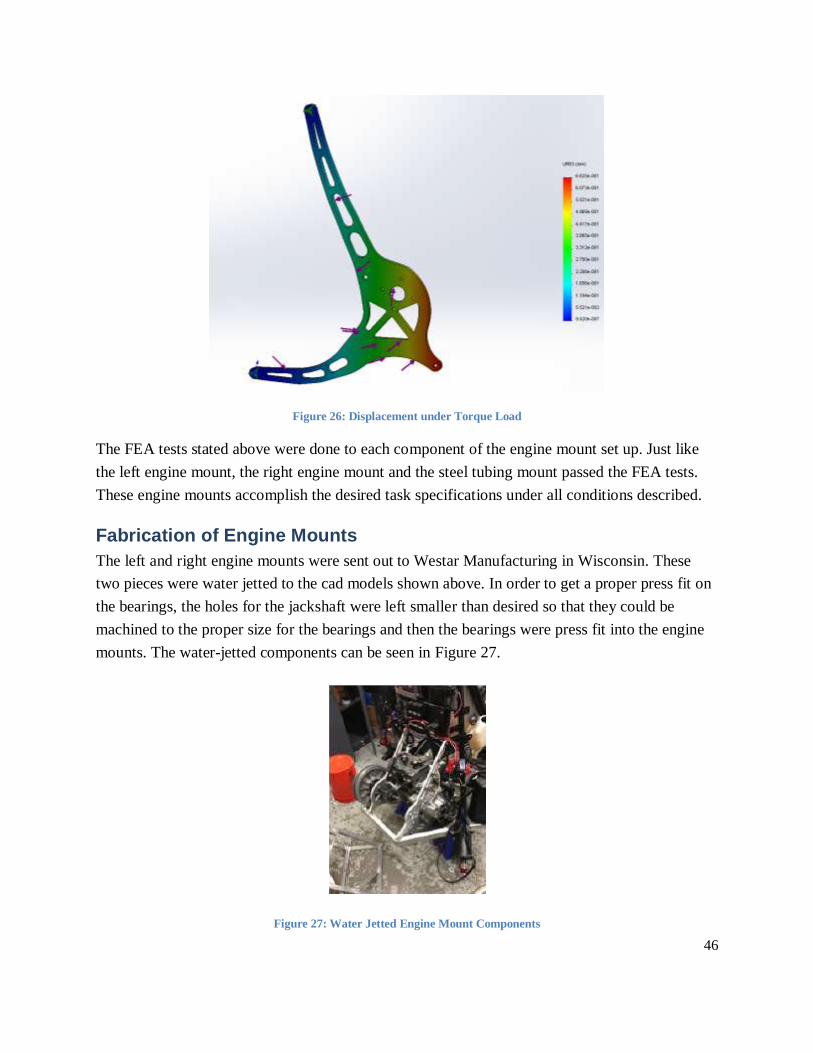
46
Figure 26: Displacement under Torque Load
The FEA tests stated above were done to each component of the engine mount set up. Just like
the left engine mount, the right engine mount and the steel tubing mount passed the FEA tests.
These engine mounts accomplish the desired task specifications under all conditions described.
Fabrication of Engine Mounts
The left and right engine mounts were sent out to Westar Manufacturing in Wisconsin. These
two pieces were water jetted to the cad models shown above. In order to get a proper press fit on
the bearings, the holes for the jackshaft were left smaller than desired so that they could be
machined to the proper size for the bearings and then the bearings were press fit into the engine
mounts. The water-jetted components can be seen in Figure 27.
Figure 27: Water Jetted Engine Mount Components

47
The steel tubing component of the engine mounts was built by cutting an AISI 4130 Steel tube to
the width of the chassis at the main roll hoop and notching it to fit around the chassis tubes. It
was then welded to the chassis. Then the two vertical pieces were cut to length to mount to the
front mounting points of the engine. They were welded to the horizontal crossbeam mentioned
previously. Finally a horizontal tube was cut to the length of the distance between the two front
mounting points of the engine and welded to the vertical pieces.
Engine Mount Conclusions
There were three primary reasons for redesigning the engine mounts. The first of these reasons
was to create more space between the seat and the engine. This was accomplished with the
engine being two inches further back than the 2012 car. The second of these reasons was to add
more support to the rear suspension. There was some concern with the strength of the rear sub
frame through finite element analysis, and to fix this lack of rigidity the engine mounts were
designed to add vertical support to the sub frame. The engine mounts were designed to attach to
the sub frame and also support any loads that may be exerted from the sub frame. Finally, the
engine mounts were designed to contain to jackshaft to transfer the engine power to the drive
sprocket. It was important to account for the precision of press fit bearings as well as making
sure that the CVT secondary and primary would line up properly as well as the jackshaft
sprocket and the drive sprocket.
All of the goals stated above were accomplished with the redesign of the engine mounts. The
redesign of the engine mounts made it significantly easier to package the rear end and allowed it
to be more balanced. The only negative impact of redesigning the engine mounts was the
increase of weight from the old engine mounts to the new. Adding the extra support for the rear
sub frame allowed no room for weight to be taken out of the engine mounts. Over all the engine
mounts weigh more (7.26lb), but the gain in adding an independent rear suspension is much
greater than gaining 3.43lb. in the engine mounts.
Rear Suspension
2012 Vehicle’s Suspension Characteristics
The 2012 vehicle utilized a swing axle rear suspension and used no differential. The goals of this
original design were to maximize mechanical simplicity, minimize cost, and minimize vehicle
weight. However, a swing axle design suffers from poor handling characteristics due to large
jacking forces, uncontrollable camber gain, and axle hop. The swing axle’s large amount of
unsprung mass also inhibited the suspension’s movement due to inertial forces. At the Michigan
Formula SAE competition in May 2011, this same rear suspension was used on WPI’s Formula

48
SAE car. During this competition the design judges criticized the swing axle for providing sub-
par handling characteristics without significantly reducing overall vehicle weight. Due to the
major drawbacks of the 2012 vehicle’s swing axle, we determined that there is more potential
performance to be gained by improving the rear suspension than in the front. In order to best use
the team’s limited resources, our scope was limited to investigating improvements for the rear
suspension only.
During the project’s baseline testing and evaluation the 2012 FSAE car exhibited under-steer on
turn in and snap over-steer through midcorner. These observations, indicative of poor handling
performance, were substantiated by below average lap times during skid-pad testing. Drivers also
noted that quick under-steer to over-steer transitions made the vehicle difficult to control. This is
undesirable as an FSAE car is to be marketed to the nonprofessional driver, individuals who do
not possess precise and consistent vehicle control skills. These characteristics were used in
analyzing the existing rear suspension and developing goals for a new design.
Suspension Design Goals
The primary objective for the new rear suspension design was to improve the vehicle’s
performance in FSAE Michigan competition events, both static and dynamic. The primary goal
in achieving this was to make the vehicle more intuitive to operate for nonprofessional drivers.
This would better match the needs of our marketed buyer while improving a racer’s
competitiveness in dynamic events. This would, thereby, increase performance in both static and
dynamic events. The team also sought to maintain serviceability, minimize overall vehicle
weight, and allow for simple adjustability of suspension dynamics.
Investigating Solid-Axle Rear Suspension Solutions
The team first investigated a minor redesign of the existing solid-axle type suspension. Such a
design could potentially avoid increasing vehicle weight and mechanical complexity while
retaining existing suspension pick-up points. Doing so would increase manufacturability and
decrease cost. A solid-axle would also not require a rear sub-frame, a component which would
have been necessary were an independent suspension implemented. In light of the potential
benefits of a solid-axle design, an analysis of such suspension designs was completed. Three
solid-axle suspension types were considered based upon their ability to be packaged with the
car’s existing engine and frame. These suspension types are an improved swing-axle, a three link
with panhard bar, and a De Dion tube structure.

49
These designs were evaluated on the following criteria:
Unsprung weight
Overall weight
Cost
Independent suspension motion
Independent wheel speeds
Suspension types were evaluated both with and without the addition of a differential since
including this component could significantly impact a design’s functionality. Each design
parameter was given a weight between zero and one with the sum of their weights equal to one.
The suspension types were then ranked in each design parameter on a scale of one to five with
one being the worst and five being the best. To determine design rankings of unsprung and
overall weight, an estimation of the physical weight of each design was completed. This was
done using measured weight of a differential and 3D modeling of potential mounting links in
Solidworks. These estimated weights can be seen in Table 4 below. The lowest weight was then
designated with a ranking of five and the highest weight was defined as a ranking of one. Linear
interpolation defined values between these minimum and maximum weights. Other design
parameter rankings were estimated using material properties and known characteristics of
suspension types as described in publications such as Milliken Research Associates’ Race Car
Vehicle Dynamics6. Our evaluation of each design can be seen in Table 5 on the next page.
6 Milliken, William F., and Douglas L. Milliken. Race Car Vehicle Dynamics. Warrendale, PA,
U.S.A.: SAE International, 1995. Print.

50
Design Unsprung Weight (lb) Overall Weight (lb)
Swing Arm With Differential 46.00 46.00
Swing Arm With No Differential 38.00 38.00
Three Link With Differential: Spring above axle 46.80 56.80
Three Link With Differential: Spring above lower control arm 49.80 49.80
Three Link With Differential: Pushrod/rocker to spring 46.80 48.80
Three Link With No Differential: Spring above axle 38.80 48.80
Three Link With No Differential: Spring above lower control arm 40.80 40.80
Three Link With No Differential: Pushrod/rocker to spring 38.80 40.80
De Dion Tube: Spring above axle 64.10 70.80
De Dion Tube: Spring above lower control arm 62.80 62.80
De Dion Tube: Pushrod/rocker to spring 60.80 62.80
Table 4: Estimated Solid-Axle Suspension Weights

51
Design Parameter Unsprung Weight
Overall Weight Cost
Vertical Wheel
Motion Independent Wheel Speeds
Weighted Total
Value Weight 0.25 0.10 0.05 0.30 0.30 1.00
Swing Arm With Differential 3.77 4.03 4.00 1.00 5.00 3.35
Swing Arm With No
Differential 5.00 5.00 5.00 1.00 1.00 2.60
Three Link With Differential: Spring above axle 3.62 2.70 4.00 5.00 5.00 4.38
Three Link With Differential:
Spring above lower control arm 3.15 3.55 4.00 5.00 5.00 4.34
Three Link With Differential:
Pushrod/rocker to spring 3.62 3.66 4.00 5.00 5.00 4.47
Three Link With No
Differential: Spring above axle 4.85 3.66 5.00 5.00 1.00 3.63
Three Link With No Differential: Spring above
lower control arm 4.54 4.64 5.00 5.00 1.00 3.65
Three Link With No Differential: Pushrod/rocker to
spring 4.85 4.64 5.00 5.00 1.00 3.73
De Dion Tube: Spring above axle 1.00 1.00 3.00 5.00 5.00 3.50
De Dion Tube: Spring above
lower control arm 1.42 1.97 3.00 5.00 5.00 3.70
De Dion Tube: Pushrod/rocker
to spring 1.15 1.97 3.00 5.00 5.00 3.63
Table 5: Ranking of Solid-Axle Suspensions
This decision chart indicates that the most favorable solid axle suspension design is a three link
with differential and non-direct acting springs. However, modeling this type of system in
conjunction with the redesigned engine mounts presented major issues with packaging. The
upper control arm (third link) would interfere with the proposed exhaust design and a panhard

52
bar would interfere with the drivetrain. In addition, the team sought to reduce unsprung weight
through rear suspension design. However, any solid-axle design with a differential would
increase unsprung weight by at least 8.50lb (weight of the differential). As a result, the team
decided to further investigate only independent rear suspension designs.
Investigating Independent Rear Suspension Solutions
In an effort to minimize unsprung weight and resolve packaging issues the group analyzed the
design implications of independent rear suspension designs. Minimizing unsprung mass was a
key objective in the design since the resulting weight creates additional inertial damping effects.
Independent suspension designs would all allow the differential to be mounted as sprung rather
than unsprung weight, which is, therefore, desirable. Specifically, mounting a differential to the
chassis would remove approximately 8.50lb of unsprung weight from the rear suspension, as
mentioned in the previous section. Since at least a portion of the existing suspension pickup
points could be used, the only additional weight in this design would be due to differential
mounting. However, the weight of links large enough to mount the differential would weigh less
than 10lbs, as calculated using a SolidWorks parametric 3D model.
Since the primary goal of the rear suspension design was to create a more controllable vehicle,
the team also analyzed an independent suspension’s ability to produce consistent handling
characteristics that promote tire grip and vehicle stability. Consistency would make vehicle
behavior more predictable to the nonprofessional driver. Improved rear tire grip and stability
raise the vehicle’s potential performance during dynamic events. Unlike the existing swing-axle
and other non-independent suspensions, all independent rear suspension designs allow the
wheels to move independently. This allows the rear tires to gain and lose camber regardless of
the other’s motion. During cornering, the car’s chassis will roll, unloading the inside tire and
loading the outside. With a non-independent suspension this will cause both wheels to lean
towards the outside of the car relative to the corner. This will induce unnecessary negative
camber on the inside tire, which is now unloaded, and induce positive camber on the outside tire.
Inducing positive camber on the outside tire reduces grip by causing the tire to be at a non-
perpendicular angle to the track. Rough track surfaces have a similar effect on handling
dynamics due to the loading and unloading of wheels during suspension jounce and rebound.
The ability to independently control tire camber, then, is a major benefit of implementing an
independent rear suspension.
This project investigated possible semi-trailing arm and unequal length control arm (double A-
arm) rear suspension designs. Other designs, such as a five link, were not included in the study
because they require additional links, ball joints, and space. These systems would increase both

53
cost and mechanical complexity, therefore not meeting the performance specifications and
objectives laid out in the Suspension Design Goals section above. In contrast, common semi-
trailing arm and double A-arm designs use only a few links and offer simple, low cost solutions.
Semi-trailing Arm
A semi-trailing arm system consists of one link at each wheel. Because of this reduced number
of links, cost and mechanical complexity is kept to a minimum. The cost of this design is roughly
equivalent to a 3-link or swing axle suspension and the overall weight would only be increased
by approximately 10.00lb, as discussed in the previous section. A semi-trailing arm design could
also have utilized the existing suspension pickup points on the chassis with the use of small
adapter plates, as seen in Figure 28 below. This would further reduce cost as the chassis would
not have to be modified to be compatible with the new suspension.
A semi-trailing arm is often considered an evolution of the swing-axle suspension. As such, it
offers significant improvement in handling over a solid-axle suspension. A semi-trailing arm
allows each wheel to gain camber independently, which increases traction on the inside tire
during cornering. This design would also reduce jacking forces, since the roll center could be
positioned much lower to the ground. However, since a semi-trailing arm uses only one link,
camber gain between droop and bump cannot be controlled independently. This means that if the
car gains one degree of negative camber for one inch of travel in bump, the car will also gain one
degree of positive camber in droop. This is undesirable because positive camber decreases the
size of a tire’s contact patch both in a straight line and in a corner. Negative camber is desired
because it allows the tire to remain perpendicular with the ground due to the chassis’ body roll.
In designing a proposed semi-trailing arm rear suspension the front view swing arm length was
manipulated until an acceptable camber gain rate was achieved. The camber gain rate on a semi-
trailing arm is defined as:
Equation 6
With an instant center which is 70.89 in from the wheel and a front view swing arm length of
68.30in, the camber gain rate was calculated as:
Equation 7
= 0.83 deg/in

54
The Formula SAE regulations state that the suspension must provide 1 inch of suspension travel
in droop and 1 inch in bump. With a total of 2 inches of suspension travel, the camber gained
then is:
Equation 8
= 2.00 in x 0.83 deg/in
= 1.68 deg
Therefore, this semi-trailing arm design would provide 1.70deg in camber change over our entire
suspension travel. Since the typical drop off of lateral force gain per degree in camber of these
tires is between 1.50deg and 2.00deg, this is an acceptable amount of camber gain.
Once the camber gain was determined, the team adjusted the vertical pick up point of the outside
arm until a low instant center height was achieved. The instant center’s height was determined by
projecting the front view swing arm length and extending the trailing arm through its pick up
points, as seen in Figure 28. The intersection of these two projected lines is the instant center’s
location in the front view. The height of the instant center primarily determines the amount of
scrub produced in the suspension. An instant center above ground will produce scrub out on
jounce and an instant center below ground will produce scrub in on jounce. The minimum
amount of scrub is produced when the instance center intersects in the ground plane. By staying
above ground scrub-out will be created rather than scrub-in. Scrub-out increases the rear track of
the vehicle on jounce which is more desirable than making the distance between the rear wheels
more narrow. Therefore, the goal was to achieve a low instant center which does not cross the
ground plane. With one side of the trailing-arm 0.25in lower than the other, an instant center
height of 0.74in above ground was produced. This small distance will produce a negligible
amount of scrub.
These characteristics define the mounting points of the semi trailing arm. The final proposed
shape is shown in Figure 28. This consists of the trailing arm and two adapters which allow it to
mount to the existing pick up points on the chassis.

55
Figure 28: Semi-Trailing Arm Mounting Points (Material Between Points for Visual Purposes Only)
Figure 29: Determining Semi-Trailing Arm Instant Center Location

56
Unequal Length Control Arm (Double A-Arm)
Unequal length control arm suspensions consist of two primary links at each wheel. This
includes an upper and lower control arm. The group decided to investigate the use of unequal
length control arm designs because, unlike a semi-trailing arm, this allows for independent
control of camber gain in bump and droop. Such a suspension design would not utilize the
existing pick up points on the chassis. Rather, the control arms would attach to a sub-frame that
also supports a differential, springs, and shocks.
The group developed an unequal length control arm suspension by determining the necessary
lengths and positions of each control arm. In order to increase vehicle stability during suspension
travel, the lower control arm should be as long as possible. Packaging restraints created by the
mounting of the differential and other drivetrain components requires that the lower control arm
be no longer than 18.00in. Therefore, an 18.00in lower control arm was chosen. The lower
control arm was angled parallel to the ground plane to ensure a low roll center, which reduces
jacking forces on each wheel. The outer pickup points of both upper and lower control arms were
defined by the spacing between upper and lower ball joints. The distance between these ball
joints was made as large as possible in order to reduce the load on each control arm. Due to the
size of the vehicle’s wheels, the distance between ball joints and the control arm’s outer
mounting points was defined as 8.00in. The lower control arm, then, was now fully defined with
a length, angle, and mounting point. Packaging restraints around the differential and the desired
camber gain determined the location of the upper control arm’s inner pickup point. It is desired
to gain negative camber under bump and reduce camber gain under droop. As such, the upper
control arm should be shorter than the lower. Practical mounting solutions for the upper control
arm allowed it to be 11.60in. When placed at a 15.00deg angle from horizontal, as shown in
Figure 30. This results in an upper control arm which is 64% the length of the lower. Milliken &
Milliken’s Race Car Vehicle Dynamics recommends a control arm length ratio of between 50%
and 80%.
Figure 30: Length of Control Arms

57
In addition, the position of the control arms as described results in a relatively short front view
swing arm length. As a result, a total of 3.84deg of camber change occurs over the suspension’s
two inch motion. Due to the difference in control arm lengths, this translates to -2.06deg of
camber in bump and +1.79deg of camber in droop, as seen in Figure 31. This allows the car to
gain negative camber as the suspension compresses through a corner, providing a larger contact
patch. Positive camber under droop is also significantly less than the negative camber gained in
bump. This helps prevent reduction of the contact patch as the suspension is unloaded. The
instant center for this design was determined by the intersection of each projected control arm.
The roll center was then determined by projecting a line from the center of the contact patch
through the instant center. The intersection of this line and the vehicle’s center line defined the
roll center’s location. As seen in Figure 32, the resulting roll center is low, minimizing jacking
forces on suspension components. Figure 32 also shows an instant center which is close to the
ground but does not intersect the ground plane. A low instant center height reduces scrub and an
instant center above ground produces scrub out rather than scrub in. This characteristic increases
track width under jounce, thus producing more stable driving dynamics. The position of control
arms defined above then was considered desirable. The final unequal length control arm
suspension geometry can be seen mounted to the car in Figure 33.
Figure 31: Camber Gain Under Bump and Droop
Figure 32: Location of Instant Center and Roll Center

58
Figure 33: Final Rear Suspension Geometry
Design Selection
The primary goal of the rear suspension redesign was to improve predictability of vehicle
dynamics to the driver. We also sought to improve general vehicle performance in static and
dynamic competition events by reducing weight and minimizing cost.
A double-A arm type suspension offers camber control under both compression and droop that is
independent between the two rear wheels. This allows the tire’s contact patch to be fully utilized
during cornering as chassis roll causes the vehicle loads to act at a non-perpendicular angle to the
track. As a result, rear tire grip is approximately linear and limited only by tire performance. A
double A arm suspension also offers adjustability of the lower and upper control arms. By
changing these lengths the total amount of camber gained through suspension travel can be
increased or decreased, depending on track conditions.
Semi trailing arms would be able to utilize half of the existing rear suspension pick up points. As
a result, this design could potentially use a smaller rear sub-frame than a double A-arm system.
However, adapting semi-trailing arms to the existing chassis would require additional sub-frame
members to locate shocks, springs and the differential. As a result, a semi-trailing arm
suspension would require a similarly sized rear sub-frame as a double wishbone suspension. This
negates any weight advantage a semi-trailing arm design may have over a double wishbone. In a
semi-trailing arm design the wheel also pivots about a fixed axis. This does not allow control of
camber in both compression and droop, thereby making the vehicle more difficult to drive. Such
a design would create a large amount of positive camber under droop, reducing vehicle stability
and making driving dynamics unpredictable.
Based on this analysis, the team identified a double wishbone rear suspension as the most
beneficial suspension design. This is because such a design offers increased vehicle stability and
predictable handling characteristics without suffering from additional sprung or unsprung mass.

59
Shock Actuation
Both pushrod and direct acting rear shock actuation methods were explored. Direct acting shock
actuation would locate the bottom of the shock on the lower control arm. The lower control arm
extends 18.00in away from the rear sub-frame. Due to this large distance the shock’s top mount
would either be located far from the sub-frame or induce an equally large moment on the lower
control arm. A larger than necessary moment induced by the shock would require a stronger
control arm to prevent excessive stress and compliance. This would be very undesirable as a
stronger control arm would require more mass and thus increase the vehicle’s unsprung weight.
However, reducing this moment by mounting the shock close to the upright would also require
additional aluminum tubing to locate the top of the shock. Doing so would avoid adding
unsprung weight but at the expense of overall vehicle weight. By implementing a push rod
system the springs and shocks could be located within the sub-frame. This allows the shocks to
be directly mounted to the portion of the sub-frame that locates the rear differential, as seen in
Figure 34. Therefore, a push rod system would require less material than a direct acting system
as it is not necessary to extend shock mounts out toward each rear wheel. By reducing the
quantity of necessary tubing vehicle weight and cost can be minimized and manufacturability
can be increased. Similar motion ratio curves could be achieved with both direct acting and
pushrod systems. As such, the team decided to pursue a pushrod type solution due to the design’s
unsprung and overall vehicle weight benefits.
Figure 34: Pushrod Actuated Shocks Mounted Within Rear Sub-Frame
Motion ratios of the rear suspension were investigated to optimize the performance of our rear
shocks. The suspension’s motion ratio is defined by:
Equation 9
The vehicle’s wheel travel is determined by FSAE regulations which state that the suspension
must be capable of traveling 1.00in in compression and 1.00in in droop. The maximum travel of

60
the car’s existing Cane Creek shocks is also 2.25in. An acceptable motion ratio then, must
comply with these limiting conditions and cannot be lower than 0.89. A low motion ratio also
allows frictional forces within the shock’s seals to significantly impact the shock’s resistance to
motion. Additionally, most shocks suffer from poor performance and reduced durability above
motion ratios of 2.00. To promote consistent damping effectiveness and shock durability, we
sought to generate a motion ratio between 1.00 and 2.00. We also sought to minimize an increase
in motion ratio as the suspension compresses since this produces a digressive effective spring
rate. This is a trait that would cause the suspension’s behavior to be non-linear and therefore be
unpredictable to the driver.
The team’s motion study was performed through the manipulation of 3D sketches and design
tables in Solidworks. By measuring the distance between the shock’s rocker and sub-frame
mounts we were able to record shock travel. Likewise, wheel travel was measured respective to a
ground plane with suspension compression indicating a positive displacement and zero travel
measured at ride height. Suspension droop, then, is represented by negative wheel travel.
Packaging constraints determined the location of the shocks and the length and position of the
pushrod. As a result, final adjustments to the motion ratio were determined through the rocker’s
shape and position. The average motion ratio over the suspension’s travel was produced by
positioning the rocker’s pivot nearer to the wheel than the shock, generating a lever effect. The
net change in motion ratio was controlled through the height of shock and pushrod mounts on the
rocker. As a result, these three points, the rocker’s pivot, pushrod mount, and shock mount,
determined the general shape of the rocker, as seen in Figure 35. The resulting motion ratio curve
can be seen below in Figure 36. As seen in this graph, the motion ratio stays above 1.00 and
below 2.00 while remaining extremely linear under droop and somewhat linear under
compression. This design then, meets the requirements outlined above.
Figure 35: Rocker Shape - (Left to Right) Pushrod Mount, Pivot, Shock Mount

61
Figure 36: Motion Ratio Over Wheel Travel – Progressive & Approximately Linear
1.15
1.2
1.25
-1 -0.5 0 0.5 1
Motion Ratio & Wheel Travel
Motion Ratio
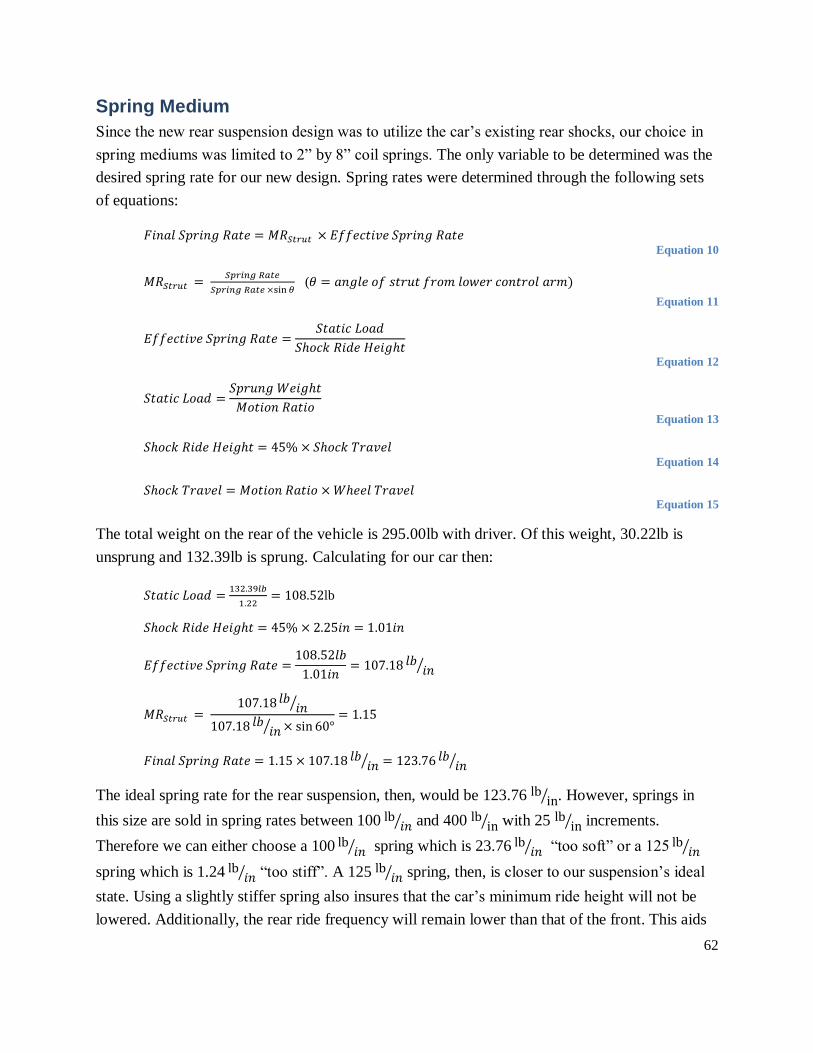
62
Spring Medium
Since the new rear suspension design was to utilize the car’s existing rear shocks, our choice in
spring mediums was limited to 2” by 8” coil springs. The only variable to be determined was the
desired spring rate for our new design. Spring rates were determined through the following sets
of equations:
Equation 10
(
Equation 11
Equation 12
Equation 13
Equation 14
Equation 15
The total weight on the rear of the vehicle is 295.00lb with driver. Of this weight, 30.22lb is
unsprung and 132.39lb is sprung. Calculating for our car then:
lb
⁄
⁄
⁄
⁄
⁄
The ideal spring rate for the rear suspension, then, would be 123.76 ⁄ . However, springs in
this size are sold in spring rates between 100 ⁄ and 400 ⁄ with 25 ⁄ increments.
Therefore we can either choose a 100 ⁄ spring which is 23.76 ⁄ “too soft” or a 125 ⁄
spring which is 1.24 ⁄ “too stiff”. A 125
⁄ spring, then, is closer to our suspension’s ideal
state. Using a slightly stiffer spring also insures that the car’s minimum ride height will not be
lowered. Additionally, the rear ride frequency will remain lower than that of the front. This aids
63
the front wheels’ transient response, allowing the driver to more easily control the car’s “turn in”
motions and perform mid-corner corrections. As a result, the team decided to utilize 125 ⁄
steel coil springs in conjunction with the existing Cane Creek Double Barrel shocks.
Manufacturing
The rear sub-frame and suspension components were designed to be simply manufactured, with
geometries determined by differential and control arm locations. This was to both aid in
concurrent production and to increase the vehicle’s performance in static FSAE events.
Manufacturability is a judged criterion for the Design static event in the FSAE Michigan
competition. As such, increasing the manufacturability of the rear sub-frame and suspension
improved the vehicle’s performance for competition events.
The sub-frame was designed for and manufactured from 6061-T6511 aluminum square tubing.
This tubing was CNC notched and cut to length within 0.0005in tolerance. The sub-frame was
then jigged and fully TIG welded. The control arms were designed for and manufactured from
4041 Chromoly steel, which was cut, notched, and fully TIG welded for strength. All of the
welded components were outsourced to be heat treated. This was done to relieve internal stresses
generated during the welding process. Lastly, the rear uprights and hubs were CNC machined
from of solid pieces of 6061-T6511 aluminum.
Conclusions
The rear suspension design sought to improve the vehicle’s performance in FSAE Michigan
competition events. To achieve this, the design sought to accomplish four goals. These were to
provide more intuitive vehicle operation, to maintain serviceability, to minimize overall vehicle
weight, and to allow for simple adjustability of suspension dynamics.
Intuitive Vehicle Operation
Intuitive vehicle operation was achieved by incorporating both independent suspension
geometries and a differential into the design. A double A-arm suspension allowed the rear tires’
motion, and specifically camber, to be completely independent of one another. This design
offered up to -2.00 deg of camber throughout full wheel travel. This maintained rear tire grip
during chassis roll and during rear suspension travel, allowing the driver to remain in control of
the vehicle. Replacing a swing-axle with a sub-frame and independent suspension also reduced
unsprung weight by approximately 30.00lb. This minimized the inertial damping effects due to
suspension mass and thereby increased vehicle stability on unsmooth driving surfaces. Doing so
also provided room for driver error by allowing quicker changes in direction. As a result, over-
steer and under-steer can now be more easily controlled through mid-corner steering and throttle

64
input corrections. Allowing for such corrections permits non-professional drivers to produce
competitive cornering performance.
The addition of a differential allowed the rear tires to rotate at different rates while the vehicle
cornered. By allowing the outside wheel to rotate faster than the inside, under-steer was reduced
during corner entry, improving turn in response. Doing so allows the driver to make mistakes,
such as missing braking points and following an un-ideal racing line, without detrimentally
affecting lap times. This compliance for driver error maximized the potential for a non-
professional racer to be competitive in the autocross and endurance events.
Serviceability
Serviceability of the vehicle was maintained by implementing a removable rear sub-frame into
the rear suspension. The sub-frame was attached to the chassis using a minimal number of
mounting points and standard removable hardware. Once the drive chain is separated from the
sprocket only six hex bolts must be removed to separate the sub-frame and chassis, allowing for
quick and easy disassembly for maintenance and repairs.
Minimize Overall Weight
The vehicle’s overall weight was maintained despite the addition of a more complex suspension
geometry and differential. The rear sub-frame, differential, and suspension are approximately
equal in weight to the swing-axle they replaced. This was achieved by utilizing an aluminum
sub-frame, tubular control arms, and a compact differential. The result is a rear suspension which
offers improved handling characteristics while minimizing overall vehicle weight.
Adjustability
The team intended to add adjustability to the rear suspension design by utilizing adjustable
length lower control arms. The lower control arms would extend by several inches, offering up to
-3.00deg of static negative camber. This would allow the driver to optimize static camber
settings during competition, increasing performance potential for the acceleration, autocross,
endurance, and skid-pad events. However, the team decided that the advantages gained by
producing adjustable control arms would not be justified by the resulting compromises in
manufacturability, cost, and suspension geometry. Consequently, adjustable lower control arms
were not produced. The rear suspension design retained the ability to adjust the shock’s rebound
and compression damping rates and to physically replace springs. This was achieved by using
dual-barrel shocks that support a standard 2.00in by 8.00in spring.
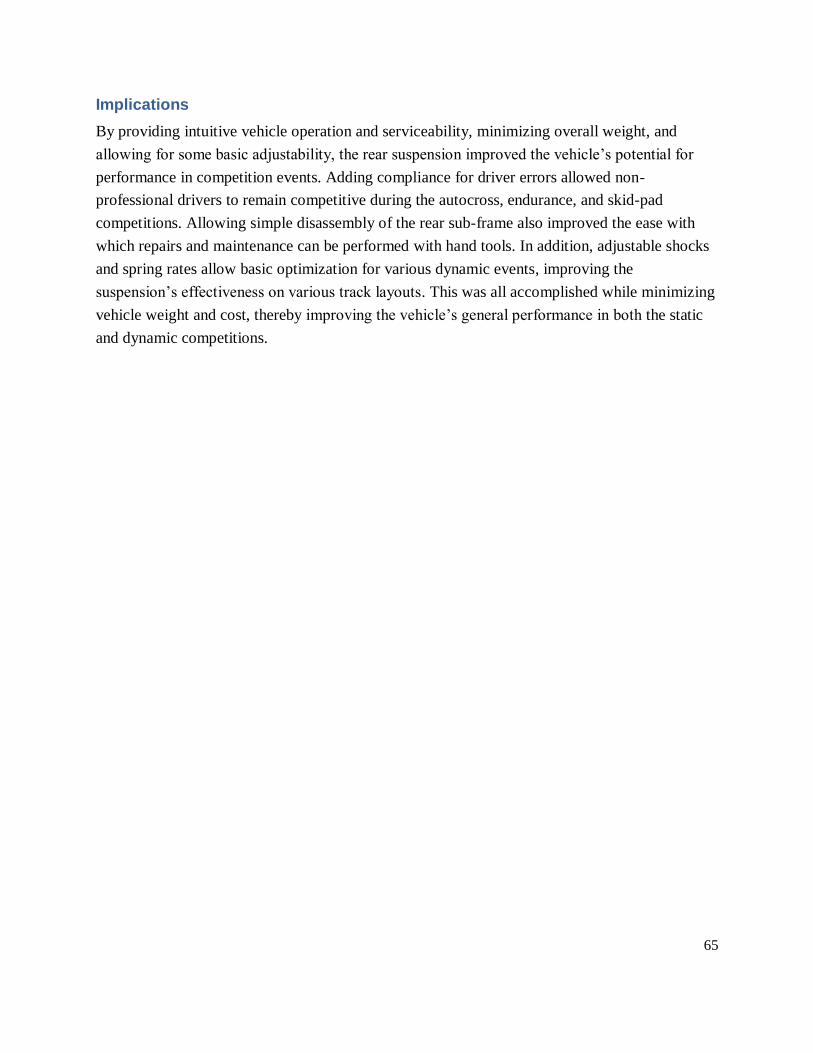
65
Implications
By providing intuitive vehicle operation and serviceability, minimizing overall weight, and
allowing for some basic adjustability, the rear suspension improved the vehicle’s potential for
performance in competition events. Adding compliance for driver errors allowed non-
professional drivers to remain competitive during the autocross, endurance, and skid-pad
competitions. Allowing simple disassembly of the rear sub-frame also improved the ease with
which repairs and maintenance can be performed with hand tools. In addition, adjustable shocks
and spring rates allow basic optimization for various dynamic events, improving the
suspension’s effectiveness on various track layouts. This was all accomplished while minimizing
vehicle weight and cost, thereby improving the vehicle’s general performance in both the static
and dynamic competitions.

66
Packaging and Ergonomics The packaging sub-group of the 2013 Formula SAE MQP was responsible for improving driver
ergonomics, increasing serviceability, and reducing overall vehicle weight. To accomplish this,
the pedal plate was redesigned to reduce deflection and relocate the brake pedal for improved
ergonomics. A CAD model has been created based on an existing assembly of the 2012 car. This
model has aided the packaging of various vehicle components by providing an accurate
representation of part locations.
The packaging sub-group will also be responsible for designing and manufacturing the 2013
vehicle’s body mounts, new seat, and fuel, oil, and coolant tanks.
Pedal Plate
Previous driver experience indicated that the 2013 Formula SAE vehicle’s pedal plate deflected
under hard braking. Since this plate locates both the brake and accelerator pedals, such a
deflection repositions driver controls. This makes operating the vehicle slightly awkward and
decreases driver ergonomics.
Figure 37: 2012 Pedal Plate FEA Deflections
One of the root causes of this deflection was the lack of fixed geometry in the design. The only
solid connection between the plate and the chassis were at four small tabs that are welded to the
chassis tubing. To remedy this, the previous design was altered to decrease this deflection. The
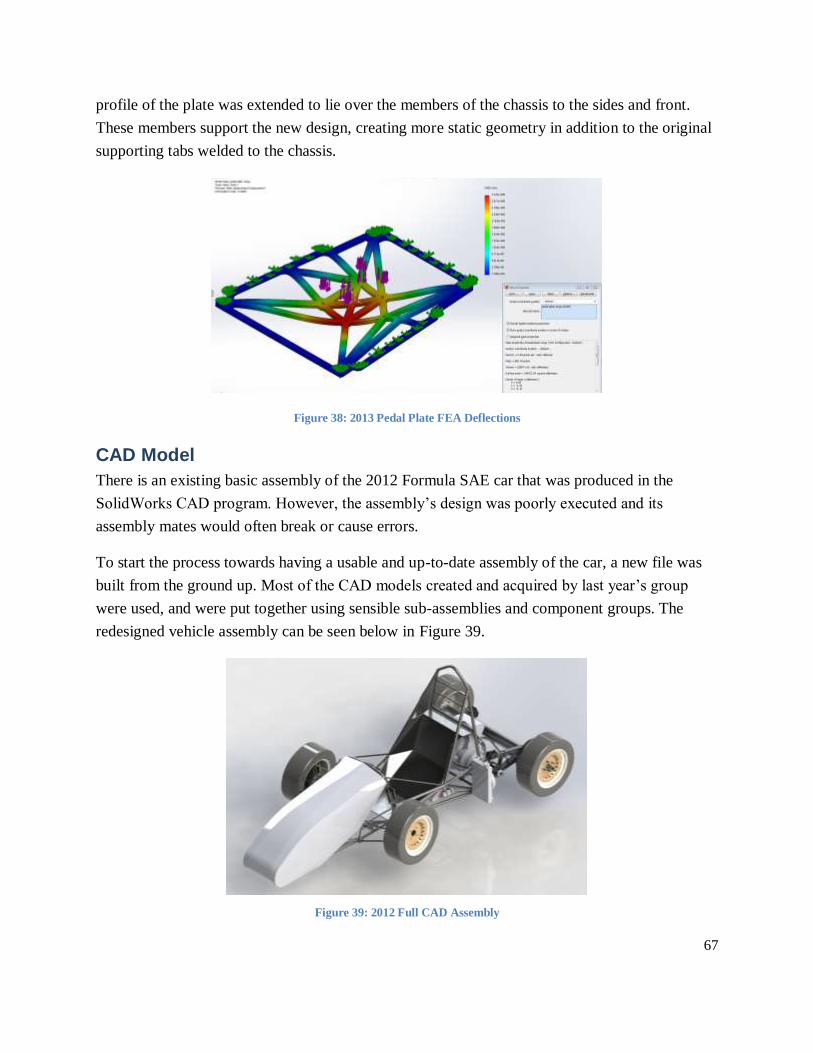
67
profile of the plate was extended to lie over the members of the chassis to the sides and front.
These members support the new design, creating more static geometry in addition to the original
supporting tabs welded to the chassis.
Figure 38: 2013 Pedal Plate FEA Deflections
CAD Model
There is an existing basic assembly of the 2012 Formula SAE car that was produced in the
SolidWorks CAD program. However, the assembly’s design was poorly executed and its
assembly mates would often break or cause errors.
To start the process towards having a usable and up-to-date assembly of the car, a new file was
built from the ground up. Most of the CAD models created and acquired by last year’s group
were used, and were put together using sensible sub-assemblies and component groups. The
redesigned vehicle assembly can be seen below in Figure 39.
Figure 39: 2012 Full CAD Assembly

68
Engine CAD
One of the models used in the car assembly last year that was of concern was that of the engine.
The model created by last year’s group was highly simplified in appearance and function, and
looked out of place among the level of detail in the rest of the assembly. In addition, it wasn’t
clear whether the mounting points were properly positioned. Because of this, engine model was
recreated from scratch, with a higher level of detail. A side-by-side comparison of the old model
and the recreation of the engine can be seen below in Figure 40 and Figure
41.
Figure 40: 2012 Engine Figure 41: 2013 Engine
Body Design
A key component used in ensuring efficient movement of air around the car as it travels is an
aerodynamic body kit. A body kit can contain any number of pieces, including an aerodynamic
nose cone, and a ‘wing’ in the front or rear to provide down-force. For our project, we decided
we would only be using a nose cone, which covers the impact attenuator in the front of the car,
and extends back to the driver cockpit.
Traditionally, the majority of teams entering cars in the FSAE competition choose to construct
the pieces of their body kit out of fiberglass. However, the process required to do this is quite
extensive, involving the creation of a positive form of the body’s shape, followed by a negative
that fits around this shape. The negative is then used in the forming and curing of the fiberglass
in the shape of the body.
Because of the difficulty and time involved with such a process, it was decided that an
alternative design for the nosecone was necessary.

69
The final design arrived upon involves the construction of a wireframe skeleton to act as the rigid
structure, rather than a resin-covered fabric. Formed in the desired shape of the body, the
skeleton is manufactured by bending, and welding sections pieces of 1/8” aluminum rod stock
together to achieve this shape.
Initially, the plan was to create the body in multiple sections, with one over the impact
attenuator, one over the driver’s legs, and one on each side of the driver’s legs. However, this
design was modified when it was determined that this modular design would be too difficult to
attach with the possibility for easy removal for judging. The final design has the same overall
shape of the previous, however the pieces will all be incorporated into a single large structure,
minimizing the number of places where it needs to be attached to the chassis of the car. The
wireframe can be seen in the model below, highlighted in red.
The other holes in the chassis frame not covered by this nose cone are separate from it for two
reasons. First, their removal is not necessary during judging at competition. Therefore, they can
be attached to the chassis separately. The convenient part about this is the fact that these
connections can then be essentially be permanent ones, which are easier to accomplish.
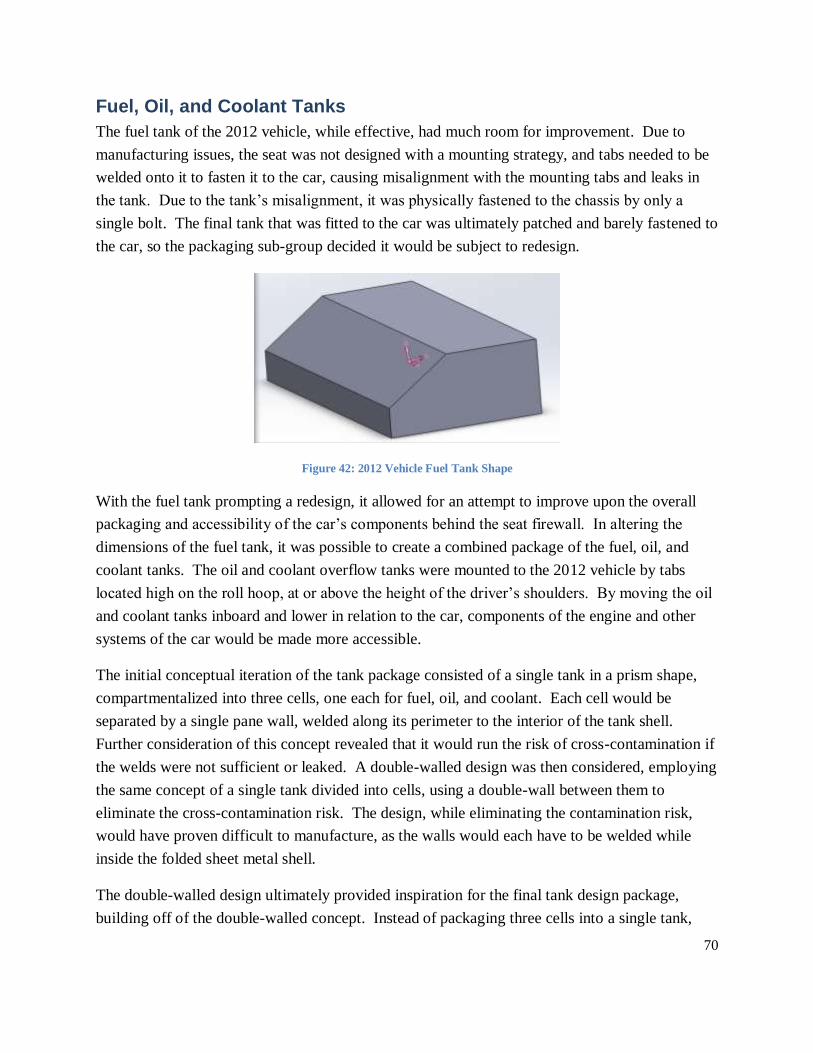
70
Fuel, Oil, and Coolant Tanks
The fuel tank of the 2012 vehicle, while effective, had much room for improvement. Due to
manufacturing issues, the seat was not designed with a mounting strategy, and tabs needed to be
welded onto it to fasten it to the car, causing misalignment with the mounting tabs and leaks in
the tank. Due to the tank’s misalignment, it was physically fastened to the chassis by only a
single bolt. The final tank that was fitted to the car was ultimately patched and barely fastened to
the car, so the packaging sub-group decided it would be subject to redesign.
Figure 42: 2012 Vehicle Fuel Tank Shape
With the fuel tank prompting a redesign, it allowed for an attempt to improve upon the overall
packaging and accessibility of the car’s components behind the seat firewall. In altering the
dimensions of the fuel tank, it was possible to create a combined package of the fuel, oil, and
coolant tanks. The oil and coolant overflow tanks were mounted to the 2012 vehicle by tabs
located high on the roll hoop, at or above the height of the driver’s shoulders. By moving the oil
and coolant tanks inboard and lower in relation to the car, components of the engine and other
systems of the car would be made more accessible.
The initial conceptual iteration of the tank package consisted of a single tank in a prism shape,
compartmentalized into three cells, one each for fuel, oil, and coolant. Each cell would be
separated by a single pane wall, welded along its perimeter to the interior of the tank shell.
Further consideration of this concept revealed that it would run the risk of cross-contamination if
the welds were not sufficient or leaked. A double-walled design was then considered, employing
the same concept of a single tank divided into cells, using a double-wall between them to
eliminate the cross-contamination risk. The design, while eliminating the contamination risk,
would have proven difficult to manufacture, as the walls would each have to be welded while
inside the folded sheet metal shell.
The double-walled design ultimately provided inspiration for the final tank design package,
building off of the double-walled concept. Instead of packaging three cells into a single tank,
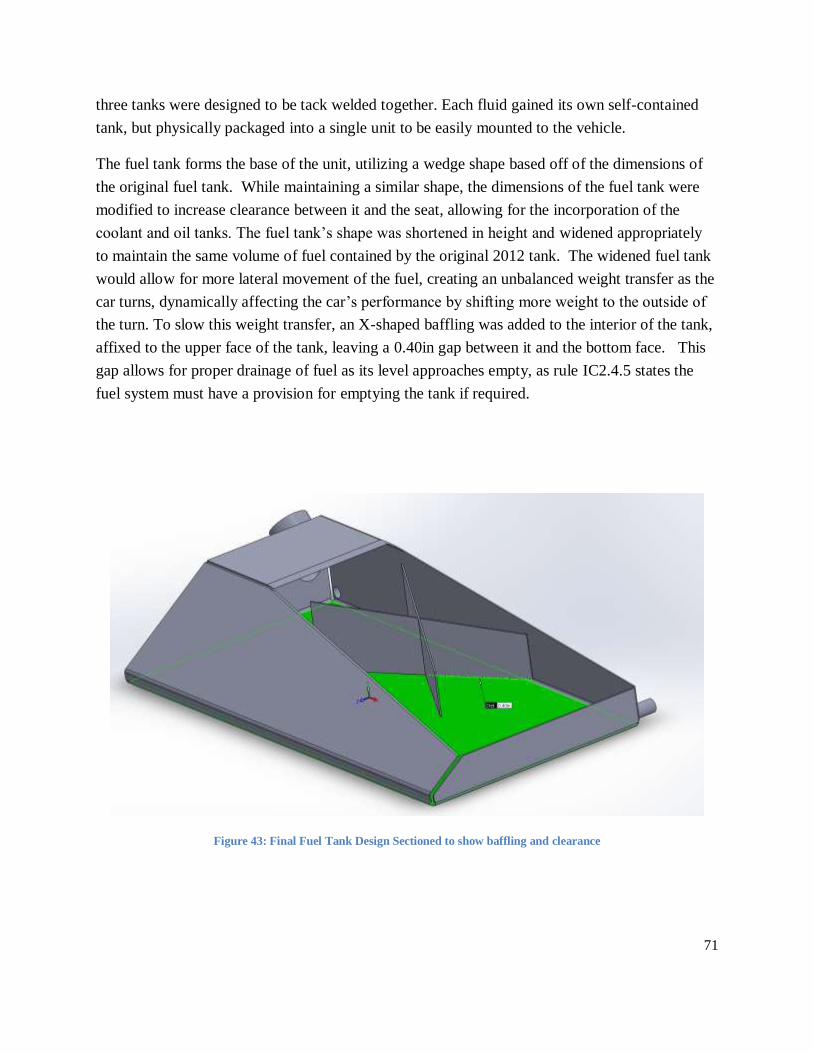
71
three tanks were designed to be tack welded together. Each fluid gained its own self-contained
tank, but physically packaged into a single unit to be easily mounted to the vehicle.
The fuel tank forms the base of the unit, utilizing a wedge shape based off of the dimensions of
the original fuel tank. While maintaining a similar shape, the dimensions of the fuel tank were
modified to increase clearance between it and the seat, allowing for the incorporation of the
coolant and oil tanks. The fuel tank’s shape was shortened in height and widened appropriately
to maintain the same volume of fuel contained by the original 2012 tank. The widened fuel tank
would allow for more lateral movement of the fuel, creating an unbalanced weight transfer as the
car turns, dynamically affecting the car’s performance by shifting more weight to the outside of
the turn. To slow this weight transfer, an X-shaped baffling was added to the interior of the tank,
affixed to the upper face of the tank, leaving a 0.40in gap between it and the bottom face. This
gap allows for proper drainage of fuel as its level approaches empty, as rule IC2.4.5 states the
fuel system must have a provision for emptying the tank if required.
Figure 43: Final Fuel Tank Design Sectioned to show baffling and clearance
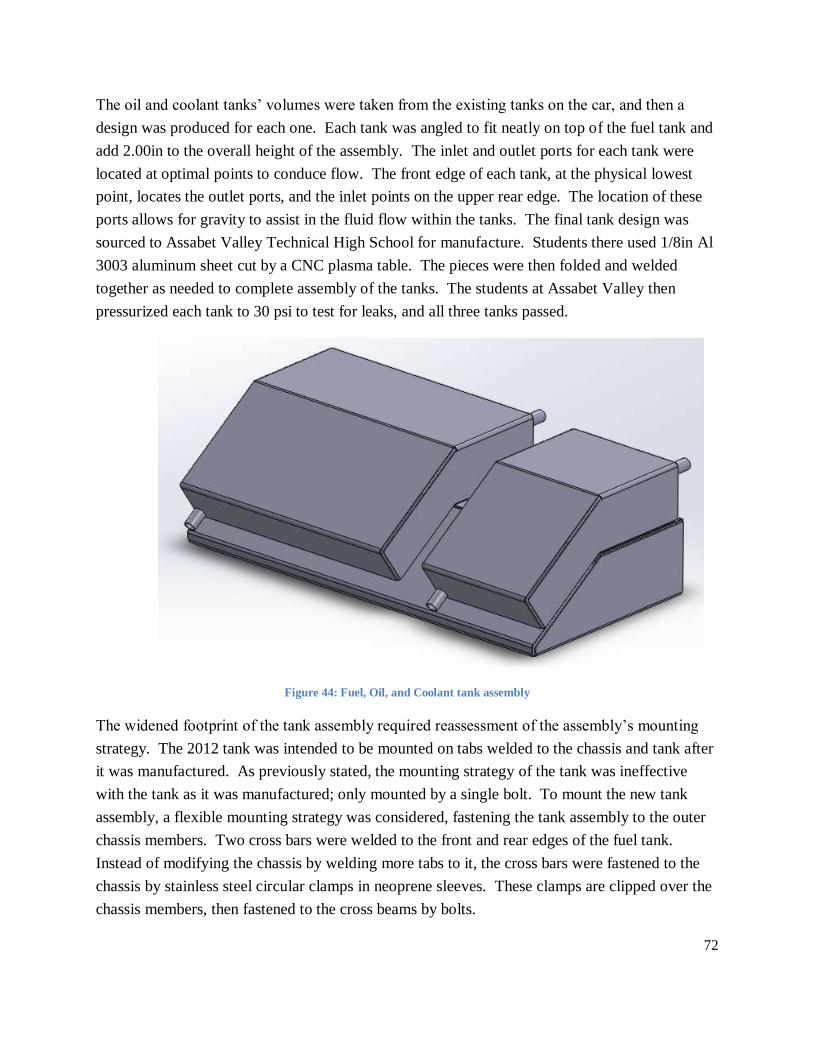
72
The oil and coolant tanks’ volumes were taken from the existing tanks on the car, and then a
design was produced for each one. Each tank was angled to fit neatly on top of the fuel tank and
add 2.00in to the overall height of the assembly. The inlet and outlet ports for each tank were
located at optimal points to conduce flow. The front edge of each tank, at the physical lowest
point, locates the outlet ports, and the inlet points on the upper rear edge. The location of these
ports allows for gravity to assist in the fluid flow within the tanks. The final tank design was
sourced to Assabet Valley Technical High School for manufacture. Students there used 1/8in Al
3003 aluminum sheet cut by a CNC plasma table. The pieces were then folded and welded
together as needed to complete assembly of the tanks. The students at Assabet Valley then
pressurized each tank to 30 psi to test for leaks, and all three tanks passed.
Figure 44: Fuel, Oil, and Coolant tank assembly
The widened footprint of the tank assembly required reassessment of the assembly’s mounting
strategy. The 2012 tank was intended to be mounted on tabs welded to the chassis and tank after
it was manufactured. As previously stated, the mounting strategy of the tank was ineffective
with the tank as it was manufactured; only mounted by a single bolt. To mount the new tank
assembly, a flexible mounting strategy was considered, fastening the tank assembly to the outer
chassis members. Two cross bars were welded to the front and rear edges of the fuel tank.
Instead of modifying the chassis by welding more tabs to it, the cross bars were fastened to the
chassis by stainless steel circular clamps in neoprene sleeves. These clamps are clipped over the
chassis members, then fastened to the cross beams by bolts.

73
Figure 45: View of tank assembly showing mounting rails & clips
Figure 46: Tank assembly mounted to chassis members

74
Seat
The vehicle’s seat serves two purposes, as a firewall between the driver and engine, and as a
support for seat inserts to accommodate multiple drivers. FSAE rules specify that the driver’s
cell (without inserts) must conform to regulations accommodating a 95th percentile adult male
with a racing helmet. Dimensions for a template fitting this description are specified by the
FSAE 2013 rules, hereafter referred to as “Percy”:
A circle of diameter 200.00mm (7.87in) will represent the hips and buttocks.
A circle of diameter 200.00mm (7.87in) will represent the shoulder/cervical region.
A circle of diameter 300.00mm (11.81in) will represent the head (with helmet).
A straight line measuring 490.00mm (19.29in) will connect the centers of the two 200 mm circles.
A straight line measuring 280.00mm (11.02in) will connect the centers of the upper 200 mm circle
and the 300.00mm head circle.
In designing the driver’s cell, Percy’s helmet must remain a minimum of 2.00 from the line
formed between the highest points of the front and rear roll hoops.
Figure 47: Percy positioning in 2012 seat
The seat of the 2012 car and the position of the engine left a small space between the seat and the engine
in which to create the intake manifold. As part of the team’s goals, the engine and packaging teams both
worked to create more space between the engine and the seat to allow for a new air intake design. The
new design of the seat needed to move the driver’s back forward to increase distance between the seat and
the engine while maintaining compliance with Percy’s required positioning. To achieve this, the bottom
floor of the seat was decreased in length, moving Percy’s hips forward. In doing so, Percy’s position
became more reclined, allowing for addition of two inches to the top shelf of the seat, moving the driver’s
position forward. Combined with the repositioning of the engine, these extra inches allowed for more
flexibility in the redesign of the intake manifold.

75
Figure 48: Percy in 2012 Seat
Figure 49: Percy in New Seat with Tanks Assembly.

76
Sway Bar
With the redesign of the vehicle’s rear suspension setup, a close look needed to be taken at the
front suspension as well. The major issue that arose with the front suspension, in converting the
rear setup from a solid axle to independent, was a loss of the total system’s roll stiffness about
the front-to-rear axis of the vehicle.
In the swing axle setup, the front suspension was fully independent, simply A-arms connected to
the springs and dampers, incorporating no components connecting the two sides of the vehicle.
The rear suspension made up for the lack of roll stiffness in the front suspension by having the
swing axle act as a sway bar for the entire car. The purpose of a sway bar is to slow down the
transfer of weight under cornering, so that the weight of the car can stay more evenly distributed
among all four wheels as its center shifts under directional changes. Due to the lack of roll
dynamics in the swing axle, it served this purpose by having both rear wheels directly connected
along the solid axle. The elimination of the swing axle setup in the rear eliminated the entirety
of the roll stiffness present in the 2012 vehicle’s suspension setup, prompting the need for a sway
bar to be incorporated into the front suspension’s setup.
The major problem presented by the incorporation of a sway bar into the existing front
suspension of the car was the desire of the group to maintain the existing geometry and
components of the 2012 vehicle’s setup. Ideally, a sway bar is incorporated into the
suspension’s linkage setup through a rocker arm or tie rods connecting to a straight bar, allowing
for purely torsional stress in the sway bar. Without redesigning the entire front suspension setup,
a sway bar needed to be designed around the existing suspension components.
Figure 50 Initial Sketch for Sway Bar Positioning With Front Suspension
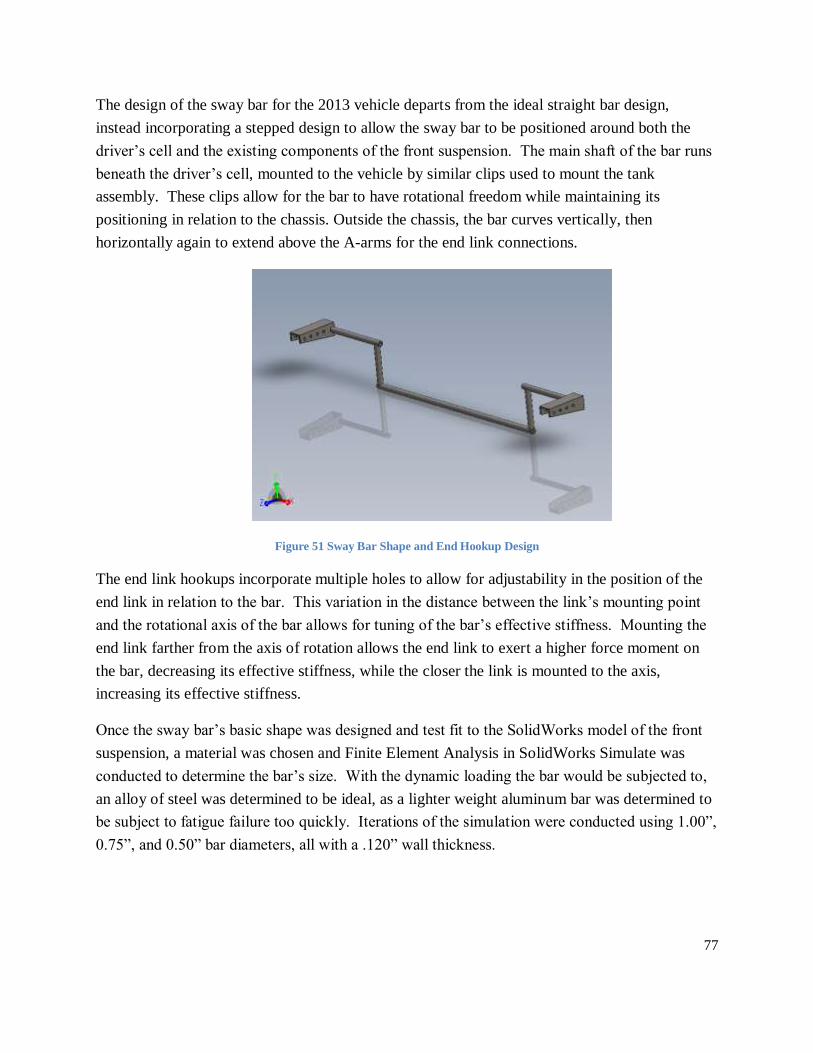
77
The design of the sway bar for the 2013 vehicle departs from the ideal straight bar design,
instead incorporating a stepped design to allow the sway bar to be positioned around both the
driver’s cell and the existing components of the front suspension. The main shaft of the bar runs
beneath the driver’s cell, mounted to the vehicle by similar clips used to mount the tank
assembly. These clips allow for the bar to have rotational freedom while maintaining its
positioning in relation to the chassis. Outside the chassis, the bar curves vertically, then
horizontally again to extend above the A-arms for the end link connections.
Figure 51 Sway Bar Shape and End Hookup Design
The end link hookups incorporate multiple holes to allow for adjustability in the position of the
end link in relation to the bar. This variation in the distance between the link’s mounting point
and the rotational axis of the bar allows for tuning of the bar’s effective stiffness. Mounting the
end link farther from the axis of rotation allows the end link to exert a higher force moment on
the bar, decreasing its effective stiffness, while the closer the link is mounted to the axis,
increasing its effective stiffness.
Once the sway bar’s basic shape was designed and test fit to the SolidWorks model of the front
suspension, a material was chosen and Finite Element Analysis in SolidWorks Simulate was
conducted to determine the bar’s size. With the dynamic loading the bar would be subjected to,
an alloy of steel was determined to be ideal, as a lighter weight aluminum bar was determined to
be subject to fatigue failure too quickly. Iterations of the simulation were conducted using 1.00”,
0.75”, and 0.50” bar diameters, all with a .120” wall thickness.
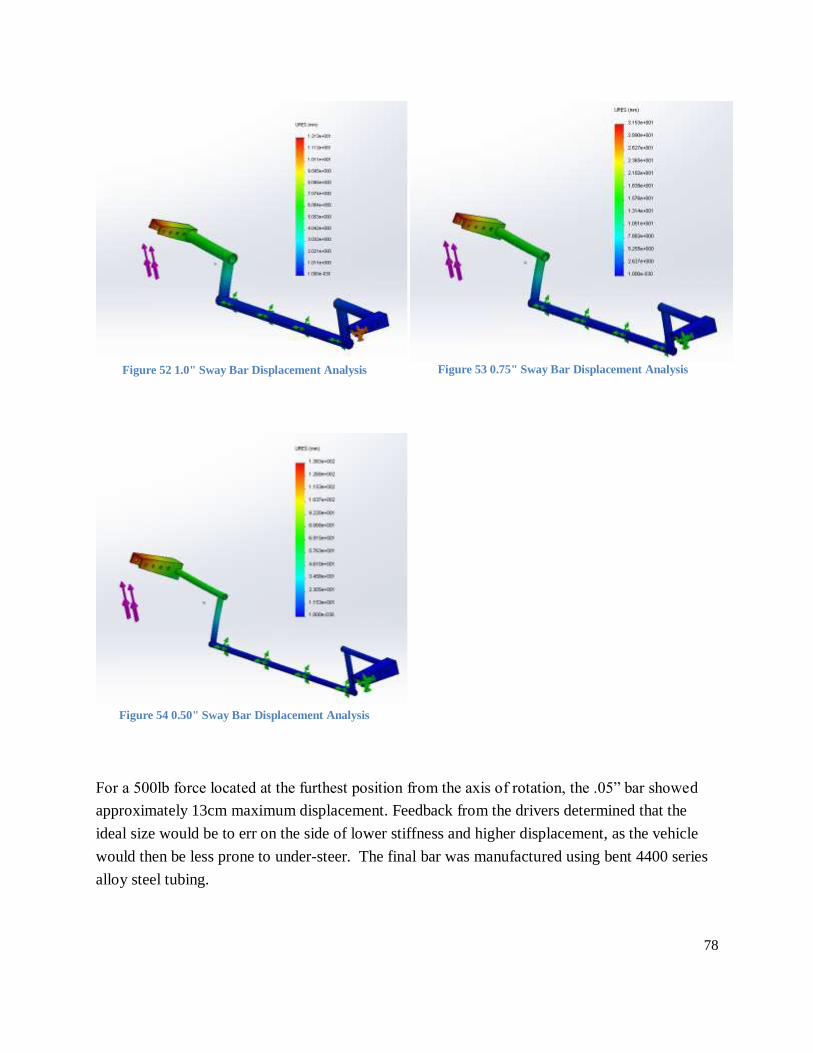
78
Figure 52 1.0" Sway Bar Displacement Analysis Figure 53 0.75" Sway Bar Displacement Analysis
Figure 54 0.50" Sway Bar Displacement Analysis
For a 500lb force located at the furthest position from the axis of rotation, the .05” bar showed
approximately 13cm maximum displacement. Feedback from the drivers determined that the
ideal size would be to err on the side of lower stiffness and higher displacement, as the vehicle
would then be less prone to under-steer. The final bar was manufactured using bent 4400 series
alloy steel tubing.

79
Conclusions The goal of this project was to optimize the 2012 FSAE car for performance in dynamic and
static FSAE Michigan competition events. This was accomplished by designing and
manufacturing new components and sub-systems for the existing car. By improving these sub-
systems and accomplishing the project’s objectives, the team was able to improve the car’s
performance for FSAE competition.
Intake, Exhaust, & Engine Position
This project developed an intake which utilizes a “supercharging” effect of pressure waves. This
design reduced the intake’s plenum size and includes a new restrictor and throttle body. By using
FDM rapid prototyping the new intake was manufactured to tighter tolerances than the previous
component. This manufacturing technique produced the intake runners to equal length within
.005in. Repositioning the engine also generated 2.00in of additional clearance between the
firewall and intake. This allowed the intake runners to be less severely angled than on the
previous component. Lastly, the intake’s weight was reduced from 3.32lb to 2.01lb, a 39%
reduction.
The redesigned exhaust system is packaged with the new engine position, rear drivetrain, and
rear suspension, thus accomplishing the design’s primary objective. The exhaust was also
designed to operate at 7500 engine RPM rather than the original 8000 RPM in order to increase
power production. The exhaust design utilizes mandrel bent tubing rather than a production
motorcycle exhaust. This allowed the system to meet FSAE sound requirements while reducing
weight compared to the previous component.
Rear Suspension
The rear suspension design increased maximum independent rear tire camber gain by -2.00deg.
The new rear suspension and drivetrain systems also reduced unsprung weight by 30lbs, a 79%
reduction. The rear drivetrain was manufactured to utilize a limited slip differential, allowing the
rear tires to spin at independent speeds while cornering. Lastly, by incorporating a removable
rear sub-frame, the vehicle’s original serviceability was maintained. The new rear suspension
provides intuitive vehicle operation and serviceability while reducing both sprung and unsprung
weight, therefore improving the vehicle’s performance in competition events.
80
Packaging and Ergonomics
This project manufactured a new pedal plate that relocated driver controls, allotting enough
additional space for a driver to rest their foot on the plate. The vehicle and engine were also
accurately modeled in SolidWorks, allowing other components to be designed and manufactured
with improved packagability. Such components included a vehicle body, driver’s seat, fluid
tanks, and a front sway bar. The design and production of these components allowed them to be
packaged with the new engine, intake, exhaust, and suspension positions. The fluid tanks were
also positioned under the driver’s seat, improving serviceability and lowering the vehicle’s
center of gravity.
Continuously Variable Transmission
This project originally sought to reduce the CVT’s engagement speed and lower the engine’s
operating speed. However, limited resources prevented the team from addressing these
objectives and placed the CVT outside of this project’s scope. It is recommended that future
teams address the design and tuning of the CVT in order to further improve the vehicle’s
performance in FSAE Michigan competition events.

81
References Aaen, Olav. Clutch Tuning Handbook. AAEN Performance 2007.
Blair, Gordon P. Design and Simulation of Four-stroke Engines. Warrendale, PA: Society of
Automotive Engineers, 1999
Bell, A. Graham. Performance Tuning in Theory and Practice. Sparkford, Yeovil, Somerset,
England: Haynes Pub. Group, 1981.
Bolles, Bob. Rearend Gear Guide- Gear Ratio Rationale: Choosing and Keeping the Right Gear
Ratio. Circle Track 2009.
http://www.circletrack.com/drivetraintech/ctrp_0904_gear_ratio_guide/viewall.html
Ceridono, Ron. Final Gear Ratios- Match Game: The Secret is Component Compatibility.
http://www.streetrodderweb.com/tech/0803sr_final_gear_ratios/viewall.html
Hayhoe, Koster, etc. A Proposal to Optimize CVT Performance of the Mini Baja Vehicle. Grand
Valley State university School of Engineering
2005.http://claymore.engineer.gvsu.edu/~previej/EGR_367/Final_Project.pdf
Potente, Daniel. "General Design Principles for an Automotive Muffler." (2005): n. pag.Day
Design.
Vizard, David. How to Build Horsepower. North Branch: SA Desgin
Willis, Christopher Ryan. A Kinematic Analysis and Design of a Continuously Variable
Transmission. Blacksburg, VA 2006. http://scholar.lib.vt.edu/theses/available/etd-
03312006-091805/unrestricted/Willis_Thesis.pdf

82
Appendix A: Baseline Testing
Baseline Endurance
Driver: Alessandro Driver: Dylan
Lap Number Lap Time Lap Number Lap Time
1 21.6 1 19.2
2 19.7 2 18.05
3 26.1 3 19.7
4 21.1 4 18.6
5 27.9 5 19.3
6 41.4 6 25.2
7 18.6 7 18.2
8 19.7 8 18.06
9 21.3 Avg time 19.5
10 26.4
11 19.7
12 27.6
13 19.4
14 19.7
15 18.9
16 56.3
17 18.5
18 26.9
19 18.1
20 22.5
21 19.2
22 18.4
23 18.8
24 21.3
25 29.3
26 19.8
27 18.3
28 18.8
29 19.3
30 18.6
Avg time 23.1

83
Table 6: Endurance Baseline Testing Results
Baseline Acceleration
Lap Time(s)
1 4.73
2 6.03
3 5.28
4 5.85
5 5.38
6 5.24
7 5.17
8 5.12
9 5.23
10 5.29
11 5.43
12 5.12
13 5.34
14 5.51
15 5.27
16 5.38
17 4.26
18 5.26
Average 5.27
Table 7: Acceleration Baseline Testing Results
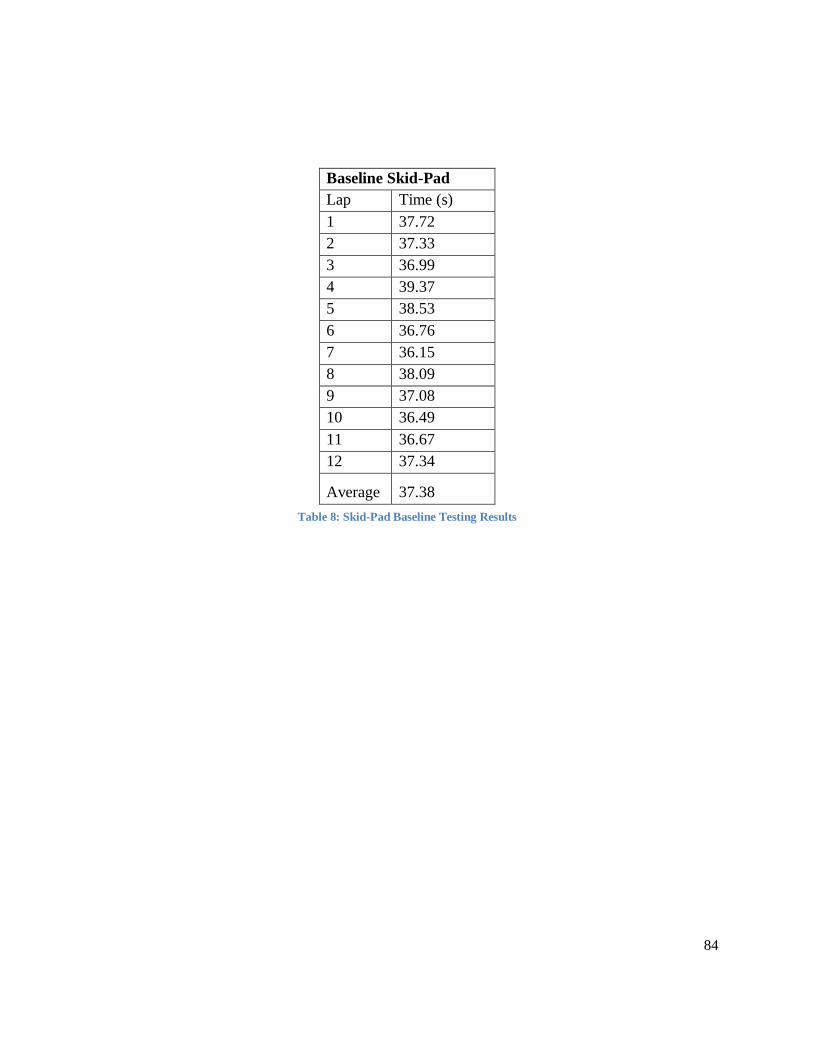
84
Baseline Skid-Pad
Lap Time (s)
1 37.72
2 37.33
3 36.99
4 39.37
5 38.53
6 36.76
7 36.15
8 38.09
9 37.08
10 36.49
11 36.67
12 37.34
Average 37.38
Table 8: Skid-Pad Baseline Testing Results

85
Appendix B: Intake Calculations
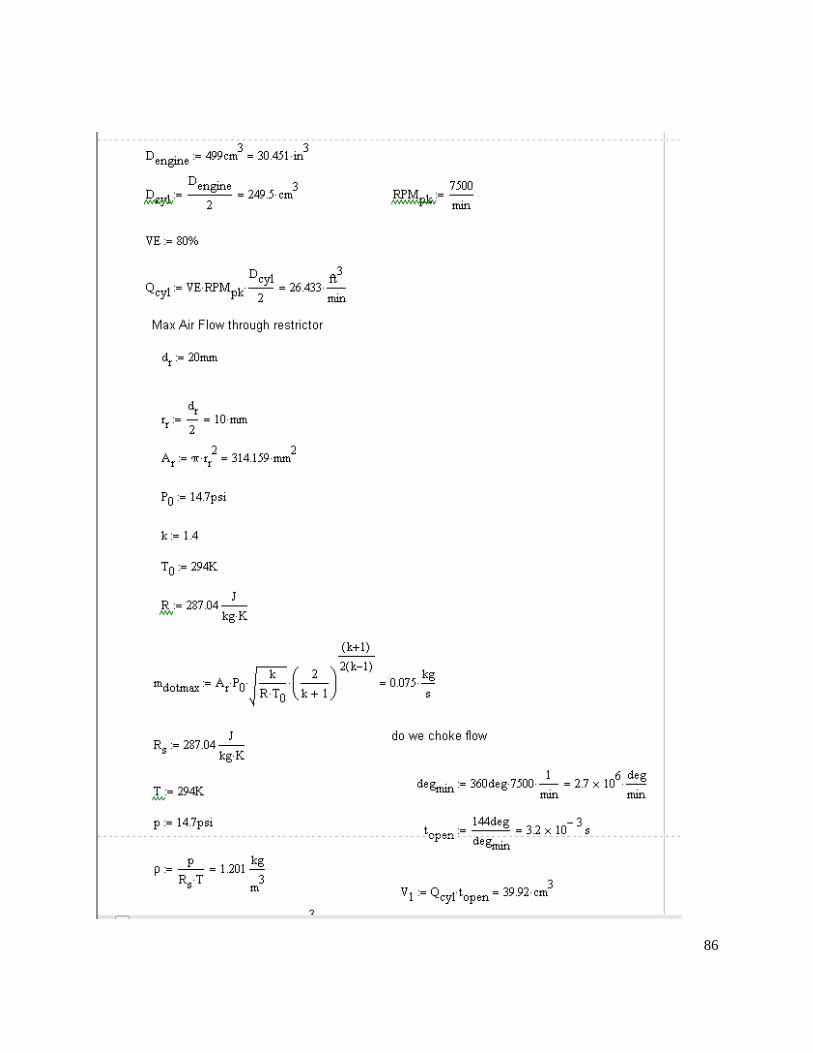
86

87