Design and Development of Credit Scoring Model for the ...ijbcnet.com/2-5/IJBC-12-2314.pdf ·...
26
www.ijbcnet.com International Journal of Business and Commerce Vol. 2, No.5: Jan 2013[01-26] (ISSN: 2225-2436) Published by Asian Society of Business and Commerce Research 1 Design and Development of Credit Scoring Model for the Commercial Banks in Pakistan: Forecasting Creditworthiness of Corporate Borrowers Asia Samreen MBIT. Student Institute of Business & Information Technology University of the Punjab, Lahore (Pakistan) Farheen Batul Zaidi Faculty Member Institute of Business & Information Technology University of the Punjab, Lahore (Pakistan) Aamir Sarwar Faculty Member Institute of Business & Information Technology University of the Punjab, Lahore (Pakistan) Abstract This research paper summarizes the development of a credit scoring model known as Credit Scoring Model for Corporations (CSMC), which can be used to evaluate the creditworthiness of corporate borrowers before granting loan. Altman Z-Score model was part of the CSMC. The dataset consists of 30 corporate borrowers of rejected and accepted corporations from the textile and chemical industry of Pakistan. The developed credit scoring model can be used by credit analysts, lending institutions, shareholders, financial institutions and auditors to predictcredit worthiness of the corporations. The credit scoring model was explained along with a detailed look at different credit scoring models. The results of the all developed credit scoring models were compared with the other statistical credit scoring techniques known as logistics regression and discriminant analysis. Type I and type II errors had been calculated for all the credit scoring models used. The results show that the proposed model (CSMC) has more accuracy rate with no errors as compared to LR and DA. The comparison between the creditworthiness of textile & chemical industry was made and it was concluded that there is no difference in their creditworthiness & probability of default. Also, several suggestions for further research were presented. Keywords: Credit Scoring; Credit Risk; Creditworthiness; Discriminant Analysis; Commercial Banks
Transcript of Design and Development of Credit Scoring Model for the ...ijbcnet.com/2-5/IJBC-12-2314.pdf ·...

www.ijbcnet.com International Journal of Business and Commerce Vol. 2, No.5: Jan 2013[01-26]
(ISSN: 2225-2436)
Published by Asian Society of Business and Commerce Research 1
Design and Development of Credit Scoring Model for the Commercial Banks
in Pakistan: Forecasting Creditworthiness of Corporate Borrowers
Asia Samreen
MBIT. Student
Institute of Business & Information Technology
University of the Punjab, Lahore (Pakistan)
Farheen Batul Zaidi
Faculty Member
Institute of Business & Information Technology
University of the Punjab, Lahore (Pakistan)
Aamir Sarwar
Faculty Member
Institute of Business & Information Technology
University of the Punjab, Lahore (Pakistan)
Abstract
This research paper summarizes the development of a credit scoring model known as
Credit Scoring Model for Corporations (CSMC), which can be used to evaluate the
creditworthiness of corporate borrowers before granting loan. Altman Z-Score model was part of the CSMC. The dataset consists of 30 corporate borrowers of rejected and
accepted corporations from the textile and chemical industry of Pakistan. The developed
credit scoring model can be used by credit analysts, lending institutions, shareholders, financial institutions and auditors to predictcredit worthiness of the corporations. The
credit scoring model was explained along with a detailed look at different credit scoring
models. The results of the all developed credit scoring models were compared with the
other statistical credit scoring techniques known as logistics regression and discriminant analysis. Type I and type II errors had been calculated for all the credit scoring models
used. The results show that the proposed model (CSMC) has more accuracy rate with no
errors as compared to LR and DA. The comparison between the creditworthiness of textile & chemical industry was made and it was concluded that there is no difference in
their creditworthiness & probability of default. Also, several suggestions for further
research were presented.
Keywords: Credit Scoring; Credit Risk; Creditworthiness; Discriminant Analysis;
Commercial Banks

www.ijbcnet.com International Journal of Business and Commerce Vol. 2, No.5: Jan 2013[01-26]
(ISSN: 2225-2436)
Published by Asian Society of Business and Commerce Research 2
1. Introduction
The motivation for this research is to discover understandings of the loan delinquency and
creditworthiness among the corporate borrowers. A credit scoring model would be developed to estimate
the creditworthiness of the corporations from the textile and chemical industry of Pakistan. The main aim
to develop the credit scoring model is to ultimately reduce the number of non-performing loans of
commercial banks of Pakistan.
This study is mainly done to build a model for commercial banks to determine the creditworthiness of the
corporate borrowers. The proposed credit scoring model will decide among the good and bad loan
applications and evaluate the risk category of corporations by using the generated credit score, the credit
score can be generated based on information available from loan applications, financial statements and
credit bureau reports and credit ratings of the corporations.
Credit is an amount that is granted by the banks to those applicants who requested credit; this should be
repaid at time including the interest plus principal. (Hand & Henley, 1997). The general risk the lending
institutions having when giving credit is the credit risk. Credit risk is the risk that the creditor would not
repay the loan when due which shows adverse effects on the revenues of the commercial banks. Credit
risk causes losses to the banks when a borrower defaults on the loans. The borrowers do default when
they are unable to repay the loan or even delay payment for a longer period of time and or is not able to
fulfill other requirements of the loan contract. (Dimitriu, Avramescu, & Caracota, 2010)
The non-performing loans of banks were 5.8% during the first quarter of 2010; which was greater than
double the 2.5% growth seen in the last quarter of 2009. Bankers attribute surge in debt mainly to
increased difficulties in recoveries from cement, textiles and auto sectors and consumers were the
common defaulters of the credit taken. (Aazim, 2010)
Because of the increased competition in the market and growing burdens on banks for revenue generation
have directed lending credit to debtors to explore more effective methods to attract new creditworthy
customers and at the same time control losses by reducing the defaulted loans. To minimize the credit risk
of individuals, we need a credit scoring models to evaluate their creditworthiness. According to Berger
and Frame (2007), credit scoring is a statistical model to predict the probability that a credit applicant will
default.
In the banking sector, the corporate clients demand for the loan on regular basis to meet their financial
needs. The risk for commercial banks to increase the requested loan depends on how efficiently and
accurately differentiates among good borrowers from the bad borrowers. So banks need an organized
system that assist them determining whether to grant credit or not and “Credit Scoring” is the answer to
the above problem.
Credit scoring models are used by banks to evaluate corporate loan applications and to distinguish high
risk companies from low prior to default. These models are used in the credit approval process to evaluate
loan applications which can enhance credit processing, save time and cost, improve quality of loan and
can also be a competitive advantage for the banks.
1.1 Objectives
The objectives of this study are as follows:
To design and develop a credit scoring model for corporations to assess the default risk.
www.ijbcnet.com International Journal of Business and Commerce Vol. 2, No.5: Jan 2013[01-26]
(ISSN: 2225-2436)
Published by Asian Society of Business and Commerce Research 3
To check the validity of the proposed credit scoring model, comparison with the preexisting
statistical credit scoring models could be done.
To determine the creditworthiness of corporations from textile industry.
To determine the creditworthiness of corporations from chemical industry.
To identify whether the creditworthiness of chemical industry is more or the textile industry.
2. Research Questions
The commercial banks of Pakistan need a credit scoring model which determines which applicants can be
considered good and accepted and which applicants can be classified as bad, hence rejected. The research
questions are as follows:
What is the creditworthiness of corporate borrowers requesting banks for the grant of credit?
What is the risk category of corporate borrowers requesting banks for the grant of credit?
Is there any difference in the creditworthiness of the textile and chemical industry among the
corporate borrowers?
2.1 Research Hypothesis
The research hypothesis of this study is as follows:
H0: μ1 = μ2The creditworthiness of corporations from textile industry is equal to chemical industry.
H1: μ1 ≠ μ2 The creditworthiness of corporations from textile industry is not equal to chemical industry.
3. Review of Literature
During 1930s, mail-order companies had introduced numerical scoring systems to overcome the
inconsistencies in credit decisions across credit analysts. (Weingartner 1966) and ((Smallet and Sturdivant
1973) as cited in (Thomas, Edelman, & Crook, 2002)).
With the start of the World War II, credit management became problematic for all the financial
institutions and mail-order companies. Hence, Johnson (1992) as cited in (Thomas, Edelman, & Crook,
2002) suggested that the creditors have the credit analysts who describe the procedures and on the basis of
these procedures creditors can make decisions about whom to provide credit.
Thomas, Edelman and Crook (2002) describe that in 1960, the credit scoring become more important and
helpful by the lenders with the introduction of the credit cards. By automating the lending decision,
organizations found credit scoring to be an effective forecaster as compared to other judgmental
approach, and half of the bad debts were reduced.
Credit scoring is a predictor of risk. Altman (1968) used scoring approaches to predict the risk of
companies going bankrupt.
A creditor can generate revenues when they accuratelyforecast the financial soundness and credit risk of
borrowers depending on the default predictor variables. Credit scoring is a appropriate method that links
these variables to the probability of default. (Lieli & White, 2010)
A loan is considered to be performing if it repaid along with the interest payments without any delay and
a loan is assumed as non-performing when interest on principal is unpaid greater than or equal to 90 days

www.ijbcnet.com International Journal of Business and Commerce Vol. 2, No.5: Jan 2013[01-26]
(ISSN: 2225-2436)
Published by Asian Society of Business and Commerce Research 4
(Obamuyi, 2007). Balogun and Alimi (1988) said when the borrower is unable to repay the loan amount
according to the agreed repayment terms; the lenders consider it as loan default. According to new Basel
II Capital Accord, default is defined as 90 days delinquent (Siddiqui, 2006). Kanwar (2005) defined credit
risk as risk arises when the borrower either is unwilling to repay the loan or he is not able to repay the
loan granted which results in economic loss to the bank.
According to Lee, Chiu, and I.(2002), credit scoring model gives good or bad credit score to the
borrowers demanding credit. Hence, classification analysis is the problem of scoring defined by
(Anderson, 2003; Hand, 1981; and Lee, Chiu, I. 2002)
Experiments in Bolivia and Colombia concluded that scoring for microfinance can enhance the judgment
of risk and also reduce costs. Colombian microfinance lender saved about $75,000 per year by the use of
credit scoring model. (Schreiner, 2000)
According to Chijoriga (2011), Credit scoring models can be qualitative as well as quantitative in nature.
Qualitative technique is judgmental and subjective; the disadvantage of qualitative method is that there is
no objective base for deciding the default risk of an applicant. While, quantitative technique is a
systematic method to categorize into performing or non- performing loans and it has removed the
shortcomings of qualitative technique and proved to be more reliable & accurate model.
However, Alexandru (2011) shows that it uses qualitative judgment and even quantitative guidelines to
evaluate the creditworthiness of applicants. The main advantage of subjective scoring is convenience; in
its case, there is no need to build a credit history database.
Judgmental techniques and credit scoring models are used to make a decision about whether to grant
credit or not. In judgmental techniques, credit analysts use current as well as past experience to evaluate a
client and hence grant a loan(Abdou, Masry, & Pointon, 2007).McDonald and Eastwood (2000) presented
that Judgmental models are also known as rules-based models and they are non- statistical
models.Sullivan (1981) discusses that in a risk assessment method by judgmental every loan request is
analyzed individually by a credit analyst. The success of a judgmental technique purely depends on the
experience of credit analyst. On the other hand in credit scoring, the loan requests are managed
mechanically and all credit decisions are made accordingly.
According to Saleem (2009), the net NPLs to the banks total liabilities should not increase beyond 5 %.
Bank should keep NPL below 5% preferably between 3-4 percent of their net loans. The State Bank
figures reveal that during the 3rd
quarter of 2011 the banks net NPLs swelled to 6.53% against 5.48% of
the last quarter told by Dilawar (2011). In 2008, provisions for losses went up from Rs. 173 billion in
September to Rs 178.9 billion in October.
Both the lenders and the borrowers could bear the costs of loan delinquencies. The creditor will not get
the interest payments and also the loan given. The debtor will come in the list of defaulters so his
character will be affected as well as he cannot further take loans from the same creditor and also could not
invest that loan taken. (Baku & Smith, 1998)
In the developing economies the rate of non-performing loans are between 10 percent and 60 percent as
described by Anderson (1982).Lending institutions have standard methods to measure the
creditworthiness of debtors while lending money. The variables that are used by the lenders to measure
financial health of debtors include analyzing their financial position, revenues, wealth, credit history and
associations with banks.(Obamuyi, 2007)

www.ijbcnet.com International Journal of Business and Commerce Vol. 2, No.5: Jan 2013[01-26]
(ISSN: 2225-2436)
Published by Asian Society of Business and Commerce Research 5
The applicants qualify for the loan after having been evaluated their financial position, all the borrowers
having credit score greater than credit cut off score will be delighted with loan. Moreover, their credit
limits can also be enhanced. (Lieli & White, 2010). According to Siddiqui (2006), it is the discretion of
the bank to set the credit cutoff score. They can set it higher in order to reduce the non performing loans
or to set it decline in order to having a substantial volume of applications.
Marquez (2008) considered important to compare credit scoring with credit ratings and clearly define the
difference, as people confuse credit scoring & credit rating as the same. Methodologically they are
extremely different and the only similarity between them is that both are systematic approaches to judge
the risk of a debtor. Credit ratings are the evaluation of the risk of the debtor, which is based on traditional
techniques of fundamental analysis as well as experience. While credit scoring is based on using
discriminant analysis; which is a statistical method to categorize groups into good or bad.
The financial crises forced the banking authorities, which include the World Bank, BIS, IMF and Federal
Reserve develop internal models to measure the financial risk in an accurate way. (Emel, Oral, Reisman,
& Yolalan, 2003)
According to Star (1990) as cited in (Charalambous , Charitou , & Neophytou , 2000) conducted in UK,
US, Canada and Australia shows that small, private and newly opened companies having lack of control
measures and inadequate cash flow planning face business failure due to financial distress more
frequently than the experienced public limited corporations.
The economic cost of failures of corporations is comparatively large. The failure of the corporations due
to financial insolvency results insignificant drop in market value (Warner, 1977). All the stakeholders
(suppliers of capital, investors, creditors, management, employees and auditors) are sternly affected from
business failures.(Boritz, 1991; Jones, 1987; Zavgren, 1983).
Steenackers & Goovaerts (1989) describes the most fundamental application of credit scoring models is
the evaluation of new individual loans. According to Orgler (1971), there are many research studies done
on granting loans to current individual but less literature is present on loans given to fresh individual.
Credit scoring models rely on the credit history of those debtors who are accepted and granted credit by
the banks. Credit scoring models not observe the performance of rejected applicants. Overlooking the
rejected applicants affects forecast accuracy of credit scores and has some effect on their discriminatory
power (Barakova, Glennon, & Palvia, 2011). Kiefer and Larsen (2006) explore the statistical issues in
growth of complete credit scoring techniques. They discuss that is it appropriate to exclude the rejected
applicants while developing credit scoring models or not.
4. Theoretical Framework
4.1 Selection of Variables
Both financial and non-financial factors can used in developing credit scoring model and financial ratios
can be taken as independent variables. (Keasey & Watson, 1987)
The variables for the development of „CSMC‟ credit scoring model for corporations were the financial
ratios calculated from financial statements for the financial year 2010, Altman‟s Z Score credit history
and credit ratings of sampled corporations from PACRA & JCR-VIS. The financial ratios were selected

www.ijbcnet.com International Journal of Business and Commerce Vol. 2, No.5: Jan 2013[01-26]
(ISSN: 2225-2436)
Published by Asian Society of Business and Commerce Research 6
due to usage, appeal to researchers, general acceptability and prediction power in the past researches
about forecasting default of corporation and by using factor analysis.
Altman (1968) used variables, which were categorized into five general ratios kinds such as liquidity,
profitability, leverage, solvency and efficiency ratios. Various other authors used ratios as default
predicting variables in the past like Altman, Brady, Resti, and Sironi, (2005), Altman and Sabato (2005);
and Crouhy, Mark, and Galai ( 2001).
4.1.1.1 Dependent Variable
In this research study the „Credit Score’ is the independent variable for the Credit scoring model for
corporations. Credit score is a number that represents the creditworthiness of corporate borrowers and
banks or financial institutions used this while lending. There is positive relationship between credit score
and creditworthiness.
4.1.1.2 Independent Variables
Table 1
1 Current Ratio Total current assets / Total current liabilities
2 Quick Ratio (Current Assets - Inventory)/ Current Liabilities
3 Gross Profit Margin Gross income / Sales
4 Operating Income Margin Operating income / Sales
5 Net Profit Margin Net Income / Sales
6 Return on Assets (ROA) Net Income / Total Assets
7 Return on Equity (ROE) Net Income/Shareholder's Equity
8 Sales growth (in past 2
years)
(Current Year's sales - Last Year's sales) / (Last Year's sales) *
100
9 Debt to Equity Ratio Total Debt / Total Equity
10 Total Debt to Assets Total Debt / Total Assets
11 Interest Coverage Ratio EBIT / Interest
12 Debt Service Coverage
Ratio
(Net Income + Finance Cost + Depreciation) / (Repayments of
long term loans + Finance Cost)
13 Debt leverage Total Liabilities/EBITDA
14 Receivable Turnover –
days
Sales / (Accounts Receivable/365)
15 Days Sales in Inventory Inventory /(Cost of goods sold/365)
16 Payable Turnover - days Sales / (Accounts Payable/365)
17 Earnings Per Share (EPS) Net Income / # of shares outstanding
18 Price Earnings (PE) Ratio Market price per share / EPS
19 Altman Z-Score 1.2*X1+1.4*X2+3.3*X3+0.6*X4+1*X5
www.ijbcnet.com International Journal of Business and Commerce Vol. 2, No.5: Jan 2013[01-26]
(ISSN: 2225-2436)
Published by Asian Society of Business and Commerce Research 7
A credit rating is an assessment process of creditworthiness of corporations who issue certain types of
debt or shares. Credit rating is given by credit rating agencies; in Pakistan credit rating is done by JCR-
VIS and PACRA.
Credit history is an important determinant of default risk and banks must analyze this to decide whether to
give loan or not. The credit report is a record of a debtor‟s past borrowing and credit report is obtained
from the Credit Information Bureau (CIB) department of State Bank of Pakistan, which also includes
information about late payments and default. In this research study we have considered whether the
corporation has never defaulted or 30, 60, 90 days default.
A CIB report is asked from Credit Information Bureau (CIB) by the banks of Pakistan. This document
represents the credit borrowing history of the customer. In this report there is list of each and every
borrowing that the customer has made with any bank and the amount of outstanding left with the bank
and also whether or not the customer is clean or he is a defaulter.
5. Research Methodology
This study aimed to determine the creditworthiness of corporations by using proposed credit scoring
model. The data was taken from primary as well as from secondary sources. Primary data is collected
through the use of questionnaires. The secondary data was collected from all the financial statements of
corporations from textile and chemical industry of Pakistan and credit history of these corporations as
well.
Many books, articles and working papers were read for the analysis of this research, the previous work
done and findings relevant to this research.
All these three techniques namely exploratory research, descriptive research and explanatory research
were adopted in this research study. For the descriptive approach, unstructured interviews were conducted
from the credit managers of some of the banks in Pakistan to understand how they evaluate debtor
creditworthiness when granting credit and they also described the credit approval process. As for the
explanatory research, components of credit scoring models were identified.
5.1 Scope of the Study
In this research study, we developed the two credit scoring models; one to identify the default
risk of individual borrowers and other for corporate borrowers.
The study was aimed to calculate the creditworthiness of the corporations based on developed
credit scoring model for corporate borrowers.
To apply the credit scoring model for corporate loans, a sample of 30 companies had been
taken which includes 15 companies from Textile industry and 15 companies from Chemical
Industry.
This study also compared the credit scores generated by the credit scoring model by corporate
loans; between textile industry corporations and chemical industry of Pakistan, and
distinguish whether the credit worthiness of textile industry is more as compared to chemical
industry.
20 Credit Rating From AAA to C
21 Credit History Never default/ 30 Days or 60 days or 90 days default

www.ijbcnet.com International Journal of Business and Commerce Vol. 2, No.5: Jan 2013[01-26]
(ISSN: 2225-2436)
Published by Asian Society of Business and Commerce Research 8
5.2 Data Collection Method
The primary data was collected by personal interviews with the credit managers and by administering two
questionnaires. Personal interview method is used for the analysis of credit approval process by the banks.
Here, personal interviews will be conducted with the credit managers of different commercial banks. A
questionnaire was circulated to the commercial banks of Pakistan to collect the ratios importance in the
credit evaluation process and another questionnaire to obtain the credit history of corporate borrowers.
The most important source of secondary information concerning the creditworthiness of a corporation can
be found in the publicly available financial statements that include Balance sheets, Income Statements,
Profit & Loss Accounts of the companies from Textile and Chemical industry. The share prices of the
sampled corporations were taken from Karachi stock Exchange (KSE). The credit ratings were collected
from the PACRA and JCR-VIS.
5.3 Sampling
5.3.1 Sample size
For the development of credit scoring model for corporations, the sample size was 30 corporations; 15
corporations from Textile industry and 15 from Chemical industry of Pakistan. Due to the time constraint,
the sample size for the ratios questionnaires aimed to find the importance and relevance in credit
evaluation process was 15 and credit analysts filled these questionnaires only.
5.3.2 Sample Frame
The data of 30 corporations for the development of credit scoring model for corporation were taken from
Karachi Stock Exchange; their credit ratings were taken from the Pakistan‟s well known credit ratings
PACRA & JCR-VIS. The credit history of the corporations from textile & chemical industry were taken
from the Citi bank N.A, Bank of the Punjab, United Bank Limited, Habib Bank Limited, Muslim
Commercial Bank &Standard Chartered Bank. The ratios relevance & importance data was taken from
the Credit Analysts of the Standard Chartered Bank.Banks takes credit history of those borrowers who
have either delayed the payment or defaulted from Credit Information Bureaus (CIB) department from
State Bank of Pakistan.
5.4 Data Analysis Tools
Financial tools that were used to calculate the creditworthiness of individuals and corporations includes
the proposed credit scoring models for individuals and credit scoring model for corporations. Frequencies,
Cross Tabulation, Altman‟s Z-Score, the Discriminant Analysis (DA), Logistic Regression analysis,
Factor Analysis on SPSS 17.0. Test of Differences between Two Means (Independent Groups) was used
to compare the creditworthiness of textile and chemical industry.
5.5 Credit Scoring Models
5.5.1 Altman‟s Z Score
The most popular credit scoring model is the Altman‟s Z-Score.In 1968, the Z-score equation was given
by Dr. Edward Altman, which is still used today to measure the financial position of an organization and a
powerful indicative method that predict the bankruptcy of a corporation within couple of years and
provide 75% to 80% accurate results. (Altman, 1968)
The Altman‟s Z Score formula is as follows:
Z=1.2X1+ 1.4X2 + 3.3X3 + 0.6X4 +1.0X5

www.ijbcnet.com International Journal of Business and Commerce Vol. 2, No.5: Jan 2013[01-26]
(ISSN: 2225-2436)
Published by Asian Society of Business and Commerce Research 9
X1 = Working capital/ Total assets ratio
X2 = Retained earnings/ Total assets ratio
X3 = Earnings before interest and taxes/ Total assets ratio
X4 = Market value of equity/ Book value of long-term debt ratio
X5 = Sales/ Total assets ratio
Table 2:Z Score Zone of Differentiation
Z > 2.99 “Safe” Zone Low Default Risk
1.8 < Z < 2.99 “Grey” Zone Medium Default Risk
Z < 1.80 “Distress” Zone High Default Risk
According to Altman (1968) as shown in Table 2, there are three classes of Z score. As the Z score
increases the probability of default decreases. “Any firm with a Z-Score less than 1.81 have been
considered as having a high default risk, between 1.81-2.99 an indeterminate default risk, and greater than
2.99 a low default risk and lies in safe zone.”
5.5.2 Discriminant Analysis
Abdou, Masry, and Pointon (2007) explained the discriminant analysis. According to him, in discriminant
analysis(DA) the data should be normaly distributed and also be independent. However, the general
formula of discriminant analysis is:
Z=α + β1X1+ β2X2 + β3X3...................+ βnXn
According to Lee (2002) as cited in (Abdou, Masry, & Pointon, 2007), the Z denotes the discriminant
score also called Zed score, α is constant and β1 to βn are the coefficients.
The assumptions of discriminant analysis model are that the independent variables should be normally
distributed, the two categories of dependent should have same variability and all the variables should be
on an interval. (Desai, J., & G., 1996)
5.5.3 Logistic Regression
Logistic Regression is a method that is commonly used by the researchers for classification of creditors.
In this technique the probability of a dichotomous outcome, which can be in the form of binary is
associated to factors forecasting probability of default. However, the general formula of LR is as follows:
Log [p/(1-p)] = α + β1X1+ β2X2 + β3X3+ β4X4...............................+ βnXn
According to Lee (2005), p called the probability of result, α is constant and β1 to βn are the coefficients.
Lee and Chen (2005) as cited in (Abdou, Masry, & Pointon, 2007) defined the aim of a LR in credit
scoring. Logistic regression can be used to classify the borrowers into two categories based on predictor
variables.
According to Kocenda and vojtek (2009), the comparison between logistic regression and CART
(classification and regression trees) shows that they are similar.
5.6 Developing Credit Scoring Models
The main objective of our research is the design & development of a new and potentially more effective
credit scoring models which are defined here as the Credit Scoring Model for Corporations (“CSMC”)

www.ijbcnet.com International Journal of Business and Commerce Vol. 2, No.5: Jan 2013[01-26]
(ISSN: 2225-2436)
Published by Asian Society of Business and Commerce Research 10
and this model would be used to distinguish low risks applicants to high risk applicants.
When commercial banks of Pakistan adopt the credit scoring models to assess the creditworthiness of
their individual & corporate borrowers, their lending costs decreases as well as accuracy in estimating
creditworthiness increases. With the use of credit scoring models, the banking sector can reduce its non-
performing loans and credit risk exposure.
The 1st step in developing the credit scoring models was finding the different components affecting the
creditworthiness of applicants. For identifying these factors many articles and websites related to the
corporate & consumer loans were studied. The financial ratios were included in the CSMC on the basis of
their prediction power as it was proved in the past studies.
5.6.1 Credit Scoring Process
Corporate Borrower
Factors considered in Scoring
Reach Cut off
Score Reject Loan
Accept Loan
No
Yes
Ratios
Analysis
Credit
Ratings
Altman Z
Score
Credit
History
Credit Score Identification of
Financial Ratios
Obtaining Major
Financial ratios via
factor Analysis of
Financial Ratios

www.ijbcnet.com International Journal of Business and Commerce Vol. 2, No.5: Jan 2013[01-26]
(ISSN: 2225-2436)
Published by Asian Society of Business and Commerce Research 11
5.6.2 CREDIT SCORING MODEL FOR CORPORATIONS (CSMC)
Table 3 Scoring Scoring Scoring Score
1. FINANCIAL FACTORS =80% 1 2 3
Liquidity Ratios
Current Ratio < 1 1-1.5 > 1.5
Quick Ratio < 0.75 0.75-1.25 > 1.25
Profitability Ratios
Gross Profit Margin < 1.5 1.5 - 5% > 5%
Operating Income Margin < 1.5 1.5 - 5% > 5%
Net Profit Margin < 1.5 1.5 - 5% > 5%
Return on Assets (ROA) < 5% 5 – 15% > 15%
Return on Equity (ROE) < 10 % 10 - 20% > 20%
Sales growth (in past 2 years) < 5% 5-20% > 20%
Financial Leverage Ratios
Debt to Equity > 1.2 0.8 - 1.2 < 0.8
Total Debts to Assets > 1.2 0.8 - 1.2 <0.8
Debt Leverage Ratio > 5 1.5 - 5 < 1.5
Coverage Ratios
Interest Coverage Ratio < 1 1 - 1.5 >1.5
Debt Service Coverage Ratio < 1.2 1.2 - 2 > 2
Activity / Efficiency Ratios
Receivable Turnover – days > 120 60 - 120 < 60
Days Sales in Inventory > 180 90-180 < 90
Payable Turnover – days > 90 30 - 90 < 30
Market Ratios
Earnings Per Share (EPS) < 10 10 - 50 >50
Price Earnings (PE) Ratio < 20 20 - 25 > 25
Altman Z-Score = 10% <1.8 1.80-2.99 > 2.99
Total Score - Financial factors 80(max)
2. NON-FINANCIAL FACTORS=20%
Credit Rating CCC-C B-BBB A-AAA
Credit History- days >= 90 >=30 &<90 Never defaulted
Total Score – Non-Financial factors 20(max)
TOTAL SCORE
100(max)
5.6.2.1 Financial and Non-Financial Factors
There are two component factors in the credit scoring model for corporations:
1. Financial
2. Non-Financial

www.ijbcnet.com International Journal of Business and Commerce Vol. 2, No.5: Jan 2013[01-26]
(ISSN: 2225-2436)
Published by Asian Society of Business and Commerce Research 12
The total weightage of financial factors are 80%. Financial factors include all the relevant ratios necessary
while evaluating the credit risk of an applicant, all the financial ratios have 70% weightage in this model,
while the Altman‟s Z-Score which is also the part of financial factors have 10% weightage. The non-
financial factors have 20% weightage in the credit scoring model for corporations. There are two factors
in the non-financial component which are credit rating and credit scoring. Credit rating as well as credit
history have equal weightage equal to 10%.
In the credit scoring model for corporation, the financial ratios were considered as explanatory variables.
The given data from the financial statements from thirty corporations was studied and the relevant ratios
were computed to ascertain the creditworthinessof the corporate borrower. The information contained
within financial ratios derived primarily from financial statements was focused to develop credit scoring
model for corporate borrowers. The financial statements used to determine the financial ratios in this
analysis have been sourced in the form available on KSE of the year 2010.
There are total eighteen ratios used in the development of credit scoring model for corporation from six
different dimensions like Liquidity, Profitability, Financial Leverage, Debt Coverage, Activity/ Efficiency
& Market were considered. Further Altman Z Score and Credit Rating of corporations are an essential
part of this credit scoring model. Z Score was used to predict the bankruptcy of organizations and credit
rating was taken from PACRA & JCR-VIS, the credit rating agencies in Pakistan.
Factor analysis, the outcomes from the questionnaires asked from credit analysts, and results of literature
survey were used in selecting the financial ratios used in the development of the proposed model for
corporation called as CSMC.
The ranges of Quick ratio, Sales growth (in past 2 years), Net margin, Debt service coverage ratio,
Receivable turnover – days, Days sales in Inventory and Debt leverage were taken from an article of
“Sample Scoring Model With Comments To Assess SME Loan Requests”. (Brien, 2008)
The ranges of all the other factors are defined by studying the previous researches, books related to the
financial analysis, several web sources and by discussing with the credit managers of banks.
5.6.2.2 Scoring
The financial factors as well as non-financial components were given either 1, 2 or 3 credit score. Thus,
lending institutions or banks can choose scoring that is most suitable to them; this scoring was chosen
because it seems easy. Credit score 1 means high default risk, 2 represent the medium risk and finally 3
credit score shows a low level of default risk. So low credit score shows high risk and less
creditworthiness of a corporation and high credit score represents a low default risk and more
creditworthiness of a corporation. We have defined the ranges of ratios into three categories which low,
medium and high risk and accordingly assigned credit score of 3, 2 & 1 respectively.
Table 4
Credit Score Range
(In %)
Quality Risk Class
91 -100 Highest A
76- 90 Good B
55 – 75 Average C
< 55 Below Average D

www.ijbcnet.com International Journal of Business and Commerce Vol. 2, No.5: Jan 2013[01-26]
(ISSN: 2225-2436)
Published by Asian Society of Business and Commerce Research 13
There are four risk classes which are A, B, C & D. Risk class „A‟ shows no default risk due to highest
credit score. Risk class „B‟ shows lowest default risk because of high credit score. Risk class „C‟
represents medium level of default/ credit risk as having average level of credit score. Risk class „D‟
indicates the high level of risk and also having below average credit score. When the credit score of any
corporation lies in the first category between range of 91% to 100%, it means that corporation will lie in
the risk class „A‟ which has lowest possible risk and banks considered the corporation demanding loan as
of highest quality.
The cut off score of this model is 55%. When the credit score is below 55%, the corporate does not
succeed for the grant of credit. Any corporation having credit score below 55%, which is the cut off score,
will be rejected and does not qualify for a loan. While, any corporate borrower having credit score above
55% will be accepted and loan will be granted. Below cut off score it is riskiest to grant credit to a
corporation while above cut off score there is relatively low default risk depending upon their risk class.
5.7 Results
5.7.1 Factor Analysis
Factor analysis was used to reduce the data set of financial ratios which to be included in the credit
scoring model for corporations. This method was adopted in order to avoid the multi colinearity among
the financial ratios. The ratios which were perfectly correlated with the other financial ratios were
removed from the set of variables.
According to Table 110, there were total nine components extracted. All components having Eigen values
greater >1 was accepted and only these ratios were passing the cut off condition of Eigen values greater
than one.
Current ratio has Eigen value equal to 8.247 with 29.455% variance and current ratio has 19.323% of the
variability in all other 28 factors. This ratio has the highest Eigen value. The component at the second
position is the quick ratio, which has Eigen value of 4.333 with 15.474% variance and this ratio has
14.248% variability in the remaining ratios.
GPM has also Eigen value greater 1 so this ratio was also considered important. Operating income margin
has Eigen value greater than 1 that is 2.634, with 9.408% variance and it has 8.742% of the variability in
all other remaining 28 factors. Net margin has Eigen value greater than 1 that is 2.031, with 9.408
variance and NPM has 8.470% of the variability in all other 28 variables.
ROA has Eigen value greater than 1 that is 1.892, with 6.758% variance and current ratio has 8.156% of
the variability in all other 28 factors.ROE has Eigen value equal to 1.683 having 6.009% variance and it
also have 8.119% of the variability in remaining components. The sales growth having Eigen value of
1.140, with 4.072% variance and this ratio has 8.042% of the variability in all other 28 factors. The last
factor that was accepted by factor analysis was debt to equity having Eigen value of 1.069, with 3.817%
variance and this ratio has 6.335% of the variability in all other 28 factors. All the remaining 19 variables
were considered important by factor analysis; these variables have Eigen values less than 1.

www.ijbcnet.com International Journal of Business and Commerce Vol. 2, No.5: Jan 2013[01-26]
(ISSN: 2225-2436)
Published by Asian Society of Business and Commerce Research 14
It can be seen from Figure 2 the screen plot of the factor analysis. The slope of the curve becomes flatter
after 9 factors, so these factors were not extracted. The eigen value also falls from above 1 to less than 1
when we move from factor 9 to factor 10. This is concluded that nine factors are the right choice. The
factors having Eigen value greater than 1 are shown by red circle in the Figure 2 and all the remaining 19
factors which has not met the cut off criteria are shown by black circles and hence extracted from the set
of variables.
5.7.2 Importance of Ratios in Loan Evaluation
In order to include only the relevant ratios that can predict the creditworthiness of corporations we have
taken the opinion of credit managers from the credit departments.
Current ratio is considered extremely important by 80% of the total sample and according to remaining
20%, it is important. 53.3% says that quick ratio is important. According to 46.6% credit managers‟ gross
profit margin is important predictor of default and 73.3% says that operating income margin is important.
Net margin, ROA, ROE, Credit rating etc. are important.
Ratios like DPS, market to book ratio, fixed asset turnover, capitalization ratio, current asset turnover
book value per share, dividend payout ratio, DPS, total asset turnover, and were not so important while
evaluating the financial health of a corporation.
5.7.3 Credit Scoring Models
While assessing the creditworthiness of corporate borrowers we have used several credit scoring
techniques such as credit scoring model for corporations, LR and DA. We have used the LR and DA to
Figure 2: Extracted factors

www.ijbcnet.com International Journal of Business and Commerce Vol. 2, No.5: Jan 2013[01-26]
(ISSN: 2225-2436)
Published by Asian Society of Business and Commerce Research 15
compare the accuracy of the developed credit scoring model. We have discussed the results of each credit
scoring model and also compared their results as well as errors.
5.7.3.1 Credit Scoring Model for Corporations (SCMC)
We have developed a new credit scoring model to estimate the creditworthiness of corporate borrowers
called as “Credit Scoring Model for Corporations (CSMC)”. In this model we have 2 factors, which are
financial factors and non-financial factors. Financial factors include the important ratios and Altman‟s Z
Score while non-financial factors includes the credit rating and credit history of the corporations from the
textile and chemical industry.
Table 5: Classification results using Credit Scoring Model for Corporations (CSMC)a
Observed group
Predicted group
Credit Score
Percentage 0 Bad 1 Good
Credit Score 0 Bad 3 0 100.0
1 Good 0 27 100.0
Overall Percentage 100.0
a. Cut-off point 0.55
The cut off score for CSMC is 0.55 (55%), credit score of corporations equal to or greater than cut off
score were accepted and all those application who lied below the credit score were rejected.
The classification results of credit scoring model for corporations are that there are 3 defaulting
corporations, comprising of 10% of the total population. Out of 30 corporations, there are 27 corporate
applicants (90%) who have credit score above the cut off score, so they are predicted to be good
applicants showing good creditworthiness and less probability of default. The overall accuracy of this
model is 100%. There is no Type I error and there is also 0% type II errors.
5.7.3.2 Logistic Regression
The variable Receivable Turnover in Days was constant for the all the total population; this variable was
removed from the analysis of LR.
The variables which are significant are Gross Profit Margin, ROE, Interest Coverage Ratio, Net Profit
Margin, Total Debts to Assets, Operating Income Margin, Debt service coverage Ratio, Altman Z Score,
Credit rating and Credit history. The classification results generated by using logistic regression credit
scoring model (LR) using the predictor factors are as follows:
www.ijbcnet.com International Journal of Business and Commerce Vol. 2, No.5: Jan 2013[01-26]
(ISSN: 2225-2436)
Published by Asian Society of Business and Commerce Research 16
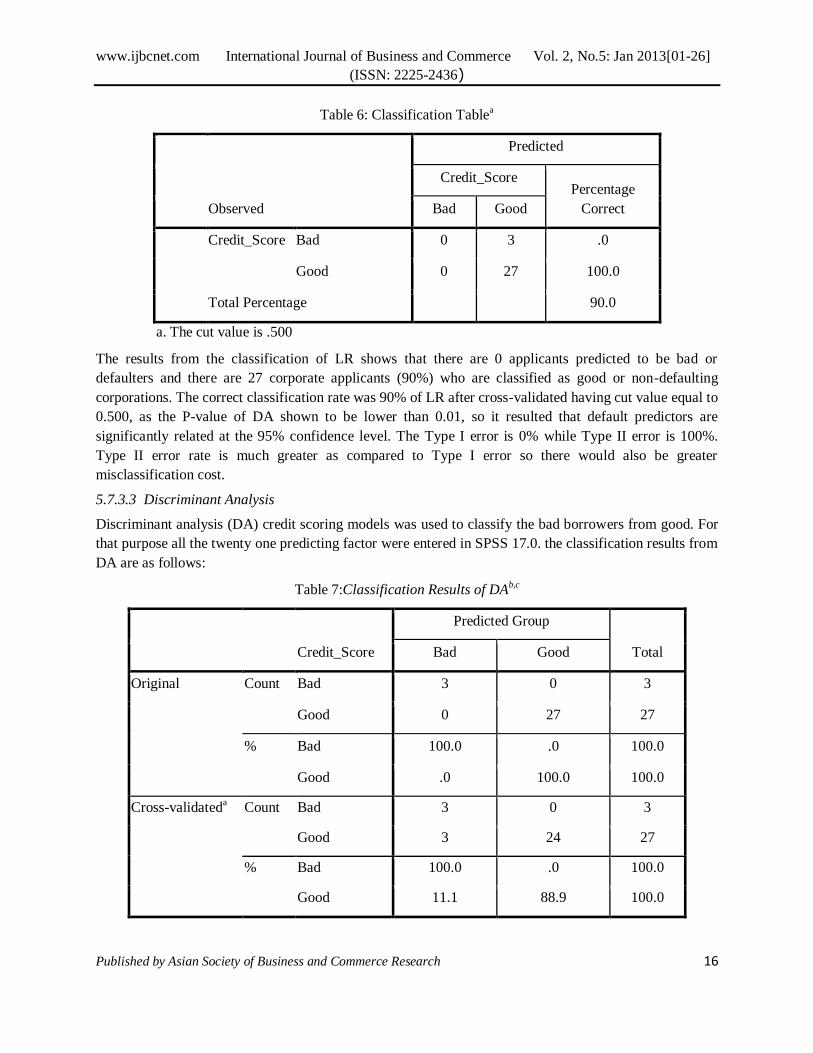
Table 6: Classification Tablea
Observed
Predicted
Credit_Score Percentage
Correct Bad Good
Credit_Score Bad 0 3 .0
Good 0 27 100.0
Total Percentage 90.0
a. The cut value is .500
The results from the classification of LR shows that there are 0 applicants predicted to be bad or
defaulters and there are 27 corporate applicants (90%) who are classified as good or non-defaulting
corporations. The correct classification rate was 90% of LR after cross-validated having cut value equal to
0.500, as the P-value of DA shown to be lower than 0.01, so it resulted that default predictors are
significantly related at the 95% confidence level. The Type I error is 0% while Type II error is 100%.
Type II error rate is much greater as compared to Type I error so there would also be greater
misclassification cost.
5.7.3.3 Discriminant Analysis
Discriminant analysis (DA) credit scoring models was used to classify the bad borrowers from good. For
that purpose all the twenty one predicting factor were entered in SPSS 17.0. the classification results from
DA are as follows:
Table 7:Classification Results of DAb,c
Credit_Score
Predicted Group
Total Bad Good
Original Count Bad 3 0 3
Good 0 27 27
% Bad 100.0 .0 100.0
Good .0 100.0 100.0
Cross-validateda Count Bad 3 0 3
Good 3 24 27
% Bad 100.0 .0 100.0
Good 11.1 88.9 100.0

www.ijbcnet.com International Journal of Business and Commerce Vol. 2, No.5: Jan 2013[01-26]
(ISSN: 2225-2436)
Published by Asian Society of Business and Commerce Research 17
a. “Cross validation is done only for those cases in the analysis. In cross validation, each case
is classified by the functions derived from all cases other than that case.
b. 100.0% of original grouped cases correctly classified”.
c. 90.0% of cross-validated grouped cases correctly classified.
According to the classification of DA shows that there are originally 3 corporations (100%) predicted to
be bad/defaulting and 27 corporations (100%) as good or non-defaulting applicants. It can be observed
that Type I error is 0% as well as Type II error is 0%. There is 100% of accuracy that the original group
cases correctly classified.
After cross validating the results of DA, there are 3 applicants (100%) predicted to be bad and 24
applicants (88.9%) as good corporate borrowers. It can be observed from the cross-validated classification
results that Type I error rate is 11.11% and Type II error is 0%. There are 3 corporations misclassified as
bad applicants.
The correct classification rate was 88.9% of DA after cross-validated having cut value equal to 0.500, as
the P-value of DA shown to be lower than 0.01, so it resulted that default predictors are significantly
related at the 95% confidence level.
5.7.3.4 Comparing Credit Scoring Models for Corporations
We have compared the accuracy rates or correct classification rate of all the credit scoring. The credit
scoring results along with the accuracy rates of SCMC, LR and DA are as follows:
Table 8
Credit Scoring Model Credit Scoring Results
Bad-Bad
(0-0)
Good-Good
(1-1)
Accuracy Rate*
Scmc
Lr
Da
100% (3/3)
0% (0/3)
100% (3/3)
100% (27/27)
100% (27/27)
88.9% (24/27)
100%
90%
94.45%
* the average correct classification rate is calculated using 0.5 cut off
The accuracy rate of SCMC is 100%; the credit scoring model for corporations has accurately classified
the defaulting and non-defaulting corporations. Logistic regression (LR) has the accuracy rate of 90%,
with 100% accurately classified the bad corporate applicants and 0% accurately predicted the good
corporations. The discriminant analysis credit scoring model has the accuracy rate of 94.45%, with 100%
accurately defined the defaulting companies and 88.9% accurately predicted the non-defaulting
companies.
The credit scoring resulted that the proposed credit scoring model for corporations have the highest
accuracy rate and also the most effective model as compared to logistic regression credit scoring model
and discriminant analysis. It is also concluded that correct classification rate of discriminant analysis
(DA) is greater than logistic regression (LR).

www.ijbcnet.com International Journal of Business and Commerce Vol. 2, No.5: Jan 2013[01-26]
(ISSN: 2225-2436)
Published by Asian Society of Business and Commerce Research 18
Table 9: Comparison of errors
Credit Scoring Model Error results
Type I Type II
SCMC
LR
DA
0% (0/27)
0% (0/27)
11.11% (3/27)
0% (0/3)
100% (3/3)
0% (0/3)
Discriminant analysis has the highest Type I error as compared to SCMI and LR. As there is no Type I &
Type II errors in SCMI so there will be no misclassification cost. The Type II error of logistic regression
is much higher than the other credit scoring models and it must have greater misclassification cost.
5.7.4 Test of Differences between Two Means (Independent Groups)
One of our research objectives was to differentiate the chemical and textile industry on the basis of
creditworthiness. We wanted to analyze whether the textile industry of Pakistan defaults more or the
chemical industry, which industry has the better financial position to repay the loan.
H0: μ1 = μ2The creditworthiness of corporations from textile industry is equal to chemical industry.
H1: μ1 ≠ μ2The creditworthiness of corporations from textile industry is not equal to chemical industry.
Table 10
As can be seen from above Table, the value of significant is greater than 0.05. A sig. value greater than
0.05 describes that the variability in the creditworthiness of textile and chemical industry is about the
same. Hence the creditworthiness of textile industry does not vary too much from the creditworthiness of
As the Sig. (2-tailed) value is greater than 0.05 then it is scientifically concluded that there is no
statistically significant difference in the creditworthiness between the two industries. Hence it is
concluded that do not reject the null hypothesis, which resulted that the creditworthiness of corporations
from textile industry is equal to chemical industry.
When we make comparison industry wise of all the independent variables then it shows that chemical
industry has better mean current ratio of 2.07 as compared to textile industry having 1.60. Higher means
www.ijbcnet.com International Journal of Business and Commerce Vol. 2, No.5: Jan 2013[01-26]
(ISSN: 2225-2436)
Published by Asian Society of Business and Commerce Research 19
is good as in coding a better ratio was labeled with high credit score. Earnings per share (EPS) and credit
history mean are also better of chemical industry.
Among the bad corporations there is only corporation from chemical industry and 2 corporate borrowers
from the textile industry. Among the non-defaulting corporations, there are 14 companies from chemical
industry and 12 from textile industry.
6. Discussion
The proposed model of credit scoring was developed keeping in view the increasing trend of bad debts
from the corporate borrowers as can be seen in Figure 82.The Credit Scoring Model for Corporations was
developed to assist the banks in determining the creditworthiness and default risk of corporate borrowers.
Pervez (2011) analyzed that as shown in Table 12, there is tremendous increasing trend of non-
performing loans from 2008 and in 2009 NPLs rose to Rs. 446 billion and it‟s become a challenge for the
banks of Pakistan to reduce their NPLs by accurately predicting the borrower credit risk. Banks was
hesitant to grant loans to corporate sector and there was only 2.5% increase in corporate loans. The
decline of corporate loans comes from the high infection ratio from the textile sector and need to be
closely observed.
The accuracy rate of Credit Scoring Model for Corporations (CSMC) was 100%, more than the other
models used. Among the corporate borrowers the logistic regression (LR) has the accuracy rate of 90%
and discriminant analysis (DA) is 94.45% accurate. So discriminant analysis was more accurate as
compared to logistic regression.
There is no Type I error as well as Type II error in CSMC. The lending institutions require those
valuation tools that give fewer errors rates, less misclassification cost, most effective and accurate. Type I
as compare to Type II error costs more to banks as in Type I error bad applicants are considered as good
which is highly risky. In Type II error the banks just loose the potential applicants hence reduce their
revenues. The credit scoring model which has the highest accuracy rate and lowest error rates are
considered to be the most effective, accurate, efficient and useful model.
The most important factor that must be considered is the credit history of the corporations. It can see from
our results as well as from past literature that those borrowers who have defaulted previously can be
predicted to default in the future.
Various researches have included the industry or sector risk in their models of loan assessment, so due to
time limitations we have checked the differences in the default risk of only 2 industries. The result shows
that there is no difference in the default risk among these industries.
Schreiner (2000) resulted that Creditors analyze the creditworthiness of borrowers based on their credit
histories taken from credit bureau and also check borrower‟s salary and experience before loan approval.
7. Conclusion
This research study shows an evaluation of creditworthiness of corporate borrowers from textile &
chemical industry to improve the credit approval process and to decrease the non-performing loans in the
commercial banks of Pakistan.

www.ijbcnet.com International Journal of Business and Commerce Vol. 2, No.5: Jan 2013[01-26]
(ISSN: 2225-2436)
Published by Asian Society of Business and Commerce Research 20
In this study we have taken a sample of 30 corporate borrowers from two industries (textile & chemical)
who have taken corporate loans from the various commercial banks of Pakistan, out of which there were 9
corporations who have never defaulted, there were 9 corporations who have default up to 30 or 60 days
and 12 corporate borrowers have 90 days default. The Credit Scoring Model for Corporations (CSMC)
classified 3 corporate borrowers as defaulters or bad and 27 as non-defaulters or good.
The ratios finalized for the CSMC was researched from the previous researches done and by the results of
factor analysis. Factor analysis resulted that 19 ratios out of 28 should be discarded and only 9 ratios
should become part of our proposed model.
The Credit Scoring Model for Corporations (CSMC) has assessed the creditworthiness of corporate
borrowers with average correct classification rate of 100% that includes the corporations from the textile
and chemical industry. The logistic regression and discriminant analysis was used to support the results of
developed credit scoring model. The accuracy rate of Credit Scoring Model for Corporations was 100%.
Hence, it resulted that for the corporate borrowers the logistic regression (LR) has the accuracy rate of
90% and discriminant analysis (DA) is 94.45% accurate. It shows that proposed CSMC have the highest
accuracy rate and also the most effective model as compared to other two credit scoring model of logistic
regression and discriminant analysis.
The industry wise comparison was done to determine the level of risk or creditworthiness of sampled
industries. For that purpose the test of differences between two means (independent groups) was used and
it resulted that there is no significant differences in the creditworthiness of corporation from textile and
chemical industry of Pakistan.
8. Limitations
The limitations faced during the completion of this research study were:
Islamic Banks were part of our study since as their credit evaluation and also the types of credit are
different. We have included only the commercial banks in our research study. Due to the sensitivity of the
data we could not get the credit history of corporations from the Credit Information Bureau (CIB)
department of State Bank of Pakistan. With such a confidential data, a large sample size was not possible
to be attained. The matter of anonymity was a big hurdle in data gathering from the banks. As there was
no research done which has determined the industry risk, it is not included as a predictor of default of
corporations in the model developed for corporate borrowers.

www.ijbcnet.com International Journal of Business and Commerce Vol. 2, No.5: Jan 2013[01-26]
(ISSN: 2225-2436)
Published by Asian Society of Business and Commerce Research 21
References
Aazim, M. (2010). Bad debt and interest rates. DAWN .
Abdou, H., Masry, A. E., & Pointon, J. (2007). On the Applicability of Credit Scoring Models in
Eqyptian Banks. Banks and Bank Systems, 2 (1), 4-20.
Alexandru, C. (2011). Consumer Credit Scoring. Romanian Journal of Economic Forecasting, 3, 162-
177.
Altman, E. I. (1968). Financial Ratios, Discriminant Analysis and the Prediction of Corporate. Journal of
Finance, 23 (4), 589-609.
Anderson, D. (1982). Small Industry in Developing Countries: A Discussion of Issues. World
Development, 10(11), 913-948.
Anderson, T. W. (2003). An Introduction to Multivariate Statistical Analysis. New York: Wiley-
Interscience.
Baku, E., & Smith, M. (1998). Loan Delinquency in Community Lending Organizations: Case Studies of
NeighborWorks Organizations. Housing Policy Debate, 9 (1), 151-175.
Balogun, E. D., & Alimi, A. (1988). Loan Delinquency Among Small Farmers in Developing Countries:
A Case Study of the Small – Farmer Credit Programme in Lagos State of Nigeria. CBN Economic
and Financial Review, 26(3).
Barakova, I., Glennon, D., & Palvia, A. A. (2011, August 30). Adjusting for Sample Selection Bias in
Acquisition Credit Scoring Models. Working Paper Series , 1-40.
Berger, A. N., & Frame, W. S. (2007). Small Business Credit Scoring and Credit Availability. Journal of
Small Business Management, 45 (1), 5-22.
Boritz, J. E. (1991). The “Going Concern” Assumption: Accounting and Auditing Indications.
Brien, K. O. (2008, August 18). Sample Scoring Model With Comments To Assess SME Loan Requests. Jordan Economic Development Program (SABEQ) .
Chijoriga, M. M. (2011). Application of multiple discriminant analysis (MDA) as a credit scoring and risk assessment model . International Journal of Emerging Markets, 6 (2), 132-147.
Charalambous, C., Charitou, A., & Neophytou, E. (2000). Predicting Corporate Failure: Empirical
Evidence for the UK. European Accounting Review, 13 (3), 1-30.
Emel, A. B., Oral, M., Reisman, A., & Yolalan, R. (2003). A credit scoring approach for the commercial
banking sector. Socio-Economic Planning Sciences, 37, 103–123.
Desai, V. S., J., N. C., & G., A. O. (1996). A Comparison of Neural Networks and Linear Scoring Models
in the Credit Union Environment. European Journal of Operational Research, 95, 24-37.
Dilawar, I. (2011). NPL‟s of banks, DFIs skyrocket to Rs629.55b.
Dimitriu, M., Avramescu, E. A., & Caracota, R. C. (2010). Credit Scoring For Individuals. Journal of
Economy - Management series, 13 (2), 361-377.
Hand, D. J. (1981). Discrimination and Classification. New York: John Wiley & Sons Inc. .
Hand, D. J., & Henley, W. E. (1997). Statistical Classification Methods in Consumer Credit Scoring: A
Review. Journal of the Royal Statistical Society, 160(3), 523-541.
Jones, F. L. (1987). Current Techniques in Bankruptcy Prediction. Journal of Accounting Literature ,
131-164.
Kanwar, A. A. (2005). Risk Management for Banks. Journal of Market Forces, 1(1), 1-7.

www.ijbcnet.com International Journal of Business and Commerce Vol. 2, No.5: Jan 2013[01-26]
(ISSN: 2225-2436)
Published by Asian Society of Business and Commerce Research 22
Keasey, K., & Watson, R. (1987). Non-financial systems and the prediction of small company failure: a
test of Argenti‟s hypotheses. Journal of Business Finance & Accounting, 14 (3), 335-354.
Kiefer, N. M., & Larson, C. E. (2006). Specification and Informational Issues in Credit Scoring.
International Journal of Statistics and Management Systems, 1, 152-178.
Kocenda, E., & Vojtek, M. (2009). Default Predictors and Credit Scoring Models for Retail Banking.
CESIFO Working Paper No. 2862, Category 12: Empirical and Theoretical Methods.
Lee, T. C., Chiu, C. L., & I., C. (2002). Credit Scoring Using the Hybrid Neural Discriminant Technique . Expert Systems with Applications, 23, 245-254.
Lee, T. C., I. Chen. (2005). A Two-Stage Hybrid Credit Scoring Model Using Artificial Neural Networks
and Multivariate Adaptive Regression Splines. Expert Systems with Applications, 28, 743-752.
Lieli, R. P., & White, H. (2010). The Construction of Empirical Credit Scoring Models Based on
Maximization Principles. Journal of Econometrics, 157 (1), 110-119.
Marquez, J. (2008, February 1). An Introduction to Credit Scoring For Small and Medium Size
Enterprises. Journal of Microfinance Risk Management , 1-47.
McDonald, A., & Eastwood, G. (2000, December 7). Credit Risk Rating at Australian Banks. Working Paper , 3-30.
Mester, L. (1997, September/October). What's the Point of Credit Scoring? Federal Reserve Bank of Philadelphia Business Review , 3-16.
Obamuyi, T. M. (2007). An Exploratory Study of Loan Deliquency Among Small and Medium Enterprises (SMEs) in Ondo State of Nigeria. Labour and Management In Development, 8, 1-10.
Orgler, Y. E. (1971). Evaluation of Bank Consumer Loans with Credit Scoring Models. Journal of Bank Research , 29, 31-37.
Saleem, F. (2009). Pakistan and the Global Financial Crisis. Center for Research & Security Studies, 2-7.
Siddiqui, N. (2006). Credit Risk Scorecards: Developing and Implementing Intelligent Credit Scoring.
New Jersey: John Wiley & Sons, Inc.
Sullivan, A. (1981). Consumer Finance, in Altman, E.I. Financial Handbook. New York: John Wiley &
Sons.
Schreiner, M. (2000). Credit Scoring for Microfinance: Can It Work? Journal of Microfinance Risk
Management, 2(2), 105-118.
Smith, M. M. (2006, October 24). Recent Developments in Credit Scoring. Conference Summary .
Steenackers, A., & Goovaerts, M. J. (1989). A Credit Scoring Model for Personal Loans. Insurance:
Mathematics and Economics, 8, 31-34.
Thomas, L. C., Edelman, D. B., & Crook, L. N. (2002). Credit Scoring and its Applications.Philadelphia:
Society for Industrial and Applied Mathematics.
Warner, J. (1977). Bankruptcy Costs: Some Evidence. The Journal of Finance , 337-347.
Weingartner, H. Martin (1966). The Generalized Rate of Return. Journal of Financial and Quantitative
Analysis, 1, 1-29
Zavgren, C. (1983). The Prediction of Corporate Failure: The State of the Art. Journal of Accounting
Literature, 2, 1-38.

www.ijbcnet.com International Journal of Business and Commerce Vol. 2, No.5: Jan 2013[01-26]
(ISSN: 2225-2436)
Published by Asian Society of Business and Commerce Research 23
9. Appendix
Questionnaire on Importance of Ratios in Loan Evaluation
Instruction: Please indicate your level of agreement with each of the following ratios.Based on the scale
of 1-5, kindly indicate an extremely important ratio by giving 1 point and 5 points to indicate an
extremely unimportant one.
Sr. # Financial Ratios Extremely
Important
Important Neutral Unimportant Extremely
Unimportant
1 Current Ratio 1 2 3 4 5
2 Quick Ratio 1 2 3 4 5
3 Gross Profit Margin 1 2 3 4 5
4 Operating Income Margin 1 2 3 4 5
5 Net margin 1 2 3 4 5
6 Return on Assets (ROA) 1 2 3 4 5
7 Return on Investment (ROI) 1 2 3 4 5
8 Return on Equity (ROE) 1 2 3 4 5
9 Sales growth (in past 2 years) 1 2 3 4 5
10 Debt to Equity 1 2 3 4 5
11 Capitalization Ratio 1 2 3 4 5
12 Total Debts to Assets 1 2 3 4 5
13 LTD to Net Working Capital 1 2 3 4 5
14 Interest Coverage Ratio 1 2 3 4 5
15 Debt Service Coverage Ratio 1 2 3 4 5
16 Cash Turnover 1 2 3 4 5
17 Total Asset Turnover 1 2 3 4 5
18 Fixed Asset Turnover 1 2 3 4 5
19 Current Asset Turnover 1 2 3 4 5
20 Receivable Turnover - days 1 2 3 4 5
21 Payable Turnover - days 1 2 3 4 5
22 Earnings Per Share (EPS) 1 2 3 4 5
23 Dividends Per Share (DPS) 1 2 3 4 5
24 Dividend Payout Ratio 1 2 3 4 5
25 Book Value Per Share 1 2 3 4 5
26 Market to Book Ratio 1 2 3 4 5
27 Debt leverage 1 2 3 4 5
28 Credit Rating 1 2 3 4 5
www.ijbcnet.com International Journal of Business and Commerce Vol. 2, No.5: Jan 2013[01-26]
(ISSN: 2225-2436)
Published by Asian Society of Business and Commerce Research 24
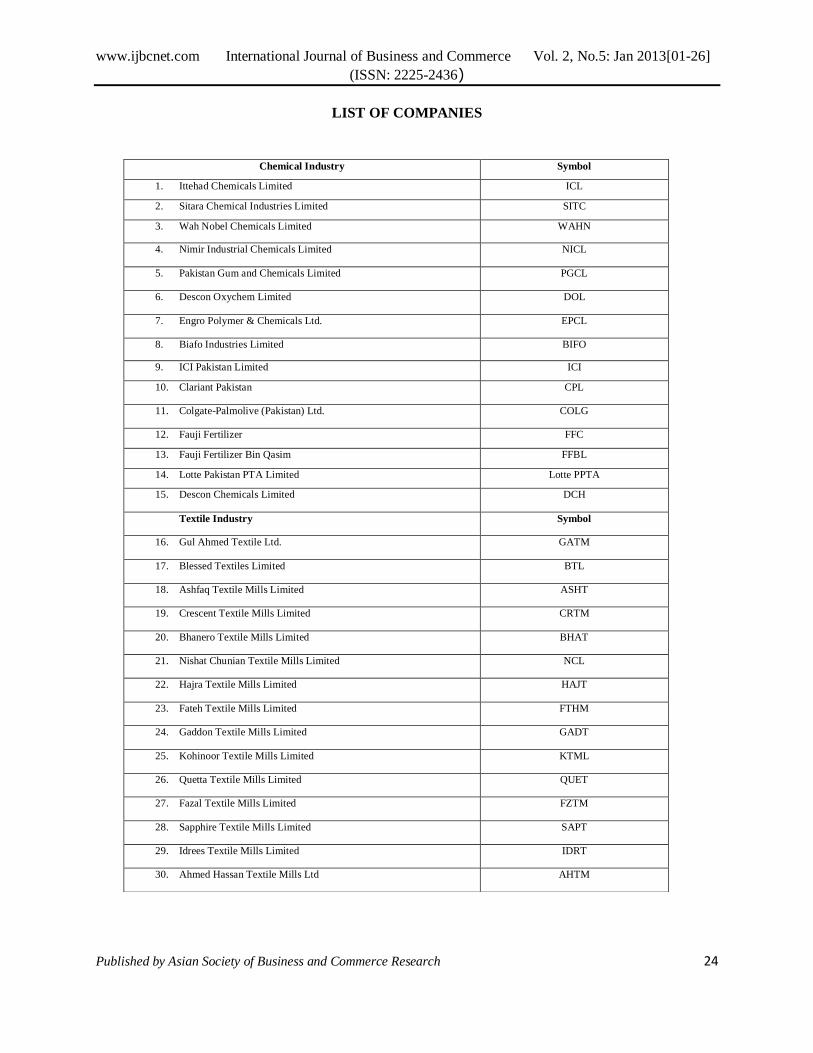
LIST OF COMPANIES
Chemical Industry Symbol
1. Ittehad Chemicals Limited ICL
2. Sitara Chemical Industries Limited SITC
3. Wah Nobel Chemicals Limited WAHN
4. Nimir Industrial Chemicals Limited NICL
5. Pakistan Gum and Chemicals Limited PGCL
6. Descon Oxychem Limited DOL
7. Engro Polymer & Chemicals Ltd. EPCL
8. Biafo Industries Limited BIFO
9. ICI Pakistan Limited ICI
10. Clariant Pakistan CPL
11. Colgate-Palmolive (Pakistan) Ltd. COLG
12. Fauji Fertilizer FFC
13. Fauji Fertilizer Bin Qasim FFBL
14. Lotte Pakistan PTA Limited Lotte PPTA
15. Descon Chemicals Limited DCH
Textile Industry Symbol
16. Gul Ahmed Textile Ltd. GATM
17. Blessed Textiles Limited BTL
18. Ashfaq Textile Mills Limited ASHT
19. Crescent Textile Mills Limited CRTM
20. Bhanero Textile Mills Limited BHAT
21. Nishat Chunian Textile Mills Limited NCL
22. Hajra Textile Mills Limited HAJT
23. Fateh Textile Mills Limited FTHM
24. Gaddon Textile Mills Limited GADT
25. Kohinoor Textile Mills Limited KTML
26. Quetta Textile Mills Limited QUET
27. Fazal Textile Mills Limited FZTM
28. Sapphire Textile Mills Limited SAPT
29. Idrees Textile Mills Limited IDRT
30. Ahmed Hassan Textile Mills Ltd AHTM

www.ijbcnet.com International Journal of Business and Commerce Vol. 2, No.5: Jan 2013[01-26]
(ISSN: 2225-2436)
Published by Asian Society of Business and Commerce Research 25
Table 110: Total Variance Explained
Compo
nent
Initial Eigenvalues Extraction Sums of Squared Loadings Rotation Sums of Squared Loadings
Total % of Variance Cumulative % Total % of Variance Cumulative % Total % of Variance Cumulative %
1 8.247 29.455 29.455 8.247 29.455 29.455 5.410 19.323 19.323
2 4.333 15.474 44.929 4.333 15.474 44.929 3.990 14.248 33.571
3 2.823 10.083 55.012 2.823 10.083 55.012 3.050 10.894 44.465
4 2.634 9.408 64.420 2.634 9.408 64.420 2.448 8.742 53.207
5 2.031 7.253 71.673 2.031 7.253 71.673 2.372 8.470 61.677
6 1.892 6.758 78.431 1.892 6.758 78.431 2.284 8.156 69.834
7 1.683 6.009 84.440 1.683 6.009 84.440 2.273 8.119 77.952
8 1.140 4.072 88.512 1.140 4.072 88.512 2.252 8.042 85.994
9 1.069 3.817 92.329 1.069 3.817 92.329 1.774 6.335 92.329
10 .695 2.482 94.811
11 .582 2.078 96.888
12 .526 1.880 98.768
13 .188 .670 99.438
14 .157 .562 100.000
15 1.645E-15 5.874E-15 100.000
16 8.847E-16 3.160E-15 100.000
17 6.782E-16 2.422E-15 100.000
18 4.710E-16 1.682E-15 100.000
19 2.511E-16 8.969E-16 100.000
20 2.211E-16 7.895E-16 100.000
21 1.528E-16 5.455E-16 100.000
22 -1.004E-17 -3.585E-17 100.000
23 -1.064E-16 -3.799E-16 100.000
24 -1.442E-16 -5.149E-16 100.000
25 -2.272E-16 -8.114E-16 100.000
26 -3.152E-16 -1.126E-15 100.000
27 -3.999E-16 -1.428E-15 100.000
28 -7.316E-16 -2.613E-15 100.000
Extraction Method: Principal Component Analysis.

www.ijbcnet.com International Journal of Business and Commerce Vol. 2, No.5: Jan 2013[01-26]
(ISSN: 2225-2436)
Published by Asian Society of Business and Commerce Research 26
Table
Trends in Non Performing Loans (NPLs)
(In Billion Rs.) 2006 2007 2008 2009
Non Performing Loans (NPLs) 218 218 359 446
Segment-wise NPLs to Loan Ratio of the Banking Sector
Corporate 6.5 7.2 8.9 12.6
Consumers 2.2 4.4 6.9 12.2
Source: State Bank of Pakistan
Figure : Segment Wise NPLs to Loan Ratio of the Banking Sector