Design and Development of a Self-Contained Trailing Static ...
34
Design and Development of a Self-Contained Trailing Static Pressure Measurement System Prototype Zachary Rotter * , Laura Smit * , Bohao Zhu † , Kirby Taylor * University of Washington, Seattle, WA, 98195, USA Todd Leighton, ‡ AeroTEC, Seattle, WA, 98108, USA Christopher W. Lum § Autonomous Flight Systems Laboratory, University of Washington, Seattle, WA, 98195, USA This paper describes the design, manufacturing, testing, and evaluation of a novel trail- ing pressure measurement system by a team of student engineers as part of an undergrad- uate senior capstone design project. The system is intended to be self-contained, housing all transducers and subsystems internally, with the capability to mount to any Part 23 and Part 25 aircraft. The system trails behind an aircraft during flight to obtain accurate at- mospheric data. The system utilizes a series of pitot-static tubes that relay information to static and differential pressure transducers. In addition to detailing the engineering design of the drogue, this paper outlines the testing campaign to validate its functionality. Nomenclature A Surface area in m 2 AFSL Autonomous Flight Systems Laboratory C D Drag coefficient C L Lift coefficient D Drag force in lbs DAS Data Acquisition System DE-15 three-row, 15-pin D subminiature DGPS Differential Global Positioning System Drogue Physical trailing pressure measurement system ESC Electronic Speed Control Fins Plastic symmetrical airfoils on the rear end of the fuselage Fuselage Aluminum tube that comprises the midsection of the drogue GND Ground Housing Aluminum tube attached to the primary aircraft that houses the drogue when it is not trailing IC Integrated Circuit I/O Input/Output MISO Master Input Slave Output MOSI Master Output Slave Input Nose cone Plastic cone attached to the front of the fuselage Outer shell Body subsystem consisting of the nose cone, tail cone, and fuselage Payload All electronic components on the plywood board inside the drogue * Undergraduate, Department of Aeronautics and Astronautics, Seattle, WA 98195, AIAA Student Member. † Undergraduate, Department of Electrical Engineering, Bothell, WA 98011, AIAA Student Member. ‡ Product Development Lead, AeroTEC - Aerospace Testing Engineering and Certification L.L.C, Inc., Seattle, WA, 98108 § Research Assistant Professor, Department of Aeronautics and Astronautics, Seattle, WA 98195, Member AIAA. 1 of 34 American Institute of Aeronautics and Astronautics Downloaded by UNIVERSITY OF WASHINGTON on January 16, 2019 | http://arc.aiaa.org | DOI: 10.2514/6.2019-0866 AIAA Scitech 2019 Forum 7-11 January 2019, San Diego, California 10.2514/6.2019-0866 Copyright © 2019 by Christopher Lum. Published by the American Institute of Aeronautics and Astronautics, Inc., with permission. AIAA SciTech Forum
Transcript of Design and Development of a Self-Contained Trailing Static ...

Design and Development of a Self-Contained Trailing
Static Pressure Measurement System Prototype
Zachary Rotter ∗, Laura Smit∗, Bohao Zhu†, Kirby Taylor∗
University of Washington, Seattle, WA, 98195, USA
Todd Leighton,‡
AeroTEC, Seattle, WA, 98108, USA
Christopher W. Lum§
Autonomous Flight Systems Laboratory, University of Washington, Seattle, WA, 98195, USA
This paper describes the design, manufacturing, testing, and evaluation of a novel trail-ing pressure measurement system by a team of student engineers as part of an undergrad-uate senior capstone design project. The system is intended to be self-contained, housingall transducers and subsystems internally, with the capability to mount to any Part 23 andPart 25 aircraft. The system trails behind an aircraft during flight to obtain accurate at-mospheric data. The system utilizes a series of pitot-static tubes that relay information tostatic and differential pressure transducers. In addition to detailing the engineering designof the drogue, this paper outlines the testing campaign to validate its functionality.
Nomenclature
A Surface area in m2
AFSL Autonomous Flight Systems LaboratoryCD Drag coefficientCL Lift coefficientD Drag force in lbsDAS Data Acquisition SystemDE-15 three-row, 15-pin D subminiatureDGPS Differential Global Positioning SystemDrogue Physical trailing pressure measurement systemESC Electronic Speed ControlFins Plastic symmetrical airfoils on the rear end of the fuselageFuselage Aluminum tube that comprises the midsection of the drogueGND GroundHousing Aluminum tube attached to the primary aircraft that houses the drogue when it is not trailingIC Integrated CircuitI/O Input/OutputMISO Master Input Slave OutputMOSI Master Output Slave InputNose cone Plastic cone attached to the front of the fuselageOuter shell Body subsystem consisting of the nose cone, tail cone, and fuselagePayload All electronic components on the plywood board inside the drogue
∗Undergraduate, Department of Aeronautics and Astronautics, Seattle, WA 98195, AIAA Student Member.†Undergraduate, Department of Electrical Engineering, Bothell, WA 98011, AIAA Student Member.‡Product Development Lead, AeroTEC - Aerospace Testing Engineering and Certification L.L.C, Inc., Seattle, WA, 98108§Research Assistant Professor, Department of Aeronautics and Astronautics, Seattle, WA 98195, Member AIAA.
1 of 34
American Institute of Aeronautics and Astronautics
Dow
nloa
ded
by U
NIV
ER
SIT
Y O
F W
ASH
ING
TO
N o
n Ja
nuar
y 16
, 201
9 | h
ttp://
arc.
aiaa
.org
| D
OI:
10.
2514
/6.2
019-
0866
AIAA Scitech 2019 Forum
7-11 January 2019, San Diego, California
10.2514/6.2019-0866
Copyright © 2019 by Christopher Lum. Published by the American Institute of Aeronautics and Astronautics, Inc., with permission.
AIAA SciTech Forum

Payload mount Metal angles that keep the payload in placePLA Polylactic AcidPPT Precision Pressure TransducerPrimary aircraft Aircraft the drogue trails behindPWR PowerRC Remote ControlRS-232 Recommended Standard 232RTD Resistance Temperature DetectorRX ReceiveSCLK Serial ClockSPI Serial Peripheral InterfaceSS Slave SelectTail cone Plastic cone attached to the rear of the fuselageTTL Transistor-to-Transistor LogicTX TransmitUAS Unmanned Aircraft SystemsUW University of WashingtonVGA Video Graphics ArrayWinch Motor and reel that lets out the drogue and returns it to the housing
I. Executive Summary
Aircraft use pressure measurements obtained by onboard sensors to monitor their altitude and velocity inflight. Due to airflow over the body of an aircraft during flight, there is some error intrinsic to the pressuremeasurements taken from the onboard sensors. The measurement instruments are calibrated using readingsof the static pressure in front or behind the aircraft. Current systems used to measure this freestream staticpressure include nose booms, which extend static pressure sensors in front of the aircraft, and trailing cones,which measure the pressure behind the aircraft. While the current calibration systems provide accurate pres-sure data, mounting these systems to the aircraft has proven to be cumbersome and structurally invasive.In addition, in the case of trailing cones, different cones must be used for different speed tests, as well as fordifferent sized aircraft. To investigate the feasibility of a potential solution to some of these concerns, thisproject was initiated.
The purpose of this project was to design a self-contained trailing pressure measurement system to beused during flight testing. The requirements laid out included maintaining the accuracy of the pressuremeasurements obtained from trailing pressure cones, including enough power for at least four hours of flighttime, and reducing the amount of modifications to an aircraft necessary to mount the system. From theserequirements, a final prototype was designed with a symmetric, three fin configuration. This layout is shownin Fig. 1. The body of the prototype was constructed using bent aluminum and 3D printed parts. Pitot-static tubes were mounted in the leading edge of each fin. Both the nose and tail of the prototype weredesigned to be removable in order to access all internal components. The final prototype body had a totallength of 32 in and a diameter of 4.25 in
2 of 34
American Institute of Aeronautics and Astronautics
Dow
nloa
ded
by U
NIV
ER
SIT
Y O
F W
ASH
ING
TO
N o
n Ja
nuar
y 16
, 201
9 | h
ttp://
arc.
aiaa
.org
| D
OI:
10.
2514
/6.2
019-
0866
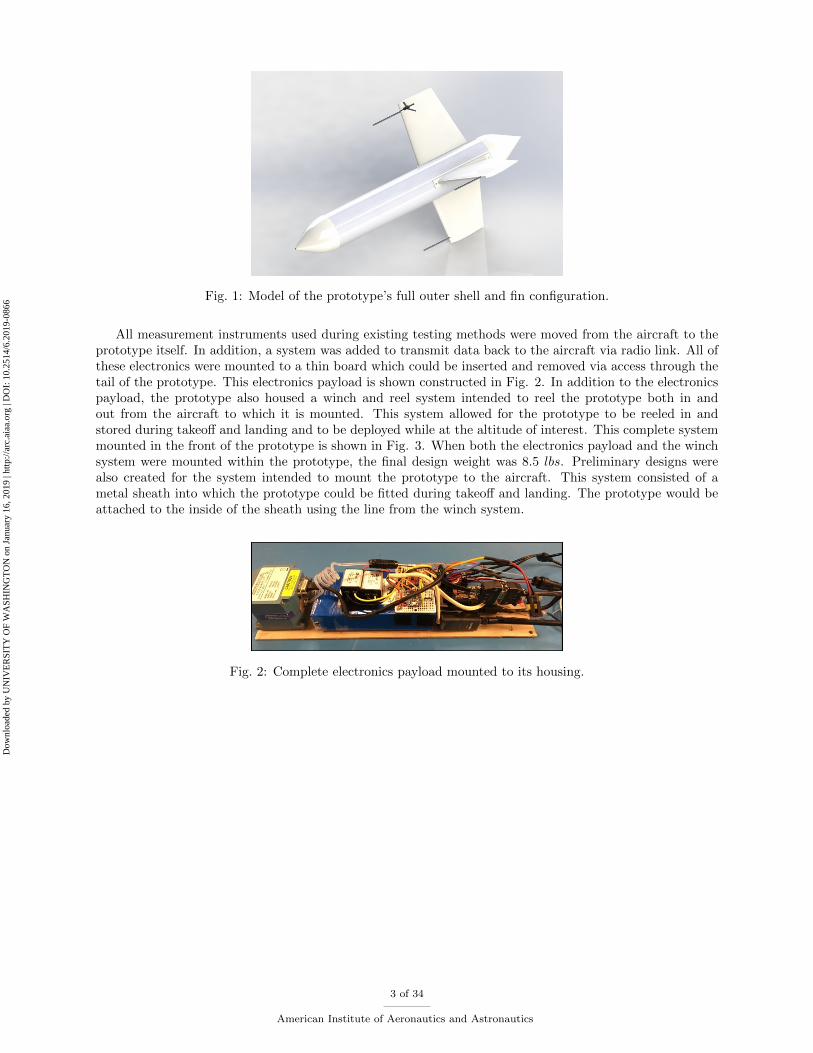
Fig. 1: Model of the prototype’s full outer shell and fin configuration.
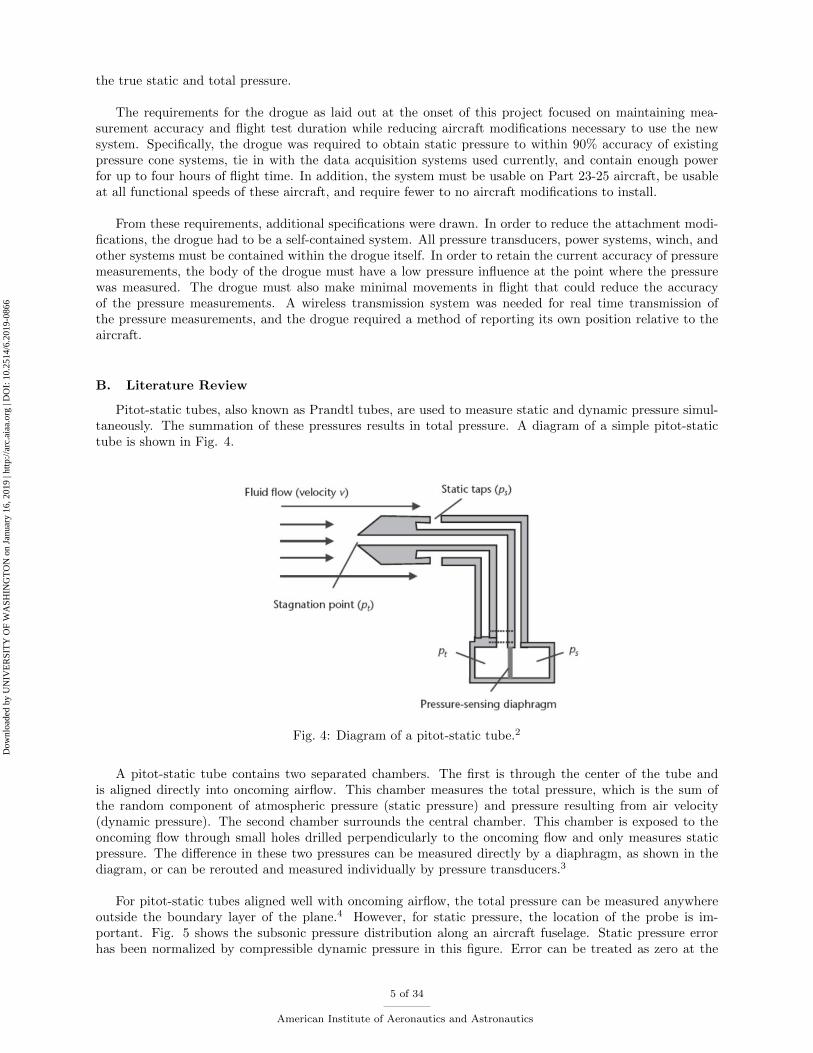
All measurement instruments used during existing testing methods were moved from the aircraft to theprototype itself. In addition, a system was added to transmit data back to the aircraft via radio link. All ofthese electronics were mounted to a thin board which could be inserted and removed via access through thetail of the prototype. This electronics payload is shown constructed in Fig. 2. In addition to the electronicspayload, the prototype also housed a winch and reel system intended to reel the prototype both in andout from the aircraft to which it is mounted. This system allowed for the prototype to be reeled in andstored during takeoff and landing and to be deployed while at the altitude of interest. This complete systemmounted in the front of the prototype is shown in Fig. 3. When both the electronics payload and the winchsystem were mounted within the prototype, the final design weight was 8.5 lbs. Preliminary designs werealso created for the system intended to mount the prototype to the aircraft. This system consisted of ametal sheath into which the prototype could be fitted during takeoff and landing. The prototype would beattached to the inside of the sheath using the line from the winch system.
Fig. 2: Complete electronics payload mounted to its housing.
3 of 34
American Institute of Aeronautics and Astronautics
Dow
nloa
ded
by U
NIV
ER
SIT
Y O
F W
ASH
ING
TO
N o
n Ja
nuar
y 16
, 201
9 | h
ttp://
arc.
aiaa
.org
| D
OI:
10.
2514
/6.2
019-
0866

Fig. 3: Final winch as assembled.
During the design process, multiple forms of analysis and verification were implemented. Computationalfluid dynamics analysis was used to estimate the total drag of the prototype while in flight and the properlocation for the pitot-static tubes. Finite element analysis was also used to determine the total deformationand factor of safety on the winch system. Ground tests were performed to determine the stability of potentialconfigurations, particularly in roll. Final verification tests were used to verify the pressure and tempera-ture collection and data transmission systems, to find the range of data transmission, and to determine theamount of force the winch system could reel in. Following these verification tests, it was determined thatstatic pressure, differential pressure, and temperature readings could be successfully gathered and transmit-ted while in motion. The wireless transmission link was found to be successful up to a distance of 950 ft,and the winch could successfully reel in and out a tested weight of 11.4 lbs.
II. Introduction
A. Problem Statement
Accurate knowledge of atmospheric data is crucial to safe and successful flights. Aircraft use atmosphericdata, including total pressure and static pressure, to determine the plane’s true airspeed, altitude, rate ofclimb, and many other important metrics. Aircraft possess onboard sensors to measure raw data from the air,but because of the plane’s turbulent effect on the air surrounding it, these measurements must be calibratedbefore being considered a reliable source of information for onboard flight computers and pilots. There area number methods used to collect true atmospheric data, but the most common is trailing cones.
Trailing cones operate by extending a long tube 1.5 to 2 plane lengths behind an aircraft.1 Becausethis point lies in air that is minimally affected by the plane, this provides a realistic measurement of theatmospheric static and total pressures. Pressure cones are discussed in more detail in the literature reviewof this document. While trailing cones are a reliable and accurate method of collecting this data, there aresome aspects of their use that can be improved. In some cases, in order to mount and wire the trailing conesystem to the aircraft, invasive and costly modifications to the aircraft’s vertical tail are necessary. Largereeling systems inside the aircraft are necessary to run thick tubing out of the aircraft. While this is aninconvenience when testing large aircraft, it can be problematic in smaller models. Also, long tubing resultsin a pressure lag, resulting in delayed responses when pressures change quickly.
The purpose of this project was to design a functional prototype of a trailing pressure measurement sys-tem intended address these issues with trailing cones. This physical system will be referred to as a drogue.The drogue was designed to be towed behind an aircraft in the minimally disturbed freestream air to measure
4 of 34
American Institute of Aeronautics and Astronautics
Dow
nloa
ded
by U
NIV
ER
SIT
Y O
F W
ASH
ING
TO
N o
n Ja
nuar
y 16
, 201
9 | h
ttp://
arc.
aiaa
.org
| D
OI:
10.
2514
/6.2
019-
0866
the true static and total pressure.
The requirements for the drogue as laid out at the onset of this project focused on maintaining mea-surement accuracy and flight test duration while reducing aircraft modifications necessary to use the newsystem. Specifically, the drogue was required to obtain static pressure to within 90% accuracy of existingpressure cone systems, tie in with the data acquisition systems used currently, and contain enough powerfor up to four hours of flight time. In addition, the system must be usable on Part 23-25 aircraft, be usableat all functional speeds of these aircraft, and require fewer to no aircraft modifications to install.
From these requirements, additional specifications were drawn. In order to reduce the attachment modi-fications, the drogue had to be a self-contained system. All pressure transducers, power systems, winch, andother systems must be contained within the drogue itself. In order to retain the current accuracy of pressuremeasurements, the body of the drogue must have a low pressure influence at the point where the pressurewas measured. The drogue must also make minimal movements in flight that could reduce the accuracyof the pressure measurements. A wireless transmission system was needed for real time transmission ofthe pressure measurements, and the drogue required a method of reporting its own position relative to theaircraft.
B. Literature Review
Pitot-static tubes, also known as Prandtl tubes, are used to measure static and dynamic pressure simul-taneously. The summation of these pressures results in total pressure. A diagram of a simple pitot-statictube is shown in Fig. 4.
Fig. 4: Diagram of a pitot-static tube.2
A pitot-static tube contains two separated chambers. The first is through the center of the tube andis aligned directly into oncoming airflow. This chamber measures the total pressure, which is the sum ofthe random component of atmospheric pressure (static pressure) and pressure resulting from air velocity(dynamic pressure). The second chamber surrounds the central chamber. This chamber is exposed to theoncoming flow through small holes drilled perpendicularly to the oncoming flow and only measures staticpressure. The difference in these two pressures can be measured directly by a diaphragm, as shown in thediagram, or can be rerouted and measured individually by pressure transducers.3
For pitot-static tubes aligned well with oncoming airflow, the total pressure can be measured anywhereoutside the boundary layer of the plane.4 However, for static pressure, the location of the probe is im-portant. Fig. 5 shows the subsonic pressure distribution along an aircraft fuselage. Static pressure errorhas been normalized by compressible dynamic pressure in this figure. Error can be treated as zero at the
5 of 34
American Institute of Aeronautics and Astronautics
Dow
nloa
ded
by U
NIV
ER
SIT
Y O
F W
ASH
ING
TO
N o
n Ja
nuar
y 16
, 201
9 | h
ttp://
arc.
aiaa
.org
| D
OI:
10.
2514
/6.2
019-
0866

highlighted points 1-6. One of points 2-5 are is the chosen location of the onboard static pressure port.Points 1 and 6, the points far in front of and behind the aircraft, allow for the widest physical range toplace a static probe, so these points are often chosen as a reference point used to calibrate the onboard sen-sors. These points are reached using methods such as nose booms for the front, or trailing cones for the back.
Fig. 5: Plot of typical static pressure error.4
Several methods exist to obtain true atmospheric pressure measurements required for onboard sensorcalibration. These methods include tower fly-bys, a pacer aircraft, a nose boom, a trailing bomb, or a trail-ing cone. Due to limitations in altitude and need for expensive equipment, fly-bys and pacer aircrafts aregenerally not preferred.
Nose booms extend a pitot-static tube directly in front of the aircraft to a position of 1 to 1.5 wingspans infront of the wings.1 The pressure port is placed such that it takes measurements upstream of any fluctuationsin the surrounding pressure field resulting from the influence of the aircraft’s body.5 This method can beused to accurately determine a plane’s airspeed and altitude, but it requires intensive modifications to aplane’s structure. Because of this, nose booms are generally avoided in Part 23 and 25 aircraft. A typicalsetup for testing with a nose boom setup is shown in Fig. 6.
Fig. 6: Typical nose boom system setup.1
The most common method used today to gather atmospheric pressure data is by use of trailing cones andbombs. These systems consist of a long segment of pressure tubing with a static port aft of the aircraft. Atrailing bomb, which uses a self stabilizing weight to keep the pitot-static tube below the wake of the aircraftand oriented into the oncoming wind, is appropriate at low speeds. At higher speeds, trailing bombs becomenaturally unstable, and a drag inducing cone is more appropriate. For these setups, a perforated cone liesbehind the static port to stabilize the tubing and a metal wire runs along the tubing to support the drag onthe cone. A diagram of a basic trailing cone and trailing bomb setup is shown in Fig. 7.
6 of 34
American Institute of Aeronautics and Astronautics
Dow
nloa
ded
by U
NIV
ER
SIT
Y O
F W
ASH
ING
TO
N o
n Ja
nuar
y 16
, 201
9 | h
ttp://
arc.
aiaa
.org
| D
OI:
10.
2514
/6.2
019-
0866
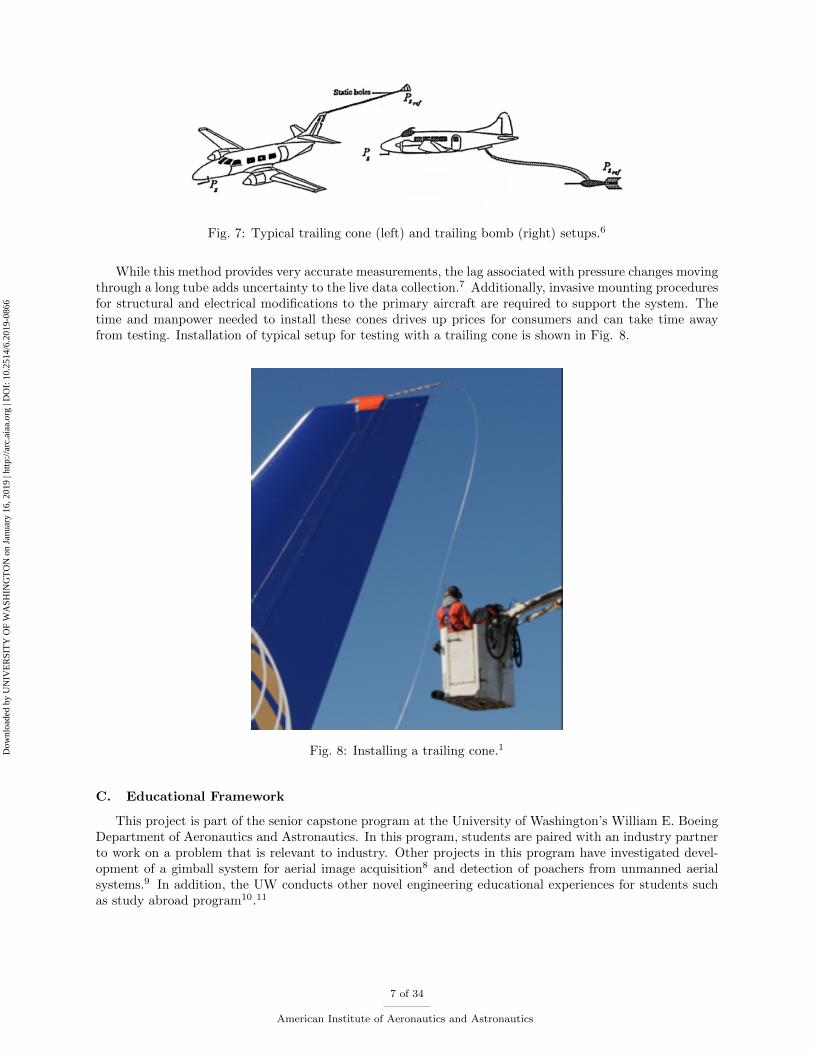
Fig. 7: Typical trailing cone (left) and trailing bomb (right) setups.6
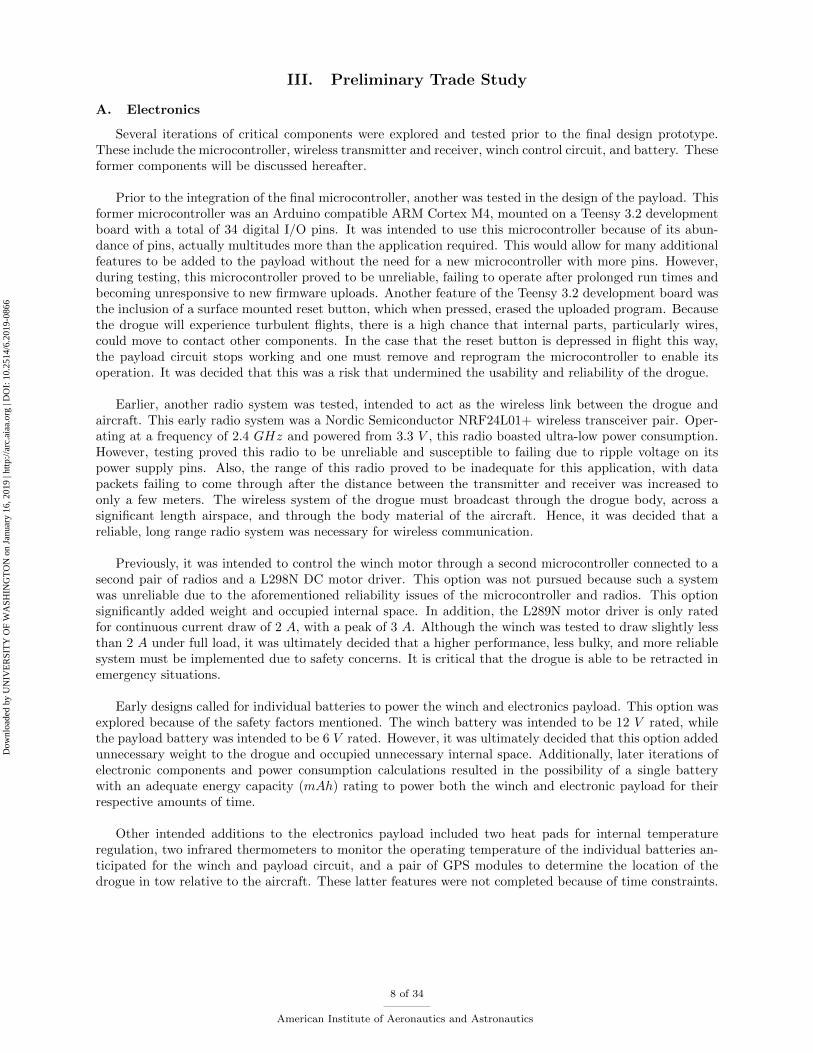
While this method provides very accurate measurements, the lag associated with pressure changes movingthrough a long tube adds uncertainty to the live data collection.7 Additionally, invasive mounting proceduresfor structural and electrical modifications to the primary aircraft are required to support the system. Thetime and manpower needed to install these cones drives up prices for consumers and can take time awayfrom testing. Installation of typical setup for testing with a trailing cone is shown in Fig. 8.
Fig. 8: Installing a trailing cone.1
C. Educational Framework
This project is part of the senior capstone program at the University of Washington’s William E. BoeingDepartment of Aeronautics and Astronautics. In this program, students are paired with an industry partnerto work on a problem that is relevant to industry. Other projects in this program have investigated devel-opment of a gimball system for aerial image acquisition8 and detection of poachers from unmanned aerialsystems.9 In addition, the UW conducts other novel engineering educational experiences for students suchas study abroad program10.11
7 of 34
American Institute of Aeronautics and Astronautics
Dow
nloa
ded
by U
NIV
ER
SIT
Y O
F W
ASH
ING
TO
N o
n Ja
nuar
y 16
, 201
9 | h
ttp://
arc.
aiaa
.org
| D
OI:
10.
2514
/6.2
019-
0866
III. Preliminary Trade Study
A. Electronics
Several iterations of critical components were explored and tested prior to the final design prototype.These include the microcontroller, wireless transmitter and receiver, winch control circuit, and battery. Theseformer components will be discussed hereafter.
Prior to the integration of the final microcontroller, another was tested in the design of the payload. Thisformer microcontroller was an Arduino compatible ARM Cortex M4, mounted on a Teensy 3.2 developmentboard with a total of 34 digital I/O pins. It was intended to use this microcontroller because of its abun-dance of pins, actually multitudes more than the application required. This would allow for many additionalfeatures to be added to the payload without the need for a new microcontroller with more pins. However,during testing, this microcontroller proved to be unreliable, failing to operate after prolonged run times andbecoming unresponsive to new firmware uploads. Another feature of the Teensy 3.2 development board wasthe inclusion of a surface mounted reset button, which when pressed, erased the uploaded program. Becausethe drogue will experience turbulent flights, there is a high chance that internal parts, particularly wires,could move to contact other components. In the case that the reset button is depressed in flight this way,the payload circuit stops working and one must remove and reprogram the microcontroller to enable itsoperation. It was decided that this was a risk that undermined the usability and reliability of the drogue.
Earlier, another radio system was tested, intended to act as the wireless link between the drogue andaircraft. This early radio system was a Nordic Semiconductor NRF24L01+ wireless transceiver pair. Oper-ating at a frequency of 2.4 GHz and powered from 3.3 V , this radio boasted ultra-low power consumption.However, testing proved this radio to be unreliable and susceptible to failing due to ripple voltage on itspower supply pins. Also, the range of this radio proved to be inadequate for this application, with datapackets failing to come through after the distance between the transmitter and receiver was increased toonly a few meters. The wireless system of the drogue must broadcast through the drogue body, across asignificant length airspace, and through the body material of the aircraft. Hence, it was decided that areliable, long range radio system was necessary for wireless communication.
Previously, it was intended to control the winch motor through a second microcontroller connected to asecond pair of radios and a L298N DC motor driver. This option was not pursued because such a systemwas unreliable due to the aforementioned reliability issues of the microcontroller and radios. This optionsignificantly added weight and occupied internal space. In addition, the L289N motor driver is only ratedfor continuous current draw of 2 A, with a peak of 3 A. Although the winch was tested to draw slightly lessthan 2 A under full load, it was ultimately decided that a higher performance, less bulky, and more reliablesystem must be implemented due to safety concerns. It is critical that the drogue is able to be retracted inemergency situations.
Early designs called for individual batteries to power the winch and electronics payload. This option wasexplored because of the safety factors mentioned. The winch battery was intended to be 12 V rated, whilethe payload battery was intended to be 6 V rated. However, it was ultimately decided that this option addedunnecessary weight to the drogue and occupied unnecessary internal space. Additionally, later iterations ofelectronic components and power consumption calculations resulted in the possibility of a single batterywith an adequate energy capacity (mAh) rating to power both the winch and electronic payload for theirrespective amounts of time.
Other intended additions to the electronics payload included two heat pads for internal temperatureregulation, two infrared thermometers to monitor the operating temperature of the individual batteries an-ticipated for the winch and payload circuit, and a pair of GPS modules to determine the location of thedrogue in tow relative to the aircraft. These latter features were not completed because of time constraints.
8 of 34
American Institute of Aeronautics and Astronautics
Dow
nloa
ded
by U
NIV
ER
SIT
Y O
F W
ASH
ING
TO
N o
n Ja
nuar
y 16
, 201
9 | h
ttp://
arc.
aiaa
.org
| D
OI:
10.
2514
/6.2
019-
0866

B. Configuration and Shape
Early on, a shape with passive stability characteristics was settled on as the desired configuration forthe drogue. This was due to the short development timeline, which made an active control system unlikely.Therefore, a rocket shape fit the stability requirements. However, the fin configuration of the rocket shapestill needed to be decided. It became necessary to perform a rough aerodynamic analysis of each shape tocreate a set of trade offs between each fin configuration.
It was decided to test two possible fin configurations: a three-fin, trimetric configuration and a six-finconfiguration inspired by the Tomahawk cruise missile. It was hypothesized that the Tomahawk configura-tion would produce more lift than the three-fin configuration at a penalty of higher drag.
Using Star CCM+, a set of simulations were run were to obtain rough CD and CL values for the two finconfiguration designs. Both configurations were run at 300 K, standard sea level pressure, and an airspeedof 128.611 m/s, the maximum speed that the drogue would be reeled in at. Table 1 shows the approximateCD and CL values of each configuration.
Table 1: Lift and Drag Values
Configuration CD CL
Trimetric 0.49 0
Tomahawk 0.98 0.01
A drag reduction by a factor of almost two prompted the choice to use the three-fin configuration forthe remainder of the design process. The slight difference in lift was not enough to outweigh the cost of thedrag. Figures 9 and 10 show the pressure distribution around each fin configuration.
Fig. 9: Pressure map of the trimetric fin configuration
9 of 34
American Institute of Aeronautics and Astronautics
Dow
nloa
ded
by U
NIV
ER
SIT
Y O
F W
ASH
ING
TO
N o
n Ja
nuar
y 16
, 201
9 | h
ttp://
arc.
aiaa
.org
| D
OI:
10.
2514
/6.2
019-
0866
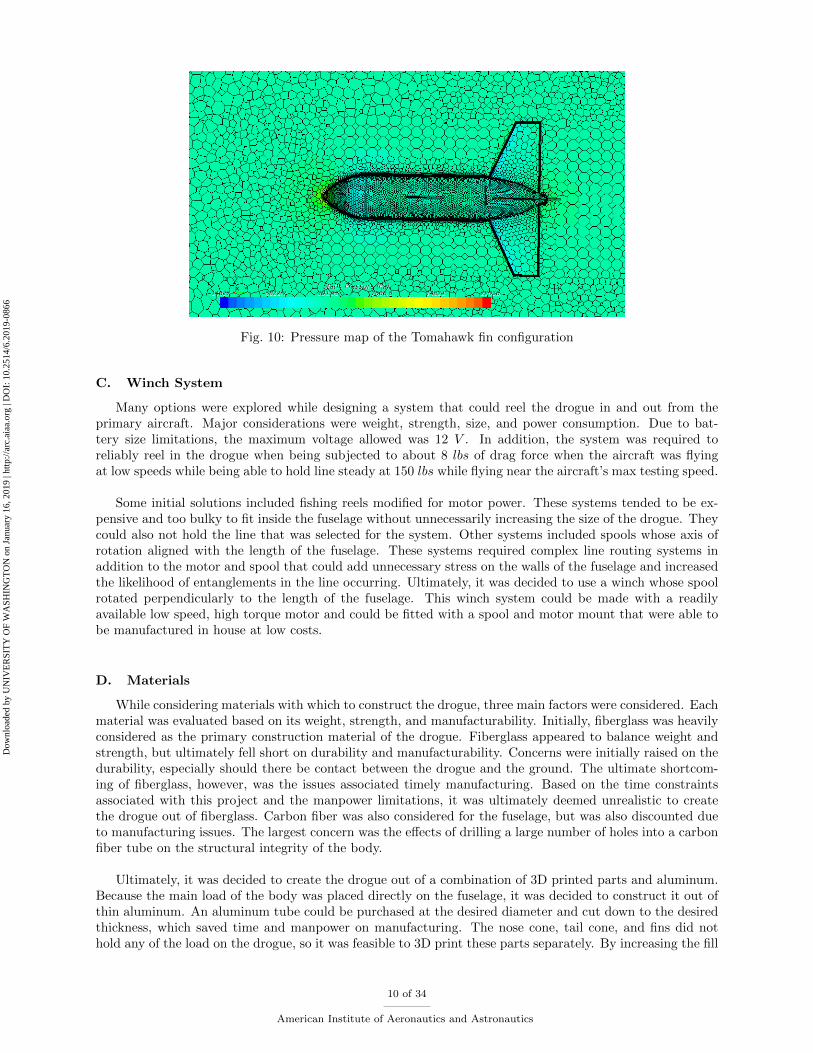
Fig. 10: Pressure map of the Tomahawk fin configuration
C. Winch System
Many options were explored while designing a system that could reel the drogue in and out from theprimary aircraft. Major considerations were weight, strength, size, and power consumption. Due to bat-tery size limitations, the maximum voltage allowed was 12 V . In addition, the system was required toreliably reel in the drogue when being subjected to about 8 lbs of drag force when the aircraft was flyingat low speeds while being able to hold line steady at 150 lbs while flying near the aircraft’s max testing speed.
Some initial solutions included fishing reels modified for motor power. These systems tended to be ex-pensive and too bulky to fit inside the fuselage without unnecessarily increasing the size of the drogue. Theycould also not hold the line that was selected for the system. Other systems included spools whose axis ofrotation aligned with the length of the fuselage. These systems required complex line routing systems inaddition to the motor and spool that could add unnecessary stress on the walls of the fuselage and increasedthe likelihood of entanglements in the line occurring. Ultimately, it was decided to use a winch whose spoolrotated perpendicularly to the length of the fuselage. This winch system could be made with a readilyavailable low speed, high torque motor and could be fitted with a spool and motor mount that were able tobe manufactured in house at low costs.
D. Materials
While considering materials with which to construct the drogue, three main factors were considered. Eachmaterial was evaluated based on its weight, strength, and manufacturability. Initially, fiberglass was heavilyconsidered as the primary construction material of the drogue. Fiberglass appeared to balance weight andstrength, but ultimately fell short on durability and manufacturability. Concerns were initially raised on thedurability, especially should there be contact between the drogue and the ground. The ultimate shortcom-ing of fiberglass, however, was the issues associated timely manufacturing. Based on the time constraintsassociated with this project and the manpower limitations, it was ultimately deemed unrealistic to createthe drogue out of fiberglass. Carbon fiber was also considered for the fuselage, but was also discounted dueto manufacturing issues. The largest concern was the effects of drilling a large number of holes into a carbonfiber tube on the structural integrity of the body.
Ultimately, it was decided to create the drogue out of a combination of 3D printed parts and aluminum.Because the main load of the body was placed directly on the fuselage, it was decided to construct it out ofthin aluminum. An aluminum tube could be purchased at the desired diameter and cut down to the desiredthickness, which saved time and manpower on manufacturing. The nose cone, tail cone, and fins did nothold any of the load on the drogue, so it was feasible to 3D print these parts separately. By increasing the fill
10 of 34
American Institute of Aeronautics and Astronautics
Dow
nloa
ded
by U
NIV
ER
SIT
Y O
F W
ASH
ING
TO
N o
n Ja
nuar
y 16
, 201
9 | h
ttp://
arc.
aiaa
.org
| D
OI:
10.
2514
/6.2
019-
0866

and thickness of these parts, manufacturablity and durability were optimized while keeping the total weightof the body low.
IV. System Architecture
A. Overall System Architecture
The drogue consisted of an outer shell with three symmetric fins mounted externally. This outer shell, aswell as the fin configuration, is shown in Fig. 11. The outer shell consisted of a fuselage in which all internalcomponents were mounted, a nose cone through which the plane attachment line was run, and a tail conefor added aerodynamics. Both the nose cone and the tail cone were designed for removability. This allowedfor access to all internal components. The fins mounted to the fuselage as well and contained housing forthe pitot-static tubes and their associated tubing.
Fig. 11: Isometric view of the drogue’s full outer shell and fin configuration.
Both the winch subsystem and the electronics payload were housed within the outer shell. The electricalinteractions between all electronics on the drogue, the drogue winch system, and the primary aircraft areshown in Fig. 12. The electronics payload was the driving factor for the size and configuration of the drogue,and as such will be discussed first.
11 of 34
American Institute of Aeronautics and Astronautics
Dow
nloa
ded
by U
NIV
ER
SIT
Y O
F W
ASH
ING
TO
N o
n Ja
nuar
y 16
, 201
9 | h
ttp://
arc.
aiaa
.org
| D
OI:
10.
2514
/6.2
019-
0866
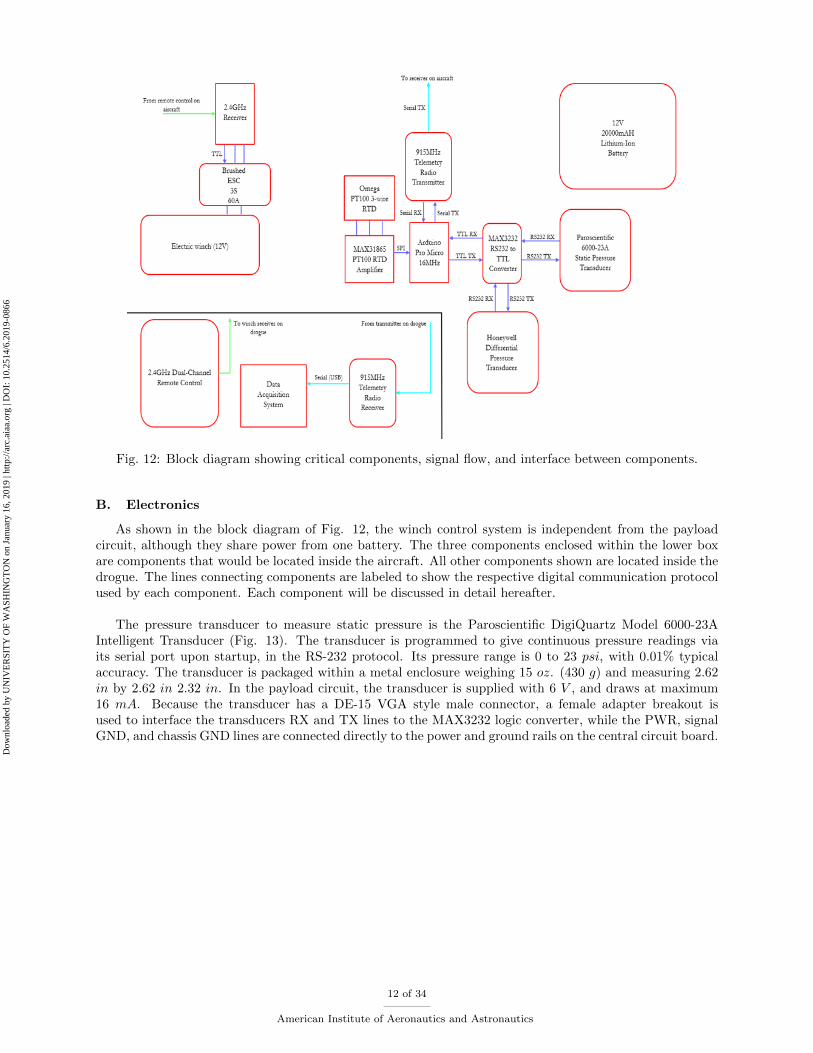
Fig. 12: Block diagram showing critical components, signal flow, and interface between components.
B. Electronics
As shown in the block diagram of Fig. 12, the winch control system is independent from the payloadcircuit, although they share power from one battery. The three components enclosed within the lower boxare components that would be located inside the aircraft. All other components shown are located inside thedrogue. The lines connecting components are labeled to show the respective digital communication protocolused by each component. Each component will be discussed in detail hereafter.
The pressure transducer to measure static pressure is the Paroscientific DigiQuartz Model 6000-23AIntelligent Transducer (Fig. 13). The transducer is programmed to give continuous pressure readings viaits serial port upon startup, in the RS-232 protocol. Its pressure range is 0 to 23 psi, with 0.01% typicalaccuracy. The transducer is packaged within a metal enclosure weighing 15 oz. (430 g) and measuring 2.62in by 2.62 in 2.32 in. In the payload circuit, the transducer is supplied with 6 V , and draws at maximum16 mA. Because the transducer has a DE-15 VGA style male connector, a female adapter breakout isused to interface the transducers RX and TX lines to the MAX3232 logic converter, while the PWR, signalGND, and chassis GND lines are connected directly to the power and ground rails on the central circuit board.
12 of 34
American Institute of Aeronautics and Astronautics
Dow
nloa
ded
by U
NIV
ER
SIT
Y O
F W
ASH
ING
TO
N o
n Ja
nuar
y 16
, 201
9 | h
ttp://
arc.
aiaa
.org
| D
OI:
10.
2514
/6.2
019-
0866

Fig. 13: Paroscientific DigiQuartz Model 6000-23A Intelligent Transmitter.
The pressure transducer to measure differential pressure is the Honeywell Precision Pressure Transducer(Fig. 14). The transducer is also programmed to give continuous differential pressure readings via its serialport upon startup, again in the RS-232 protocol. The PPT is packaged in a metal case weighing 5 oz. (142g ) and measuring 2.2 in by 0.975 in 1.8 in with two pressure input ports. It offers a typical accuracy of0.1%. In the payload circuit, the PPT is supplied with 6 V , and draws at maximum 35 mA. The connectoris a Honeywell specific 6-pin plastic round connector, in which solder cups are present to secure wires tothe respective pins. In the payload circuit, the RX and TX lines are interfaced with the MAX3232 logicconverter, while the PWR, common GND, and case GND are tied to the power and ground rails on thecentral circuit board.
Because the two pressure transducers communicate in the RS-232 protocol, a logic converter IC mustbe used to regulate the signal voltage levels to microcontroller TTL levels (5 V ). It was decided that theMAX3232 transceiver breakout board would be an ideal converter. This single board allows communicationbetween a microcontroller and two RS-232 devices. To communicate in 5 V TTL levels, the converter issupplied 5 V , although it can also be supplied 3.3 V for 3.3 V TTL levels. The converter breakout boardis only slightly longer than a quarter, requiring minimum space inside the drogue and adding a negligibleamount of mass. In the payload circuit, all 10 pins of the converter are used, two being 5 V and GND, andthe remaining eight being RX and TX lines, of which four are connected to the pressure transducers, and fourto the microcontroller. In hindsight, four lines can be negated, as neither transducer needs to receive anyserial data from the microcontroller, and the microcontroller does not need to transmit serial data to neithertransducer. Since both transducers are pre-programmed to give continuous serial output, the microcontrolleronly needs to read incoming serial data. However, it was decided to connect all RX and TX lines for quickprogramming of the transducers without disassembly, which can be done directly through the microcontroller,in the case an application calls for a change of settings such as pressure unit, sampling rate, or single readings.
To measure the ambient air temperature, it was decided to use a resistance temperature detector (RTD).The RTD for this prototype is an Omega Platinum PT100 Three-Wire RTD. This unit was chosen becauseof its proven reputation, with its popularity in industrial processes and its higher accuracy, repeatability,and stability compared to thermocouples. The operating temperature range is -200◦C to +500◦C, with atypical accuracy of 0.5◦C. To interface the RTD to the microcontroller, an amplifier circuit must be used.Made specifically for Omega RTDs, the MAX31865 amplifier was seen to be the obvious choice (Fig. 15).The amplifier circuit is contained within a small breakout board with screw terminals for the three legsof the RTD. The amplifier circuit communicates with the microcontroller via SPI using four lines (MISO,MOSI, SCLK, SS). Although compatible with 3.3 V supply voltage, the RTD amplifier is run at 5 V inthis application to keep consistency with other components and negating the need for a 3.3 V converter.A library is also used in the microcontroller program to read the resistance of the RTD and convert to Celsius.
13 of 34
American Institute of Aeronautics and Astronautics
Dow
nloa
ded
by U
NIV
ER
SIT
Y O
F W
ASH
ING
TO
N o
n Ja
nuar
y 16
, 201
9 | h
ttp://
arc.
aiaa
.org
| D
OI:
10.
2514
/6.2
019-
0866

Fig. 14: Honeywell Precision Pressure Transducer.
Fig. 15: MAX31865 amplifier board connected to PT100 RTD.
The radio system in use in the final prototype drogue consists of one pair of HKPilot 915 MHz telemetryradios (Fig. 16). These radios are a popular choice in many UAS applications. They are standalone unitsand communicate with the microcontroller via RX and TX pins, and with the DAS aboard the aircraftvia micro-USB cable. When connected to a computer, the user can also use a terminal program such asCoolTerm to view and record the live serial data. The radios run open-source firmware which is configurablethrough the Mission Planner software from ArduPilot. In this application, the transmitter radio inside the
14 of 34
American Institute of Aeronautics and Astronautics
Dow
nloa
ded
by U
NIV
ER
SIT
Y O
F W
ASH
ING
TO
N o
n Ja
nuar
y 16
, 201
9 | h
ttp://
arc.
aiaa
.org
| D
OI:
10.
2514
/6.2
019-
0866

drogue is configured to transmit serial data at full power (500 mW ), with 100% duty cycle (transmit 100%of the time). The receiver radio inside the aircraft has a receive sensitivity of -117 dBm and is configuredwith 0% duty cycle (receive 100% of the time). Once configured and bounded to communicate on samechannel, the transmitter/receiver pair typically establish a wireless link in several seconds after power-up.From testing, the telemetry radios have proved to be a reliable way of transmitting and receiving data fromthe drogue across adequate distances for this application.
Fig. 16: Pair of 915MHz telemetry radios in kit.
The central microcontroller is a 16 MHz 32-bit ATmega328u4 operating at 5 V , mounted on an ArduinoPro Micro board. This board is among the smallest Arduino compatible boards, measuring 1.30 in by .7 in.It occupies little room inside the drogue, while adding a negligible amount of weight. The microcontroller isprogrammed via a micro USB connector built into the board. 12 digital and 4 analog I/O pins are available,along with RX and TX hardware serial connections. With a rated operating temperature range of -40◦Cto +85◦C, it was decided that the Pro Micro would be an adequate microcontroller board for the environ-mental conditions the drogue would be exposed to. It has enough pins to implement the transmitter radio,temperature sensor, and read pressure measurements from the two pressure transducers. From testing, theArduino Pro Micro has proved to be reliable in various conditions, from laboratory to light rain.
15 of 34
American Institute of Aeronautics and Astronautics
Dow
nloa
ded
by U
NIV
ER
SIT
Y O
F W
ASH
ING
TO
N o
n Ja
nuar
y 16
, 201
9 | h
ttp://
arc.
aiaa
.org
| D
OI:
10.
2514
/6.2
019-
0866

Fig. 17: From left to right on breadboard: MAX3232 logic converter, MAX31865 amplifier, Arduino ProMicro microcontroller.
From power calculations and the required run time of the prototype system, the internal battery waschosen as a 12 V , 20000 mAh lithium-ion battery. The electronic payload has three distinct voltage levels:12 V for winch and its control circuit, 6 V for the pressure transducers, and 5 V for the microcontroller,logic converter, RTD, and radio. The battery has a barrel jack type connector, to which a three-way splitteris attached to split the voltage. To obtain 6 V and 5 V , two waterproof buck converter modules are used,which are capable of supplying 18 W and 15 W , respectively, and are rated at 96% efficiency. The remain-ing line of 12 V is wired directly to the winch ESC. From testing, the battery proved capable of 6+ hoursof continuous data transmission by the payload circuit. Shown in Fig. 18 is the complete electronics payload.
Fig. 18: Complete electronics payload board.
16 of 34
American Institute of Aeronautics and Astronautics
Dow
nloa
ded
by U
NIV
ER
SIT
Y O
F W
ASH
ING
TO
N o
n Ja
nuar
y 16
, 201
9 | h
ttp://
arc.
aiaa
.org
| D
OI:
10.
2514
/6.2
019-
0866

C. Outer Shell Design
The outer shell consists of the fuselage, nose cone, and tail cones. These three components were designedto interlock while in flight using self-drilling screws. This connection system allowed both the electronicspayload and the winch subsystem to be accessed via nose and tail cone removal. The winch subsystem wasaccessed through the nose cone and the electronics payload was accessed through the tail cone. The totallength of the outer shell was 32.3 in with an outer diameter of 4.3125 in. The total weight of the outer shelland fins was 8.5 lbs.
The fuselage was out of 0.03125 in aluminum sheeting. This sheeting was bent into a tube and rivetedtogether. The inner diameter of the tube was 4.25 in. This inner diameter was designed to be the minimumpossible while still housing the the electronics payload and winch subsystem with no interference. The totallength of the tube was 22 in. of this total length, 15 in were used to house the electronics payload, 5 in wereused to house the winch subsystem, and the remaining 2 in were used to used as clearance between thesetwo systems and the nose and tail cone attachments.
Both the nose and tail cones were 3D printed using PLA plastic. The designs for each are shown in Fig.19. The nose cone had a length of 4.8 in and an outer diameter of 4.3125 in. This outer diameter was chosento match the outer diameter of the fuselage. A 0.25 in diameter hole was cut into the front end of the nosecone. This allowed the aircraft attachment line to pass from the winch to the drogue housing on the primaryaircraft. The tail cone had a length of 5.5 in with an outer diameter 4.3125 in.
Both nose and tail cone were designed with a shelf which overlapped with the fuselage. This shelf allowsthe nose and tail cones to be attached to the fuselage. This connection was made with self drilling screws.These screws allowed the nose and tail cones to be removed from the fuselage as necessary for internal access.The shelf in the tail cone had three slices cut out to allow the tail cone to fit around the fin attachmentswhich extended through the fuselage. The nose cone had a similar cut out to add additional clearance forhe winch mounting system.
Fig. 19: The nose cone (left) and tail cones (right) which make up the outer shell of the drogue.
D. Fin Configuration
The fins were placed in a trimetric configuration at the aft end of the fuselage. The fins were equallyspaced around outer edge of the fuselage with one fin centered at the bottom edge of the fuselage. This
17 of 34
American Institute of Aeronautics and Astronautics
Dow
nloa
ded
by U
NIV
ER
SIT
Y O
F W
ASH
ING
TO
N o
n Ja
nuar
y 16
, 201
9 | h
ttp://
arc.
aiaa
.org
| D
OI:
10.
2514
/6.2
019-
0866

bottom fin was weighted with oz of weight. This weighting was designed to damp out some of the rolloscillations observed in the ground test, which is detailed later. Each fin was 3D printed out of PLA plastic.Figure 20 shows two completed fins mounted to the fuselage.
Fig. 20: Two fins with attached pitot static tubes mounted to the fuselage.
Each fin was designed using a NACA0012 airfoil. This shape was chosen for its symmetric design. Thefinal fins had a root length of 7 in, a tip length of 4.75 in, and a final length of 8 in. Additionally, each finwas mounted on an 0.124 in thick platform. It was this platform that was connected directly to the outsideof the fuselage.
Mounts to hold a pitot-static tube were built into the upper leading edge of each fin. Additionally,routing for each pressure line was integrated internal to the fins. This ensured that the pressure routing wassymmetric for each fin. Once the pressure lines were run and the pitot-static tubes were inserted into thefins, all external cuts in the fins were filled with caulk. This insured that the pitot-static tubes would stayin place during flight.
E. Pressure System
The pressure tubing system, displayed in Figure 21, takes raw static pressure and total pressure readingsfrom the pitot-static probes, transports them through a pneumatic connector, averages each type of pressurereading in a separate manifold, and delivers each averaged reading to a pressure sensor. While total pressureonly goes to the differential pressure sensor, static pressure is sent to both the static pressure transducerand differential pressure sensor.
In order to accurately measure pressure, the tubing system must transport air from the pitot-static probesto the pressure sensors with no leaks. Additionally, there must be several tubing size changes to accountfor the different inputs to the pressure sensors, pitot-static probes, pneumatic connector, and manifolds. Inorder to verify seals through every tube, each segment of tubing was checked for a seal by blocking off oneend of the tube and inserting a vacuum hand pump into the other end. In addition to each tube, each tubingsize change was also tested for a seal. Every tube and point at which tubing size changed was vacuum testedand proven to be sealed.
There were 2 tubing size changes that occurred in this tubing system: between the pitot-static probesand the pneumatic connector and between each manifold and each pressure sensor. The 0.08 in tubing thatruns from the pitot-static probe was sized down to 0.04 in tubing via a plastic 1/16 in fluid adapter fromIdex. This was done because the pneumatic connector takes 0.04 in tubing. The 0.04 in tubing that runsout of each manifold was sized up to 0.135 in tubing. This was done by inserting the 0.04 in tubing inside
18 of 34
American Institute of Aeronautics and Astronautics
Dow
nloa
ded
by U
NIV
ER
SIT
Y O
F W
ASH
ING
TO
N o
n Ja
nuar
y 16
, 201
9 | h
ttp://
arc.
aiaa
.org
| D
OI:
10.
2514
/6.2
019-
0866
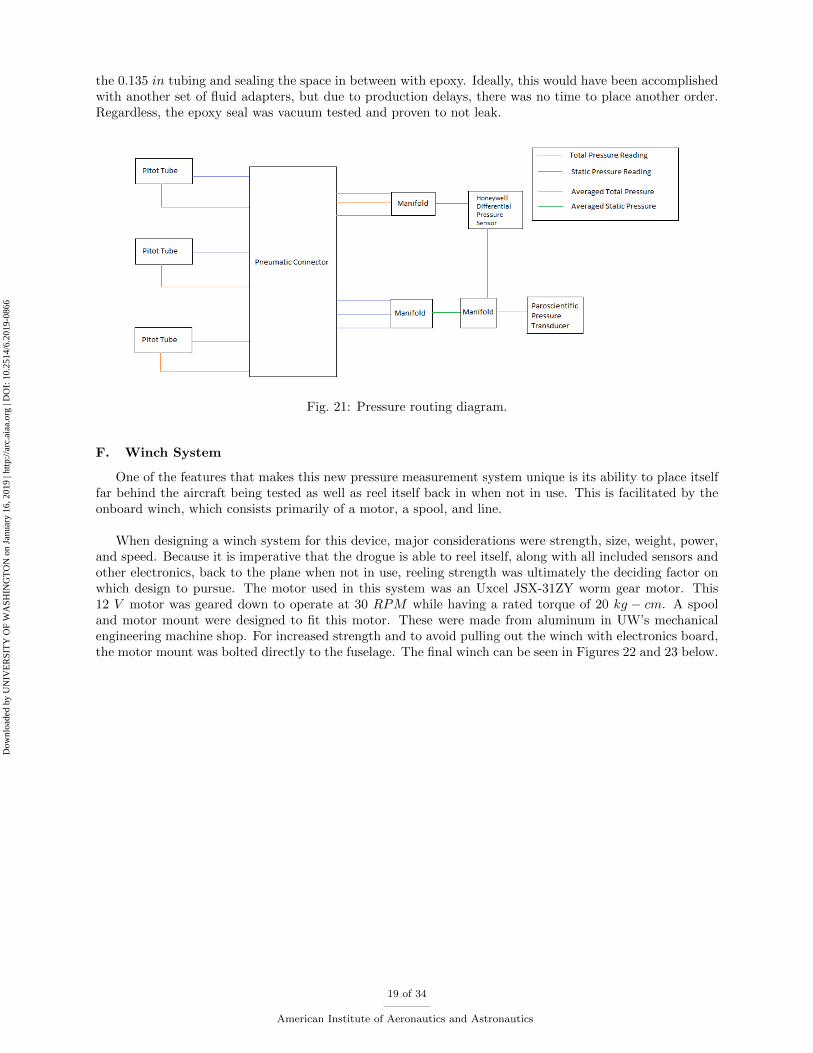
the 0.135 in tubing and sealing the space in between with epoxy. Ideally, this would have been accomplishedwith another set of fluid adapters, but due to production delays, there was no time to place another order.Regardless, the epoxy seal was vacuum tested and proven to not leak.
Fig. 21: Pressure routing diagram.
F. Winch System
One of the features that makes this new pressure measurement system unique is its ability to place itselffar behind the aircraft being tested as well as reel itself back in when not in use. This is facilitated by theonboard winch, which consists primarily of a motor, a spool, and line.
When designing a winch system for this device, major considerations were strength, size, weight, power,and speed. Because it is imperative that the drogue is able to reel itself, along with all included sensors andother electronics, back to the plane when not in use, reeling strength was ultimately the deciding factor onwhich design to pursue. The motor used in this system was an Uxcel JSX-31ZY worm gear motor. This12 V motor was geared down to operate at 30 RPM while having a rated torque of 20 kg − cm. A spooland motor mount were designed to fit this motor. These were made from aluminum in UW’s mechanicalengineering machine shop. For increased strength and to avoid pulling out the winch with electronics board,the motor mount was bolted directly to the fuselage. The final winch can be seen in Figures 22 and 23 below.
19 of 34
American Institute of Aeronautics and Astronautics
Dow
nloa
ded
by U
NIV
ER
SIT
Y O
F W
ASH
ING
TO
N o
n Ja
nuar
y 16
, 201
9 | h
ttp://
arc.
aiaa
.org
| D
OI:
10.
2514
/6.2
019-
0866

Fig. 22: Final winch as assembled.
Fig. 23: Winch mounted inside fuselage.
The line selected for this system was MRX-2 Dyneema Lashing Line. Often used for sailing applications,this line was selected for its strength and performance under normal operating conditions. The breakingstrength of this 2 mm diameter line is 880 lbs and elongates 0.2% at 20% of this breaking strength. It is alsoUV and temperature resistant. The durability of the line is critical as this system may possibly be operatedover populated environments.12
Due to the need of an independent control system for the winch, a reliable remote control system to oper-ate the motor was necessary. Ultimately, it was decided that a 60 A waterproof brushed ESC and a 2.4 GHzhand-held transmitter/receiver pair would be the best option, as it was simple to implement, lightweight,had the adequate range for radio control, and adequate performance for winch motor operation. These type
20 of 34
American Institute of Aeronautics and Astronautics
Dow
nloa
ded
by U
NIV
ER
SIT
Y O
F W
ASH
ING
TO
N o
n Ja
nuar
y 16
, 201
9 | h
ttp://
arc.
aiaa
.org
| D
OI:
10.
2514
/6.2
019-
0866

of remote control systems are commonly found in RC hobby applications. Another advantage of using thissystem is that the components are interchangeable, namely the hand-held transmitter could be switched toa more powerful model with longer range, or the receiver could be switched to one having higher receivingsensitivity with negligible gain in weight. These modifications only require a simple binding process, usuallydone by pressing the bind function keys on the respective transmitter. The ESC has forward and reversedirection capabilities, as well as a motor braking function, should the application require. In the drogue, theinput to the ESC is connected to the 12 V line from the battery, the receiver is connected to three pins onthe ESC (signal, 5 V , GND), and the winch is connected to the output of the ESC. An operator inside theprimary aircraft will use the hand-held transmitter to control the extension and retraction of the drogue.
G. Aircraft Attachment System
The goal of the aircraft attachment system is to both provide a structurally sound platform for the drogueto attach to the primary aircraft as well as house the drogue before and after testing to prevent damage toboth the drogue and the primary aircraft. To accomplish this, a circular aluminum plate was welded to theend of a foot long aluminum tube. Two holes were drilled into the center of the plate and a D ring wasattached via a metal fixture and screws. A locking carabiner was then attached to the D ring on one end anda metal swivel on the other. The swivel was put in place in order to ensure the line running from the droguedoes not twist up or become tangled in case of any rolling motion by the drogue. The line connecting thedrogue to the housing will be tied to the swivel using a bowline knot, which will keep the line from changinglength due to tension.
V. Feasibility Analysis
A. Computational Fluid Dynamics
In order to determine the aerodynamic forces on the winch and body layout of the drogue, the computa-tional fluid dynamics program STAR CCM+ was used to determine a CD value for the drogue and visuallyanalyze the pressure field around it. The CD was a major driver of the drogue shape as the torque generatedby the winch motor was to be kept to a minimum. The pressure field around the drogue would determinethe placement and required length of the pitot tubes as well as the pressure forces on the body itself.
In order to better evaluate the aerodynamic influence of the completed drogue, more detailed CFD anal-ysis was required. The fully rendered model was then tested for CD at 300 K, sea level pressure, and twodifferent airspeeds: 128.611 m/s and 319.332 m/s. The first speed is to simulate the drag at the maximumspeed it would be reeled in at. This determines how much torque the winch motor has to generate. Thesecond speed is the maximum speed the drogue will experience during any flight test of Part 23-25 aircraftand, therefore, the maximum drag on the drogue.
By dimensionalizing CD, drag force can be obtained. Table 2 shows the drag force and CD values of thedrogue at each speed.
Table 2: Drag Values
Speed (m/s) CD Drag (lbs)
128.611 0.3383 7.738
319.332 1.107 156.6
This major difference in drag force makes sense when considering that the Mach number at 319.332 m/sis 0.92, which means that the effects of transonic drag will significantly contribute to the amount of dragexperienced by the drogue.
21 of 34
American Institute of Aeronautics and Astronautics
Dow
nloa
ded
by U
NIV
ER
SIT
Y O
F W
ASH
ING
TO
N o
n Ja
nuar
y 16
, 201
9 | h
ttp://
arc.
aiaa
.org
| D
OI:
10.
2514
/6.2
019-
0866

Additionally, the static pressure around the drogue must be compared to the static pressure of thefreestream in order to guarantee the accuracy of the measurements. The pitot tubes on the drogue extend 4cm from the tips of each fin, so a comparison of the static pressure far from the drogue and 5 cm from thefin was performed using two separate line probes. Figures 24 and 25 show the difference between each lineprobe. 4 cm from the fin on the XY plots is located at 0.01 m on the X axis. At 128.611 m/s, the differencebetween static pressure 4 cm away from the fin and the freestream is nearly 0, meaning the accuracy ofthe pitot tube at that speed should be very accurate. However, at 319.332 m/s, the difference betweenfreestream and 4 cm from the fin is approximately 5000 Pa. Since the reference pressure is 101325 Pa, therewould be a 5% difference that must be accounted for when measuring pressure at this speed neglecting anyerror associated with the pitot tubes.
Fig. 24: Static pressure comparison between the freestream and points near the drogue fin at 128.611 m/s
Fig. 25: Static pressure comparison between the freestream and points near the drogue fin at 319.332 m/s
For qualitative analysis, pressure maps were also created during the simulations in order to show a widerview of the pressure field around the drogue. Figures 26 and 27 show the pressure field around the drogueat the different speeds.
22 of 34
American Institute of Aeronautics and Astronautics
Dow
nloa
ded
by U
NIV
ER
SIT
Y O
F W
ASH
ING
TO
N o
n Ja
nuar
y 16
, 201
9 | h
ttp://
arc.
aiaa
.org
| D
OI:
10.
2514
/6.2
019-
0866

Fig. 26: Static pressure field around the drogue at 128.611 m/s
Fig. 27: Static pressure field around the drogue at 319.332 m/s
B. Finite Element Analysis
Finite element analysis was performed to help design parts of the system subjected to high loading. Thetwo components that fall into this category are the spool and the motor mount. Keeping the total weight ofthe system as low as possible was a priority, so simulating how the two parts perform with different shapesand sizes aimed at minimizing the amount of material used was important. ANSYS was used to determinethe factor of safety and the total deformation of both parts. The results of the simulations for the finalconfigurations at extreme operating conditions can be seen below in Figures 28.
23 of 34
American Institute of Aeronautics and Astronautics
Dow
nloa
ded
by U
NIV
ER
SIT
Y O
F W
ASH
ING
TO
N o
n Ja
nuar
y 16
, 201
9 | h
ttp://
arc.
aiaa
.org
| D
OI:
10.
2514
/6.2
019-
0866
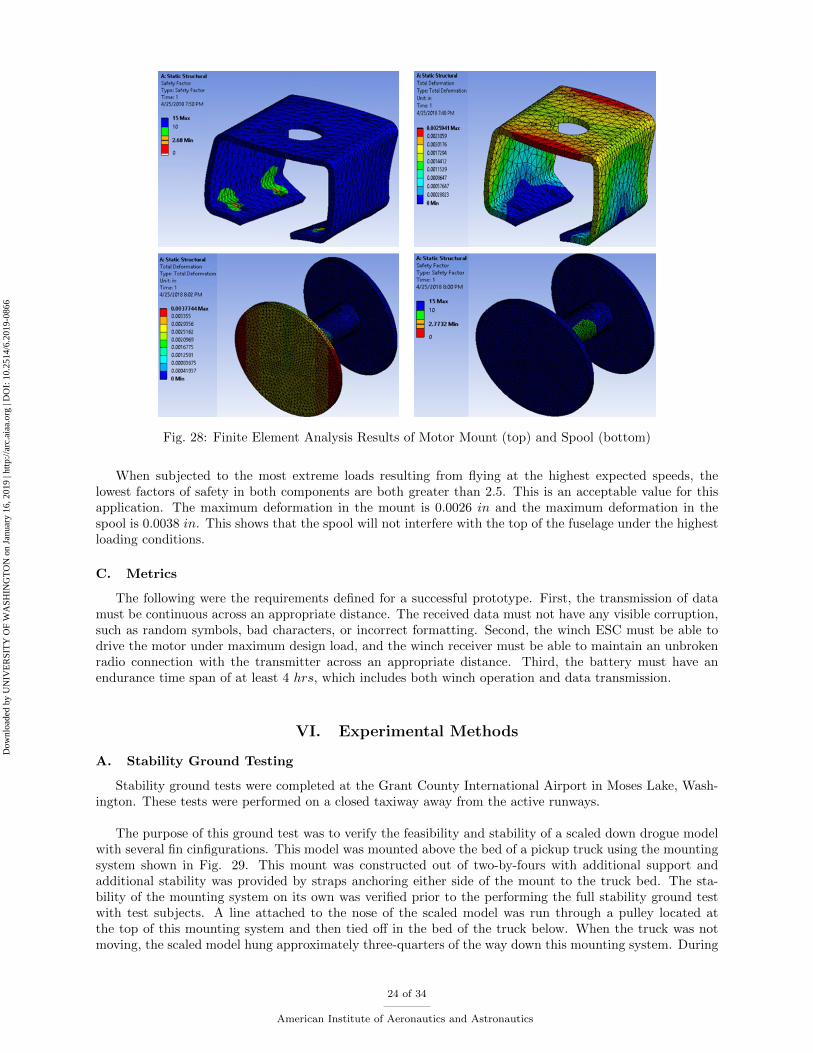
Fig. 28: Finite Element Analysis Results of Motor Mount (top) and Spool (bottom)
When subjected to the most extreme loads resulting from flying at the highest expected speeds, thelowest factors of safety in both components are both greater than 2.5. This is an acceptable value for thisapplication. The maximum deformation in the mount is 0.0026 in and the maximum deformation in thespool is 0.0038 in. This shows that the spool will not interfere with the top of the fuselage under the highestloading conditions.
C. Metrics
The following were the requirements defined for a successful prototype. First, the transmission of datamust be continuous across an appropriate distance. The received data must not have any visible corruption,such as random symbols, bad characters, or incorrect formatting. Second, the winch ESC must be able todrive the motor under maximum design load, and the winch receiver must be able to maintain an unbrokenradio connection with the transmitter across an appropriate distance. Third, the battery must have anendurance time span of at least 4 hrs, which includes both winch operation and data transmission.
VI. Experimental Methods
A. Stability Ground Testing
Stability ground tests were completed at the Grant County International Airport in Moses Lake, Wash-ington. These tests were performed on a closed taxiway away from the active runways.
The purpose of this ground test was to verify the feasibility and stability of a scaled down drogue modelwith several fin cinfigurations. This model was mounted above the bed of a pickup truck using the mountingsystem shown in Fig. 29. This mount was constructed out of two-by-fours with additional support andadditional stability was provided by straps anchoring either side of the mount to the truck bed. The sta-bility of the mounting system on its own was verified prior to the performing the full stability ground testwith test subjects. A line attached to the nose of the scaled model was run through a pulley located atthe top of this mounting system and then tied off in the bed of the truck below. When the truck was notmoving, the scaled model hung approximately three-quarters of the way down this mounting system. During
24 of 34
American Institute of Aeronautics and Astronautics
Dow
nloa
ded
by U
NIV
ER
SIT
Y O
F W
ASH
ING
TO
N o
n Ja
nuar
y 16
, 201
9 | h
ttp://
arc.
aiaa
.org
| D
OI:
10.
2514
/6.2
019-
0866

test runs, the truck accelerated down a taxiway, reaching speeds of approximately 70-90 mph depending onthe conditions observed. As the truck accelerated, the scaled model was towed behind the truck via thepreviously described mounting system.
Fig. 29: Stability ground test model mounting system in place in the back of a pickup truck.
Due to weight constraints, the model tested was scaled to down to approximately 60% of the size of thefinal prototype. The final length of this model was approximately 18 in with a diameter of 3 in. The modelused for this test was 3D printed in halves cut lengthwise. These two halves of the model are shown in Fig.30. In addition, each fin configuration tested was bolted into the model body in order to allow for testingmultiple fins.
Fig. 30: The open model showing the internal configuration of the Pixhawk data acquisition system andadditional payload.
Both the size of the fins and the weight of the fins were varied during testing. The various configurationsused are shown in Table 3. The two fins sizes described in this table are shown in Fig. 31. The weight ineach configuration was varied using removable weights attached inside the model to the lower front portionof the body. This placement was intended to simulate the electronics configurations in the full scale drogue.Following an initial run of the taxiway where the tests were performed, testing began on Configuration 1.
25 of 34
American Institute of Aeronautics and Astronautics
Dow
nloa
ded
by U
NIV
ER
SIT
Y O
F W
ASH
ING
TO
N o
n Ja
nuar
y 16
, 201
9 | h
ttp://
arc.
aiaa
.org
| D
OI:
10.
2514
/6.2
019-
0866

Table 3: Model Configurations
Configuration Number Fin Sizing Weight
Configuration 1 Root 4.5 in, Tip 2 in, Height 5 in 3.3 lbs
Configuration 2 Root 4.5 in, Tip 3 in, Height 5 in 1.8 lbs
Configuration 3 Root 4.5 in, Tip 3 in, Height 5 in 1.6 lbs
Configuration 4 Root 4.5 in, Tip 3 in, Height 5 in 1.8 lbs
Runs 1-3 were completed using Configuration 1 with two runs occurring into the wind and one run with thewind. Runs 4-9 were then completed with two runs each of Configurations 2-4. For these configurations,one run was completed into the wind and one run was completed with the wind. In addition, Runs 8-9 werecompleted with a data transmission system placed inside the model. This transmission system sent datafrom the model to an external receiver in order to validate the wireless transmission capabilities.
Fig. 31: The two fin designs used during stability testing.
In order to complete validate the stability of the model tested, both quantitative and qualitative datawas collected. In addition to recording written observations of each run, video was recorded from threedifferent perspectives. A camera was attached to the top of the mounting system in order to obtain an aerialperspective of the test. For a lower view of each test, another camera was mounted in the bed of the truck.A final video camera was located in the trailing safety car for Run 4-9. In addition to this qualitative data,quantitative data was collected via a Pixhawk autopilot system. This Pixhawk, which contained accelerom-eters and a gyroscope, was used to capture data on the movement and position of the model during testruns, which would indicate the any instabilities of the configurations.
B. Validation Testing
After manufacturing of the full sized drogue prototype was completed, validation tests were performedto evaluate the performance of the system. Several factors were evaluated during these tests. The first ofthese goals was to verify that the system could successfully gather and transmit static pressure, differentialpressure, and temperature data from the fully self-contained drogue to a separate computer.
To verify data collection and transmission of the system, the fully assembled drogue was placed on amount that protruded from the sun roof of a car. The purpose of this mount was to place the drogue outsideof any effects the car would have on air flow while maintaining structural integrity of the test apparatus.This apparatus can be seen in Fig. 32.
26 of 34
American Institute of Aeronautics and Astronautics
Dow
nloa
ded
by U
NIV
ER
SIT
Y O
F W
ASH
ING
TO
N o
n Ja
nuar
y 16
, 201
9 | h
ttp://
arc.
aiaa
.org
| D
OI:
10.
2514
/6.2
019-
0866

Fig. 32: Apparatus used for validation testing.
A separate car followed this drogue as it was driven down a stretch of Highway 203 near Carnation,Washington, a remote location selected to limit the influence passing cars would have on any pressure read-ings. This trailing car contained a laptop computer which was used to receive data transmitted from thedrogue.
The second goal of these tests was to test the operating range of the data transmission signal. This wasperformed in the E1 parking lot at the University of Washington. The drogue, while still mounted in thesame apparatus as the previous test, was placed at one corner of the parking lot. The trailing car with thereceiving computer slowly drove away from the drogue, toward the opposite corner of the lot, and stoppedwhen the signal was lost. In this test, the signal needed to penetrate a 1/8 in thick aluminum fuselage aswell as a car body. The third goal of these tests was to verify the operation of the winch. To test this, thefully assembled drogue was hung from a tree. The handheld winch transmitter was used to lower the droguetoward the ground and to lift itself back up against its own weight. The fourth goal of these tests was totest the battery life while transmitting pressure data. To test this, the drogue was turned on and left on alab workbench while transmitting data. Team members would periodically check in on the system to see ifit was still on and functioning correctly.
VII. Results
A. Stability Ground Testing
During each run of the ground test, a Pixhawk flight controller was used to collect motion data for thedrogue while in flight. This data was used to calculate the Euler angles and axial accelerations of the drogue.While Euler angles were calculated in all three directions, the focus of analysis was on the roll direction.Figure 33 shows the position of the drogue in roll while in Configuration 1 during Run 2. This run as wellas all of the runs highlighted in this section were completed with an approximately 15 mph tail wind.
27 of 34
American Institute of Aeronautics and Astronautics
Dow
nloa
ded
by U
NIV
ER
SIT
Y O
F W
ASH
ING
TO
N o
n Ja
nuar
y 16
, 201
9 | h
ttp://
arc.
aiaa
.org
| D
OI:
10.
2514
/6.2
019-
0866

Fig. 33: Euler angle of Configuration 1 in roll.
Due to the taxiway length where the ground tests were completed, each test included a very short windowof time when the drogue was moving through the air at a high enough speed to simulate actual flight tests.For Fig. 33, this critical time was identified as occurring between times 4830 sec and 4865 sec. The flighttime for this run was significantly shorter than the other tests performed with the wind. This was one ofthe first tests performed, so the shorter length and lower speeds were likely due to with the terrain andlimitations of the testing facility.
While analyzing the roll position of the drogue during testing, complete rolls by the drogue were identifiedas vertical lines stretching from 200 deg to -200 deg. During the critical time frame of run 4, there were 4complete rolls of the drogue identified. Based on the critical time period identified above, this correspondsto a roll every 8.75 sec.
Figure 34 shows the roll rate of Configuration 1 during Run 2. Throughout the critical time for this test,the roll rate remains consistently between 10 rad/sec and -10 rad/sec. Each spike in the roll rate Duringthe critical time, there was not a strong correlation between the angle of roll and the roll rate.
Fig. 34: Roll Rate of Configuration 1.
This same analysis was completed for the drogue in Configuration 2. Figure 35 shows the roll angle ofthe drogue during Run 4. The critical time period for this run was between approximately 900 sec and 940sec. During this time period, there were no complete rolls of the drogue identified. When compared to theroll angles measured in Run 2, the period of time between changes in roll direction for Run 4 was noticeablylonger. This suggests that the drogue performed slower and longer rolls while in Configuration 2.
28 of 34
American Institute of Aeronautics and Astronautics
Dow
nloa
ded
by U
NIV
ER
SIT
Y O
F W
ASH
ING
TO
N o
n Ja
nuar
y 16
, 201
9 | h
ttp://
arc.
aiaa
.org
| D
OI:
10.
2514
/6.2
019-
0866

Fig. 35: Euler angles in Configuration 2.
Figure 36 shows the roll rate of the drogue during Run 4. During the critical time period for this test, theroll rates of the drogue remain between approximately 5 rad/sec and -5 rad/sec. This range in roll rates isapproximately half the magnitude of the roll rates in Run 2. In addition, the roll rate appears periodic, withperiod of approximately two second. This consistent return to center suggests roll stability for the drogue,even when testing at the low speeds reached during the ground test.
Configurations 1 and 2 had two major differences which could have caused this change in stability. Be-tween Runs 3 and 4, both the fins design and the weight of the drogue were changed. While the fins did notchange in height, the surface area of each fin was increased by increasing the lengths of the fins at their tips.In addition to the stability added by the increase in surface area, the stability of the drogue was likely alsoincreased by the decrease in payload weight.
Fig. 36: Roll rate in Configuration 2.
In order to investigate the effect of these two configuration changes, additional runs were completed withthe same fin configuration but the minimum payload weight. The roll angle of the drogue during Run 6 isshown in Fig. 37. For this run, the critical time was identified as between 2345 sec and 2375 sec. Duringthis time, the drogue completed approximately 3 complete rolls. Unlike the oscillating about zero degreesof roll, the drogue slowly crept from a negative roll angle to a positive roll angle throughout the criticaltime period. This suggests that this configuration had an asymmetry which caused the roll rate to trendtowards a positive roll. This could be due to the weight distribution of the drogue. Since the there wasno additional payload to ensure proper weight distribution, the slight asymmetry in the weights of eachelectrical component could have caused this trend towards a larger roll.
29 of 34
American Institute of Aeronautics and Astronautics
Dow
nloa
ded
by U
NIV
ER
SIT
Y O
F W
ASH
ING
TO
N o
n Ja
nuar
y 16
, 201
9 | h
ttp://
arc.
aiaa
.org
| D
OI:
10.
2514
/6.2
019-
0866
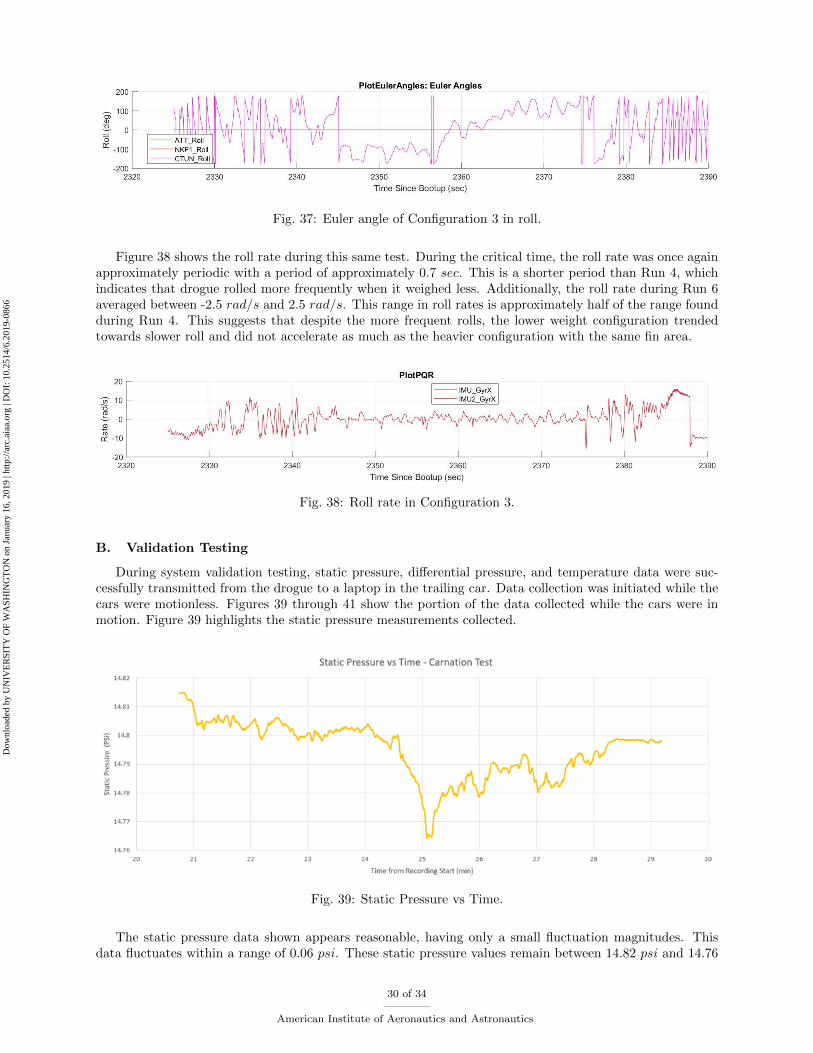
Fig. 37: Euler angle of Configuration 3 in roll.
Figure 38 shows the roll rate during this same test. During the critical time, the roll rate was once againapproximately periodic with a period of approximately 0.7 sec. This is a shorter period than Run 4, whichindicates that drogue rolled more frequently when it weighed less. Additionally, the roll rate during Run 6averaged between -2.5 rad/s and 2.5 rad/s. This range in roll rates is approximately half of the range foundduring Run 4. This suggests that despite the more frequent rolls, the lower weight configuration trendedtowards slower roll and did not accelerate as much as the heavier configuration with the same fin area.
Fig. 38: Roll rate in Configuration 3.
B. Validation Testing
During system validation testing, static pressure, differential pressure, and temperature data were suc-cessfully transmitted from the drogue to a laptop in the trailing car. Data collection was initiated while thecars were motionless. Figures 39 through 41 show the portion of the data collected while the cars were inmotion. Figure 39 highlights the static pressure measurements collected.
Fig. 39: Static Pressure vs Time.
The static pressure data shown appears reasonable, having only a small fluctuation magnitudes. Thisdata fluctuates within a range of 0.06 psi. These static pressure values remain between 14.82 psi and 14.76
30 of 34
American Institute of Aeronautics and Astronautics
Dow
nloa
ded
by U
NIV
ER
SIT
Y O
F W
ASH
ING
TO
N o
n Ja
nuar
y 16
, 201
9 | h
ttp://
arc.
aiaa
.org
| D
OI:
10.
2514
/6.2
019-
0866

psi. Standard sea-level pressure is 14.70 psi, which is slightly below the range of static pressures measured.These static pressures measurements were taken in the area surrounding Carnation, Washington which islocated approximately 82 feet above sea level. While the static pressure data collected is higher than thestandard sea level pressure, this difference could be caused by local weather fluctuations during testing.Additionally, fluctuations in the data may have also been generated due to one or more of the pitot-statictubes not aligning directly in the direction of local flow. This misalignment can be observed in Fig. 32.Another possible explanation for this fluctuation is altitude changes along the route that was driven, as theseroads did not remain perfectly at the same height above sea level.
Fig. 40: Differential Pressure and Speed vs Time.
The differential pressure data gathered as shown in Fig. 40 includes more fluctuations than the corre-sponding static pressure data. In theory, because total pressure is the sum of static pressure and dynamicpressure, the differential pressure should exhibit a correlation to speed. However, the data gathered does notshow any clear relationship between these two variables, and more trials are needed to reach a conclusion.This error in differential pressure measurements could have been caused by a calibration issue with the dif-ferential pressure transducer itself. The transducer used output pressure values with magnitude greater thanzero while stationary and not subjected to outside influence, which suggests it may have need to be calibrated.It is possible that some fluctuation may be a result of a misaligned pitot-static tube, wind gusts, passing cars,and other undocumented inputs. Despite these readings, differential and static pressure measurements weresuccessfully wireless transmitted while in motion, which successfully completes one goal of this validation test.
31 of 34
American Institute of Aeronautics and Astronautics
Dow
nloa
ded
by U
NIV
ER
SIT
Y O
F W
ASH
ING
TO
N o
n Ja
nuar
y 16
, 201
9 | h
ttp://
arc.
aiaa
.org
| D
OI:
10.
2514
/6.2
019-
0866

Fig. 41: Temperature vs Time.
The recorded temperature data for the entire duration of the test is shown in Fig. 41. The droguesat in direct sunlight and recorded data while final adjustments were being made prior to the test beforelater moving into shade as the test commenced. This could explain the high temperature readings at thebeginning of this data set which then trended toward lower temperature readings. Despite considerablenoise in the differential pressure measurements, this test was successful in demonstrating the collection andtransmission of static pressure and temperature data, as well as the transmission of differential pressure data.
When testing the range of the data transmission signal, it was found that data was successfully receivedat a distance of 950 ft. This signal was transmitted through a 1/8 in fuselage, which was thicker than thefuselage of the final prototype, as well as a car body. While this test does not test the transmission of asignal through the body of an aircraft, it does show the feasibility of this method of data transfer over adistance appropriate to place the drogue well outside the turbulent wake of an aircraft. When testing thefunctionality of the winch, it was found that the system was able to successfully lower the drogue with the1/8 in thick fuselage to the ground and lift itself back up. The weight of the drogue during this test was11.4 lbs. When testing the battery life of the drogue while transmitting data, it was found that data wastransmitted for at least six hours. This test was not performed while operating the winch.
VIII. Conclusions
A. Summary
The final product of this project was a functional prototype for a new type of static pressure measurementsystem. While there are still a number of improvements that can be made to the design, some of which areaddressed in the next section, it was shown that a device of this nature is feasible. This is an early stage of aproduct that can be pursued and further developed, and provides starting steps toward producing a devicethat can simplify the calibration of onboard pressure sensors and greatly reduce the time and manpowerrequired to set up necessary tests.
Though there are many adjustments to be made to this design, the senior capstone program at theUniversity of Washington was successful. Students worked in a team to develop a product in an industrialenvironment. With the help of AeroTEC, students were able to transfer college education into a real, time-sensitive engineering scenario.
For this design to become a viable product, further iterations subjected to extensive ground testing andflight testing would be required. The current prototype was only tested under limited conditions, and more
32 of 34
American Institute of Aeronautics and Astronautics
Dow
nloa
ded
by U
NIV
ER
SIT
Y O
F W
ASH
ING
TO
N o
n Ja
nuar
y 16
, 201
9 | h
ttp://
arc.
aiaa
.org
| D
OI:
10.
2514
/6.2
019-
0866

realistic testing conditions are desired.
B. Future Research
There are a number of additions that should be considered for further development of this trailing pressuremeasurement system. One of the first modifications which could be included is the addition of a GPS system.This system would be used to determine the exact location of the drogue relative to the primary aircraft.Knowledge of the drogue’s relative location would allow the pressure data to be appropriately adjusted inorder to account for differences in altitude between the primary aircraft and the drogue. While plans weremade to include a GPS in the final prototype, limits on time and manpower prevented the integration of thissystem. The GPS module could simply be integrated into the current payload circuit, with modifications tothe microcontroller firmware code.
In addition to a GPS system, the design of the winch and reel system can be further optimized. Thewinch configuration present in the final prototype was designed using an overestimate of the predicted dragon the drogue while reeling the drogue in. It is believed that this high torque motor could be replaced witha lower torque motor which can move the drogue in more quickly.
The largest concern with the current design is the total weight of the drogue. While no single changecould cut the weight down dramatically, the fins and outer shell provide many opportunities for weightreduction. Investigation into lighter construction materials is suggested. This weight reduction could alsoinclude reducing the thickness of the 3D printed parts used. In addition to the drogue body, some changes tothe electrical components used could reduce the total weight as well. In particular, depending on changes tothe winch system, the size of the battery may be reduced. Additionally, both the static and the differentialpressure sensors were provided in metal housing. These housings could be removed and replaced with lightermaterials.
The sheathing and attachment mechanism of the drogue is another area that requires improvement.Currently, the carabiner takes up much of the space inside the sheath due to its length. Since it is muchstronger than the expected loading, a shorter, weaker carabiner could free up space. The housing tube itselfis also much heavier and shorter than necessary. A thinner aluminum tube would mean less stress on themounting points in the primary aircraft’s structure while a longer tube would secure more the of drogue’sbody to minimize any movement while reeled in. A wider opening at the end of the housing would easethe drogue’s entry in case of instability. Lastly, the method in which the housing attaches to the primaryaircraft must be defined further. While this will vary widely on the model of the primary aircraft, structuralconnections to the internal ribs of an aircraft with metal straps or sheets would be a good place to startwith this research.
Acknowledgments
This project would not have been possible if not for the unwavering support of a huge number of people.We would like to thank AeroTEC for giving us the opportunity to pursue this project, and especiallythank Kent Baines for the mentoring and guidance they provided throughout the process. We would alsolike to thank the William E. Boeing Department of Aeronautics and Astronautics (AA) at the Universityof Washington for coordinating this project as part of our undergraduate curriculum. We would like tospecifically thank the capstone program coordinator, Dr. Kristi Morgansen. In addition, we thank AAresearch staff, Eliot George and Fiona Spencer, AA financial coordinator Nancy-Lou Polk, UW mechanicalengineering machine shop masters Eamon McQuaide and Reggie Rocamora. We would also like to thank JillDalinkus for interacting with our industry sponsors and supporting the program. Finally, we would like tothank the Port of Moses Lake, director of facilities and operations especially Rich Mueler, for accommodatingour stability testing.
33 of 34
American Institute of Aeronautics and Astronautics
Dow
nloa
ded
by U
NIV
ER
SIT
Y O
F W
ASH
ING
TO
N o
n Ja
nuar
y 16
, 201
9 | h
ttp://
arc.
aiaa
.org
| D
OI:
10.
2514
/6.2
019-
0866
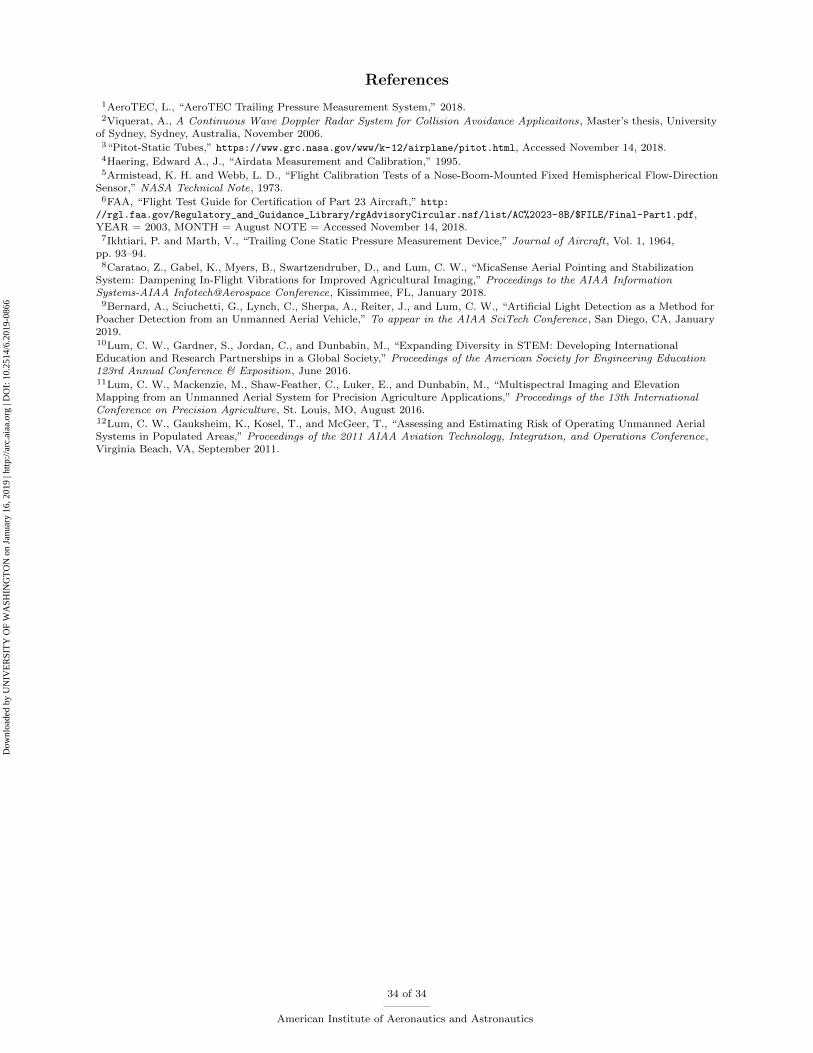
References
1AeroTEC, L., “AeroTEC Trailing Pressure Measurement System,” 2018.2Viquerat, A., A Continuous Wave Doppler Radar System for Collision Avoidance Applicaitons, Master’s thesis, University
of Sydney, Sydney, Australia, November 2006.3“Pitot-Static Tubes,” https://www.grc.nasa.gov/www/k-12/airplane/pitot.html, Accessed November 14, 2018.4Haering, Edward A., J., “Airdata Measurement and Calibration,” 1995.5Armistead, K. H. and Webb, L. D., “Flight Calibration Tests of a Nose-Boom-Mounted Fixed Hemispherical Flow-Direction
Sensor,” NASA Technical Note, 1973.6FAA, “Flight Test Guide for Certification of Part 23 Aircraft,” http:
//rgl.faa.gov/Regulatory_and_Guidance_Library/rgAdvisoryCircular.nsf/list/AC%2023-8B/$FILE/Final-Part1.pdf,YEAR = 2003, MONTH = August NOTE = Accessed November 14, 2018.7Ikhtiari, P. and Marth, V., “Trailing Cone Static Pressure Measurement Device,” Journal of Aircraft , Vol. 1, 1964,
pp. 93–94.8Caratao, Z., Gabel, K., Myers, B., Swartzendruber, D., and Lum, C. W., “MicaSense Aerial Pointing and Stabilization
System: Dampening In-Flight Vibrations for Improved Agricultural Imaging,” Proceedings to the AIAA InformationSystems-AIAA Infotech@Aerospace Conference, Kissimmee, FL, January 2018.9Bernard, A., Sciuchetti, G., Lynch, C., Sherpa, A., Reiter, J., and Lum, C. W., “Artificial Light Detection as a Method for
Poacher Detection from an Unmanned Aerial Vehicle,” To appear in the AIAA SciTech Conference, San Diego, CA, January2019.10Lum, C. W., Gardner, S., Jordan, C., and Dunbabin, M., “Expanding Diversity in STEM: Developing InternationalEducation and Research Partnerships in a Global Society,” Proceedings of the American Society for Engineering Education123rd Annual Conference & Exposition, June 2016.11Lum, C. W., Mackenzie, M., Shaw-Feather, C., Luker, E., and Dunbabin, M., “Multispectral Imaging and ElevationMapping from an Unmanned Aerial System for Precision Agriculture Applications,” Proceedings of the 13th InternationalConference on Precision Agriculture, St. Louis, MO, August 2016.12Lum, C. W., Gauksheim, K., Kosel, T., and McGeer, T., “Assessing and Estimating Risk of Operating Unmanned AerialSystems in Populated Areas,” Proceedings of the 2011 AIAA Aviation Technology, Integration, and Operations Conference,Virginia Beach, VA, September 2011.
34 of 34
American Institute of Aeronautics and Astronautics
Dow
nloa
ded
by U
NIV
ER
SIT
Y O
F W
ASH
ING
TO
N o
n Ja
nuar
y 16
, 201
9 | h
ttp://
arc.
aiaa
.org
| D
OI:
10.
2514
/6.2
019-
0866