Design and analysis of heat pump control system by using ...eprints.utem.edu.my/18218/1/Design And...
24
Design and analysis of heat pump control system by using Programmable Logic Controller LOONG CHEE HAN A report submitted in partial fulfillment of the requirements for the degree of Bachelor of Mechatronics Engineering Faculty of Electrical Engineering UNIVERSITI TEKNIKAL MALAYSIA MELAKA JUNE 2015
-
Upload
nguyenkhue -
Category
Documents
-
view
218 -
download
0
Transcript of Design and analysis of heat pump control system by using ...eprints.utem.edu.my/18218/1/Design And...

Design and analysis of heat pump control system by using Programmable Logic Controller
LOONG CHEE HAN
A report submitted in partial fulfillment of the requirements for the degree
of Bachelor of Mechatronics Engineering
Faculty of Electrical Engineering
UNIVERSITI TEKNIKAL MALAYSIA MELAKA
JUNE 2015

“ I hereby declare that I have read through this report entitle “Design and analysis of heat
pump control system by using PLC” and found that it has comply the partial fulfillment for
awarding the degree of Bachelor of Electrical Engineering (Mechatronic)”
Signature : .......................................................
Supervisor‟s Name : .......................................................
Date : ......................................................

“I declare that this report entitle “Design and analysis of heat pump control system by using
PLC” is the result of my own research except as cited in the references. The report has not
been accepted for any degree and is not concurrently submitted in candidature of any other
degree.
Signature : .......................................................
Name : .......................................................
Date : ......................................................

I
ACKNOWLEDGEMENT
I want to express my deepest gratitude to Dr. Fariz bin Ali @ Ibrahim, my supervisor
for this final year project for his guidance and advice which have helped me to complete my
project in time. Without his help I would not able to complete the task so easily. I would also
like to thank my parents for their full support in this project.
I also want to express my warm thanks to INTRIX RENEWABLE SDN. BHD. who
provided me with all the facilities and financial support for my final year project. I also like
to express my appreciation to Mr. Vincent Ng, the supervisor from the company who has
guided me and given me confidence for the all works that I have done during the working of
this project.
Last but not least, I also want to express my highest gratitude to all my coursemates,
for their help and support. Without their help and support I would not able to finish this
report in time.
II
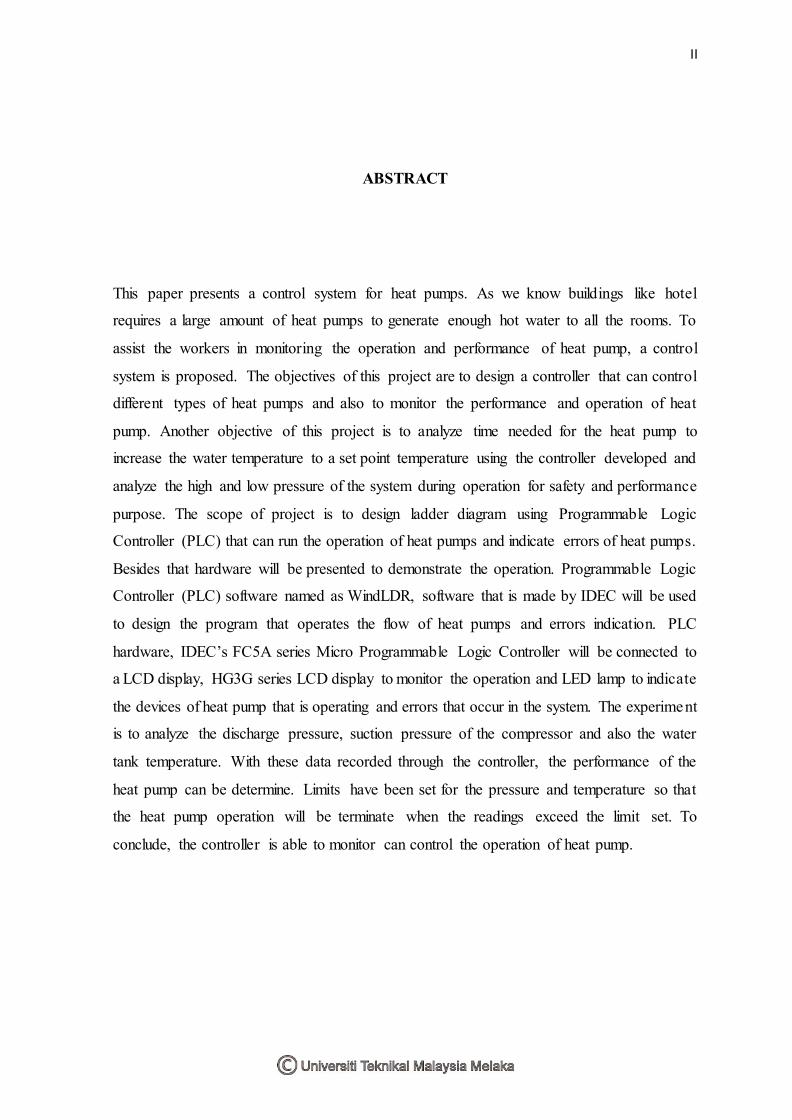
ABSTRACT
This paper presents a control system for heat pumps. As we know buildings like hotel
requires a large amount of heat pumps to generate enough hot water to all the rooms. To
assist the workers in monitoring the operation and performance of heat pump, a control
system is proposed. The objectives of this project are to design a controller that can control
different types of heat pumps and also to monitor the performance and operation of heat
pump. Another objective of this project is to analyze time needed for the heat pump to
increase the water temperature to a set point temperature using the controller developed and
analyze the high and low pressure of the system during operation for safety and performance
purpose. The scope of project is to design ladder diagram using Programmable Logic
Controller (PLC) that can run the operation of heat pumps and indicate errors of heat pumps.
Besides that hardware will be presented to demonstrate the operation. Programmable Logic
Controller (PLC) software named as WindLDR, software that is made by IDEC will be used
to design the program that operates the flow of heat pumps and errors indication. PLC
hardware, IDEC’s FC5A series Micro Programmable Logic Controller will be connected to
a LCD display, HG3G series LCD display to monitor the operation and LED lamp to indicate
the devices of heat pump that is operating and errors that occur in the system. The experiment
is to analyze the discharge pressure, suction pressure of the compressor and also the water
tank temperature. With these data recorded through the controller, the performance of the
heat pump can be determine. Limits have been set for the pressure and temperature so that
the heat pump operation will be terminate when the readings exceed the limit set. To
conclude, the controller is able to monitor can control the operation of heat pump.

III
ABSTRAK
Kertas kerja ini membentangkan satu sistem kawalan untuk pam haba. Seperti yang
kita tahu bangunan seperti hotel memerlukan sejumlah besar pam haba untuk menghasi lkan
air panas yang cukup untuk semua bilik. Untuk membantu pekerja dalam memantau operasi
dan prestasi pam haba, sistem kawalan dicadangkan . Objektif projek ini adalah untuk
membentuk pengawal yang boleh mengawal pelbagai jenis pam haba dan juga untuk
memantau prestasi dan operasi pam haba. Satu lagi objektif projek ini adalah untuk
menganalisis masa yang diperlukan untuk pam haba untuk meningkatkan suhu air pada suhu
titik set menggunakan pengawal maju dan menganalisis tekanan tinggi dan rendah sistem
semasa operasi untuk tujuan keselamatan dan prestasi. Skop projek ini adalah membentuk
gambar rajah tangga dengan Programmable Logic Controller (PLC) yang boleh menjalankan
operasi pam haba dan menunjukkan kesilapan pam haba. Selain perkakasan yang akan
dibentangkan untuk menunjukkan operasi. Programmable Logic Controller perisian (PLC)
yang dinamakan WindLDR, perisian yang dibuat oleh IDEC akan digunakan untuk
membentuk program yang mengendalikan aliran pam haba dan kesilapan petunjuk.
Perkakasan PLC, siri FC5A IDEC Micro Programmable Logic Controller akan dihubungkan
dengan paparan LCD, HG3G paparan siri LCD memantau operasi dan lampu LED untuk
menunjukkan peranti pam haba yang beroperasi dan kesilapan yang berlaku dalam sistem.
Eksperimen ini adalah untuk menganalisis tekanan pelepasan, tekanan sedutan pemampat
dan juga suhu tangki air. Dengan data ini direkodkan melalui pengawal, prestasi pam haba
boleh menentukan. Had telah ditetapkan untuk tekanan dan suhu supaya operasi pam haba
akan tamat apabila bacaan melebihi set had. Kesimpulannya, pengawal dapat mengawal
operasi pam haba.

IV
TABLE OF CONTENTS
CHAPTER TITLE PAGE
ACKNOWLEDGEMENT i
ABSTRACT ii
ABSTRAK iii
TABLE OF CONTENTS iv
LIST OF TABLES vi
LIST OF FIGURES vii
LIST OF APPENDICES ix
1 INTRODUCTION 1
1.1 Motivation 1
1.2 Problem Statement 1
1.3 Objectives 2
1.4 Scope 3
2 LITERATURE REVIEW 3
2.1 Review and comparison of journals 3
2.2 Justification for controller 13
2.3 Justification for temperature controller 14
2.4 Literature Review Summary
14
3 METHODOLOGY 15
3.1 Project Planning 15
3.2 Introduction of heat pump system 17
3.3 R-134a Pressure-Temperature Chart 18
3.4 List of Materials 19
3.4.1 Functions of materials 19
3.4.2 Components Specification 20
3.5 Schematic diagrams of hardware connections 25

V
CHAPTER TITLE PAGE
3.6 Flow chart of the system 28
3.7 Experiment Setup 30
3.7.1 Design the operation sequence of heat pump
systems
30
3.7.2 Design the interface for human machine interface
touchscreen LCD display
31
3.7.3 Temperature and pressure analysis 33
4 RESULTS, ANALYSIS and DISCUSSION 38
4.1 Performance of heat pump 38
5 CONCLUSION AND RECOMMENDATION 48
REFERENCE 49
APPENDICES 51

VI
LIST OF TABLES
TABLE TITLE PAGE
2.1.1 Summary of comparison in between journals 8
3.1.1 Table for project planning. 16
3.4.1 List of materials 19
3.4.2 Specification for Programmable logic controller. 20
3.4.3 Specification for IDEC’s HG3G series touch screen LCD
display.
22
3.4.4 Specification for Shinko’s Temperature controller DCL-33A-
R/M
23
3.4.5 Specification for Carel’s pressure transducer SPKT033R0. 24
3.5.1 Inputs and outputs for programmable logic controller. 27
3.7.1 Time taken for the water to reach 60 oC during the heating
process.
34
4.1.1 Table showing the water temperature during the experiment.
38
4.1.2 Table showing the discharge pressure and temperature of R-134a during the experiments
40
4.1.3 Table showing the suction pressure and temperature of R-134a during the experiments.
42
4.1.4 Table showing the status of the heat pump according to the
water temperature during the heating process.
44
4.1.5 Table showing the status of the heat pump according to the
suction pressure during the heating process.
45
4.1.6 Table showing the status of the heat pump according to the
discharge pressure during the heating process.
46

VII
LIST OF FIGURES
FIGURE TITLE PAGE
2.1.1 Flow chart of the system in journal 1. 4
2.1.2 System flow chart for journal 2. 5
2.1.3 System flow chart for journal 3. 6
2.1.4 System procedure flow for journal 4. 7
3.1.1 Gantt chart of this project. 16
3.2.1 The Refrigerant cycle 17
3.3.1 R-134a Pressure-Temperature Chart. 18
3.4.1 IDEC’s FC5A series MicroSmart Pentra Programmable Logic
Controller
20
3.4.2 IDEC’s HG3G series touch screen LCD display 21
3.4.3 Shinko’s Temperature controller DCL-33A-R/M 22
3.4.4 Carel’s pressure transducer SPKT033R0. 23
3.4.5 Block diagram of the system. 24
3.5.1 Schematic diagram for power supply to the main devices 25
3.5.2 Schematic diagram for all connection to inputs and outputs of
programmable logic controller.
26
3.6.1 Flow chart for air source heat pump. 28
3.6.2 Flow chart for water source heat pump. 29
3.7.1 Software WINDLDR interface. 30
3.7.2 Software WindO/I-NV2 interface 31
3.7.3 Figure shows the main page of the interface. 32
3.7.4 Figure shows the touchscreen interface with temperature graph. 32
3.7.5 Figure shows the setup of the experiment 34
3.7.6 Temperature (oC) against Time (Minute) graph 35
3.7.7 Pressure (PSI) against Time (Minute) graph 35
4.1.1 Figure showing the time taken for the water to reach 60oC. 40
VIII
4.1.2 Graph showing the discharge pressure and discharge
temperature of R-134a during the heating process.
41
4.1.3 Graph showing the suction pressure and temperature of R-134a
during the experiment
44
4.1.4 Photo showing the parameters set on the system 47

IX
LIST OF APPENDICES
APPENDIX TITLE PAGE
A Ladder diagram for the controller 51

1
CHAPTER 1
INTRODUCTION
1.1 Motivation
Conventional heat pump control system is very complicated. It requires many
devices to control different parts of the system. To monitor the pressure compressor, it
requires pressure transducer, pressure gauge, pressure switches. Besides that, many relays,
contactors, timers are needed to be installed to control the heat pump. This require a large
place to install all these components and it is costly. To simplify all these problems, a heat
pump control system built using a PLC with a touchscreen interface. It can be connect with
multiple sensors and transducer and also record the data which the conventional control
system lack of. The PLC itself have numbers of internal relays, timers and counters that can
replace all the relays that require place to install. This not only save space but also making
the system easier to be control and monitor.
1.2 Problem Statement
The designs for controller today are getting more and more complicated. Designer
tends to add more features into the controller which make customers require more time and
knowledge to understand and learn the proper functions of the controller. To overcome this
problem, the design of the controller of this project will be made simple and more users
friendly so that even normal household owner will be able to control their heat pump
themselves. The focus of this project is to develop a controller by implementing
programmable logic controller with a touchscreen LCD display which able to control and

2
monitor the operation of heat pump. Besides that, an analysis will be done using the
controller to observe the water temperature changes through the controller and also the
pressure changes within the system as the water is being heat. Input and output temperature
data will be recorded for efficiency analysis.
1.3 Objectives
To develop a controller using programmable logic controller that able to control
different types of heat pumps and monitor its operation.
To analyse the safety and performance of the heat pump by monitoring the suction
pressure and discharge pressure at the compressor.
To analyse time needed for the heat pump to increase the water temperature into a
particular temperature using the controller developed.
1.4 Scope
The scope of this project is to design a multi-heat pump controller. The controller
software will be programmed using WindLDR software. This is IDEC brand Programmab le
Logic Controller (PLC) ladder diagram software. A Programmable Logic Controller (PLC)
will be used as the hardware of the controller where it will be connected to a LCD display
to monitor the operation of the heat pump system and also analyzing the performance, water
temperature and high low pressure of the compressor in the heat pump system. A temperature
sensor is used to measure the temperatures whereas a pressure transducer will be used to
measure the pressures of the compressor. The hardware used are IDEC’s FC5A series Micro
Programmable Logic Controller and HG3G series touch screen LCD display. Shinko’s
Temperature controller serve as the temperature sensor while Carel’s Pressure Transducer is
the chosen pressure transducer for this project.
3
CHAPTER 2
LITERATURE REVIEW
2.1 Review and comparison of journals
In the first journal [1], ST89C51 microcomputer is used as the core of the controller
to execute the fuzzy logic algorithm to control the drying temperature of heat pump. The
control system includes high power op-amp, analogue to digital and digital to analogue
converter, input photoelectric isolation, drive circuit, a keyboard and a display circuit.
Thermocouple is used to detect temperature in the system and send output voltage signal to
the control system. As its signal value is small, hence an amplifier is needed to amplify the
signal before converting into digital signal through the converter. After this, the digital signal
will be sent to the microcomputer to compare the value before sending signal back to the
heat pump. By using thermocouple as the sensor to gain feedback from the system, the
algorithm will calculate the error and reduce the pure time delay, decrease the overshoot and
increase stability into the system. The algorithm used is to vary the best possible power
output to increase efficiency of the system and its rate of temperature rises.

4
Figure 2.1.1: Flow chart of the system in journal 1.
In the second journal [2], the controller that is chosen is Omron CJM-CPU12
programmable logic controller. It is connected to a temperature control unit where it is used
to determine the water temperature and send feedback into the system. A computer is used
as display to record data and observe the changes in system using multiple software such as
GP viewer and PROFACE project manager. The program that is used for operating the
programmable logic controller is Omron’s CX programmer. This controller is built to
analyze the heating rate of the heating tank using different ways to controller. Three control
methods that are used during the experiment are the proportional method (P), proportional
integral method (PI) and proportional integral derivate method (PID). Among these three
methods, PID controller have the best performance based on few criterias which are rise time,
settling time, peak time, delay time and also the percent overshoot.

5
Figure 2.1.2: System flow chart for journal 2.
In Yan Yang and Haiyun Bian’s paper [3], fuzzy self-tuning PID control method is
implemented using programmable logic controller. A DVP-28SV Delta PLC is used and a
DTC1000 temperature controller is utilized as a temperature sensor where thermocouple is
connected as input. Thermocouple will detect the water temperature in the water tank and
send feedback signal back to the programmable logic controller. PID controller will calculate
using its algorithm to control the power output of the heater. The analysis is done using
MATLAB Simulink simulation. There are two controllers used for comparison. One is the
fuzzy auto-tuning PID controller whereas the other one is conventional PID controller. Based
on the results got from the simulation, fuzzy auto-tuning PID controller has better
performance compared to the other controller as it has smaller percent overshoot, adjustment
time and dynamic response.

6
Figure 2.1.3: System flow chart for journal 3.
Based on Lv Shu-dong’s experiment [4], it uses Mitsubishi FX2N series
programmable logic controller to control the drying rate of refrigerant in the evaporator. The
drying rate will be change by control the refrigerant mass flow rate entering the evaporator
and compressor and vary rotational speed of compressor. A Siemens Simatic TP170B LCD
touch screen display is connected to the programmable logic controller to monitor the status
of the heat pump. This is to make sure the heat pump is functioning well and users can be
notified if there is any fault or error occur in the system through the display.

7
Figure 2.1.4: System procedure flow for journal 4.
According to the journal written by D.V. Pushpa Latha, K.R. Sudha and
Devabhaktuni Swati [5], a millennium 3 programmable logic controller is used to control
temperature by using LM35 as temperature sensor. The experiment in undergone by
detecting temperature in the surrounding and compare to the temperature set point set in
programmable logic controller. If the surrounding temperature is higher than the set point
temperature the fan will turn on. On the other hand, heater will turn on if the surrounding
temperature is lower than the set point temperature. Different types of control is tested to
compare its performance. The methods are on/off control, proportional control, PID control
and PLC control. The results shows that PLC is the most effective controller.

8
1
Table 2.1.1: Summary of comparison in between journals. 2
3
No. Title Control Method Control unit Advantages and disadvantages 1 Thermoelectric Heat
Pump Drying Temperature Control System on the Basis of 89C51 (2012) [5]
Control the drying temperature of heat pump using fuzzy logic through a Single Chip Microcomputer (SMC). Performance such as rise time, settling time, peak time and percent overshoot is recorded for analysis.
Single Chip Microcomputer ST89C51 (microcontroller)
o On-chip FLASH Program Memory
o Speed up to 33 MHz o RAM expandable externally
to 64 k bytes o 4 level priority interrupt o 6 interrupt sources o Four 8-bit I/O ports o Programmable clock out o Second DPTR register o 3 16-bit timers
Thermocouple (Temperature Sensor)
Advantages o Thermocouple is
inexpensive, high precision, wide measuring range and quick response.
o Low cost. Cost only around RM15 per chip.
Disadvantages
o System has high overshoot due to unstable control system and algorithm.
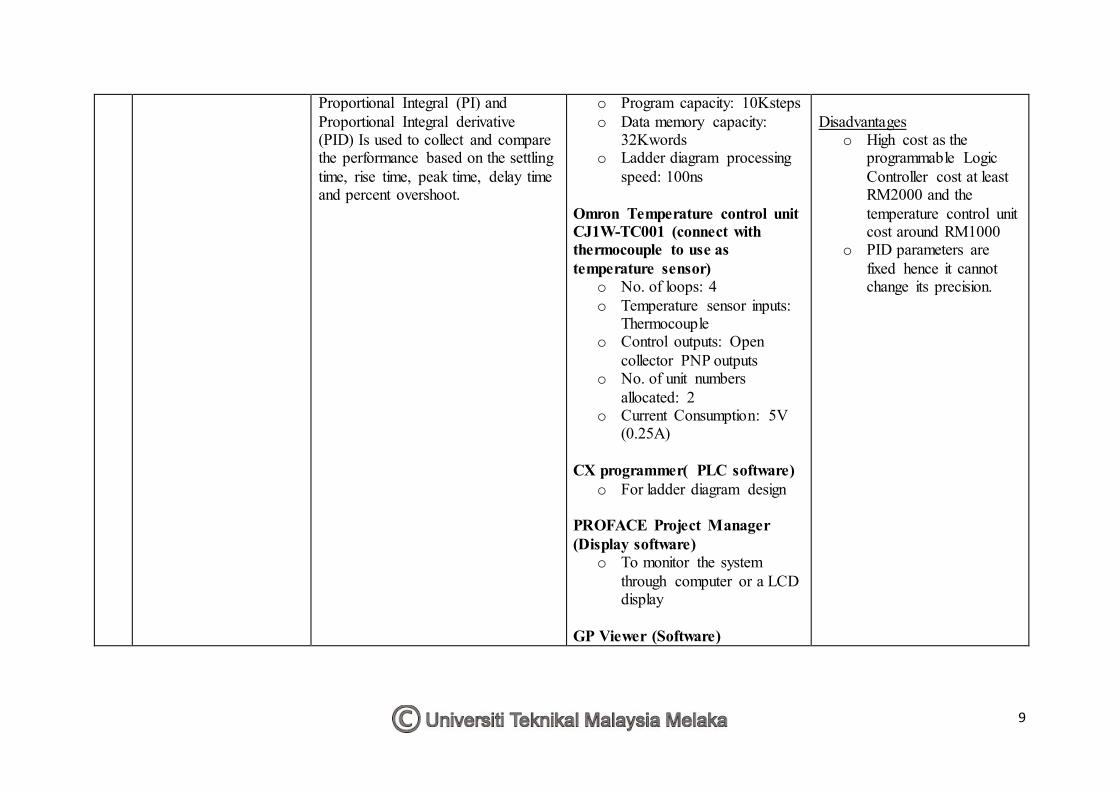
2 PID Implementation of Heating Tank in Mini Automation Plant Using Programmable Logic Controller (PLC) (2011) [6]]
Control the time to heat up a particular solution in heating tank using the Programmable Logic Controller implementing Proportional Integral derivative (PID) control. Different kinds of PID parameter such as Proportional (P),
PLC OMRON CJ1M-CPU12 (Programmable Logic Controller)
o Power: 5VDC (580mA) o Number of I/O points : 320 o Maximum number of
modules : 10
Advantages o Able to monitor the
condition of the system from far side.
o Can control the heating time efficiently if using PID control.
9
Proportional Integral (PI) and Proportional Integral derivative (PID) Is used to collect and compare the performance based on the settling time, rise time, peak time, delay time and percent overshoot.
o Program capacity: 10Ksteps o Data memory capacity:
32Kwords o Ladder diagram processing
speed: 100ns Omron Temperature control unit CJ1W-TC001 (connect with thermocouple to use as temperature sensor)
o No. of loops: 4 o Temperature sensor inputs:
Thermocouple o Control outputs: Open
collector PNP outputs o No. of unit numbers
allocated: 2 o Current Consumption: 5V
(0.25A) CX programmer( PLC software)
o For ladder diagram design PROFACE Project Manager (Display software)
o To monitor the system through computer or a LCD display
GP Viewer (Software)
Disadvantages
o High cost as the programmable Logic Controller cost at least RM2000 and the temperature control unit cost around RM1000
o PID parameters are fixed hence it cannot change its precision.

10
o Collect data from system and send to computer or LCD display
3 Design and Realization of Fuzzy Self-tuning PID Water Temperature Controller Based on PLC (2012) [7]
Control the time needed to heat up the water in water tank using fuzzy-PID controller. The results are collected by comparing data from a PID controller and fuzzy-PID controller. Data such as peak time, rise time, settling time and percent overshoot is collected for comparison.
Delta PLC (DVP-28SV) (Programmable Logic Controller)
o Power: 20.4 to 28.8 VDC o Digital Inputs: 8 (24VDC
sink/source) o Digital Outputs: 12 NPN
open collector o Output rating: 0.3A o Program capacity: 16Ksteps o Execution speed: 0.24µs per
instruction o I/O points: Up to 512 points o High Speed counters:4
counters, 200KHz DTC 1000 temperature controller (Connect with thermocouple to use as temperature sensor)
o Power: 24VDC o Input: Thermocouple,
voltage and current o Output: Relay (240VAC,
3A), Voltage pulse (12VDC, 40mA)
Advantages o Control system have
High accuracy o Small percent
overshoot o strong anti-interference
performance and good robustness
Disadvantages
o Expensive, PLC cost around RM1500 per unit.
o

11
SIMATIC WinCC (Software) o Used to insert control
parameter and collect data from the system.
Matlab (Simulink) o Used for simulation.
4 Study on Controlling
Simulation of Heat Pump Drying System Based on PLC (2012) [8]
Control the drying rate of refrigerant in the evaporator by using programmable logic controller. The drying rate will be change by control the refrigerant mass flow rate entering the evaporator and compressor and vary rotational speed of compressor. The running status of the drying system can be monitor through a human machine interaction (HMI) LCD display. Fault alarm status, control parameter, electric power status and records of fault status can be monitor and control through the LCD touch screen display.
Mitsubishi FX2N series (programmable logic controller)
o Power: 100 to 240VAC o Number of Input points: 64 o Input type: 24VDC
sink/source o Number of Output: 64 o Output type: Relay MR-
ES/UL, Transistor MT-ESS/UL
Siemens Simatic TP170B
o Display size: 5.7” (320*240)
o Control: Touch screen o Power: 24VDC (0.25A) o Configuration Software:
WinCC flexible compact 2004
Advantages o Able to monitor the
status of the system through a display
o Parameter can be control through display
o Errors can be found through display
Disadvantages o Lack of data in the
results that didn’t show the performance in the control section.
o Touch screen display is expensive as it cost $1790 which is around RM5000 per unit.

12
5 Millenium3 PLC Based Temperature Control Using LM 35 (2013) [9]
Control the temperature of a place using a temperature sensor called LM35 and control using Millenium 3 Programmable Logic Controller (PLC). Based on the temperature detected through the sensor, the PLC will turn on the fan or heater to maintain the temperature of the place. It has 3 types of control, on/off control, proportional control and PID control. Different types of control can obtain different results.
Millenium 3 PLC (Programmable Logic Controller)
o Power: 24VDC o No. of Inputs: 12 (8 digital
and 4 analogue) o No. of outputs: 4 ( Relay
type) o Output current:8A
LM35DZ temperature sensor
o Power: 4 to 30VDC o Output voltage:-1 to
1.5VDC (10mA) o Temperature range: -55 to
150oC o Scale factor: 10mV/ oC
Advantages o Simple setup. o Small size PLC o Cheap temperature
sensor. o Low price for PLC a it
cost around RM500. Disadvantages
o Lack of data
4