Design-An Opportunity in Reducing Corrugated Fiberboard Carbon Footprint
14
Design-An Opportunity in Reducing Corrugated Fiberboard Carbon Footprint J. SINGH l .*, R. KISCH 2 , 1. CHHUN 3 and E. OLSEN l lAssociate Professor, Industrial Technology, Cal Poly State University, California 2president, Container Solutions International Incorporated 3Research Assistant, Industrial Technology, Cal Poly State University, California ABSTRACT: Telescoping Half Slotted Containers (HSC) and Diagonal Corner Bliss style containers are popular choices for packaging agri- cultural products such as apples, pears, citrus, potatoes, garlic and most vegetables. This study evaluated two unique corrugated con- tainer designs, Kisch Full Circle Tray (FCT) and Single V Kisch Bliss, which are both viable designs available to replace the presently used styles of boxes for produce distribution. This paper presents the com- pression strength results ofTelescoping HSC containers as compared to two possible replacements and the Diagonal Corner Bliss designs when stored under standard, refrigerated and tropical conditions. It also compares the material savings and the lifecycle environmental im- pacts for the three designs against the Telescoping HSC design. Com- paring the average overall peak forces, across all three environmental conditions of the Telescoping HSC boxes to that of the three designs, it was concluded that the Kisch FCT boxes were approximately 17% weaker, while providing material savings of over 14%; the Diagonal Cor- ner Bliss boxes were approximately 9% weaker, while providing mate- rial savings of almost 22% and the Single V Kisch Bliss boxes were ap- proximately 14% stronger, while providing material savings of over 19%. Savings in material ranging from 14 to 22% for the three designs tested, translates into significant energy savings, relative optimization of natural resources, reductions in green house gas emissions and rel- ative minimization of waste water and solid waste generated during pro- duction in comparison to the Telescoping HSC style boxes. 1.0 INTRODUCTION I NFLUENCED by numerous demographic trends, including declining household size, rising income levels and the changing consumption habits, consumption of fresh produce has been favorably effected in re- Author to whom correspondence should be addressed. Email; [email protected] Journal of Applied Packaging Research, Vol. 3, No.2-April 2009 105 1557-7244/09/02 105-14 © 2009 DEStech Publications, Inc.
Transcript of Design-An Opportunity in Reducing Corrugated Fiberboard Carbon Footprint
Design-An Opportunity in Reducing Corrugated Fiberboard
Carbon Footprint
J. SINGHl .*, R. KISCH2, 1. CHHUN3 and E. OLSENl
lAssociate Professor, Industrial Technology, Cal Poly State University, California 2president, Container Solutions International Incorporated
3Research Assistant, Industrial Technology, Cal Poly State University, California
ABSTRACT: Telescoping Half Slotted Containers (HSC) and Diagonal Corner Bliss style containers are popular choices for packaging agricultural products such as apples, pears, citrus, potatoes, garlic and most vegetables. This study evaluated two unique corrugated container designs, Kisch Full Circle Tray (FCT) and Single V Kisch Bliss, which are both viable designs available to replace the presently used styles of boxes for produce distribution. This paper presents the compression strength results ofTelescoping HSC containers as compared to two possible replacements and the Diagonal Corner Bliss designs when stored under standard, refrigerated and tropical conditions. It also compares the material savings and the lifecycle environmental impacts for the three designs against the Telescoping HSC design. Comparing the average overall peak forces, across all three environmental conditions of the Telescoping HSC boxes to that of the three designs, it was concluded that the Kisch FCT boxes were approximately 17% weaker, while providing material savings of over 14%; the Diagonal Corner Bliss boxes were approximately 9% weaker, while providing material savings of almost 22% and the Single V Kisch Bliss boxes were approximately 14% stronger, while providing material savings of over 19%. Savings in material ranging from 14 to 22% for the three designs tested, translates into significant energy savings, relative optimization of natural resources, reductions in green house gas emissions and relative minimization of waste water and solid waste generated during production in comparison to the Telescoping HSC style boxes.
1.0 INTRODUCTION
I NFLUENCED by numerous demographic trends, including declining household size, rising income levels and the changing consumption
habits, consumption of fresh produce has been favorably effected in re
~ Author to whom correspondence should be addressed. Email; [email protected]
Journal of Applied Packaging Research, Vol. 3, No.2-April 2009 105
1557-7244/09/02 105-14 © 2009 DEStech Publications, Inc.
106 J. SINGH, R. KISCH, J. CHHUN and E. OLSEN
cent decades [1]. As a result, unprocessed fresh foods such as vegetables and fruits are being included at an increasing rate in diets allover the world. As the variety of fresh produce in terms of number, form and quality has increased, so has-the packaging to help move these commodities through the marketing channels. The packaging conceivably contains different types, sizes, grades or maturity of produce and is available in many forms such as sacks and nets, wooden crates, corrugated fiberboard boxes, plastic crates, etc.
Volumes of fresh produce imported into the U.S. increased 43.1 % between 1999 and 2006, with the vegetables share increasing by 32.2% and that of fruits by 19.6% for the same duration [2]. Imports of vegetables accounted for 17% of the total U.S. supply (production plus imports) whereas imported fruit accounted for 38% [2]. Between 1999 and 2006 a majority of the fresh vegetables were imported from Mexico (65%) and fresh fruits from Latin America (92%) [2].
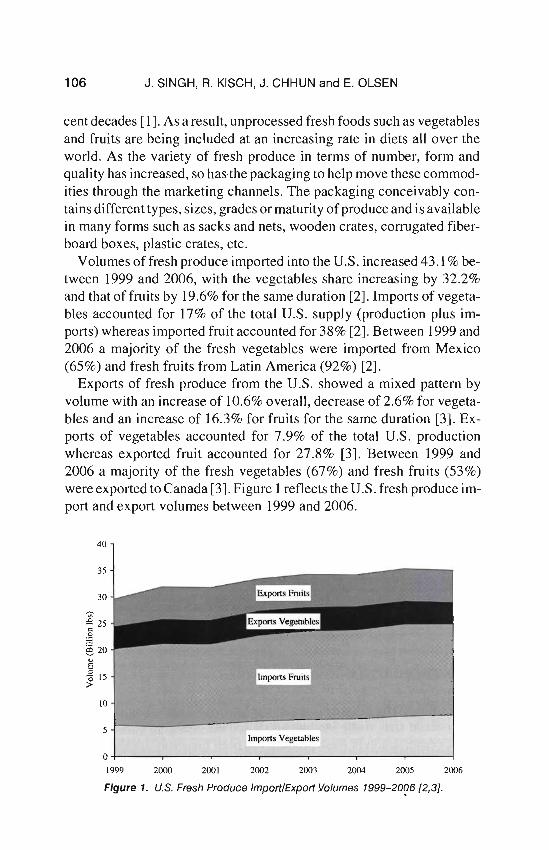
Exports of fresh produce from the U.S. showed a mixed pattern by volume with an increase of 10.6% overall, decrease of 2.6% for vegetables and an increase of 16.3% for fruits for the same duration [3]. Exports of vegetables accounted for 7.9% of the total U.S. production whereas exported fruit accounted for 27.8% [3]. Between 1999 and 2006 a majority of the fresh vegetables (67%) and fresh fruits (53%) were exported to Canada [3]. Figure 1 reflects the U.S. fresh produce import and export volumes between 1999 and 2006.
40
35
30
:9 25 c
~ §. 20
E -3 15 ;>
10
Imports Vegelllble.
0+---,---,----,----...,------.------,-----..., 1999 2000 2001 2002 2003 2004 2005 2006
Figure 1. U.S. Fresh Produce Import/Export Yolumes 1999--20~6 [2,3].
107 Reducing Corrugated Fiberboard Carbon Footprint
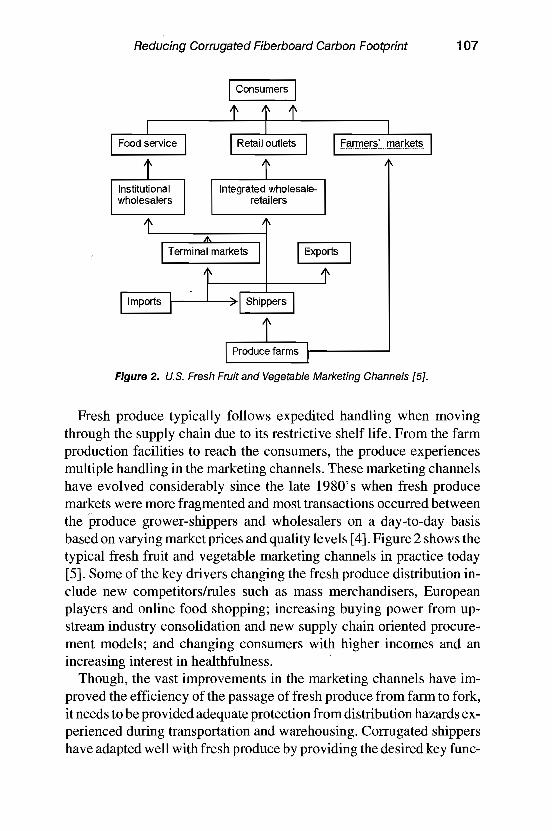
Figure 2. U.S. Fresh Fruit and Vegetable Marketing Channels [5J.
Fresh produce typically follows expedited handling when moving through the supply chain due to its restrictive shelf life. From the farm production facilities to reach the consumers, the produce experiences multiple handling in the marketing channels. These marketing channels have evolved considerably since the late 1980's when fresh produce markets were more fragmented and most transactions occurred between the (produce grower-shippers and wholesalers on a day-to-day basis based on varying market prices and quality levels [4]. Figure 2 shows the typical fresh fruit and vegetable marketing channels in practice today [5]. Some of the key drivers changing the fresh produce distribution include new competitors/rules such as mass merchandisers, European players and online food shopping; increasing buying power from upstream industry consolidation and new supply chain oriented procurement models; and changing consumers with higher incomes and an increasing interest in healthfulness. '
Though, the vast improvements in the marketing channels have improved the efficiency of the passage of fresh produce from farm to fork, it needs to be provided adequate protection from distribution hazards experienced during transportation and warehousing. Corrugated shippers have adapted well with fresh produce by providing the desired key func
- -
108 J. SINGH, R. KISCH, J. CHHUN and E. OLSEN
tions such as containment, protection and communication and as such are the most popular choice. It has been proposed that more than two thirds of the world's retailed commodities are packed and transported in corrugated packaging [6].
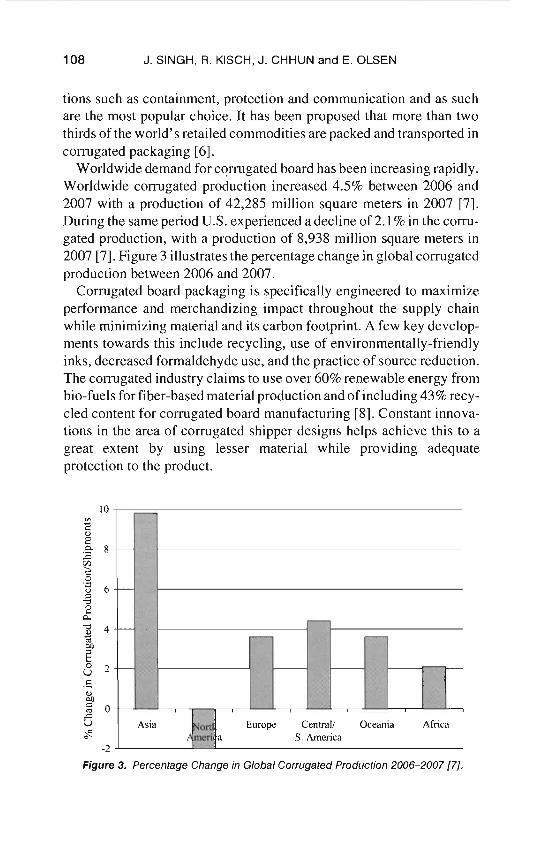
Worldwide demand for corrugated board has been increasing rapidly. Worldwide corrugated production increased 4.5% between 2006 and 2007 with a production of 42,285 million square meters in 2007 [7]. During the same period U.S. experienced a decline of 2.1 % in the corrugated production, with a production of 8,938 million square meters in 2007 [7]. Figure 3 illustrates the percentage change in global corrugated production between 2006 and 2007.
Corrugated board packaging is specifically engineered to maximize performance and merchandizing impact throughout the supply chain while minimizing material and its carbon footprint. A few key developments towards this include recycling, use of environmentally-friendly inks, decreased formaldehyde use, and the practice of source reduction. The corrugated industry claims to use over 60% renewable energy from bio-fuels for fiber-based material production and of including 43% recycled content for corrugated board manufacturing [8]. Constant innovations in the area of corrugated shipper designs helps achieve this to a great extent by using lesser material while providing adequate protection to the product.
10
r-
-
-~
f--- -
Asia Nord Europe Central! Oceania Africa Amcri a S. America
-2
Figure 3. Percentage Change in Global Corrugated Production 2006-2007 [7J.
109 Reducing Corrugated Fiberboard Carbon Footprint
Other
Exports to other 1% countries ----..
21%
Packaging and industrial converting
2%
Tissue frs ~
1%
Containerboard 59%
Figure 4. End of Life Treatment of Old Corrugated Containers (2006).
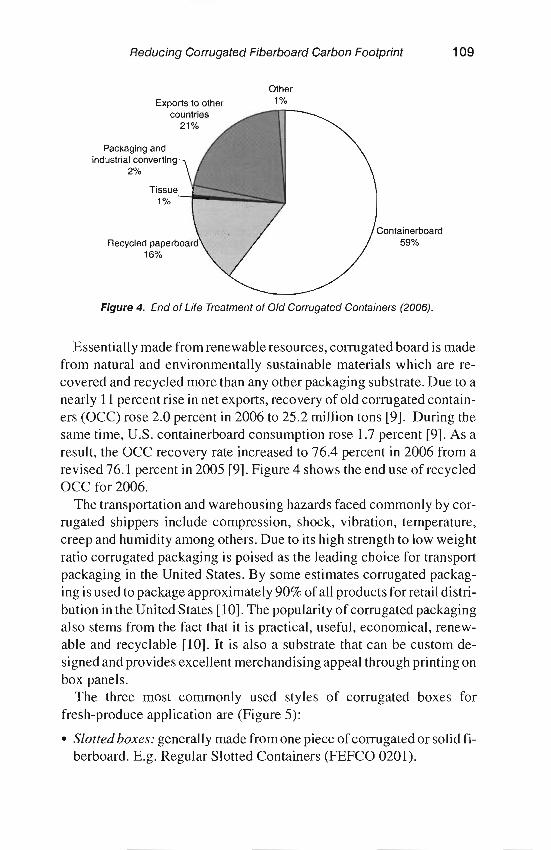
Essentially made from renewable resources, conugated board is made from natural and environmentally sustainable materials which are recovered and recycled more than any other packaging substrate. Due to a nearly 11 percent rise in net exports, recovery of old corrugated containers (acC) rose 2.0 percent in 2006 to 25.2 million tons [9]. During the same time, U.S. containerboard consumption rose 1.7 percent [9]. As a result, the acc recovery rate increased to 76.4 percent in 2006 from a revised 76.1 percent in 2005 [9]. Figure 4 shows the end use of recycled acc for 2006.
The transportation and warehousing hazards faced commonly by corrugated shippers include compression, shock, vibration, temperature, creep and humidity among others. Due to its high strength to low weight ratio corrugated packaging is poised as the leading choice for transport packaging in the United States. By some estimates corrugated packaging is used to package approximately 90% ofall products for retail distribution in the United States [10]. The popularity of corrugated packaging also stems from the fact that it is practical, useful, economical, renewable and recyclable [10]. It is also a substrate that can be custom designed and provides excellent merchandising appeal through printing on box panels.
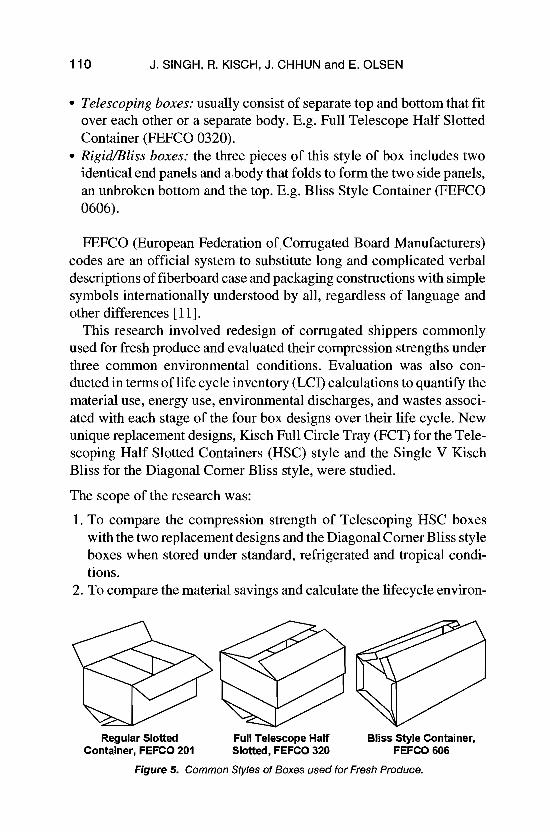
The three most commonly used styles of corrugated boxes for fresh-produce application are (Figure 5):
• Slotted boxes: generally made from one piece ofconugated or solid fiberboard. E.g. Regular Slotted Containers (FEFCa 0201).
110
J. SINGH, R. KISCH, J. CHHUN and E. OLSEN
• Telescoping boxes: usually consist of separate top and bottom that fit over each other or a separate body. E.g. Full Telescope Half Slotted Container (FEFCO 0320).
• Rigid/Bliss boxes: the three pieces of this style of box includes two identical end panels and a,body that folds to form the two side panels, an unbroken bottom and the top. E.g. Bliss Style Container (FEFCO 0606).
FEFCO (European Federation of,Corrugated Board Manufacturers) codes are an official system to substitute long and complicated verbal descriptions of fiberboard case and packaging constructions with simple symbols internationally understood by all, regardless of language and other differences [11].
This research involved redesign of corrugated shippers commonly used for fresh produce and evaluated their compression strengths under three common environmental conditions. Evaluation was also conducted in terms of life cycle inventory (LCI) calculations to quantify the material use, energy use, environmental discharges, and wastes associated with each stage of the four box designs over their life cycle. New unique replacement designs, Kisch Full Circle Tray (FCT) for the Telescoping Half Slotted Containers (HSC) style and the Single V Kisch Bliss for the Diagonal Corner Bliss style, were studied.
The scope of the research was:
1. To compare the compression strength of Telescoping HSC boxes with the two replacement designs and the Diagonal Corner Bliss style boxes when stored under standard, refrigerated and tropical conditions.
2. To compare the material savings and calculate the lifecycle environ-
Regular Slotted Full Telescope Half Bliss Style Container, Container, FEFCO 201 Slotted, FEFCO 320 FEFCO 606
Figure 5. Common Styles of Boxes used for Fresh Produce.

The Reducing Corrugated Fiberboard Carbon Footprint 111
Telescoping HSC Kisch FCT Diagonal Corner Bliss Single V Kisch Bliss
Figure 6. Box Designs Evaluated in the Study.
mental impact for the two replacement designs and the Diagonal Corner Bliss style with the Telescoping HSC design.
2.0 MATERIALS AND METHOD
2.1 Corrugated Board
C-flute corrugated board was used in the construction of both the bases and lids for all four designs (discussed in item 2.2). The lids were made with lower grade corrugated fiberboard with a basis weight of 17/15C/1? kg/92.9 sq. m. (38/33C/381bl 1000 sq. ft.) as compared to the bases, 25/18C/25 kgl 92.9 sq. m. (56/40C/561bl 1000 sq. ft.), as is common industry practice.
2.2 Container Designs
Four designs for the corrugated produce containers were constructed using ArtiosCAD software and the Premium Line 1930 model of the Kongsberg table (Esko Graphics, Ludlow, Massachusetts, USA). The designs included Telescoping HSC, Kisch FCT, Diagonal Corner Bliss and Single V Kisch Bliss and are shown in Figure 6. All boxes were constructed to have the same internal volume of approximately 0.03 cu. m. (0.93 cu. ft.).
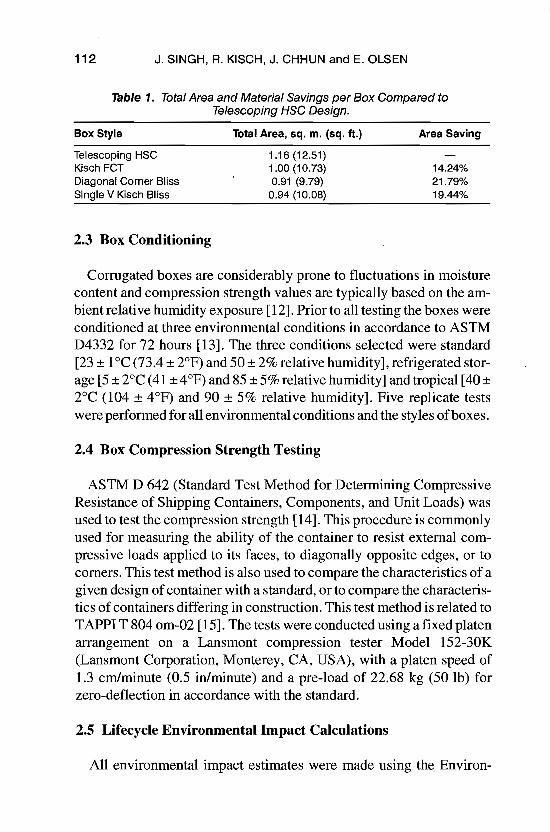
Table 1 reports the total area of the corrugated fiberboard used to construct the bases and lids for the four designs used in this study. It also reports the material savings for the two replacement designs and the Diagonal Corner Bliss style as compared to the Telescoping HSC box.
112 J. SINGH, R. KISCH, J. CHHUN and E. OLSEN
Table 1. Total Area and Material Savings per Box Compared to Telescoping HSC Design.
Box Style Total Area, sq. m. (sq. ft.) Area Saving
Telescoping HSC 1.16(12.51) Kisch FCT 1.00 (10.73) 14.24% Diagonal Corner Bliss 0.91 (9.79) 21.79% Single V Kisch Bliss 0.94 (10.08) 19.44%
2.3 Box Conditioning
Corrugated boxes are considerably prone to fluctuations in moisture content and compression strength values are typically based on the ambient relative humidity exposure [12]. Prior to all testing the boxes were conditioned at three environmental conditions in accordance to ASTM D4332 for 72 hours [13]. The three conditions selected were standard [23 ± 1°C (73.4 ± 2°P) and 50 ± 2% relative humidity], refrigerated storage [5 ± 2°C (41 ± 4°P) and 85 ± 5% relative humidity] and tropical [40 ± 2°C (104 ± 4°P) and 90 ± 5% relative humidity]. Pive replicate tests were performed for all environmental conditions and the styles ofboxes.
2.4 Box Compression Strength Testing
ASTM D 642 (Standard Test Method for Determining Compressive Resistance of Shipping Containers, Components, and Unit Loads) was used to test the compression strength [14]. This procedure is commonly used for measuring the ability of the container to resist external compressive loads applied to its faces, to diagonally opposite edges, or to corners. This test method is also used to compare the characteristics of a given design ofcontainer with a standard, or to compare the characteristics of containers differing in construction. This test method is related to TAPPI T 804 om-02 [15]. The tests were conducted using a fixed platen arrangement on a Lansmont compression tester Model 152-30K (Lansmont Corporation, Monterey, CA, USA), with a platen speed of 1.3 cm/minute (0.5 in/minute) and a pre-load of 22.68 kg (50 lb) for zero-deflection in accordance with the standard.
2.5 Lifecycle Environmental Impact Calculations
All environmental impact estimates were made using the Environ
Reducing Corrugated Fiberboard Carbon Footprint 11 3
mental Defense Fund Paper Calculator [15]. The information provided by this website is based on publicly available national averages and the research conducted by the Paper Task Force, a peer reviewed study of the lifecycle environmental impacts of paper production and disposal [16]. All calculations were based on the material usage for the four designs and a recycled content percentage of 43% [8]. Unbleached corrugated, as used to create all boxes for this research, was used as the identified paper type in the calculator.
3.0 RESULTS AND DISCUSSION
3.1 Box Compression Strength Testing
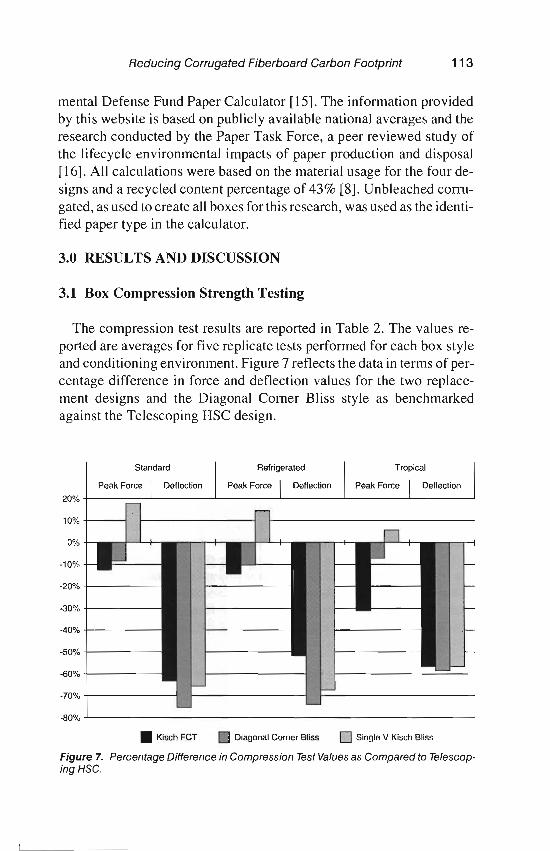
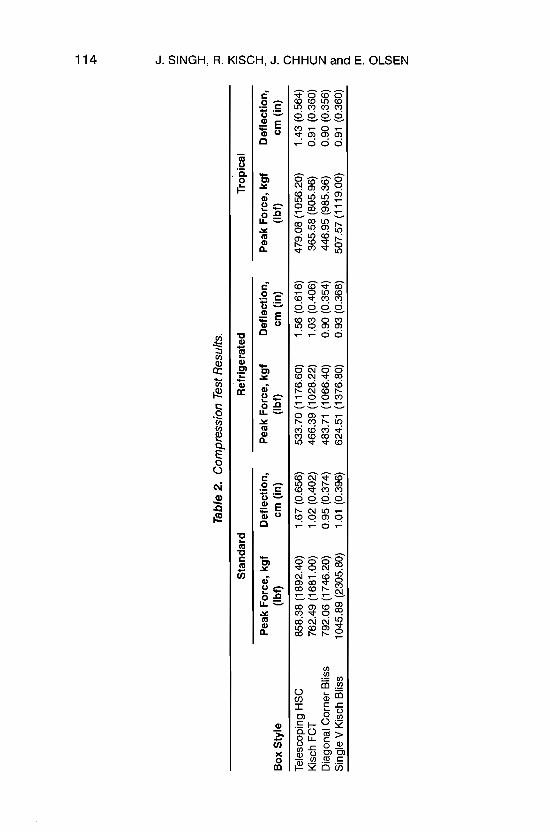
The compression test results are reported in Table 2. The values reported are averages for five replicate tests performed for each box style and conditioning environment. Figure 7 reflects the data in terms of percentage difference in force and deflection values for the two replacement designs and the Diagonal Corner Bliss style as benchmarked against the Telescoping HSC design.
j_~=':":~~L_':"'- J.. --.lI L ...L -" 20% 1
10% 1 I
0%
-10%
-20% +1----------1
-30% +1--------1
-40% +1-----
-50% +1-----
-60% "t1-------1
-70% 1 I
-80% -'-----------------------------------
• KischFCT Diagonal Corner Bliss 0 Single V Kisch Bliss
Figure 7. Percentage Difference in Compression Test Values as Compared to TelescopingHSC.
......
......
.j:>.
c....
00
Z
G>
I
Tabl
e 2.
C
om
pre
ssio
n T
est
Res
ults
. ::I
l
Bo
x S
tyle
Tel
esco
ping
HS
C
Kis
ch F
CT
D
iago
nal
Co
rne
r B
liss
Sin
gle
V K
isch
Blis
s
Pea
k F
orc
e, k
gf
Def
lect
ion
, (I
bf)
em
(in
)
858.
38 (
1892
.40)
1.
67 (
0.65
6)
762.
49 (
1681
.00)
1.
02 (
0.40
2)
792.
06 (
1746
.20)
0.
95 (
0.37
4)
1045
.89
(230
5.80
) 1.
01 (
0.39
6)
Sta
nd
ard
Pea
k F
orc
e, k
gf
Def
lect
ion
, (I
bf)
em
(in
)
533.
70 (
1176
.60)
1.
56 (
0.61
6)
466.
39 (
1028
.22)
1.
03 (
0.40
6)
483.
71
(106
6.40
) 0.
90 (
0.35
4)
624.
51 (
1376
.80)
0.
93 (
0.36
8)
Ref
rig
erat
ed
Tro
pic
al
Pea
k F
orc
e, k
gf
(Ib
f)
479.
08 (
1056
.20)
36
5.58
(80
5.96
) 44
6.95
(98
5.36
) 50
7.57
(11
19.0
0)
Def
lect
ion
, em
(in
)
1.43
(0.
564)
0.
91 (
0.36
0)
0.90
(0.
356)
0.
91 (
0.36
0)
A Ci.i o I c..
.. o I I C
Z
Al
:::J 0 m
o r 00
m
z
Reducing Corrugated Fiberboard Carbon Footprint 115
A shipper such as any of those tested, is likely to undergo compressive forces while exposed to the three climatic environments used for conditioning in this study. Comparing the average overall peak forces across all three environmental conditions ofthe Telescoping HSC boxes to that of the two new designs and the Diagonal Corner Bliss boxes, it was observed that:
• The Kisch FCT boxes were approximately 17% weaker, while providing material savings of over 14%.
• The Diagonal Corner Bliss boxes were approximately 9% weaker, while providing material savings of almost 22%.
• The Single V Kisch Bliss boxes were approximately 14% stronger, while providing material savings of over 19%.
It may be noted that the deflection, which is indicative of the side and bottom bulging ofthe boxes under compression, was considerably lower for the two replacement designs and the Diagonal Corner Bliss style as compared to that for the Telescoping HSC boxes (Figure 6). The lower peak deflection values are to be expected due to the reinforcing V columns incorporated in the new designs as well as the Diagonal Corner Bliss style boxes.
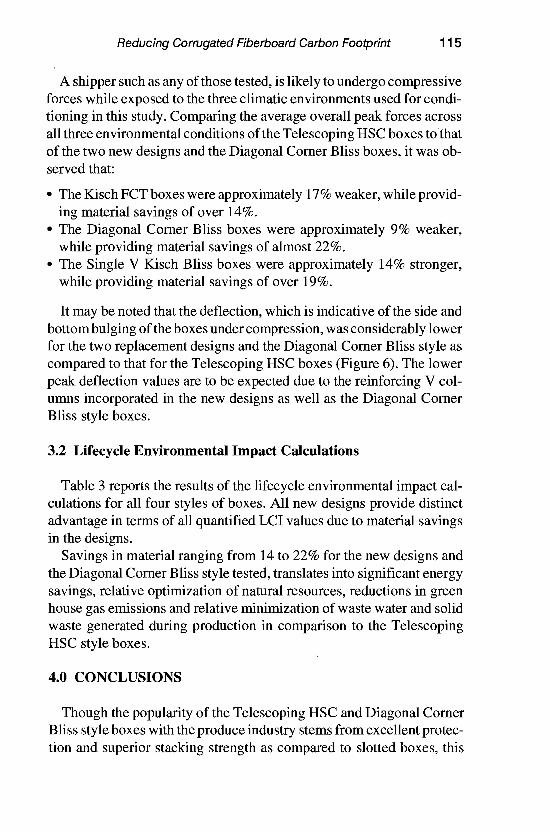
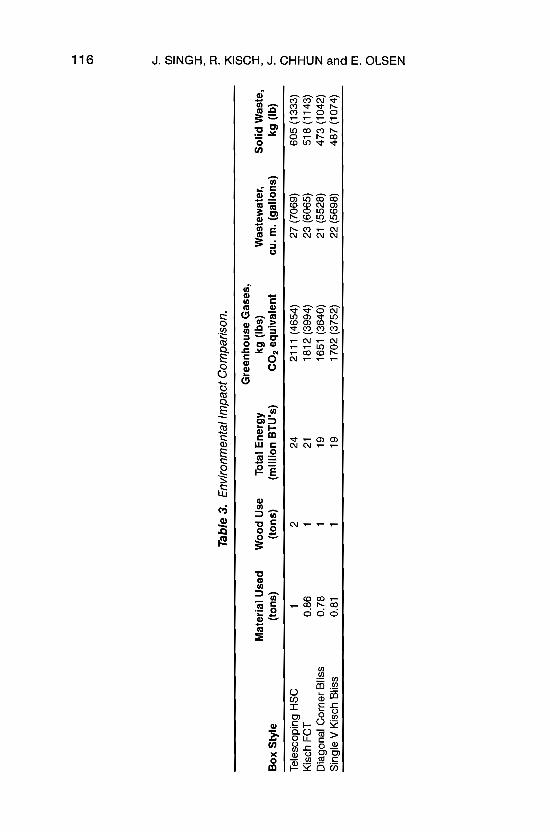
3.2 Lifecycle Environmental Impact Calculations
Table 3 reports the results of the lifecycle environmental impact calculations for all four styles of boxes. All new designs provide distinct advantage in terms of all quantified LCI values due to material savings in the designs.
Savings in material ranging from 14 to 22% for the new designs and the Diagonal Corner Bliss styIe tested, translates into significant energy savings, relative optimization of natural resources, reductions in green house gas emissions and relative minimization of waste water and solid waste generated during production in comparison to the Telescoping HSC style boxes.
4.0 CONCLUSIONS
Though the popularity of the Telescoping HSC and Diagonal Corner Bliss style boxes with the produce industry stems from excellent protection and superior stacking strength as compared to slotted boxes, this
......
......
0)
C
~
z (j)
I
Tab
le 3
. E
nvir
onm
enta
l Im
pa
ct C
ompa
riso
n.
;:c
A
Gre
enho
use
Gas
es,
Ci5
o M
ate
ria
l Use
d W
ood
Use
T
otal
Ene
rgy
kg (
Ibs)
W
aste
wat
er,
So
lid W
aste
, I
Bo
x S
tyle
(t
ons)
(t
on
s)
(mill
ion
BT
U's
) C
O2
eq
uiv
ale
nt
cu.
m.
(ga
llon
s)
kg (
Ib)
C
O
Tel
esco
ping
HS
C
Kis
ch F
CT
1
0.86
2 1
24
21
2111
(4
654)
1
81
2 (
3994
) 27
(70
69)
23 (
6065
) 6
05
(13
33)
51
8 (
1143
) I I C
D
iago
nal C
orn
er
Blis
s 0.
78
1 19
16
51 (
3640
) 21
(5
528)
4
73
(10
42)
Z
Sin
gle
V K
isch
Blis
s 0.
81
1 1
9
17
02
(37
52)
22 (
5698
) 4
87
(10
74)
lJl
:J
0 m
o r (J) m
z

117 Reducing Corrugated Fiberboard Carbon Footprint
study shows that the alternate designs proposed can provide adequate, if not better, stacking strength while using considerably lesser material in their construction. The Kisch FCT and the Single V Kisch Bliss box designs as well as an ergonomic rotary corrugated forming machine for the Kisch FCT containers have eitherbeen patented or are patent pending.
• Strength, resilience and sturdiness: While the Kisch FCT and the Diagonal Comer Bliss boxes provided somewhat lower resistance to compression forces as compared to the Telescoping HSC boxes, the Single V Kisch Bliss boxes proved to be superior in comparison. Considerable decrease in peak deflection values for the new designs as well as the Diagonal Comer Bliss boxes was observed in comparison to the Telescoping HSC boxes.
• Saving in material-commercial and environmental benefits: agricultural products such as apples, pears, citrus, potatoes, garlic and most vegetables are currently packed into Telescoping HSC and Diagonal Comer Bliss style containers. The estimated production ofthese boxes is in the hundreds of millions in the US [17]. This presents a new opportunity to create considerable savings by converting to any of the new style boxes studied in this research. Saving in material translates into significant energy savings, relative optimization of natural resources, reductions in green house gas emissions and relative minimization ofwaste water and solid waste generated during production.
The Kisch FCT and the Single V Kisch Bliss boxes when configured with an integral divider (Figure 8) would nearly guarantee no bottom
Kisch FCT Style Single V Kisch
Figure 8. Proposed Redesigns with Integral Dividers for Bulge Protection.
118 J. SINGH, R. KISCH, J. CHHUN and E. OLSEN
bulge, thereby offering total protection for the shipping of fruit and vegetables, unlike the Telescoping HSC which typically reflects bottom bulge failure which is directly related to fruit and vegetable damage.
REFERENCES
I. R. Cook, The U.S. Fresh Produce Industry: An Industry in Transition, Chapter 2 in Postharvest Technology of Horticultural Crops, Adel A. Kader (eds.), University of California Division of Agriculture and Natural Resources, Publication 3311, 2001, pp. 5-30.
2. Produce Marketing Association, Fact Sheet, 2007, Fresh Produce Imports into U.S., http://www.pma.com. accessed May 12,2008.
3. Produce Marketing Association, Fact Sheet, 2007, Fresh Produce Exports from U.S., http://www.pma.com. accessed May 12,2008.
4. C. Dimitri, A. Tegene, P. R. Kaufman, U.S. Fresh Produce Markets-Marketing Channels, Trade Practices, and Retail Pricing Behavior, Agricultural Economic Report Number 825, United States Department of Agriculture, September 2003.
5. E. W. McLaughlin, G. M. Green, K. Park, Changing Distribution Patterns in the U.S. Fresh Produce Industry: MidlLate-70s to MidlLate-90s, E.B. 99-03, June 1999, Department of Agricultural, Resource, and Managerial Economics, College of Agriculture and Life Sciences, Cornell University, Ithaca, NY.
6. Confederation� of Paper Industries, About Corrugated Packaging, http://www.ppic.org.uk/info/corrugated/aboutcorrugated.htm. accessed August 13,2008.
7. International Corrugated Case Association, Worldwide Corrugated Packaging Industry Statistics Report-Corrugated Statistics for 1st Quarter 2007, http://www.aiccbox.org/ pdf12007_Statistics_Qtrl.pdf, accessed August 12, 2008.
8.� International Corrugated Packaging Foundation, Corrugated Curricula-Course Materials on Corrugated Packaging, http://www.icpfbox.org/, accessed July 4, 2008.
9. Corrugated Packaging Alliance, Recycling Statistics, http://www.corrugated.org/Recycling/RecyclingStats.aspx, accessed August 5, 2008.
10. International Corrugated Packaging Foundation, The Facts about Corrugated Sustainability, Circulated to Packaging Programs in the US, January 2008.
II. FEFCO-ESBO Code, http://www.fefco.org/index.php?id=226, accessed January 16,2009.
12. Singh, J., Singh, S. P., Bainbridge, P. Olsen, E. "Variability in Compression Strength and Deflection ofCorrugated Containers as a Function of Positioning, Operators, and Climatic Conditions," Journal of Applied Packaging Research, Vol. 2, No.2, December 2007.
13. ASTM D4332-0I (2006), Standard Practice for Conditioning Containers, Packages, or Packaging Components for Testing, Vol. 15.10, American Society ofTesting and Materials, West Conshohocken, PA, USA, 2007.
14. ASTM D642, Standard Test Method for Determining Compressive Resistance of Shipping Containers, Components, and Unit Loads, Vol. 15.10, American Society of Testing and Materials, West Conshohocken, PA, USA, 2007.
15. T 804 om-06, Compression Test ofFiberboard Shipping Containers, 2006-2007 TAPPI Test Methods, Technical Association ofthe Pulp and Paper Industry, South Norcross, GA 30092.
16. Environmental� Defense Fund, Lifecycle Environmental Impact Calculator, http://www.papercalculator.org., accessed April 26, 2008.
17. Corrugated Packaging Alliance, Recycling Statistics, http://www.corrugated.org/Recycling/RecyclingStats.aspx, accessed April 5, 2008.