desd.nwpg.gov.zadesd.nwpg.gov.za/.../uploads/2019/04/Economics-Publishing-_2013.… · Web...
35
CHIEF MARKER'S / MODERATOR'S/ SUBJECT ANALYST’S REPORT FOR PUBLISHING SUBJECT: ECONOMICS PAPER: ONE INTRODUCTORY COMMENTS (How the paper was received; Papers too long/short/ balance) Generally this paper was well received by candidates. The candidates level of intelligence was considered, every learner was able to attempt the question irrespective of his or level of intelligence. SECTION 1 (General overview of Learner Performance in the question paper as a whole) The paper is of good standard. The content presented a good variety. any learner could attempt it and pass it, It has even included the challenging questions for the gifted candidates. SECTION 2
Transcript of desd.nwpg.gov.zadesd.nwpg.gov.za/.../uploads/2019/04/Economics-Publishing-_2013.… · Web...

CHIEF MARKER'S / MODERATOR'S/ SUBJECT ANALYST’S REPORT FOR PUBLISHING
SUBJECT: ECONOMICS PAPER: ONE
INTRODUCTORY COMMENTS (How the paper was received; Papers too long/short/balance)
Generally this paper was well received by candidates. The candidates level of intelligence was considered, every learner was able to
attempt the question irrespective of his or level of intelligence.
SECTION 1
(General overview of Learner Performance in the question paper as a whole)
The paper is of good standard. The content presented a good variety. any learner could attempt it and pass it, It has even included the challenging questions for the gifted candidates.
SECTION 2

1.1
Mul
tiple
choi
ce
1.2
One
wor
d
1.3
Mat
ch q
uesti
on
Q1
Tota
l
56.5
%
5.0%
3.1%
1.0%
QUESTION 1Provincial Avg
(Comments on candidates’ performance in the five individual sub questions (a) – (e) will be provided below. Comments will be provided for each question on a separate sheet). QUESTION 1
(a) General comments on the performance of learners in the specific question. Was the question well answered or poorly answered?
1.1 Most candidates performed very well in this question. Multiple choice is not a problem to them.1.2 Most candidates underperformed in this question.1.3 Most candidates performed well in this question.
(b) Reasons why the question was poorly answered. Specific examples, common errors and misconceptions are indicated.(c) Suggestions for improvement in relation to teaching and learning.
Q. 1.1.1.1.4 Most candidates got it wrong. They took it literally as something high as the ceiling is on top. Candidates cannot differentiate between general English words and Economics terms
2

SUGGESTIONS: Introduce Economics terms relating to the topic before starting any topic or
subtopic.Q. 1.2.1.2.1 and 1.2.4 Majority of the candidates got this questions wrong..
SUGGESTIONS: Expose candidates to most recent question papers i.e. from 2012 march to date
so that the candidates can get used to such questions. Introduce Economics terms relating to the topic to before starting any topic or
subtopic.
(d) Other specific observations relating to responses of learners. Candidates cannot differentiate the English words from Economic terms. Candidates are not used to giving a word for the sentence rather they are used to
choosing the right word between the two.
(e) Any other comments useful to teachers, subject advisors, teacher development, etc.
Introduce Economics terms relating to the topic before starting any topic or subtopic.
Expose candidates to most recent question papers i.e. from 2012 march to date so that the candidates can get used to such questions.
Introduce Economics terms relating to the topic before starting any topic or subtopic.
3

QUESTION 2
2.1
Choo
se o
ne w
ord
2.2
Fore
ign
exch
ange
2.3
Budg
et sp
eech
2.4
Bala
nce
of p
aym
ents
2.5
Busin
ess C
ycle
2.6P
ublic
sect
or p
ro-
visio
ning Q
2 To
tal
6.3% 8.
3%
5.0%
5.0%
15.4
%
20.4
%
25.9
%
QUESTION 2
(a) General comment on the performance of learners in the specific question. Was the question well answered or poorly answered?
This question was fairly answered. Most candidates attempted it and got most of the answers right.
Question 2.1 was fairly answered. Question 2.6 was well answered.
(b) Reasons why the question was poorly answered. Specific examples, common errors and misconceptions are indicated.(c) Suggestions for improvement in relation to teaching and learning.Q.2.2
Candidates were unable to list factors that influence the supply of foreign exchange. They were unable to apply the content that they learned in class to the data given to them.
SUGGESTIONS:
4

An in-depth preparation for the examination is required. More data response questions to be given to the candidates as class tests,
home work etc. From grade 10 so that when they get to grade 12 it must not be the first time that
they are exposed to such questions.Q. 2.3
2.3.1 Candidates do not know the recent Minister Of Finance. They were unable to read the message depicted in the cartoon. The candidates’ general knowledge is very weak. They gave names like Jacob Zuma, Tito Mboweni, Angie Motshegwa, Jonny
Jordan Zwelinzima Vavi Patrice Motsepe and those who got it right misspelled the name.
SUGGESTIONS: Make use of the budget speech that is published yearly to prepare learners for
this type of a question. Give cartoon exercise to learners and in get any available information on budget
and make use of it in class. In that fashion learners would be able to answer any budget question they are
faced with.Q 2.42.4.1 in their definition of balance of payment they neglect the caption( with the rest of the world )they just indicate within the world.
Candidates were unable to make use of the information given to them to answer the question.
The question is straight forward and the learner had just to apply knowldgeto the question and answer the questions according to the data.
Candidates do not know what constitutes trade balance Some candidates were unable to calculate the balance on the current account.
SUGGESTIONS: An in depth practice on the calculation of balance of payments needs to be done
with the candidates. The teachers should give different approaches to this question when they
prepare learners for the exam. Economic terms for each topic and subtopic should be done in class
Q.2.5
5

Candidates could not identify the demand side as well as the supply side policies.
Some candidates cannot differentiate monetary policy from fiscal policy. They do not know which information is relevant for fiscal policies and which are
monetary policy and which one falls under demand policies and which under supply policy.
SUGGESTIONS Develop key words for candidates in order for them to be able to recognise
monetary policy from fiscal policy .e.g. .Once it says MONETARY ,it means, it speaks about money issues such as
banks, finance institution etc. and fiscal is all about what the GOVERNMENT must do to smooth out the business cycle.
Q.2.6 Candidates could not explain the two concepts and that was just a recall
question. Candidates could not distinguish between nationalisation and privatisation. they
confuse nationalization with privatization and vice versa
SUGGESTIONS. Teach candidates in English as language of teaching. Any information that needs to be differentiated needs to be taught in tabular form.
(d) Other specific observations relating to responses of learners.
Most candidates started with 2.3.1 they had skipped 2.1 and 2.2.their attention was more consumed by the Cartoon.
Any question that needs calculation is a problem to most candidates 2.6 The use of English language is a problem because anyone who has good
English command can answer this question.
(e) Any other comments useful to teachers, subject advisors, teacher development, etc.
Give calculations questions to candidates as much as possible. The use of English as LOLT is highly emphasized. Use of correct formula that we use in Economics for any calculation e.g
calculation of percentage, calculation of GDP,GDE,GNI multiplier, interest rates, unemployment rate, CPIX etc.
Go to google/ SARB bulletin for balance of payment as source to use for data response question.
Any content that needs to differentiated needs to be taught in tabular form so that the candidates do not get confused as which information fall under which
6

heading or subheading. For economic language go to www.google /economics language. Education is always getting the largest percentage of the budget surely the
educators should be able explain it to learners as to why the largest percentage of the budget.
QUESTION 3
3.1
Cho
ose
one
wor
d
3.2
Char
acte
ristic
s of o
ligop
oly
3.3
Mar
ket f
ailu
re
3.4
Perf
ect m
arke
t
3.5
Com
petiti
on in
stitu
tions
3.6
Natu
ral a
nd a
rtific
ial
mon
opol
ies Q
3 To
tal
23.6
%
19.7
%
15.1
%
10.6
%
6.5%
5.9%
13.3
%
QUESTION 3Provincial Avg
7

3.1 ,3.2 well answered(a) General comment on the performance of learners in the specific question.
Was the question well answered or poorly answered?3.1 ,3.2 was fairly answered.3.3-3.6 poorly answered.
(b) Reasons why the question was poorly answered. Specific examples, common errors and misconceptions are indicated.(c) Suggestions for improvement in relation to teaching and learning.3.2
Candidates were unable to identify characteristics of oligopoly they confused them with those of monopoly.
SUGGESTIONS For your candidates to understand it better tabulate characteristics, monopolistic
competition, oligopoly and monopoly.3.3-3.4
The data response questions were poorly answered confusing questions. The interpretation of the question was very weak.
SUGGESTIONS Expose candidates to cartoons, case studies, economic magazines on the topic
that you are handling.3.4.2
Some learners are struggling to differentiate between Homogeneous goods and differentiated goods.
SUGGESTIONS Tabulate heterogeneous goods and differentiated goods and example thereof.
3.5 It was a difficult question to all the candidates. Most candidates did not attempt the question those who attempted it got it
wrong. SUGGESTIONS
A thorough preparation for examination is highly encouraged When teaching any topic cover all the subtopics for and expose candidates to
questions that relates to such content. It becomes very easy for learners to identify and answer such questions
because they are not exposed to such questions for the first time. Any content that needs to be differentiated needs to be taught in tabular form so
that the candidates do not get confused as which information fall under which heading or subheading.
8

3.6 Candidates could not differentiate natural monopolies from artificial monopoly
SUGGESTIONS Any content that needs to be differentiated needs to be taught and practiced in
tabular form for the candidates not to confuse two concepts.
(d) Other specific observations relating to responses of learners.
3.3-3.4 In data response questions they are unable to apply the content that they learned in class and to recent economic development.
3.5 The word key institutions confused the candidates.
(e) Any other comments useful to teachers, subject advisors, teacher development, etc.
3.3 Expose candidates to cartoons, case studies, economic magazines on the topic that you are handling.
Develop data response question bank on every topic from grade 10-12 so that candidates can be exposed to such questions as much as possible
QUESTION 4
9

4.1
Choo
se o
ne w
ord
4.2
Pot
entia
l Em
ploy
men
t cr
eatio
n
4.3
Wor
ld p
opul
ation
and
pov
erty
4.4
Nati
onal
Dev
elop
men
t Pla
n
4.5
BEE
as D
evel
opm
ent P
lan
4.6
Nort
h So
uth
Devi
de
Q4
Tota
l
27.6
%
28.1
%
16.8
%
20.7
%
20.5
%
20.7
%
21.9
%
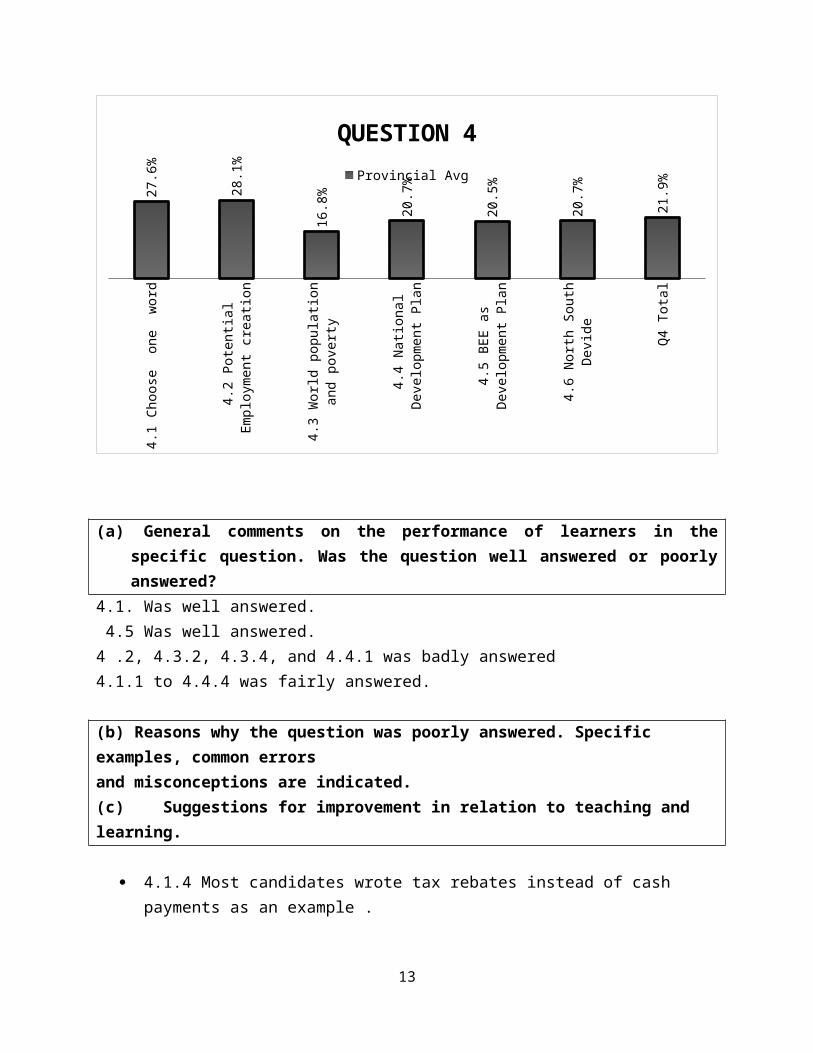
QUESTION 4Provincial Avg
(a) General comments on the performance of learners in the specific question. Was the question well answered or poorly answered?
4.1. Was well answered. 4.5 Was well answered.4 .2, 4.3.2, 4.3.4, and 4.4.1 was badly answered4.1.1 to 4.4.4 was fairly answered.
(b) Reasons why the question was poorly answered. Specific examples, common errors and misconceptions are indicated.(c) Suggestions for improvement in relation to teaching and learning.
4.1.4 Most candidates wrote tax rebates instead of cash payments as an example .
It may be that in some textbooks there is no distinction made between direct and indirect subsidies.
General knowledge relevant to the topic done in Economics is neglected.
SUGGESTIONS
10

Make use of different textbooks when teaching in order to supplement the information where it is neglected in the textbook that your candidates are using.
From grade 10 emphasise that Sector,Institution,Industries are the same. Any general knowledge that is relevant to the topic that you are teaching needs
to be shared with candidates. 4.3.2
Candidates explained poverty instead of poverty line.
SUGGESTIONS Candidates needs to be made aware of the latest Economic growth and
development policies and how they impact on our economic lifestyle ,the comittees responsible for such committees.
As you teach the topic infuse the latest economic information to the candidates
4.6 North South divide was haphazardly discussed. Whatever that they know in reasons of North or South they just gave without
considering that under which subheading does it fall. The North South was treated as geographical question Candidates gave North, South, East and West
SUGGESTIONS The effective way to teach North South divide is by tabulating it. Completion of curriculum and in depth revision is recommended.
(d) Other specific observations relating to responses of learners. The stats from the memo differs from the textbooks The candidates would have understood growth sectors better as industries. The candidates knew the answers but the phrasing of the question was
confusing. Some teachers deviate from the subject matter and dwell more on the political
part of it.
(e) Any other comments useful to teachers, subject advisors, teacher development, etc.
11

Make use of latest statistics when treating economic pursuits. Go to www.statssa.gov.za for the latest information on population, tourism,
employment, poverty etFor interpretation of cartoons go to www.google /economics cartoons.
QUESTION 5
5.1C
hoos
e on
e w
ord
5.2
Bene
fits o
f Tou
rim
5.3
Pollu
tion
5.4
Envi
ronm
enta
l sus
tain
abili
ty
5.5
Empl
oym
ent a
nd P
over
ty
5.6
prop
erty
rght
s
Q5
Tota
l
50.5
%
50.0
%
45.2
%
27.5
%
36.5
%
16.6
% 37.0
%
QUESTION 5Provincial Avg
(a) General comments on the performance of learners in the specific question. Was the question well answered or poorly answered?
5.1 Was well answered 5.2 Was well answered.5.3 and 5.5 was fairly answered.
(b) Reasons why the question was poorly answered. Specific examples, common errors
12
and misconceptions are indicated.(c) Suggestions for improvement in relation to teaching and learning.
Most candidates attempted this question and they got most of the questions right. 5.3.2
Candidates responded like people who never heard or read anything about Gold Reef City.
5.4.2 Candidates responses differ from that of the memorandum.
SUGGESTIONS Expose candidates to all the areas that are of interest in South Africa.
how they are applicable to the Economics and the topics of the subject.
5.4.3 Some candidates’ response was based on impact on human lives and not the
environment. Candidates were unable to interpret the cartoon and apply the content to the
cartoon.SUGGESTIONS
Give more cartoons, case studies, newspaper clips as well as internet information.
5.6 Most candidates got this question wrong. It was very difficult question.
SUGGESTIONSCompletion of curriculum and covering all aspects of of the curriculum is very important.
(d) Other specific observations relating to responses of learners. Some learners only source for study material is a textbook used by teacher and
the study guide provided by the department. Candidates are unable to interpret cartoons LO4 is taken for granted.
(e) Any other comments useful to teachers, subject advisors, teacher development, etc.
Use all the textbooks when preparing and other source of information at your disposal in order to complement the one or few sources that candidates only have.
Go to google /places of interest and select those that are relevant to the topic and teach your candidates.
For interpretation of cartoons go to www.google /economics cartoons.
13

QUESTION 6
6.1C
hoos
e on
e w
ord
6.2M
etho
ds o
f GDP
calcu
latio
n
6.3C
ircul
ar fl
ow
6.4
Cost
Ben
efit A
naly
sisi
6.5
Reas
ons f
or in
tern
aion
al
trad
e
6.6P
rice
Lead
ersh
ip a
nd ca
rtel
s
Q6
Tota
l
49.7
%
43.7
%
36.9
%
35.5
%
14.7
%
9.5%
31.5
%
QUESTION 6Provincial Avg
(a) General comments on the performance of learners in the specific question. Was the question well answered or poorly answered?
6.1, 6.2 and 6.4 was well answered. 6.3.2 -6.3.4 was fairly answered. 6.5 and 6.5 was poorly answered
(b) Reasons why the question was poorly answered. Specific examples, common errors and misconceptions are indicated.(c) Suggestions for improvement in relation to teaching and learning.6.2
Some gave the formula instead of mentioning the three methods of calculation.SUGGESTIONS
This was just a recall question it simply means that a thorough revision needs to be done.
6.3.1 They gave open economy as a type of economy.
SUGGETIONSA thorough revision of the content is highly recommended
14

6.3.2 They confused households from factor market
6.3.3 Candidates indicated leakages instead of injection. They wrote export, imports.
SUGGESTIONS6.3.2-6.3.4Make use of mnemonics, language tree, and mind map in order for the candidates not to confuse terms.6.4.1
The word (rationale) confused them. They gave the explanation of CBA
6.5 Candidates discussed raw material instead of labour as reasons of international
trade. They gave labour as one of the four factors of production. Some wrote demand, climate and supply. Some candidates anything they could think of that to them sounds like job
creation. e.g. labour resources as job creation and technology as communication They indicated cell phones, internet and computers.
SUGGESTIONS Economics terms, economics language when teaching Economics is
encouraged.
6.6 Candidates explained leadership in general and not price leadership. Most candidates do not know what Cartel is. Candidates confuse price leadership and general leadership.
SUGGESTIONS Where there are concepts that sound similar it is best to teach them in a tabular
form to avoid confusion. Mnemonics is encouraged.
(d) Other specific observations relating to responses of learners. There is a challenge in differentiating forms of collusion The use of English as LOLT is neglected. Sticking to the context of the subject is neglected. The use of economics terms is neglected.
(e) Any other comments useful to teachers, subject advisors, teacher
15

development, etc.For interpretation of cartoons go to www.google /economics cartoonsFor data response questions create a data response questions bank from previous question papers, newspaper clips, internet etc.In your content workshops and PSF`s discuss data response question.
QUESTION 7 7
.Effe
cts o
f fisc
al p
olicy
Q7
Tota
l
17.2
%
17.2
%
QUESTION 7Provincial Avg
(a) General comments on the performance of learners in the specific question. Was the question well answered or poorly answered?
This question was poorly answered.
(b) Reasons why the question was poorly answered. Specific examples, common errors and misconceptions are indicated.(c) Suggestions for improvement in relation to teaching and learning.
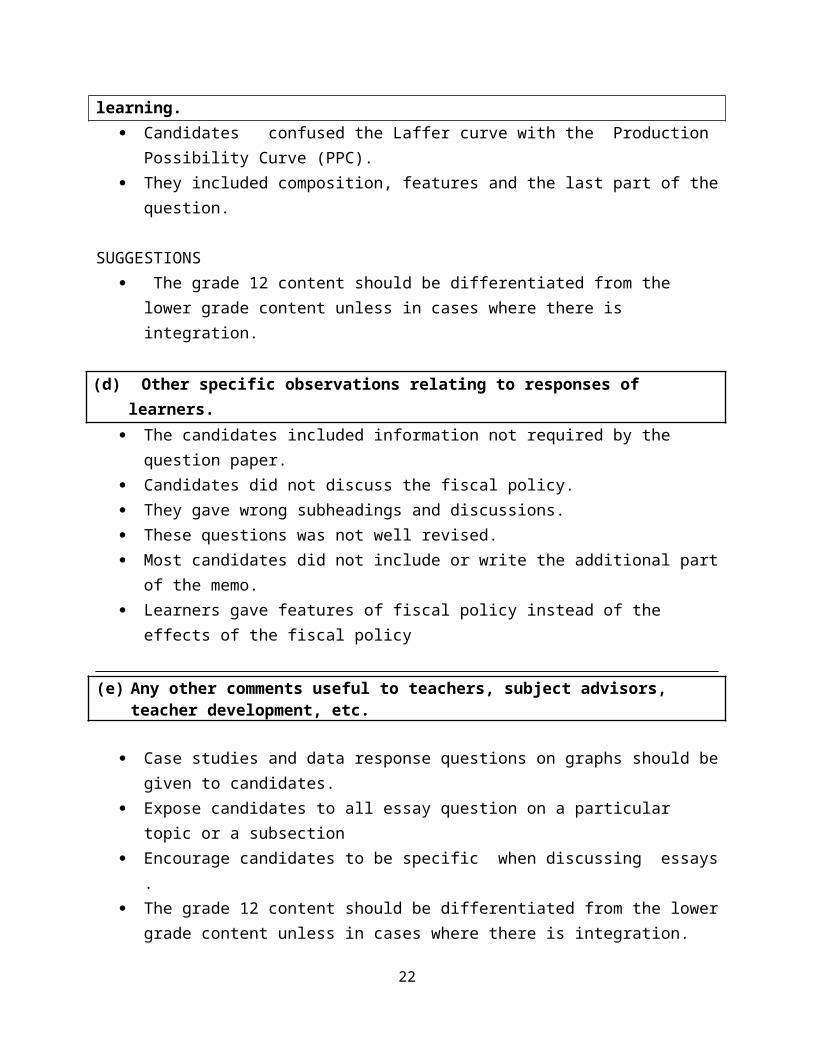
Candidates confused the Laffer curve with the Production Possibility Curve (PPC).
They included composition, features and the last part of the question.
16

SUGGESTIONS The grade 12 content should be differentiated from the lower grade content
unless in cases where there is integration.
(d) Other specific observations relating to responses of learners. The candidates included information not required by the question paper. Candidates did not discuss the fiscal policy. They gave wrong subheadings and discussions. These questions was not well revised. Most candidates did not include or write the additional part of the memo. Learners gave features of fiscal policy instead of the effects of the fiscal policy
(e) Any other comments useful to teachers, subject advisors, teacher development, etc.
Case studies and data response questions on graphs should be given to candidates.
Expose candidates to all essay question on a particular topic or a subsection Encourage candidates to be specific when discussing essays . The grade 12 content should be differentiated from the lower grade content
unless in cases where there is integration. A thorough revision of essays on every LO is very important. This was one essay
that candidates could have scored more marks.
QUESTION 8
17

8.Pe
rfec
t Com
petiti
on
Q8
Tota
l
22.6
%
22.6
%
QUESTION 8Provincial Avg
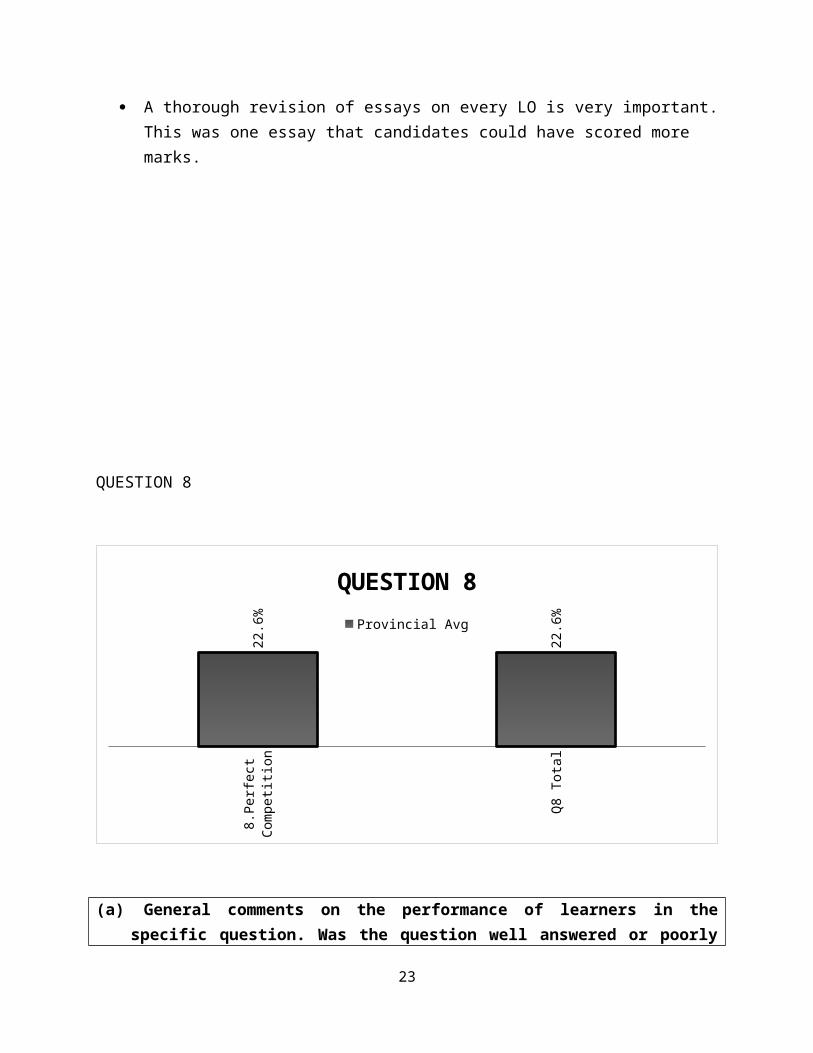
(a) General comments on the performance of learners in the specific question. Was the question well answered or poorly answered?
This question was poorly answered.
(b) Reasons why the question was poorly answered. Specific examples, common errors and misconceptions are indicated.(c) Suggestions for improvement in relation to teaching and learning.
Some candidates have drawn the graphs but they did not explain them. Some have explained it without drawing.
SUGGESTIONS Any graph`s interpretation needs to be explained. Essays must have introduction, body and conclusion. The introduction must be a definition or description of the topic that should be
discussed. DO NOT BE GENERAL. All essay formats are necessary as marks are allocated for that. The
subheadings of the content to be discussed is also emphasized As you teach graphs it is important to emphasize the heading of the graph,
labeling of the axis, indication of equilibrium and the shading where needed as well as the position of the curves.
18

(d) Other specific observations relating to responses of learners.
Markets are a problem to most of our candidates. Some might be able to draw graph and are unable to explain.
(e) Any other comments useful to teachers, subject advisors, teacher development, etc.
Any graph`s interpretation needs to be explained. Essays must be have introduction, body and conclusion. The introduction must be definition or description of the topic you about to
discuss. DO NOT BE GENERAL. All essay format are necessary as marks are allocated for that. The subheadings of the content to be discussed is also emphasized As you teach graphs it is important to emphasize the heading of the graph,
labeling of the axis, indication of equilibrium and the shading where needed as well as the position of the curves
QUESTION 9
9. S
DI a
nd ID
Z
Q9
Tota
l
3.7%
3.7%
QUESTION 9Provincial Avg
(a) General comments on the performance of learners in the specific question.
19

Was the question well answered or poorly answered? Most candidates did not attempt it .Those that did performed badly. They named the financial incentives without explaining it.
(b) Reasons why the question was poorly answered. Specific examples, common errors and misconceptions are indicated.(c) Suggestions for improvement in relation to teaching and learning.
LO 3 is taken for granted by most teachers and it is one LO that a learner can gain marks from it.
The candidates are used to answering IDZ and SDI separately and now in this case they had to answer it combined.
(d) Other specific observations relating to responses of learners. They confused SDI and IDZ question to economic growth and economic
development. They discussed the question out of context.
(e) Any other comments useful to teachers, subject advisors, teacher development,etc.
Essays must be have introduction, body and conclusion. The introduction must be definition or description of the topic you about to
discuss. DO NOT BE GENERAL. All essay formats are necessary as marks are allocated for that. The subheadings of the content to be discussed is also emphasized.
QUESTION 10
20

10. I
nflati
on
Q10
Tot
al
24.7
%
24.7
%
QUESTION 10Provincial Avg
(b) Reasons why the question was poorly answered.Specific examples, commonerrors and misconceptions are indicated.(c) Suggestions for improvement in relation to teaching and learning.
Candidates just looked at the word inflation and wrote what they know about inflation without properly reading through the question .
Candidates gave characteristics, types causes and measures to combat inflation
(d) Other specific observations relating to responses of learners. Candidates gave characteristics, types, causes instead measures to combat
inflation. The question was misinterpreted. The wrote little on measures but in consequences they wrote more while more
marks are allocated for the measures.
(e) Any other comments useful to teachers, subject advisors, teacher development, etc.
21
Essays must be have introduction, body and conclusion. The introduction must be definition or description of the topic you about to
discuss. DO NOT BE GENERAL. All essay formats are necessary as marks are allocated for that. The subheadings of the content to be discussed is also emphasized.
SECTION 3
(a) GRAPH OF PROVINCIAL PERFORMANCE IN THE PAPER (summary per question)
Q1
Tota
l
Q2
Tota
l
Q3
Tota
l
Q4
Tota
l
Q5
Tota
l
Q6
Tota
l
Q7
Tota
l
Q8
Tota
l
Q9
Tota
l
Q10
Tot
al
GRAN
D TO
TAL
54.3
%
25.9
%
13.3
% 21.9
%
37.0
%
31.5
%
17.2
% 22.6
%
3.7%
24.7
%
25.2
%
Provincial Average per questionProvincial Avg
GENERAL COMMENTS
Based on this graph question 5 and 6 was well performed. They experienced problems in question 3,7 and 9 This shows that educators should emphasize the budget, laffer curve and IDZ
&SDI.
(b) GRAPHS TO COMPARE DISTRICTS' PERFORMANCES PER QUESTION
22
Q1 Total Q2 Total Q3 Total0.0%
10.0%
20.0%
30.0%
40.0%
50.0%
60.0% 54.3
%
25.9
%
13.3
%
52.5
%
24.1
%
12.7
%
51.5
%
25.3
%
8.8%
59.6
%
31.2
%
14.6
%
55.2
%
24.3
%
17.7
%
QUESTION 1 - 3 PER DISTRICT
Provincial AvgBojanala Avg(91)DR KK Avg(92)DR Ruth Avg(93)NMM Avg(94)
Provincial Avg Bojanala Avg(91)
DR KK Avg(92) DR Ruth Avg(93) NMM Avg(94)0.0%
5.0%
10.0%
15.0%
20.0%
25.0%
30.0%
35.0%
40.0%
21.9
%
22.9
%
25.3
%
19.4
%
18.9
%
37.0
%
37.3
%
35.3
%
37.1
%
38.2
%
31.5
%
33.8
%
25.6
%
32.3
%
34.0
%
QUESTION 4 - 6 PER DISTRICT
Q4 TotalQ5 TotalQ6 Total
23

Provincial Avg Bojanala Avg(91)
DR KK Avg(92) DR Ruth Avg(93) NMM Avg(94)0.0%5.0%
10.0%15.0%20.0%25.0%30.0%35.0%40.0%
17.2
%
17.9
%
13.7
%
23.0
%
14.7
%22.6
%
18.2
%
15.2
% 21.8
%
38.1
%
3.7%
3.6% 4.4% 5.5%
1.2%
QUESTION 7 - 9 PER DISTRICT
Q7 TotalQ8 TotalQ9 Total
Bojanala Avg(91) DR KK Avg(92) DR Ruth Avg(93) NMM Avg(94)0.0%
5.0%
10.0%
15.0%
20.0%
25.0%
30.0%
35.0%
22.5%
17.9%
27.1%
33.3%
Question 10
24

COMMENTS ON PERFORMANCE OF DISTRICTS All the districts have performed well in question1 and 5 Bojanala performed well in question 5 and 6 Dr K.K has performed well in question 5 Ngaka Modiri Molema performed well in question 8 Dr Ruth performed well in question7 and 8 and 10
(d) DISTRIBUTION OF QUESTIONS IN TERMS OF COGNITIVE LEVELS (TABLE) ,
COGNITIVE LEVEL EXPECTEDMARKS
ACTUALMARKS
ACTUAL%
EXPECTED%
Knowledge andComprehension
90 92 31 30
Application and analysis
120 108 36 40
Synthesis and evaluation
90 100 33 30
Grand Total 300 300 100 100
25
QUESTION1 Marks
Level QUESTION 4
Marks Level
1.1 24 1 4.1 8 21.2 10 2 4.2 6 11.3 16 2 4.3 10 5
TOTAL 50 4.4 10 54.5 8 44.6 8 4
TOTAL 50QUESTION 2 QUESTIO
N 52.1 8 2 5.1 8 22.2 6 1 5.2 6 12.3 10 3 5.3 10 52.4 10 3 5.4 10 52.5 8 4 5.5 8 42.6 8 4 5.6 8 4
TOTAL 50 TOTAL 50QUESTION 3 QUESTIO
N 63.1 8 2 6.1 8 23.2 6 1 6.2 6 13.3 10 4 6.3 10 43.4 10 4 6.4 10 53.5 8 4 6.5 8 43.6 8 4 6.6 8 2
TOTAL 50 TOTAL 50QUESTION
7 50 68 50 59 50 6
10 50 4

(e) COVERAGE OF LEARNING OUTCOMES AND ASSESSMENT STANDARDS (TABLE)
LO &AS TOPIC QUESTION MARKS12.1.1 Circular flow 6.2 612.1.1 GDP 1.3.1 212.1.2 Multiplier 6.3 1012.1.2 Business cycle 1.1.3 212.1.3 Public sector 1.1.1 212.1.3 Budget 1.1.2 212.1.3 Market 1.1.4 212.1.4 Employment equity 1.2.2 212.1.3 Market exchange 12.2.3 212.1.4 Balance of payments 1.2.1 212.1.4 Fiscal policy 7 5012.1.3 Foreign market
exchange1.3.2 2
LO212.2.1 Market 1.2.2 212.2.1 Perfect competition 3.4 1012.2.1 Perfect competition 8 5012.2.1 Price competition 3.5 812.2.3 Natural and artificial
monopolies 3.6 812.2.3 Monopoly 1.3.7 212.2.3 Oligopoly 3.2 1012.2.2 Market failure 3.3 1012.2.2 Cost benefit analysis 6.4 812.2.1 Marginal cost 3.1.1 212.2.4 Public sector 3.1.2 212.2.3 3.1.3
LO312.3.112.3.412.3.3
12.3.312.3.1
12.3.4
12.3.412.3.4
BEEGrowth sectors
PovertyNorth SouthSDI and IDZ
Economic development
Industrial development
Economic indicatorsExport promotion
4.54.24.34.69
4.1.1
4.1.2
4.1.34.1.4
86
108
502
2
22
LO412.4.112.4.212.4.312.4.212.4.3
12.4.3
InflationTourismPollutionTourism
Environmental sustainability
Pollution1
105.25.35.55.6
1.2.4
506
1088
212.4.2 Tourism 1.2.5 2
26

12.2.3 Monopolistic competition
1.3.3 2
12.4.3 Pollution 1.3.5 212.1.2 Business cycle 1.3.6 212.2.3 Market failure 1.3.8 2
_____________________________________________________________ NAME DESIGNATION (Subject Analyst /Moderator or Chief Marker)
________________ SIGNATURE
________________DATE
27