DESCRIPTORS FOR CASSAVA MORPHOLOGICAL …gcp21.org/Tanzania/PhenotypicDescriptors.pdf · 21....
27
BECA DESCRIPTORS FOR CASSAVA MORPHOLOGICAL CHARACTERISATION W.M.G. Fukuda, C.L. Guevara, M.E. Ferguson and R. Kawuki Translated and adapted by IITA from FUKUDA and GUEVARA (1998) (EMBRAPA-CNPMF. Documentos, 78)
Transcript of DESCRIPTORS FOR CASSAVA MORPHOLOGICAL …gcp21.org/Tanzania/PhenotypicDescriptors.pdf · 21....

mobilizing biosciences for Africa's developmentkujumuisha sayansi ya bayolojia kwa maendeleo ya Afrika
moblisation des sciences biologique pour le developpement de l’Afrique
www.biosciencesafrica.org
BECA
DESCRIPTORS FOR CASSAVA MORPHOLOGICAL CHARACTERISATION
W.M.G. Fukuda, C.L. Guevara, M.E. Ferguson and R. Kawuki
Translated and adapted by IITA from FUKUDA and GUEVARA (1998) (EMBRAPA-CNPMF. Documentos, 78)

2
BACKGROUND This cassava descriptor list was adapted and translated from Fukuda, W.M.G. and C.L.Guevara. Descritores morfológicos e agronômicos para a caracterização de mandioca (Manihot esculenta Crantz.). Cruz das Almas: EMBRAPA-CNPMF, 1998, 38p. (EMBRAPA _CNPMF. Documentos, 78). This descriptor list has been prepared specifically for a project entitled ‘Tapping Crop Biodiversity for the Resource Poor in East and Central Africa’, funded by the Rockefeller Foundation (RF), the Generation Challenge Program (GCP), Biosciences eastern and central Africa (BecA), and implemented by the International Institute for Tropical Agriculture (IITA) (cassava component) and the International Crops Research Institute for the Semi-Arid Tropics (ICRISAT) (sorghum component). The national agriculture research institutes of seven countries namely DR Congo, Rwanda, Kenya, Uganda, Tanzania, Mozambique and Madagascar, are participating in the cassava component and have contributed to the adaptation of the descriptor list. Our thanks go to the authors and EMBRAPA for allowing us to use the descriptor list in this way. The list was also compared with the IPGRI descriptor list1. The majority of IPGRI descriptors are also encompassed here. Major objectives of the project are to document and characterise, both genotypically and phenotypically, cassava germplasm that breeders in the region are using. This includes inproved varieties as well as locally adapted farmer-varieties. To analyse data together and draw comparisons, it is important that data collection, data storage and data analysis are standardised. This descriptor list aims at helping to standardise characterisation data, although obviously a certain amount of subjective interpretation is inevitable. It is proposed that measurements are taken three, six and nine months after planting, and then at harvest. The traits to be evaluated on all these sampling occasions were selected after a consultative meeting with cassava breeders in the region. The traits are both descriptive, as well as being of agronomic value in the region. The majority of characters are qualitative, a few being quantitative. Equipment that would be useful for full characterisation includes calipers, a protractor and a digital balance under which cassava roots can be suspended. Further, this manual has also provided in the Annexes, relevant background information to some traits. The recommended experimental design is a replicated trial i.e. two sites with the same genotypes. In some countries this may not be possible due to quarantine restrictions. The two sites would serve two purposes: 1) enable estimation of environmental variance associated with some of the measurable traits, and 2) provide a back-up in case of unforeseen problems. At each site, each genotype should be represented by 10 plants in one row at a spacing of 1 m x 1 m between and within rows. To remove boarder effects, assessments should be done using the eight central plants only. A sample data sheet is provided in Annex V. It is our hope that this adapted and translated manual will not only help to standardize and record in a uniform format characterization data from national germplasm collections in the participating project countries, but across the region. We hope you find it useful! If you have comments or queries, please contact either Morag Ferguson ([email protected]) or Robert Kawuki ([email protected]). Morag Ferguson (IITA) Robert Kawuki (BECA / NARO)

3
CONTENTS Background 2 Descriptors to be scored three months after planting ………………… 5
1. Colour of apical leaves 5 2. Pubescence on apical leaves 5
Descriptors to be scored six months after planting …………………… 6
3. Leaf retention 6 4. Shape of central leaflet 6 5. Petiole colour 7 6. Leaf colour 7 7. Number of leaf lobes 7 8. Length of leaf lobe 8 9. Width of leaf lobe 8 10. Ratio of lobe length to lobe width of central leaf lobe 8 11. Lobe margins 8 12. Petiole length 8 13. Colour of leaf vein 9 14. Orientation of the petiole 9 15. Flowering 9 16. Pollen 9
Descriptors to be scored nine months after planting ………………… 10
17. Prominence of foliar scars 10 18. Colour of stem cortex 10 19. Colour of stem epidermis 10 20. Colour of stem exterior 11 21. Distance between leaf scars 11 22. Growth habit of stem 11 23. Colour of end branches of adult plant 12 24. Length of stipules 12 25. Stipule margin 12
Descriptors to be scored at harvest ……………………………………… 13
26. Fruit 13 27. Seed 13 28. Plant height 13 29. Height to first branching 13 30. Levels of branching 13 31. Branching habit 14 32. Angle of branching 14 33. Shape of plant 14 34. Number of storage roots per plant 15 35. Number of commercial roots per plant 15

4
36. Extent of root peduncle 15 37. Root constrictions 15 38. Root shape 16 39. External colour of storage root 16 40. Colour of root pulp (parenchyma) 16 41. Colour of root cortex 17 42. Cortex: ease of peeling 17 43. Texture of root epidermis 17 44. Root taste 17 45. Cortex thickness 17 46. Dry matter content 18 47. Starch content 18 48. Harvest index 18 49. Cyanogenic potential 18 50. Post-harvest deterioration 18
Annex I: Leaf retention Annex II: Harvest index Annex III: Assessment for dry matter and starch content Annex IV: Cyanogenic potential Annex V: Post-harvest deterioration

Three months after planting 5
DESCRIPTORS TO BE SCORED THREE MONTHS AFTER PLANTING 1. Colour of Apical Leaves Record the most frequent occurrence Damage by cassava green mite may obscure this trait, so it is better to score earlier rather than later. 3 Light green 5 Dark green 7 Purplish green 9 Purple 2. Pubescence on Apical Leaves Record the most frequent occurrence 0 Absent 1 Present
Purplish green Purple Light green Dark green
Present Absent

Six months after planting 6
DESCRIPTORS TO BE SCORED SIX MONTHS AFTER PLANTING 3. Leaf Retention Measured 5-6 months after planting (See Annex 1) Visually score for leaf retention using a scale of 1-5. An average plant is one with leaves covering about ½ of the plant. Record the most frequent occurrence on all the 8 central plants per clone/plot. 1= Very poor retention 2= Less than average retention 3= Average leaf retention 4= Better than average retention 5= Out standing leaf retention 4. Shape of Central Leaflet Leaf taken from a mid-height position Record the most frequent occurrence 1 Ovoid 2 Elliptic-lanceolate 3 Obovate-lanceolate 4 Oblong-lanceolate 5 Lanceolate 6 Straight or linear 7 Pandurate 8 Linear-piramidal 9 Linear-pandurate 10 Linear-hostatilobalate
Central leaflet
1 2 4 3 5 6 7 8 9 10

Six months after planting 7
5. Petiole Colour Leaf taken from a mid-height position Record the most frequent occurrence Intermediate descriptor states allowed. 1 Yellowish -green 2 Green 3 Reddish green 5 Greenish red 7 Red 9 Purple 6. Leaf Colour Observe a leaf from the middle of the plant. Record the most frequent occurrence. No intermediates allowed 3 Light green 5 Dark green 7 Purple green 9 Purple
7. Number of Leaf Lobes Observe a leaf from the middle of the plant. Assess on five leaves and take the predominant number of lobes. Record only one score. 3 Three lobes 5 Five lobes 7 Seven lobes 9 Nine lobes 11 Eleven lobes
Eleven lobes Nine lobes
Three lobes Five lobes
Seven lobes
Light green Dark green Purple green Purple
Green
Reddish-green
Greenish-red
Red
Purple
Yellowish-green

Six months after planting 8
8. Length of Leaf Lobe Measure two leaves from the middle of the plant. Measure from the intersection of all lobes to the end of the middle lobe. Expressed in cm, and record to one decimal place. 9. Width of Leaf Lobe Measure two leaves from the middle of the plant. Measure from the widest part of the middle lobe. Expressed in cm, and record to one decimal place. 10. Ratio of Lobe Length to Lobe Width of Central Leaf Lobe 11. Lobe Margins Observe from the middle third of the plant. Record the most frequent occurrence. No intermediates allowed. 3 Smooth 7 Winding 12. Petiole Length Observe from the middle third of the plant. Measure two leaves per plant. Expressed in cm.
Smooth Winding
Six months after planting 9
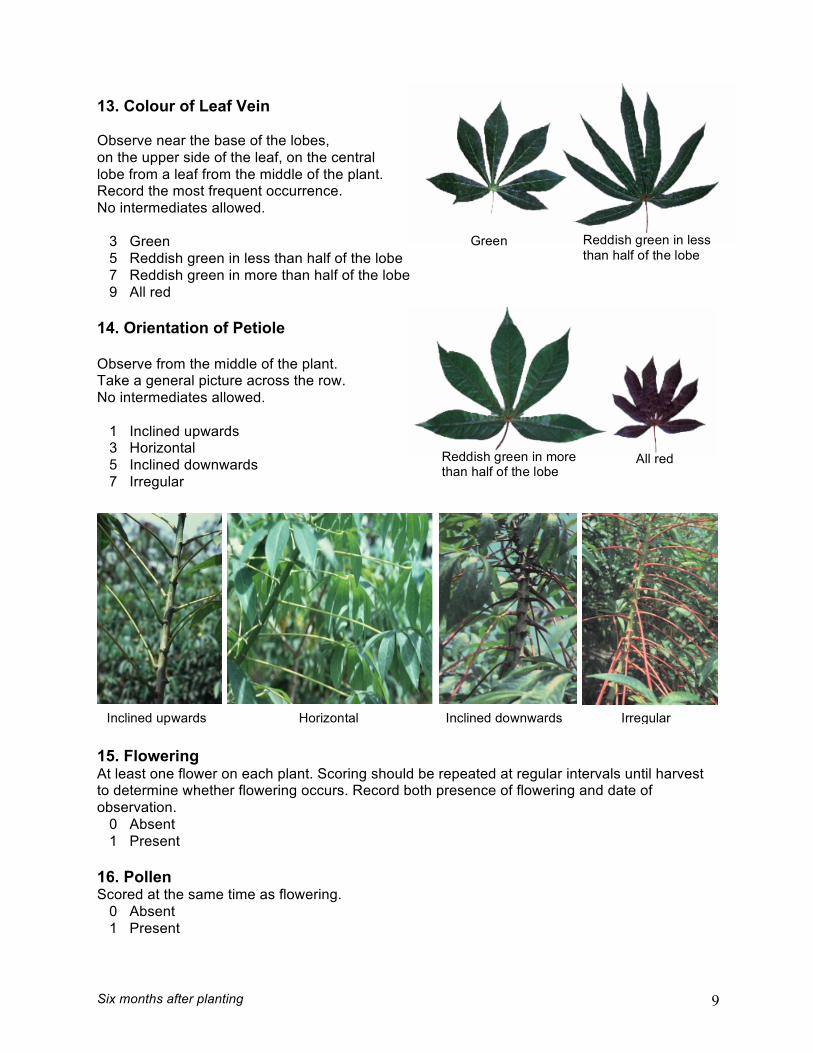
13. Colour of Leaf Vein Observe near the base of the lobes, on the upper side of the leaf, on the central lobe from a leaf from the middle of the plant. Record the most frequent occurrence. No intermediates allowed. 3 Green 5 Reddish green in less than half of the lobe 7 Reddish green in more than half of the lobe 9 All red 14. Orientation of Petiole Observe from the middle of the plant. Take a general picture across the row. No intermediates allowed. 1 Inclined upwards 3 Horizontal 5 Inclined downwards 7 Irregular 15. Flowering At least one flower on each plant. Scoring should be repeated at regular intervals until harvest to determine whether flowering occurs. Record both presence of flowering and date of observation. 0 Absent 1 Present 16. Pollen Scored at the same time as flowering. 0 Absent 1 Present
Reddish green in more than half of the lobe
All red
Inclined upwards Horizontal Inclined downwards Irregular
Green Reddish green in less than half of the lobe

Nine months after planting 10
DESCRIPTORS TO BE SCORED NINE MONTHS AFTER PLANTING 17. Prominence of Foliar Scars Observe from the middle third of the plant. Record the most frequent occurrence. 3 Semi-prominent 5 Prominent 18. Colour of Stem Cortex Observe from the middle third of the plant. Make a small shallow cut and peel back the epidermis as in picture below. 1 Orange 2 Light green 3 Dark green 19. Colour of Stem Epidermis Peel epidermis back and look at underside of epidermis (skin) 1 Cream 2 Light brown 3 Dark brown 4 Orange
Semi-prominent Prominent
Dark green Light green Orange
Light brown Dark brown Orange Cream

Nine months after planting 11
20. Colour of Stem Exterior Observed on middle third of the plant 3 Orange 4 Greeny-yellowish 5 Golden 6 Light brown 7 Silver 8 Grey 9 Dark brown 21. Distance between Leaf Scars Measurement taken from middle of stem on the middle third of the plant, where the scars are not flat. Make a measurement along the stem then divide the distance by the number of nodes in the measured part. Avoid taking measurements on mealy bug infected plants. For conversion to qualitative data: 3 Short ≤ ( 8 cm ) 5 Medium ( 8 - 15 cm ) 7 Long ≥ (15 cm ) 22. Growth Habit of Stem 1 Straight 2 Zig-zag
Orange Greeny-yellowish
Golden Light brown
Silver Grey Dark brown
Straight Zig-zag
Medium Long Short

Nine months after planting 12
23. Colour of End Branches of Adult Plant Observation to be taken on top 20 cm of plant Intermediates allowed. Record the most frequent occurrence. 3 Green 5 Green-purple 7 Purple 24. Length of Stipules Observation from upper third of plant Record the most frequent occurrence. No intermediates allowed. 3 Short 5 Long 25. Stipule Margin Observation from upper third of plant. Record the most frequent occurrence. No intermediates allowed. 1 Entire 2 Split or forked
Green Green-purple Purple
Short Long
Entire Split of forked

Harvest measurements 13
DESCRIPTORS TO BE SCORED AT HARVEST 26. Fruit 0 Absent 1 Present 27. Seed 0 Absent 1 Present 28. Plant Height Vertical height from the ground to the top of the canopy. Expressed in cm. Record measurements from three plants. 29. Height to First Branching Vertical height from ground to first primary branch 0 = no branching. Ignore side branching. Expresses in cm. Record measurements from three plants.
30. Levels of Branching Number of divisions of branching Zero (0) for no branching Ignore if side branching Record the most frequent occurrence.

Harvest measurements 14
31. Branching Habit Observed at the lowest or first branching. Record the most frequent occurrence on the plot. 1 Erect 2 Dichotomous 3 Trichotomous 4 Tetrachotomous 32. Angle of Branching Measure at first primary branching (not side branches) Record the angle measured, later divide the angle by two. Record measurements from three plants. 33. Shape of Plant Record the most frequent occurrence on the plot. 1 Compact 2 Open 3 Umbrella 4 Cylindrical
Dichotomous Trichotomous Tetrachotomous Erect
Compact Open Umbrella Cylindrical

Harvest measurements 15
34. Number of Storage Roots per Plant Record from each of three plants 35. Number of Commercial Roots per Plant Record the number of roots from three plants with length greater than 20 cm) 36. Extent of Root Peduncle Main roots only Record the most frequent occurrence 0 Sessile 3 Pendunculate 5 Mixed 37. Root Constrictions Measure on a mature root Can be affected by nematode and or cassava brown streak Record the most frequent occurrence 1 Few to none 2 Some 3 Many
Sessile Pedunculate
Mixed
Few to none (3 or less)
Some (4 to 6)
Few to none (3 or less)

Harvest measurements 16
38. Root Shape Record the most frequent occurrence 1 Conical 2 Conical-cylindrical 3 Cylindrical 4 Irregular 39. External Colour of Storage Root Record the most frequent occurrence. 1 White or cream 2 Yellow 3 Light brown 4 Dark brown 40. Colour of Root Pulp (parenchyma) Record the most frequent occurrence. 1 White 2 Cream 3 Yellow 4 Orange (no photo) 5 Pink
Conical Cylindrical
Irregular
Conical-cylindrical
White or cream
Yellow
Light brown
Dark brown
White
Cream Yellow
Pink

Harvest measurements 17
41. Colour of Root Cortex Record the most frequent occurrence. 1 White or cream 2 Yellow 3 Pink 4 Purple 42. Cortex: Ease of Peeling 1 Easy 2 Difficult 43. Texture of Root Epidermis Record the most common root type Please touch the root! 3 Smooth 5 Intermediate 7 Rough 44. Root Taste Raw only 1 Sweet 2 Intermediate 3 Bitter 45. Cortex Thickness Measure from three roots, at the proximal (closest to stem), mid and distal (furthest from stem) ends. Use calipers if available, otherwise try to estimate 1 Thin 2 Intermediate 3 Thick
White or cream
Yellow
Pink
Purple
Smooth
Rough

Harvest measurements 18
46. Dry Matter Content (%)
See Annex II for details. Measure on three plants.
47. Starch Content (%)
See Annex II for details. Measure on three plants.
48. Harvest Index
See Annex III for details. Measure on 4-6 plants per clone.
49. Cyanogenic Potential (CNP)
See Annex IV for details. Score 1 – 9 for four plants per clone and three roots per plant.
50. Post Harvest Deterioration Optional descriptor. See Annex V for details.

19
Annex I
Leaf retention Background Unlike other crops i.e., cereal grains, cassava experiences simultaneous growth and development of the economic plant part (roots) and the photosynthetic sites, the leaves. Hypothetically, this could suggest that greater leaf longevity will result into higher yields. However, because of the simultaneous growth of the roots and the leaves, there is competition for assimilates for development of leaf area index (LAI) and roots. Thus, if longevity of leaves in increased to maintain high photosynthetic rates, it could be possible to maintain a given LAI with less distribution of assimilates to leaf development and hence more to the root growth. Hence, this trait presents an additional opportunity to increase cassava yields. Interestingly, its heritability is relatively high (0.55). It’s against this background that we propose to include it in the study. Assessment 1. Done between 5-6 months after planting; this period normally coincides with drought stress in most cassava growing regions in eastern and southern Africa 2. Visually score for leaf retention using a scale of 1-5. An average plant is one with leaves covering about ½ of the plant. 1= Very poor retention 2= Less than average retention 3= Average leaf retention 4= Better than average retention 5= Out standing leaf retention 3. Record per clone should be made by observing all the 8 central plants per clone. Reference Lenis, J.I; Calle, F.; Jaramillo, G.; Pérez, J.C; Ceballos, H., and Cock, J. 2005. Leaf retention and cassava productivity. Field Crops Res. (In press)

20
Annex II Assessment for Dry Matter (DM) and starch content Heritability for DM in cassava is relatively high; 80-92% broad sense heritability and 62% for the narrow sense heritability. Estimation of DM and starch content in cassava bases on the principle of a linear relationship between specific gravity with DM and or starch content. Percentage DM = 158.3x – 142, while starch content = 112.1x -106.4; where x = specific gravity. Specific gravity is measured using the following procedure:
1. Prepare root samples weighing 3-5 kgs. 2. Weigh sample in air (Wa) using a suitable balance. Ensure that that the roots are
generally free from soil and other debris
3. Weigh the sample in water (Ww)
4. Ensure that you use the same container to weigh both in air and in water. A sturdy wire basket works perfectly as it allows soil debris to fall through and also allows easy measurement in water.
5. Compute specific gravity from
Ww____ Wa-Ww
6. Compute DM and starch content using the formulas DM = 158.3x – 142, and starch content = 112.1x -106.4.
Enter the data into the format as outlines below: Clone Wa (g) Ww (g) Specific gravity (x) DM% Starch % Variety 1 Variety n Reference Kawano K, Gonçalvez Fukuda WM, and Cenpukdee U, 1987. Genetic and environmental effects on dry matter content of cassava root. Crop Science, 27:69–74

21
Annex III Harvest index Background Harvest index (HI) defined as the proportion of root weight in biomass (on a fresh weight basis), is a valuable trait in cassava breeding. As opposed to selections based solely on fresh root yield, HI-based selections are stable across evaluations stages and will truly represent genotype yield potential under monoculture. Clearly, true genetic progress in cassava will be achieved through utilisation of HI. Interestingly, heritability for HI is relatively high and its assessment is also relatively simple and straightforward. It’s against this background that we propose to incorporate this trait in the study. Assessment
1. At harvest, uproot 4-6 plants per clone 2. Separately, weigh the roots and the above ground biomass (stems, branches and
leaves) 3. Compute HI as
Weight of roots Weight of roots + weight of above ground biomass
4. Repeat process 1 to 3 for all entries and record observations in the following format
Clone No. of plants Root wt (kg) Above-ground wt (kg) Total wt HI Reference
Kawano, K. 1990. Harvest index and evolution of major food crops cultivars in the tropics. Euphytica, 46:195-202.

22
Annex IV Cyanogenic Potential (CNP) Background To date, no acyanogenic cassava has been reported; glycosides, linamarin and lotaustralin are found within all cassava plants. On contact with the enzyme linamarase, (released upon tissue damage, as in many forms of processing), acetone cyanohydrin and glucose are produced. The acetone cyanohydrin either spontaneously breaks down or it is acted upon by the enzyme hydroxynitrile lyase to produce acetone and hydrogen cyanide. In practice, low CNP varieties are desirable for both safe human and animal utilisation. Elsewhere, studies have established a relationship between CNP levels in cassava and starch physical properties (viscosity, cooking time, gel instability and gelification index). In some parts of Africa, bitter varieties (which in most cases happen to have high CNP level) are reported to have higher starch content, make better quality products, which even store better. It’s against this background that we propose to examine this trait. Assessment of CNP
1. There are large effects of environments on root cyanogens; nevertheless, both broad and narrow sense heritabilities for CNP are high ranging between 0.87- 1.07.
2. Because CNP varies considerably between plants, analysis will be done using 4
plants/clone, and on 3 roots per plant.
3. Materials required include: knives, glass tubes (12 cm long with tightly fitted rubber stops); and the scoring scale.
4. Consumables required include: filter papers (Whatman No. 1.6 cm x 1 cm); picric acid;
anhydrous sodium carbonate and toluene. Please note that both picric acid and toluene (methylbenzene or phenyl methane) are hazardous chemicals, and hence they need to be handled carefully.
5. To prepare picrate alkaline solution, dissolve 25g of anhydrous sodium carbonate and
5g of picric acid in distilled water, and make up to 1L. Remember to prepare solution prior to leaving to the field.
6. For each root sample, make a cross-sectional cut at the mid root position
7. Pinpoint the mid position between the peel and the centre of the parenchyma (root flesh)
and make a 1cm3 cube cut
8. Place the cut root cube into a glass tube and add 5 drops of toluene onto it; tightly seal the glass tube with the stopper.
9. Take a strip of Whatman filter paper and dip it into freshly prepared alkaline picrate
mixture until saturated.

23
10. Suspend the picrate-saturated filter paper above the cut root cube in the glass tube; ensure that the tube is tightly fitted with the rubber stopper.
11. After 10-12 hours, score for colour intensity using the 1-9 scale showed below.
The generated data should be recorded in the format shown below: Clone Plant Number Root sample HCN Score 1 1 1 2 1 3 2 1 2 2 2 3 3 1 3 2 3 3 4 1 4 2 4 3

24
Annex V
Post harvest deterioration The rapid post-harvest deterioration of cassava continues to be a huge challenge towards the commercialisation of the crop in the East and central African region. Clearly, the production chain of cassava from the field, storage, and transportation to processing centres would benefit from a longer shelf life than currently exists. This aspect has drawn limited research attention in the region. As a staring point, it’s vital to examine variation of this trait in the regional germplasm collection with the objective of identifying parental lines with higher shelf life that can be used in hybridisation schemes in the region. Moreover, narrow sense heritability for post-harvest deterioration reflecting both physiological and microbial effects have been reported to range between 0.4 to 0.6. It’s against this background that we propose to examine this trait in cassava. Assessment procedure:
1. Randomly select five commercially sized roots (minimum length 18 cm) to represent each clone
2. Cut of a section about 1 cm from both the proximal and distal ends; cover the distal end with clingfilm
3. Store the roots under ambient conditions 4. After 7 days make seven 2 cm transversal slices starting from the proximal end 5. Score each slice on a scale of 1-10, corresponding to the percentage of the cut surface
showing discolouration (with 1= 10% and 10 = 100%) 6. Make average of the seven slices to represent the deterioration of the root
The generated data should be recorded in the format shown below: Clone Root No. Deterioration score (1-10) on the 2 cm slices 1 2 3 4 5 6 7 Mean Remark 1 2 3 4 5 Reference Kawano, K. and C. Rojanaridpiched. 1983. Genetic study on post-harvest root deterioration in cassava. Kasetsart Journal, Thailand. 17:14-26.

25
DATA SHEET
CHARACTERISATION OF CASSAVA GERMPLASM IN EASTERN AND SOUTHERN AFRICA
Country: Site: Date of planting: Accession name: Trait Schedule Score Remark
1. Colour of apical leaves 2-3 MAP 2. Pubescence on apical leaves 2-3 MAP 3. Leaf retention 5-6 MAP
4. Shape of central leaflet 6 MAP 5. Colour of petiole 6 MAP
6. Colour of leaf 6 MAP 7. Number of leaf lobes 6 MAP 8. Length of leaf lobe 6 MAP 1st Leaf lobe 6 MAP 2nd leaf lobe 6 MAP 9. Width of leaf lobe 6 MAP 1st Leaf lobe 6 MAP 2nd leaf lobe 6 MAP 10. Ratio of leaf lobe 6 MAP 1st Leaf lobe 6 MAP 2nd leaf lobe 6 MAP 11. Lobe margins 12. Petiole length 6 MAP 1st Leaf sample 6 MAP 2nd leaf sample 6 MAP 13. Colour of leaf vein 6 MAP 14. Orientation of petiole 6 MAP 15. Flowering 6 MAP onwards Date of scoring 16. Pollen 6 MAP onwards 17. Prominence of foliar scars 9 MAP 18. Colour of stem cortex 9 MAP 19. Colour of stem epidermis 9 MAP 20. Colour of stem epidermis 21. Distance between leaf scars 9 MAP 1st measurement 2nd measurement 22. Growth habit of stem 9 MAP 23. Colour of end branches 9 MAP 24. Length of stipule 9 MAP 25. Stipule margin 9 MAP 26. Fruit 5-12 Months 27. Seed 8-12 months

26
Trait Schedule Score Remark 28. Height of plant At harvest 1st Plant At harvest 2nd Plant At harvest 3rd Plant At harvest 29. Height of first branching At harvest 1st Plant At harvest 2nd Plant At harvest 3rd Plant At harvest 30. Levels of branching At harvest 31. Branching Habit At harvest 32. Angle of Branching At harvest 1st Plant At harvest 2nd Plant At harvest 3rd Plant At harvest 33. Shape of plant At harvest 34. Number of storage roots per
plant
At harvest
1st Plant 2nd Plant 3rd Plant 35. Number of commercial roots
per plant (minimum in length 18 cm)
At harvest
1st Plant 2nd Plant 3rd Plant 36. Extent of root peduncle At harvest 37. Root constriction At harvest 38. Root shape At harvest 39. External colour of root At harvest 40. Colour of the root pulp
(parenchyma) At harvest
41. Colour of root cortex At harvest 42. Cortex ease of peeling At harvest 43. Texture of root epidermis At harvest 44. Root taste At harvest
45. Peel thickness assessment Root No. Proximal (mm) Mid (mm) Distal (mm) 1 2 3 Mean

27
46 & 47. Dry matter and starch content Weight in air (g) Weight in water (g) Specific gravity (x) DM% Starch % 48. Harvest index (HI) No. of plants Root wt (kg) Above-ground wt (kg) Total wt HI 49. Hydrogen cyanide (CNP) Plant Number Root sample HCN Score 1 1 1 2 1 3 2 1 2 2 2 3 3 1 3 2 3 3 4 1 4 2 4 3 Mean 50. Post-harvest deterioration Clone Root No. Deterioration score (1-10) on the 2 cm slices 1 2 3 4 5 6 7 Mean Remark 1 2 3 4 5 References Lenis, J.I; Calle, F.; Jaramillo, G.; Pérez, J.C; Ceballos, H., and Cock, J. 2005. Leaf retention and cassava productivity. Field Crops Res. (In press) Kawano, K. 1990. Harvest index and evolution of major food crops cultivars in the tropics. Euphytica, 46:195-202. Kawano K, Gonçalvez Fukuda WM, and Cenpukdee U, 1987. Genetic and environmental effects on dry matter content of cassava root. Crop Science, 27:69–74