Describing water flow in macroporous field soils using the modified macro model
18
Describing water flow in macroporous field soils using the modified macro model Robert Ludwig a,1 , Horst H. Gerke b, * , Ole Wendroth b a Department of Geology III, Ruhr-Universita ¨t Bochum, Universita ¨tsstr. 150, D-44801 Bochum, Germany b Department of Soil Landscape Research, Center for Agricultural Landscape and Land Use Research (ZALF), Eberswalder Strasse 84, D- 15374 Mu ¨ncheberg, Germany Received 6 November 1997; accepted 8 June 1998 Abstract Preferential soil water movement was simulated using a modified version of the MACRO model. The study contributes to the analysis of the field water regime and the solute balance of two tile-drained no-till agricultural soils influenced by shallow groundwater tables. Previously measured soil matric potentials and groundwater levels as well as Bromide and dye tracer experiments indicated that flow and transport along preferential pathways might be quantitatively important at the heavy clay as well as at the sandy loam site. The objective of this study was to optimally describe the field measured matric potentials and groundwater level fluctuations by using a one- and a two-domain version of the MACRO model and by model calibration using available data. The original MACRO model was modified with respect to simulating effects of groundwater table fluctuations and tile drains in the one-dimensional flow model by including a sink term, based on the potential theory and an empirical approach, that approximately relates the local to the field water regime. We use an implicit finite difference discretization together with a Newton–Raphson iterative scheme for the numerical solution of the model. The coupled matrix and macropore flow equations are solved sequentially. Model parameters were calibrated using laboratory-measured soil hydraulic parameters and field-measured time series of matric potentials and water tables. Comparisons between the measured and simulated water table fluctuations indicate that the consideration of preferential flow in macropores improves the one-dimensional description of the water regime of the aggregated clayey soil. For the sandy loam soil, neither the modified MACRO nor a one-domain model could explain observed preferential flow patterns. The failure at the sandy loam site may possibly be caused by periodically occurring hydrophobic conditions at the soil surface or by the existence of fissures in a relatively low permeable subsoil horizon, effects which could not be considered in the model. Hydraulic parameters of the soil matrix and macropore system could satisfactorily be calibrated. However, the parameters of the exchange term describing water transfer between the inter- and intraaggregate pore system could not be clearly identified using the available field data. q 1999 Elsevier Science B.V. All rights reserved. Keywords: Dual-porosity; MACRO model; Preferential flow; Soil hydraulic properties; Model calibration; Groundwater table 1. Introduction In macroporous soils, infiltrating water may, under certain conditions, bypass most of the soil volume and move rapidly into deeper soil layers through contin- uous pores formed, for instance, by cracks, fissures, Journal of Hydrology 215 (1999) 135–152 0022-1694/99/$ - see front matter q 1999 Elsevier Science B.V. All rights reserved. PII: S0022-1694(98)00266-2 * Corresponding author. Fax: +49 334332 82280; e-mail: hger- [email protected] 1 Fax: ( 1 49) 234 709 4120; e-mail: [email protected] bochum.de
-
Upload
robert-ludwig -
Category
Documents
-
view
213 -
download
1
Transcript of Describing water flow in macroporous field soils using the modified macro model
Describing water flow in macroporous field soils using the modifiedmacro model
Robert Ludwiga,1, Horst H. Gerkeb,* , Ole Wendrothb
aDepartment of Geology III, Ruhr-Universita¨t Bochum, Universita¨tsstr. 150, D-44801 Bochum, GermanybDepartment of Soil Landscape Research, Center for Agricultural Landscape and Land Use Research (ZALF), Eberswalder Strasse 84, D-
15374 Muncheberg, Germany
Received 6 November 1997; accepted 8 June 1998
Abstract
Preferential soil water movement was simulated using a modified version of the MACRO model. The study contributes to theanalysis of the field water regime and the solute balance of two tile-drained no-till agricultural soils influenced by shallowgroundwater tables. Previously measured soil matric potentials and groundwater levels as well as Bromide and dye tracerexperiments indicated that flow and transport along preferential pathways might be quantitatively important at the heavy clay aswell as at the sandy loam site. The objective of this study was to optimally describe the field measured matric potentials andgroundwater level fluctuations by using a one- and a two-domain version of the MACRO model and by model calibration usingavailable data. The original MACRO model was modified with respect to simulating effects of groundwater table fluctuationsand tile drains in the one-dimensional flow model by including a sink term, based on the potential theory and an empiricalapproach, that approximately relates the local to the field water regime. We use an implicit finite difference discretizationtogether with a Newton–Raphson iterative scheme for the numerical solution of the model. The coupled matrix and macroporeflow equations are solved sequentially. Model parameters were calibrated using laboratory-measured soil hydraulic parametersand field-measured time series of matric potentials and water tables. Comparisons between the measured and simulated watertable fluctuations indicate that the consideration of preferential flow in macropores improves the one-dimensional description ofthe water regime of the aggregated clayey soil. For the sandy loam soil, neither the modified MACRO nor a one-domain modelcould explain observed preferential flow patterns. The failure at the sandy loam site may possibly be caused by periodicallyoccurring hydrophobic conditions at the soil surface or by the existence of fissures in a relatively low permeable subsoil horizon,effects which could not be considered in the model. Hydraulic parameters of the soil matrix and macropore system couldsatisfactorily be calibrated. However, the parameters of the exchange term describing water transfer between the inter- andintraaggregate pore system could not be clearly identified using the available field data.q 1999 Elsevier Science B.V. All rightsreserved.
Keywords:Dual-porosity; MACRO model; Preferential flow; Soil hydraulic properties; Model calibration; Groundwater table
1. Introduction
In macroporous soils, infiltrating water may, undercertain conditions, bypass most of the soil volume andmove rapidly into deeper soil layers through contin-uous pores formed, for instance, by cracks, fissures,
Journal of Hydrology 215 (1999) 135–152
0022-1694/99/$ - see front matterq 1999 Elsevier Science B.V. All rights reserved.PII: S0022-1694(98)00266-2
* Corresponding author. Fax: +49 334332 82280; e-mail: [email protected]
1 Fax: ( 1 49) 234 709 4120; e-mail: [email protected]

worm burrows or root channels. Such preferentialmovement of water and dissolved constituents hasbeen observed in a large number of studies (e.g.,Germann and Beven, 1981; Beven and Germann,1982; Ghodrati and Jury, 1990; see also in vanGenuchten and Rolston, 1990; Gish and Shirmoham-madi, 1991). Preferential flow limits the applicabilityof available models for flow in homogeneous porousmedia to predict the movement of water and leachingof dissolved chemicals from agricultural and othersoils (e.g., White, 1985). Quantitative descriptionsof flow in macroporous soils under field situationsare still rather limited to a few studies (e.g., Othmeret al., 1991; Bronswijk et al., 1995; Ritsema andDekker, 1995) or restricted to relatively simplifiedsystems or boundary conditions. Bypass flow wasfound to depend also on the amount and intensity ofrainfall, the value of the saturated hydraulic conduc-tivity at the soil surface, the absorption of water by thesoil matrix, and the geometry of the macropore system(Hoogmoed and Bouma, 1980; Booltink and Bouma,1993; Booltink et al., 1993). In addition to the pedonscale, thefield scale includes effects of spatial varia-bility of soil hydraulic properties (Biggar and Nielsen,1976; Roth et al., 1991) and of boundary conditions(Mohanty et al., 1994, 1996, 1997) on the waterregime. Field-scale distributed bypass flow has beenanalyzed and simulated only in relatively few studies.For instance, Booltink (1994) included an empirical‘tipping-bucket’ bypass flow module in the Richards’-equation-based LEACHM model (Wagenet andHutson, 1989) and used a Monte-Carlo approach tostudy the observed bypass flow at the field scale for atile-drained site with heavy clay soils. Recently,considerable preferential transport of Bromide-tracer(Wichtmann et al., 1998) as well as of pesticides(Lennartz et al., 1997) was reported from observationsat a tile-drained agricultural field site with fine-textured soils.
This study is a contribution to the analysis of thefield scale soil water regime and solute balance at twoequally managed no-till agricultural fields in northeastGermany, which are both tile-drained and character-ized by relatively high groundwater levels. Previouslymeasured rapid soil water potential and groundwaterlevel fluctuations, following storm events, as well asresults of Bromide- and dye-tracer experimentsindicated that flow and transport along preferential
pathways could possibly be quantitatively importantto explain the field soil water regimes and for calcu-lating field solute balances at both sites (Wendroth etal., 1999, this issue). The observation that the ground-water table rapidly rises immediately after rainstormscould be explained either by preferential flow throughhighly permeable soil units as a result of the field scalespatial variability of soil hydraulic properties, or bybypass flow in soil macropores or continuous crackswithin a single soil unit as a result of local (pore oraggregate) scale soil heterogeneity, or possibly by acombination of these two processes. The effects ofboth types of preferential water movement on theoutflow characteristics may qualitatively be identical,however, the volumes and especially the solute traveltime scales can be considerably different from whatwas shown in a sensitivity study using a two-dimensional dual-porosity model and spatiallyvariable hydraulic properties (Vogel et al., 1993;Gerke and Vogel, 1994). As the dye tracer studiesclearly demonstrated the existence of flow and trans-port along macropores, at least at the clay-soil fieldsite, we first consider here the local scale preferentialflow type, i.e., in a one-dimensional, vertically layeredsoil profile. Soil spatial variability and solutetransport, will be analyzed in subsequent studies.
Models describing bypass flow in macropores(Beven, 1991) including temporal non-equilibria inthe pressure head between the macropore and soilmatrix regions (Tu¨rk et al., 1991) are mostly basedon the two-domain or double-porosity approach, initi-ally introduced by Barenblatt (1960) for simulatingflow in fractured rocks. In this approach, the totalsoil volume is conceptually divided into two domains,one with relatively low (soil matrix) and the other(macropore system) with relatively high permeability.The two domains are coupled by a source/sink term todescribe the exchange of water and solutes. Dual-porosity models of the mobile-immobile type neglectmacroscopic water flow in the soil matrix (vanGenuchten and Dalton, 1986) while those of thedual-permeability type include water flow in the soilmatrix. Dual-permeability models describe water flowin the soil matrix using Richards’ equation while flowin the macropore domain is described either by assum-ing validity of Darcy’s law (Gerke and van Genuch-ten, 1993a), or by using the kinematic wave equationassuming gravity flow (Germann and Beven, 1985;
R. Ludwig et al. / Journal of Hydrology 215 (1999) 135–152136

Jarvis et al., 1991a) or the Chezy-Manning equationfor turbulent flow (Chen and Wagenet, 1992). Watertransfer is described proportional to the difference inthe pressure head (Othmer et al., 1991; Gerke and vanGenuchten, 1993b, 1996) and the degree of watersaturation (Jarvis et al., 1991a) between the domains,or by using Philip’s infiltration equation (Chen andWagenet, 1992) (for a detailed review see vanGenuchten and Gerke, 1993).
Considering the presence of overcapillary-sizedpores at the cracked clay soil, we selected the numer-ical two-domain model MACRO (Jarvis et al., 1991a,1991b) in which the description of flow in the macro-pore domain is based on the kinematic wave theory(Germann and Beven, 1985; Germann, 1990; DiPetroand LaFolie, 1991; Germann and DiPetro, 1996;Germann and Bu¨rgi, 1996). The MACRO modelwas applied successfully earlier to describe thewater regime of a lysimeter of 8 m height containingaggregated soils with macropores (Ludwig, 1995),among other studies (Andreu et al., 1994, Jabro etal., 1994). The original MACRO model was notdesigned for the specific conditions in which a shal-low groundwater table connects the one-dimensionalsoil water movement with the field water regime.Thus, the MACRO model was modified here withrespect to the boundary conditions and the numericalsolution schemes to consider the effect of the fieldwater regime in the one-dimensional model approach.
A number of methods were proposed to quantifythe soil structure and the effect of structure on macro-pore flow (Ehlers, 1975; Bouma and Dekker, 1978;Bouma et al., 1978, 1981, 1982; Booltink and Bouma,1991; Booltink, 1994; Droogers et al., 1997). Boumaand Dekker (1978) suggested a method to calculatethe volume of functional macropores from the stainedareas of macropore walls and the pore widths. In aphysico-morphological approach, based on the workof Hoogmoed and Bouma (1980), Hatano and Bool-tink (1992) and Booltink et al. (1993) used fractionaldimensions of macropore-stains formed by bypassflow to characterize the structure of cracking claysoils. Most of the methods proposed for independentdeterminations of soil structural parameters, however,are applicable only for strongly structured clayeysoils.
For this modeling study, we could use only theexisting data which were obtained mainly for the
purpose of analyzing the spatio-temporal variabilityof soil physical and hydraulic properties at the fieldscale. Data of soil structural parameters, as mentionedearlier, or detailed water potential readings duringsingle storm events were not available. As, in additionto the limited data base, some of the parameters of theMACRO model (e.g., macropore flow, water transfer)are usually empirical or cannot be directly obtained bymeasurements, we examined, if and how well theunknown parameters could be approximated by cali-bration of both, a one- and the two-domain modelapproach. Special attention is paid to the descriptionof the calibration procedure in which we modified themost sensitive parameters to obtain an improved fitbetween simulated and observed groundwater leveland matric potential fluctuations.
The purpose of this modeling study is to find out ifthe observed indication for preferential flow of thefield investigations could be quantitatively betterdescribed by using either a one- or a two-domainapproach. The objectives are to quantitatively analyzethe soil matrix and macropore water movement at thetwo no-till agricultural field sites differing in soiltexture and structure, to adopt the MACRO modelaccording to the site-specific conditions, to calibratethe model parameters for the one- and the two-domainapproach, and to improve the water flow descriptionand to develop a simulation tool for quantifying thepreferential solute movement at the two sites in subse-quent studies.
2. Model description
2.1. Conceptual model
The dual-porosity MACRO model approach (Jarviset al., 1991a) assumes that one-dimensional soil watermovement can be simulated separately in the matrixand the macropore domain. Originally, the matrixpore system was assumed to consist of the capillary-sized portion of the pore system while non-capillary-sized larger pores form the interconnected network ofthe macropore domain. For the purpose of this study,the two domains are distinguished according to differ-ences in the hydraulic conductivity (see chapter Para-meter Calibration). Thus, the macropore domain mayinclude here the overcapillary-sized pores as well as
R. Ludwig et al. / Journal of Hydrology 215 (1999) 135–152 137

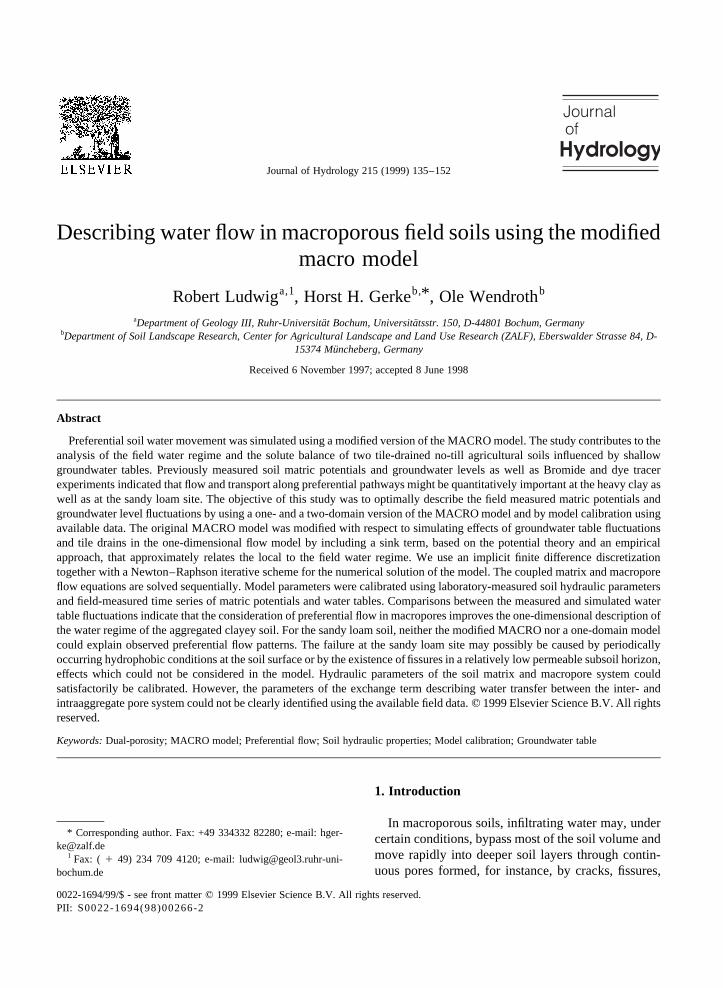
the larger and more continuous capillary-sized pores.The one-dimensional flow domain comprises the vari-ably saturated upper as well as the water-saturatedlower parts of the soil profile (Fig. 1). The upperboundary is located at the soil surface (z� 0), whilethe lower boundary is fixed at a reference depth withinthe groundwater zone or at an impermeable layer (Z0
in Fig. 1).The model used here, differs from the original
MACRO model (Jarvis et al., 1991a) with respectto the boundary conditions and by considering asaturated zone located in the bottom part of theflow region. By applying an implicit numericalscheme for solving the Richards’ equation, both,unsaturated and saturated flow can be consideredin the matrix domain. However, the macroporeflow domain is restricted to the water unsaturatedpart of the soil profile where gravity-driven verticalflow can be assumed (Fig. 1). An increasing ground-water table will lead to shorter travel distances forthe vertical bypass-flow. The application of thekinematic wave equation conceptually ends wherewater is entering the groundwater, i.e., shortlyabove the water table. We assume that the ground-water table in both, the matrix and macroporedomains, is at the same depthZ. Water table fluc-tuations in just one domain are simply forced toequilibrate instantaneously by transferring waterinto the matrix system and adjusting the depth of
the bottom boundary of the fracture domain to thatof the water table.
Similar to the original MACRO model, water flowcan also be calculated in one flow domain only, forinstance, during periods with relatively low precipita-tion rates, if water is infiltrating entirely into thematrix domain. Water transfer is assumed to takeplace only in one direction, i.e., from the macroporeinto the matrix system. The modified MACRO modelapproximates horizontal groundwater flow and watermovement through the tile drains by means of anadditional sink term in the one-dimensional flowmodel. The sink term considers the effect of thefield water regime on the groundwater level byapproximating changes in the soil water volume,depending on the difference in water table heightbetween the one-dimensional model location and thenearest ditch or tile drain outlet (Fig. 2). For simpli-city, the properties of the macropore domain areassumed to be constant with depth in this model.
2.2. Water flow model
The modified MACRO model describes one-dimensional vertical unsaturated and saturated waterflow in the soil matrix domain. For the unsaturatedzone or bypass-flow region, the model assumes thatthe properties and fluxes of the bulk soil can be char-acterized by two sets of hydraulic properties which arerelated as follows:
1 � 1m 1 1f ; �1a�
u � um 1 uf ; �1b�
Ks � Ks;m 1 Ks;f ; �1c�
q� qm 1 qf ; �1d�where1 (z) is the porosity [L3 L 23], u(z,t) the volu-metric water content [L3 L 23], Ks(z) the saturatedhydraulic conductivity [L T21], q(z,t) the water fluxdensity [L T21], and the subscripts m indicate the soilmatrix, f the macropore or fracture domain, and s thevalues at water saturation. The properties of themacropore domain,1 f, u f, and Ks,f, are identicalthroughout all soil horizons in the unsaturated zone.The water contents,um and u f, are defined as thevolumes of water in the soil matrix and macropore
R. Ludwig et al. / Journal of Hydrology 215 (1999) 135–152138
Fig. 1. Conceptual representation of the modified MACRO model.

domain, respectively, divided by the total soil volume.Within the groundwater zone and for the single-domain case, we define:
1 � 1m; �2a�
u � um; �2b�
Ks � Ks;m; �2c�
q� qm: �2d�We further assume
us;f � 1f and us;m � 1m: �3�One-dimensional vertical water flow in the matrix
domain is described with the following form of the
Richards’ equation
2u
2t� 2
2zKm�u� 2h
2z2 1
� �� �1 Sw 2 Slat; �4�
in which Km(z,t) is the hydraulic conductivity andh(z,t) is the pressure head [L] of the matrix domain,Sw is a source term [T21] accounting for water transferfrom the macropore to the matrix domain,Slat is asource/sink term [T21] used for approximating lateraldrainage from the groundwater zone of the one-dimensional flow region, and wherez is oriented verti-cally downward. As in the unsaturated zone,u f ! ,um, we assume thatu � um may be valid for the wholesoil profile.
In the macropore domain, we assume that capillaryforces are negligibly small compared to gravity.Consequently, instead of using Darcy’s law, waterflow is calculated based on the kinematic wave
R. Ludwig et al. / Journal of Hydrology 215 (1999) 135–152 139
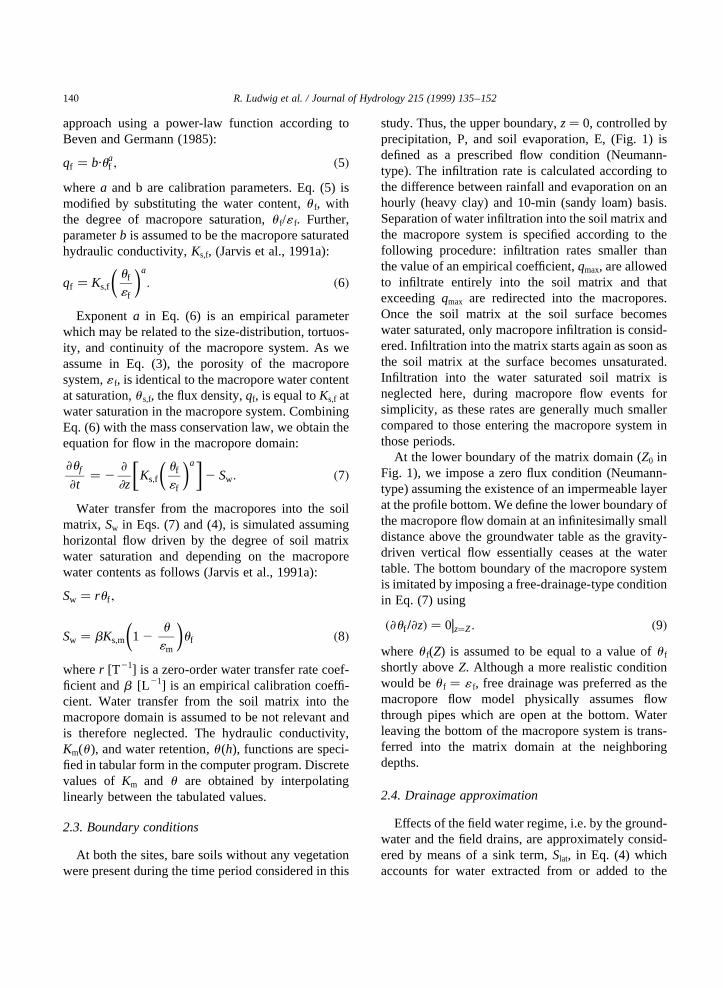
Fig. 2. Two-dimensional vertical cross-section through the considered tile-drained area (sandy-loam site at Arensdorf) and conceptual schemefor illustrating the sink term,Slat, for approximating lateral drainage towards tile drains.
approach using a power-law function according toBeven and Germann (1985):
qf � b·uaf ; �5�
wherea and b are calibration parameters. Eq. (5) ismodified by substituting the water content,u f, withthe degree of macropore saturation,u f/1 f. Further,parameterb is assumed to be the macropore saturatedhydraulic conductivity,Ks,f, (Jarvis et al., 1991a):
qf � Ks;fuf
1f
� �a
: �6�
Exponenta in Eq. (6) is an empirical parameterwhich may be related to the size-distribution, tortuos-ity, and continuity of the macropore system. As weassume in Eq. (3), the porosity of the macroporesystem,1 f, is identical to the macropore water contentat saturation,u s,f, the flux density,qf, is equal toKs,f atwater saturation in the macropore system. CombiningEq. (6) with the mass conservation law, we obtain theequation for flow in the macropore domain:
2uf
2t� 2
2
2zKs;f
uf
1f
� �a� �2 Sw: �7�
Water transfer from the macropores into the soilmatrix, Sw in Eqs. (7) and (4), is simulated assuminghorizontal flow driven by the degree of soil matrixwater saturation and depending on the macroporewater contents as follows (Jarvis et al., 1991a):
Sw � ruf ;
Sw � bKs;m 1 2u
1m
� �uf �8�
wherer [T 21] is a zero-order water transfer rate coef-ficient andb [L 21] is an empirical calibration coeffi-cient. Water transfer from the soil matrix into themacropore domain is assumed to be not relevant andis therefore neglected. The hydraulic conductivity,Km(u ), and water retention,u (h), functions are speci-fied in tabular form in the computer program. Discretevalues of Km and u are obtained by interpolatinglinearly between the tabulated values.
2.3. Boundary conditions
At both the sites, bare soils without any vegetationwere present during the time period considered in this
study. Thus, the upper boundary,z� 0, controlled byprecipitation, P, and soil evaporation, E, (Fig. 1) isdefined as a prescribed flow condition (Neumann-type). The infiltration rate is calculated according tothe difference between rainfall and evaporation on anhourly (heavy clay) and 10-min (sandy loam) basis.Separation of water infiltration into the soil matrix andthe macropore system is specified according to thefollowing procedure: infiltration rates smaller thanthe value of an empirical coefficient,qmax, are allowedto infiltrate entirely into the soil matrix and thatexceedingqmax are redirected into the macropores.Once the soil matrix at the soil surface becomeswater saturated, only macropore infiltration is consid-ered. Infiltration into the matrix starts again as soon asthe soil matrix at the surface becomes unsaturated.Infiltration into the water saturated soil matrix isneglected here, during macropore flow events forsimplicity, as these rates are generally much smallercompared to those entering the macropore system inthose periods.
At the lower boundary of the matrix domain (Z0 inFig. 1), we impose a zero flux condition (Neumann-type) assuming the existence of an impermeable layerat the profile bottom. We define the lower boundary ofthe macropore flow domain at an infinitesimally smalldistance above the groundwater table as the gravity-driven vertical flow essentially ceases at the watertable. The bottom boundary of the macropore systemis imitated by imposing a free-drainage-type conditionin Eq. (7) using
�2uf =2z� � 0 z�Z:�� �9�
whereu f(Z) is assumed to be equal to a value ofu f
shortly aboveZ. Although a more realistic conditionwould beu f � 1 f, free drainage was preferred as themacropore flow model physically assumes flowthrough pipes which are open at the bottom. Waterleaving the bottom of the macropore system is trans-ferred into the matrix domain at the neighboringdepths.
2.4. Drainage approximation
Effects of the field water regime, i.e. by the ground-water and the field drains, are approximately consid-ered by means of a sink term,Slat, in Eq. (4) whichaccounts for water extracted from or added to the
R. Ludwig et al. / Journal of Hydrology 215 (1999) 135–152140

saturated part of the one-dimensional flow domain,e.g., laterally. We tested an empirical and a poten-tial-theory-based approach for simulatingSlat. Lateraldrainage may occur in the flow domain between thewater table height,Z, and the base of the saturatedzone, Z0 (Fig. 2). For application of thepotentialtheory, we assume that the soil profile for the one-dimensional vertical flow modeling is located half-way between two parallel tile drains. In Fig. 2, theconceptual representation of a cross-sectional areafor applying thepotential theoryis shown for theconditions at the sandy loam site where for the origin-ally sloped, a horizontally plane soil surface is used.
The potential theoryis based on a potential func-tion, E(x), wherex is the lateral coordinate, which isdefined by Youngs (1980) as
E�x� �ZH�x�
0K�z��c 2 z�dz;
wherec is the total water potential;z the depth, andH(x) the depth of the water table. In Fig. 2,Hm is thedifference in water table height at the center (one-dimensional model section) compared to the watertable height at the location of the tile drains,H0, andz is the depth, in the derivation considered verticallyupwards. Using thepotential theory(Youngs, 1980;Leeds-Harrison et al., 1986; Jarvis, 1994), withZ �Hm andz vertically downwards, drainage is describedin the modified MACRO model by
Slat � lp�z2 Z�; �10�
wherelp [L 21 T21] is given by
lp � Af Ks;h; �11�whereAf [L 22] represents a ‘shape’ factor dependingon the spatial arrangement of the field tile drainsystem, andKs,h is the horizontal saturated hydraulicconductivity in the groundwater zone. For parallelfield drains,Af can be approximated (Youngs, 1980)by
Af � 8=L2; �12�
whereL is the drain spacing. This potential conceptstrongly simplifies the transient behavior of the lateraldrainage and neglects recharge (i.e., water enteringthe flow domain from the groundwater). In thisstudy,lp is calibrated by fitting simulated to measuredgroundwater table values. Estimated values of thedrain spacing,L, and of the conductivity,Ks,h, arecompared to observed drain spacings and measuredhydraulic conductivities in the groundwater zone.
Theempiricalapproach assumes ‘drainage’ out and‘recharge’ into the saturated zone depending on theareal,Zgw, and local,Z, groundwater tables (Fig. 2).Changes of the soil water content induced by lateralflows, Slat, are approximated by
Slat�z� � le Zgw 2 z2 h z� �� �h i
; �13�whereZgw is the assumed height of the groundwatertable of the area,le is the empirical proportionalitycoefficient, and (z 2 h(z)) < Z.
R. Ludwig et al. / Journal of Hydrology 215 (1999) 135–152 141
Fig. 3. Soil water retention (a) and hydraulic conductivity (b) functions for the two horizons of the heavy clay site at Golzow used in thesimulations. The parameterhf indicates the pressure head at the inflection point, here selected as an average value which is identical for both thehorizons.

3. Parameter calibration
The parametersKs,m, Ks,f, 1m, and1 f are approxi-mately derived from measured hydraulic functions(compare Figs. 3 and 4) by an empirical calibrationprocedure. In the first step, a matric potentialhf isdefined at the inflection point in the hydraulicconductivity curve,K(h). An increasing value ofKwhen moving fromh � hf to h � 0, is attributed toa highly permeable macropore system. From experi-mentally determined hydraulic conductivity curves,however, often a distinct inflection point may not beclearly definable. In such a case, the value ofhf isused as an empirical fitting parameter. For a givenvalue of hf, the hydraulic parameters of the soilmatrix and the macropore system are derived
according to:
Ks;m � K�hf �; �14�
1f � u�h� 0�2 u�hf �; �15�
1m � u�hf �: �16�The hydraulic conductivity of the soil matrix,
Km(h), in the rangehf , h , 0 is equal toKs,m.The saturated hydraulic conductivity of the bulk soil,Ks, is given as
Ks � K�h� 0�: �17�Ks,f is calculated from Eq. (1c) usingKs from Eq.
(17) andKs,m from Eq. (14).The hydraulic parameters are determined for each
R. Ludwig et al. / Journal of Hydrology 215 (1999) 135–152142
Fig. 4. Soil water retention (a, c) and hydraulic conductivity (b, d) functions used in the two-domain (a, b) and one-domain (c, d) simulations forthe sandy loam site at Arensdorf. The figures include the values of the pressure head at the inflection point,hf, the saturated soil matrix and thecalibrated macropore hydraulic conductivities,Ks,m andKs,f and porosities,1 f and1m of all three soil horizons.

soil horizon separately, however, the parametersrepresenting the macropore flow domain,Ks,f and1 f,are assumed to be constant for all horizons. For theu (h)-function of the sandy loam soil, the watercontent at saturation,u s(h � 0), is calculated frommeasured particle density,r s [M L 23] and bulkdensity,rb [M L 23], usingu s � 1 2 rb/r s. u s wasunderestimated by using the direct measurements atfull water saturation from undisturbed soil samples.
Values for the parametera in Eq. (6) were reportedin the literature (compare Table 1) to range betweena � 1.1 anda � 3.3 (Beven and Germann, 1985) orbetweena � 3.0 anda � 5.5 (Jarvis et al., 1991b).Larger values ofa generally yield an increasing time-delay in the discharge from the macropore domain.Parametera is calibrated here by a manual fittingprocedure using measured time delays between thebeginning of the water infiltration or rainstorm eventand the water table rise as well as the slope of thewater table rise towards the peak. Parameterb inEq. (8) controls the water transfer into the matrixdomain and cannot be measured directly. As sensitiv-ity studies (Ludwig, 1995) in the range betweenb �0.1 andb � 10 cm21 showed thatb only marginallyaffects the results in case the flow in the macroporedomain is much larger than the one in the soil matrix,the value was fixed here for the heavy clay soil atb �1 cm21. Values ofqmax are obtained by fitting simula-tion results to rainfall rates and measured groundwatertable changes. Relatively high values ofqmax indicatethat macropore flow is unlikely to occur. Relativelylow values ofqmax simulate that water infiltration intothe macropore domain may occur at relatively lowrainfall intensities. The parameters of the ‘drainage’and ‘recharge’ function in Eqs. (10) and (13),l andZgw, are fitted so that the match between the simulatedand measured groundwater table time series could beimproved. For calibration ofl , the slope of measuredwater table changes following the peak values isconsidered. Higher values ofl will yield relatively
large discharge rates and will result in steeper slopes.Parametern is used for calibrating the hydraulicconductivity function in the one-domain case (i.e.,the hydraulic conductivity curve is shifted). Whenusing the initially estimated hydraulic conductivities(i.e., n � 1), hardly any groundwater table changescould be simulated in the one-domain case for thesandy loam soil during the calibration time period.Thus, the value ofn may be regarded as an indicatorfor the occurrence of preferential flow. Consideringobserved values ofKs,m, the parametern is calibratedto fit simulated to measured groundwater tablechanges. Table 1 summarizes the empirically-basedparameters of theSw andSlat terms.
4. Numerical solution
The numerical solution of the coupled system ofequations is a sequential two-step scheme: First, vari-ably-saturated water flow in the matrix domain in Eq.(4) is solved using a fully implicit finite differencenumerical scheme together with an iterativeNewton–Raphson procedure to consider the effectsof non-linearity of the matrix hydraulic properties(Huwe, 1987, 1992) and assuming that initial watertransfer,Sw, is zero. Iterations are continued until thematrix water balance is within a specified limit (here10 cm). In the second step, the simulated depth of thegroundwater table in the matrix domain is used todefine the bottom of the macropore flow domain andthe macropore flow Eq. (7) is solved using a fullyimplicit Newton–Raphson iterative procedure(Ludwig, 1995). Previously calculated pressure headvalues of the matrix domain are used for determiningpossible water transfer from the macropore into thematrix domain. The convergence criterion for themacropore domain iterations is a threshold value ofu f # 102 5. Water leaving the bottom part of themacropore domain by the free-drainage condition Eq.
R. Ludwig et al. / Journal of Hydrology 215 (1999) 135–152 143
Table 1Range of values of the empirically-based parameters of the modified MACRO model as reported from the literature and tested in the one-domain (1-d) and two-domain (2-d) simulations
Parameter values a (–) b (cm21) qmax (cm d21) l (1024 d21 cm21) n (–)
Literature 1.1–5.5 0.1–10 – – –Range tested 2.0–4.0 1 4–8 2-d: 4.0–6.0 1-d: 18.0–24.0 1–50

(9) is added to the five neighboring matrix compart-ments. Finally, the length of the next time step iscalculated according to the change of water contentsin the soil matrix and macropore system (Ludwig,1995), before the numerical solution of the nexttime step starts.
We use a spatial discretization with equally-sizedcompartments ofDz� 5 cm and a time step size thatwas allowed to vary between a minimum of 1026 dand a maximum of 6.94× 10²³ d. The initial condi-tions of the matrix domain are derived by linearlyinterpolating between observed matric potentialvalues at five soil depths for the starting time. Weassumed a uniform initial macropore domain watercontent ofu f � 1026 and a zero initial water transfer.
5. Field site description
The model is applied to two different field sites: oneis a clayey medium- to fine-textured soil (eutric fluvi-sol) which is located near the village of Golzow; in thefollowing referred to as ‘heavy clay’. The other is asandy-loamy medium- to coarse-textured soil (eutricgleysol) located near the village of Arensdorf, referredto as ‘sandy loam’. Both sites are located in northeastGermany.
The heavy clay consists of an upper clay horizonwhich extends to the depth of the formerly cultivatedhorizon, approximately 30 cm, followed by a sandy-clayey transition zone between a depth of 30 and40 cm, and underlayed by a sand horizon down to60 cm depth. The subsoil below a depth of 60 cm is
dominated by gravely sand. In some locations peatyspots can be found below a depth of 1 m. The Aphorizon shows swelling and shrinkage phenomenaassociated with water content changes. In the Ap hori-zon, soil aggregates are of polyedric shape. Directly atthe soil surface, we can find subpolyedric compounds.The soil structure in the subsoil is mainly coherent andgranular and is dominated by the influence of theshallow water table.
The Ap horizon of the soil at the Arensdorf siteconsists of sandy loam material down to a soil depthof approximately 40 cm. The horizons below are moreloamy between a depth of 40 and 70 cm and loamy-sandy down to 110 cm. Below a depth of 110 cm, wecan find loamy and coarse sands with gravel in hori-zontally alternating layers. The soil structures in the Ahorizon consist of granulars and crumbs. In the loamyhorizons, the soil is mostly coherent whereas in thesandy layers, single grains dominate. Between a depthof 20 and 40 cm, thin layers with relatively high soilorganic matter content can be found.
At both the sites, an experimental plot of 15 mwidth and 100 m length was investigated since 1995with respect to groundwater table, soil matric poten-tial, rainfall precipitation, soil evaporation, and soilhydraulic and physical parameters (Wendroth et al.,1999, this issue). The groundwater table fluctuatesbetween 60 and 100 cm depth at the heavy clay andaround a depth of 100 cm at the sandy loam site.
5.1. Heavy clay parameters
The bottom of the simulated soil profile is defined
R. Ludwig et al. / Journal of Hydrology 215 (1999) 135–152144
Table 2Calibrated parameters of the physically-based part of the MACRO model for the heavy clay (two-domain) and the sandy-loam (one- and two-domain) soils used in the simulations.
Soil type (model) Depth (cm) hf (cm) Ks,f (cm d21) Ks,m (cm d21) 1 f (cm3 cm2) 1m (cm3 cm23)
Heavy clay 0–45 2 5.0 700.0 1.0 0.02 0.5(2-domain) 45–105 2 5.0 700.0 125.0 0.02 0.31
Sandy loam (2-domain) 0–20 2 10.0 10.0 2.0 0.01 0.4220–40 2 30.0 10.0 0.4 0.01 0.4340–150 2 30.0 10.0 0.4 0.01 0.43
Sandy loam (1-domain) 0–20 – – 5.1 – 0.4920–40 – – 0.5 – 0.5240–60 – – 4.5 – 0.4260–100 – – 5.0 – 0.38

at a depth of 105 cm below the soil surface andlocated within the saturated zone. As the measuredhydraulic conductivity and water retention curveswere not available at the time we performed thisstudy, hydraulic properties were obtained from theliterature. The horizons of the heavy clay soil hadnearly identical clay contents as those described byWosten et al. (1987) for a Dutch soil while field obser-vations suggested, that they were qualitatively similar,including a comparable soil structure. An additionaladvantage was that Wo¨sten et al. presented detaileddata close to water saturation. Thus, we used the soilhydraulic properties of Wo¨sten et al. and divided theprofile into a clay-loam (type: Wo¨sten ‘B11’) in theupper (0–45 cm) and a sand (type Wo¨sten ‘O5’) hori-zon in the lower part (45–105 cm). As Wo¨sten et al.(1987) reported a relatively large variability ofhydraulic conductivity values in the range close towater saturation, we selected the maximum value asKs (Table 2) and assumed an average value of1 f �0.02. For the upper horizon, an inflection point in theWosten conductivity curve was detected athf,1 � 25 cm while for the lower horizon, the value ofhf,2 �2 5 cm was chosen arbitrarily as no inflection pointcould be identified. Table 2 summarizes the values ofthe parametersKs,m, Ks,f, 1 f, and1m used in this study.Note that macropore parameters,Ks,f and1 f are iden-tical average values for the total soil profile, thus, theydo not match completely with the curves for the twohorizons as shown in Fig.3(a) for the retention and inFig. 3(b) for the hydraulic conductivity functions. Theconnecting lines in Fig. 3(b) between the values ofK(hf) and Ks indicate relatively large differencesbetween the macropore and matrix domain conductiv-ities in this range in which water flow is calculatedaccording to Eq. (7).
5.2. Sandy loam parameters
At the sandy loam site, four different horizonscould be distinguished in the soil profile. Soil waterretention and hydraulic conductivity curves weremeasured at undisturbed soil cores (300 cm3) in thelaboratory using an evaporation method (Wind, 1968;Wendroth et al., 1993). In the range close to watersaturation, the hydraulic conductivity was determinedusing a laboratory version of a tension infiltrationapparatus by inducing steady-state throughflow in
the soil core at soil matric potentials ofh � 2 10,2 5, and2 1 cm, respectively. Measured values werefitted to the Mualem/van Genuchten hydraulic func-tions (van Genuchten, 1980), and then tabulated againfor use in the program.
The calibrated values of the physically-basedMACRO model parameters of the sandy-loam soilhorizons are given in Table 2. The hydraulic para-meter functions for the two-domain (Figs. 4(a) and4(b)) are different from those of the one-domain(Figs. 4(c) and 4(d)) simulations, in the range closeto saturation and for the bottom soil horizons. This is aresult of the procedures used for deriving the one- andtwo-domain model parameters and as the two lowersoil horizons between 40 and 150 cm depth werecombined to a single one in the two-domain case inorder to simplify the flow simulations. The retentionfunctions were shifted along the water content axis tomatch the calibrated porosities at saturation.
6. Results
6.1. Heavy clay site
The simulation scenario covers the time periodfrom June 1 to June 15, 1995. Hourly rainfall andevaporation data are used to define the flux at thesoil surface. Simulations are carried out using theempirical type of lateral drainage/recharge approxi-mation,Slat. During the 15-d period, the groundwatertable increased from a depth of less than 70 cm toabout 50 cm on June 15.
Fig. 5 shows simulation results obtained aftermodel calibration in comparison with the measureddata. Two-domain simulations using the modifiedMACRO model describe changes in the groundwatertable shortly after infiltration events and relativelysteep water table increases as well as decreases atthe aggregated and macroporous heavy clay fieldsite. We present only the two-domain model resultsfor the heavy clay soil as tests using equivalent one-domain simulations could not reproduce observedrapid water table changes. Simulated pressure headvalues in Fig. 5(b) increase directly after largerrainstorm events even in greater depths (e.g., downto 90 cm). Although simulated pressure headscorrespond relatively close with the few measured
R. Ludwig et al. / Journal of Hydrology 215 (1999) 135–152 145

tensiometer data, the model parameters cannot beidentified and calibrated as clearly as compared tousing the more continuous time series data fromgroundwater monitoring. Fig. 5(c) indicates that thelateral flow component at the heavy clay seems to bewell approximated by Eq. (13) to simulate themeasured groundwater table fluctuations. Approxi-mated lateral drainage rates are relatively large shortlyafter rainstorm events (e.g., at day 10 and 12 in Fig.5(c)).
6.2. Sandy loam site
The simulation scenario covers the same period of
time (June 1 to June 15, 1995) as for the heavy claysite. Rainfall and evaporation rates are used here on a10-min basis. In the two-domain simulations, theempirical drainage/recharge function Eq. (13) isused while in the one-domain case, the potential-theory-based drainage function Eq. (10) is applied.The measured data in Fig. 6 (2-domain) and Fig. 7(1-domain) indicate that the rainfall rates at both thelocations are somehow different from those of theheavy clay site during the first part of June 1995although the sites are located less than 25 km apart.The groundwater table (Fig. 6(c)) tends to increaseafter each rain event from a depth of about 90 cm atthe beginning to nearly 70 cm at the end of the period.
R. Ludwig et al. / Journal of Hydrology 215 (1999) 135–152146
Fig. 5. Simulation results (two-domain model) and field measurements for the heavy clay site: (a) rainfall rates, (b) matric potential and pressurehead at five depths and (c) groundwater table and simulated lateral drainage as a function of time during the 15-d simulation period (June 1–15,1995). Solid lines in (b) represent simulated pressure head values in 10, 30, 50, 70, and 90 cm depths (from bottom to top of the figure). Symbolsrepresent tensiometer measurements in 10 (squares), 30 (circles), 50 (upright triangle), 70 (downward triangle) and 90 cm (diamond) depths.Solid lines in part (c) represent the simulated groundwater table and dashed lines the measured groundwater table; the dotted line shows thesimulated approximation of the lateral drainage flux densityqlat.

Compared to the data measured at the heavy clay site,however, the water table fluctuations at the sandyloam follow the rainfall events later and more slowly.
Simulations using the two-domain model, result ina water table increase after each major rain event (Fig.6(c)). The slope of the rising part of the water tabletime series is generally steeper than that of thedecreasing part. The measured water table dynamicsis reproduced by the simulation with respect to theaverage level, however, simulated water table fluctua-tions are too large with respect to the water volume. Inthe one-domain simulations, observed water tablefluctuations (Fig. 7(c)) are reproduced relativelynicely; i.e., simulated results fit the measurementswith respect to reaction time, slope of rise, andwater volume. The improved fit in the one-domain
simulation is mainly caused by the adjustment of thehydraulic conductivities by using a value of parametern in the order of magnitude of 10. Figs. 6(b) and 7(b)indicate, similar as for the heavy clay, that the avail-able relatively infrequent tensiometer readings cannotbe used to clearly identify or to calibrate the modelparameters, i.e., the differences between measuredand simulated pressure head values are relativelylarge in the unsaturated zone and measurements aremostly conducted during periods of no infiltration.Observations during periods of rapid flow events aremissing except, for example, for one reading betweenday 1 and 2 in Fig. 7(b).
Comparisons between the approximated lateralsink term in Figs. 6(c) and 7(c) indicate that thewater table fluctuation is also determined by the
R. Ludwig et al. / Journal of Hydrology 215 (1999) 135–152 147
Fig. 6. Simulation results (two-domain model) and field measurements for the sandy loam site: (a) rainfall rates, (b) matric potential andpressure head at five depths and (c) groundwater table and simulated lateral drainage as a function of time during the 15-d simulation period(June 1–15, 1995). Symbols and lines are as explained in Fig. 5.

description ofSlat. While for the two-domain case inFig. 6(c), the empirically-based simulation ofSlat
somehow corresponds with the groundwater tablefluctuation, the potential-theory-based lateral drai-nage approximation for the one-domain simulationsin Fig. 7(c), is a different, step-wise function. Thedifference between the one- and two-domain resultsare caused by the different parameter values (Table 3)
and descriptions ofSlat, and by using larger matrixhydraulic conductivities and considering four soilhorizons in the one-domain instead of three in thetwo-domain case.
The results in Figs. 6 and 7 suggest that watertable fluctuations could be better described in theone-domain case with a calibrated sink term for lateraldrainage than by using a two-domain model approach.
R. Ludwig et al. / Journal of Hydrology 215 (1999) 135–152148
Table 3Calibrated parameters of the empirically-based part of the macropore flow and water transfer model (water transfer,Sw, lateral sink term,Slat) ofthe modified MACRO model for the soils at the heavy clay and sandy loam sites used in the one- (1-d) and two- (2-d) domain simulations.
Soil a (–) b (cm21) qmax (cm d21) l (1024 d21 cm21) Zgw cm)
Heavy clay 2-d 2.0 1.0 8.0 6.0 75 and 55Sandy loam 2-d 3.0 1.0 4.0 4.0 100.0Sandy loam 1-d – – – 18.0 –
Fig. 7. Simulation results (one-domain model) and field measurements for the sandy loam site: (a) rainfall rates, (b) matric potential andpressure head at five depths and (c) groundwater table and simulated lateral drainage as a function of time during the 15-d simulation period(June 1–15, 1995). Symbols and lines are as explained in Fig. 5.

In case, data of drain outflow and regional ground-water levels are available, the lateral drainage sinkterm, Slat, could be validated. Here, the known drainspacing,L � 27.5 m, and the calibrated value oflp�1.8 × 1023 cm21 d21 can be used to calculate theestimates for the hydraulic conductivity,Ks,h, repre-senting an effective lateral hydraulic conductivityvalue of the groundwater zone between the tile drains.Using Eqs. (11) and (12), we obtain a value ofL �24.3 m. Considering the observed value of the drainspacing, a value ofKs,h � 1701.56 cm d21 can beobtained. The drain spacing information from thefield shows that the calibration procedure givesreasonable values for the sink-term parameters.
7. Discussion and conclusions
The article contributes to the analysis of field scaleflow and transport processes. The two-domain modelMACRO (Jarvis et al., 1991a) was modified and cali-brated to simulate preferential flow at two tile-drainedfield sites with shallow groundwater tables in north-east Germany. The two-domain model used in thisstudy differs from the original MACRO model (Jarviset al., 1991a) mainly with respect to the boundaryconditions and by considering a saturated zonelocated in the bottom part of the flow region. Byapplying an implicit numerical scheme for solvingthe Richards’ equation, both, unsaturated and satu-rated conditions can be modeled for flow in the matrixdomain. However, the macropore flow domain isconsidered to exist only in the water unsaturatedpart of the soil profile where gravity-driven verticalflow plays a role. The model is still strongly simplify-ing the real phenomenon (Bronswijk et al., 1995), forinstance, swelling and shrinking or the temporalchange of porosity and hydraulic properties of themacropore system are not considered. However, bymeans of a relatively simple sink term, the effect ofthe field water regime could be included in the one-dimensional approach and a coupling between thevertical flow atpedonscale and the horizontal ground-water flow at field scale could be achieved. Afterextensive calibration, the modified preferential flowmodel MACRO was used to describe one-dimen-sional vertical water movement at a no-tilled barefield with a strongly aggregated clayey soil. The
model improved the description of flow also at anequally managed field site with mostly sandy loamsoils. Parameter calibration was carried out for deter-mining the hydraulic properties of the matrix and themacropore domain.
The calibrated model considering two separate flowdomains could describe the basic patterns of measuredtime-series’ of the groundwater table and soil matricpotentials at the heavy clay site (aggregated Ap hori-zon) while neither a two- nor a one-domain modelcould satisfactorily reproduce measured water regimeat the sandy loam site (granular- and crumb-typestructure). An improved fit at the sandy loam sitecould be obtained when increasing the hydraulicconductivity empirically by the factor of 3 in thefirst and fourth and by 15 in the second and thirdhorizon. The difference in the hydraulic behavior ofthe two soils is represented in the model mainly by themagnitude of the ratio between the hydraulic conduc-tivity at water saturation of the macropore and that ofthe soil matrix as well as of macropore flow and watertransfer term parameters. For the heavy clay site, thecalibrated saturated hydraulic conductivity of thefracture domain was found to be 700 times largerthan that of the matrix domain (Ks,f/Ks,m� 700). Forthe sandy loam site, on the contrary, only a value ofabout 10 could be obtained by parameter calibration(Ks,f/Ks,m , 10). Further, the less pronounced flow inthe macropore domain at the sandy loam site isreflected in the calibrated values of the parameterain Eq. (6), i.e.,a� 3.0 for the sandy loam anda� 2.0for the heavy clay. Under the assumed unsaturatedconditions in the macropore region, larger values ofa will result in relatively smaller macropore flowrates. Although transfer term parameterb in Eq. (8)was not used (b � 1), the calibrated value of thematrix domain conductivity of the top soil layer wasfound to be larger for the sandy loam (Ks,m� 2 cm d2
1) than for the heavy clay site (Ks,m� 1 cm d21) result-ing in a relatively larger simulated water absorptionby the soil matrix of the sandy loam (Table 2).
When using the classical one-domain modelapproach for simulating water flow at the heavy claysite, for comparison, the measured data could not bedescribed with several tested parameter combinations.For the sandy loam site, the observed waterregime could only be roughly described with aone-domain (matrix only) model when introducing
R. Ludwig et al. / Journal of Hydrology 215 (1999) 135–152 149

a multiplication factor n to empirically increasethe laboratory-measured hydraulic conductivites ofthe soil horizons. The best possible fit obtained bythe one-domain model between the simulated andmeasured water table data was obtained with rela-tively high values ofn (n � 15) in the secondand third soil horizon, in which relatively lowpermeabilities were observed (Table 2). Such asimulation result may be interpreted as an indica-tion of possible occurrence of preferential flow inthe second or third horizon of the sandy loamwhich may be caused by fissures or cracks in deepersoil layers which could not be quantified usingstandard methods for determining the hydraulicconductivity.
The relative simplicity of the used approach makesit possible to study the role of individual hydraulicparameters and the relative importance of specificpreferential flow model components. However, asindependently measured soil structural and preferen-tial flow parameters for this study are relativelylimited, a large number of parameters could only beestimated by applying a calibration procedure. A clearidentification of specific preferential flow parameterswas not possible. Especially, measurements of statevariables with sufficient spatial and temporal resolu-tion during single storm events and measurements ofparameters under controlled conditions would benecessary to improve the descriptions of the flowproblems.
Despite the discussed data limitations, the resultsshowed quite clearly that for the heavy clay, a one-domain and for the sandy loam a two-domainmodeling could not adequately explain the fieldobservations using the tested parameter combina-tions. The results may help planning subsequentquantitative modeling attempts of the field solutebalance and support the analysis of the field scalespatial variability of the hydraulic regime. Futurework should include a sensitivity analysis to studythe transfer term parameters as well as detailedmeasurements of soil matric potential duringstorm events and studies of the process of watertransfer into aggregates of different soils. Even-tually, the calibrated model may be used fordescribing the preferential solute transport andcontaminant leaching in the macroporous fieldsoils.
Acknowledgements
This study was financially supported by theEuropean Union under the Contract no. EV5V-CT94-0467. Analysis and improvement of existingmodels of field-scale solute transport through thevadose zone of differently textured soils with specialreference to preferential flow. The authors thank K.Seidel, S. Koszinski, N. Wypler, and W. Pohl from theCenter for Agricultural Landscape and Land UseResearch, Muencheberg, Germany, for their supportin collecting and processing experimental data, help-ful discussions, and many useful comments. Wegreatly appreciate the critical and constructivecomments of the reviewers.
References
Andreu, L., Moreno, F., Jarvis, N.J., Vachaud, G., 1994. Applica-tion of the model MACRO to water movement and salt leachingin drained and irrigated marsh soils, Marismas, Spain. Agric.Water Management 25, 71–88.
Barenblatt, G.I., Zheltov, I.P., Kochina, I.N., 1960. Basic conceptsin the theory of seepage of homogeneous liquids in fissuredrocks. J. Appl. Math. Mech. 24 (5), 1286–1303.
Beven, K.J., 1991. Modeling preferential flow: an uncertain future?In: Gish, T.J. Shirmohammadi, A. (Eds.), Preferential Flow.Am. Soc. Agric. Eng. St. Joseph, Michig, pp. 1–11.
Beven, K.J., Germann, P.F., 1982. Macropores and water flow insoils. Water Resour. Res. 18, 1311–1325.
Beven, K.J., Germann, P.F., 1985. A distribution function model ofchanneling flow in soils based on kinematic wave theory. ILRIWageningen 37, 89–100.
Biggar, J.W., Nielsen, D.R., 1976. Spatial variability of the leachingcharacteristics of a field soil. Water Resour. Res. 12, 78–84.
Booltink, H.W.G., 1994. Field-scale distributed modeling of bypassflow in a heavily textured clay soil. J. Hydrol. 163 (1/2), 65–84.
Booltink, H.W.G., Bouma, J., 1991. Physical and morphologicalcharacterization of bypass flow in a well-structured clay soil.Soil Sci. Soc. Am. J. 55 (5), 1249–1254.
Booltink, H.W.G., Bouma, J., 1993. Sensitivity analysis onprocesses affecting bypass flow. Hydrological Processes 7,33–43.
Booltink, H.W.G., Hatano, R., Bouma, J., 1993. Measurement andsimulation of bypass flow in a structured clay soil: a physico-morphological approach. J. Hydrol. 148, 149–168.
Bouma, J., Dekker, L.W., 1978. A case study on infiltration into dryclay soil. I. Morphological observations. Geoderma 20 (1), 27–40.
Bouma, J., Dekker, L.W., Wo¨sten, J.H.M., 1978. A case study oninfiltration into dry clay soil. II. Physical measurements.Geoderma 20 (1), 41–51.
R. Ludwig et al. / Journal of Hydrology 215 (1999) 135–152150

Bouma, J., Dekker, L.W., Muilwijk, C.J., 1981. A field method formeasuring short-circuiting in clay soils. J. Hydrol. 52, 347–354.
Bouma, J., Belmans, C.F.M., Dekker, L.W., 1982. Water infiltrationand redistribution in a silt loam subsoil with vertical wormchannels. Soil Sci. Soc. Am. J. 46 (5), 917–921.
Bronswijk, J.J.B., Hamminga, W., Oostindie, K., 1995. Field-scalesolute transport in a heavy clay soil. Water Resour. Res. 31 (3),517–526.
Chen, C., Wagenet, R.J., 1992. Simulation of water and chemicalsin macropore soils, Parts I and II. J. Hydrol. 130, 105–149.
DiPetro, L., LaFolie, F., 1991. Water flow characterization and testof a kinematic-wave model for macropore flow in a highlycontrasted and irregular double-porosity medium. J. Soil Sci.42, 551–563.
Droogers, P., Bouma, J., Van der Meer, F.B.W., 1997. Water acces-sibility to plant roots in different soil structures occuring in thesame soil type. Plant and Soil 188 (1), 83–91.
Ehlers, W., 1975. Observations on earthworm channels and infiltra-tion on tilled and untilled loess soil. Soil Sci. 119, 242–250.
Gerke, H.H., Vogel, T., 1994. Zweidimensionale Modellierung vonWasserbewegung und Stofftransport in heterogenen Bodensys-temen. Mitteilgn. Dtsch. Bodenkundl. Gesellsch. 74, 261–264.
Gerke, H.H., van Genuchten, M.T., 1993. A dual-porosity model forsimulating the preferential movement of water and solutes instructured porous media. Water Resour. Res. 29 (2), 305–319.
Gerke, H.H., van Genuchten, M.T., 1993. Evaluation of a first-orderwater transfer term for variably saturated dual-porosity flowmodels. Water Resour. Res. 29 (4), 1225–1238.
Gerke, H.H., van Genuchten, M.T., 1996. Macroscopic representa-tion of structural geometry for simulating water and solute masstransfer in dual-porosity media. Adv. Water Resour. 19, 343–357.
Germann, P.F., 1990. Preferential flow and the generation of runoff1. Boundary layer theory. Water Resour. Res. 26 (12), 3055–3063.
Germann, P.F., Beven, K.J., 1981. Water flow in soil macropores 1.An experimental approach. J. Soil Sci. 32, 1–13.
Germann, P.F., Beven, K.J., 1985. Kinematic wave approximationto infiltration into soils with sorbing macropores. Water Resour.Res. 21, 990–996.
Germann, P.F., Bu¨rgi, T., 1996. Kinematischer Ansatz zur in-situ-Erfassung des Makroporenflusses in Bo¨den wahrend Infiltratio-nen. Z. f. Kulturtechnik und Landentwicklung 37 (5), 221–226.
Germann, P.F., DiPetro, L., 1996. When is porous media flowpreferential? A hydromechanical perspective. Geoderma 72,1–21.
Ghodrati, M., Jury, W.A., 1990. A field study using dyes to char-acterize preferential flow of water. Soil Sci. Soc. Am. J. 54,1558–1563.
Gish, T.J., Shirmohammadi, A. (Eds.), 1991 Preferential Flow.Proceedings of the National Symposium, December 16-17,1991. Chicago, Illinois. Am. Soc. Agric. Eng. St. Joseph, Michigan.
Hatano, R., Booltink, H.W.G., 1992. Using fractal dimensions ofstained flow patterns in a clay soil to predict bypass. J. Hydrol.135 (1/4), 121–131.
Hoogmoed, W.B., Bouma, J., 1980. A simulation model for predict-ing infiltration into cracked clay soil. Soil Sci. Soc. Am. J. 44,458–462.
Huwe, B., 1987. Transportprozesse in Flubsedimenten nach Abla-gerung in Monodeponien: experimentelle und modellanaly-tische Untersuchungen. Diss. Universita¨t Hohenheim.
Huwe, B., 1992. WHNSIM. Ein Programm zur Simulation desWasser-, Wa¨rme- und Stickstoffhaushalts von Standorten mitunterschiedlicher Nutzung, Version 2.0, Programmdokumenta-tion. Lehrstuhl fur Bodenkunde und Bodengeographie, Abtei-lung Bodenphysik, Universita¨t Bayreuth.
Jabro, J.D., Jemison, J.M., Fox, R.H., Fritton, D.D., 1994. Predict-ing bromide leaching under field conditions using SLIM andMACRO. Soil Sci. 157, 215–223.
Jarvis, N.J., 1994. The MACRO Model (Version 3.1) - TechnicalDescription and Sample Simulations. Dept. Soil Sci. Reportsand Dissertations, Uppsala.
Jarvis, N.J., Jansson, P.-E., Dik, P.E., Messing, I., 1991. Modelingwater and solute transport in macroporous soil. I. Modeldescription and sensitivity analysis. J. Soil Sci. 42, 59–70.
Jarvis, N.J., Jansson, P.-E., Dik, P.E., Messing, I., 1991.Modelling water and solute transport in macroporous soil.II. Chloride breakthrough under non-steady flow. J. Soil Sci.42, 71–81.
Leeds-Harrison, P.B., Shipway, C.J.P., Jarvis, N.J., Youngs, E.G.,1986. The influence of soil macroporosity on water retention,transmission and drainage in a clay soil. Soil Use and Manage-ment 2, 47–50.
Lennartz, B., Wichtmann, W., Weber, K., Widmoser, P., 1997.Pflanzenschutzmitteleintra¨ge in Oberfla¨chengewa¨sser durchDranung. Mitt. Biol. Bundesanst. Land- Forstwirtsch. Berlin-Dahlem H. 330, 39–62.
Ludwig, R., 1995. Modellierung des Matrix- und Makroporen-flusses einer Versuchsdeponie. Bayreuther Bodenkundl. Ber.41, Universita¨t Bayreuth.
Mohanty, B.P., Tim, U.S. Anderson, C.E. Woestman, T., 1994.Impacts of agricultural drainage well closure on crop produc-tion: A watershed case study. Water Resour. Bull. 687–703.
Mohanty, B.P., Horton, R., Ankeny, M.D., 1996. Infiltration andmacroporosity under a row crop agricultural field in a glacialtill soil. Soil Sci. 161, 205–213.
Mohanty, B.P., Bowman, R.S., Hendrickx, J.M.H., van Genuchten,M.T., 1997. New piecewise-continuous hydraulic functions formodeling preferential flow in an intermittent-flood-irrigatedfield. Water Resour. Res. 33 (9), 2049–2063.
Othmer, H., Diekkru¨ger, B., Kutilek, M., 1991. Bimodal porosityand unsaturated hydraulic conductivity. Soil Sci. 152 (39), 139–150.
Ritsema, C.J., Dekker, L.W., 1995. Distribution flow: A generalprocess in the top layer of water repellent soils. Water Resour.Res. 31, 1187–1200.
Roth, K., Jury, W.A., Flu¨hler, H., Attinger, W., 1991. Transport ofchloride through an unsaturated field soil. Water Resour. Res.27, 2533–2541.
Turk, T., Mahr, A., Horn, R., 1991. Tensiometrische Untersuchun-gen an Aggregaten in homogenisiertem Lo¨b. Z. Pflanzenerna¨hr.Bodenk. 154, 361–368.
van Genuchten, M.Th., 1980. A closed-form equation for predictingthe hydraulic conductivity of unsaturated soils. Soil Sci. Soc.Am. J. 36, 380–383.
R. Ludwig et al. / Journal of Hydrology 215 (1999) 135–152 151

van Genuchten, M.T., Dalton, F.N., 1986. Models for simulatingsalt movement in aggregated field soils. Geoderma 38, 165–183.
van Genuchten, M.T., Gerke, H.H., 1993. Dual-porosity models forsimulating solute transport in structured media. Proceedings,Colloquium Porous or Fractured Unsaturated Media: Transportsand Behaviour. Monte Verita`, Ascona, Switzerland, October 5–9 1992, pp. 182–205.
van Genuchten, M.T., Rolston, D.E., Germann P.F. (Eds.), 1990.Transport of water and solutes in macropores. Geoderma46(1-3): 1-297.
Vogel, T.N., Zhang, R., Gerke, H.H., van Genuchten, M.T., 1993.Modeling two-dimensional water flow and solute transport inheterogeneous soil systems. In: Eckstein, Y. Zaporozec, A.(Eds.), Hydrologic Investigation, Evaluation and GroundWater Modeling. Proceedings of Industrial and AgriculturalImpacts on the Hydrologic Environment. The Second USA/CIS Joint Conference on Environmental Hydrology and Hydro-geology, 16–21 May 1993. Washington, D.C. pp. 279–302.
Wagenet, R.J., Hutson, J.L., 1989. Leaching Estimation and Chem-istry Model: a process-based model of water and solute move-ment, transformations, plant uptake and chemical reactions inthe unsaturated zone. Continuum Water Resources Institute,Cornell University, Ithaca, NY, U.S.A.
Wendroth, O., Ehlers, W., Hopmans, J.W., Kage, H., Halbertsma, J.,Wosten, J.H.M., 1993. Reevaluation of the evaporation methodfor determining hydraulic functions in unsaturated soils. SoilSci. Soc. Am. J. 57, 1436–1443.
Wendroth, O., Pohl, W., Koszinski, S., Rogasik, H., Ritsema, C.J.,Nielsen, D.R., 1999. Spatio-temporal patterns and covariancestructure of soil water status in two Northeast-German fieldsites. J. Hydrol., 215, 38–58.
White, R.E., 1985. The influence of macropores on the transport ofdissolved and suspended matter through soil. Advances in SoilScience 3, 94–120.
Wichtmann, W., Lennartz, B., Widmoser, P., 1998. Bromidverla-gerung an zwei gedra¨nten Standorten in Schleswig-Holstein. Z.Pflanzenern. Bodenk. 161, 121–128.
Wind, G. P., 1968. Capillary conductivity data estimated by asimple method. In: Water in the usaturated zone, P. E. Rijtema,H. Wassink (eds.) Proceedings of the Wageningen Symposium,June 1966, IAHS Gentbrugge/UNESCO Paris, Vol. 1: pp. 181–191.
Wosten, J.H.M., Bannink, M.H., Beuving, J., 1987. Waterretentie-en doorlatendheidskarakteristieken van boven- en ondergrondenin nederland: de staringgreeks, ICW-rapport, 18, Wageningen.
Youngs, E.G., 1980. The analysis of groundwater seepage in hetero-geneous aquifers. Hydrol. Sci. Bull. 25, 155–165.
R. Ludwig et al. / Journal of Hydrology 215 (1999) 135–152152