
Describing the risk of an event and identifying risk factors Caroline Sabin Professor of Medical...
46
Describing the risk of Describing the risk of an event and identifying an event and identifying risk factors risk factors Caroline Sabin Caroline Sabin Professor of Medical Statistics and Professor of Medical Statistics and Epidemiology, Epidemiology, Research Department of Infection and Research Department of Infection and Population Health, Division of Population Population Health, Division of Population Health, Royal Free and UC Medical School Health, Royal Free and UC Medical School
-
Upload
naomi-hart -
Category
Documents
-
view
218 -
download
0
Transcript of Describing the risk of an event and identifying risk factors Caroline Sabin Professor of Medical...

Describing the risk of an event Describing the risk of an event and identifying risk factorsand identifying risk factors
Caroline SabinCaroline Sabin
Professor of Medical Statistics and Epidemiology,Professor of Medical Statistics and Epidemiology,Research Department of Infection and Population Research Department of Infection and Population
Health, Division of Population Health, Royal Free and Health, Division of Population Health, Royal Free and UC Medical SchoolUC Medical School

Studying the risk of an eventStudying the risk of an event
We may be interested in the probability that some We may be interested in the probability that some event occurs (eg. a new AIDS event, virological event occurs (eg. a new AIDS event, virological response, virological failure)response, virological failure)
Can describe this using different words (eg. the Can describe this using different words (eg. the riskrisk, , incidenceincidence, , prevalenceprevalence) depending on the context ) depending on the context (cross-sectional or longitudinal study)(cross-sectional or longitudinal study)
The variable of interest is often a proportion, but we The variable of interest is often a proportion, but we may also be interested in the may also be interested in the raterate at which an event at which an event occurs, or the time taken to develop the eventoccurs, or the time taken to develop the event

Measures of riskMeasures of risk
IncidenceIncidence
The proportion of patients The proportion of patients without the event of without the event of interestinterest who who develop the eventdevelop the event over the study over the study periodperiod
Can only estimate incidence from a longitudinal Can only estimate incidence from a longitudinal studystudy
We must exclude those who have the event at We must exclude those who have the event at start of study from the calculationstart of study from the calculation

Measures of riskMeasures of risk
PrevalencePrevalence
The proportion of The proportion of all patients in studyall patients in study who have who have the event the event at a particular point in timeat a particular point in time
We can estimate prevalence from longitudinal or We can estimate prevalence from longitudinal or cross-sectional studiescross-sectional studies
We generally include all patients in calculationWe generally include all patients in calculation
Both incidence and prevalence can be seen as a Both incidence and prevalence can be seen as a measure of the ‘risk’ of an event depending on the measure of the ‘risk’ of an event depending on the study design (cross-sectional or longitudinal)study design (cross-sectional or longitudinal)

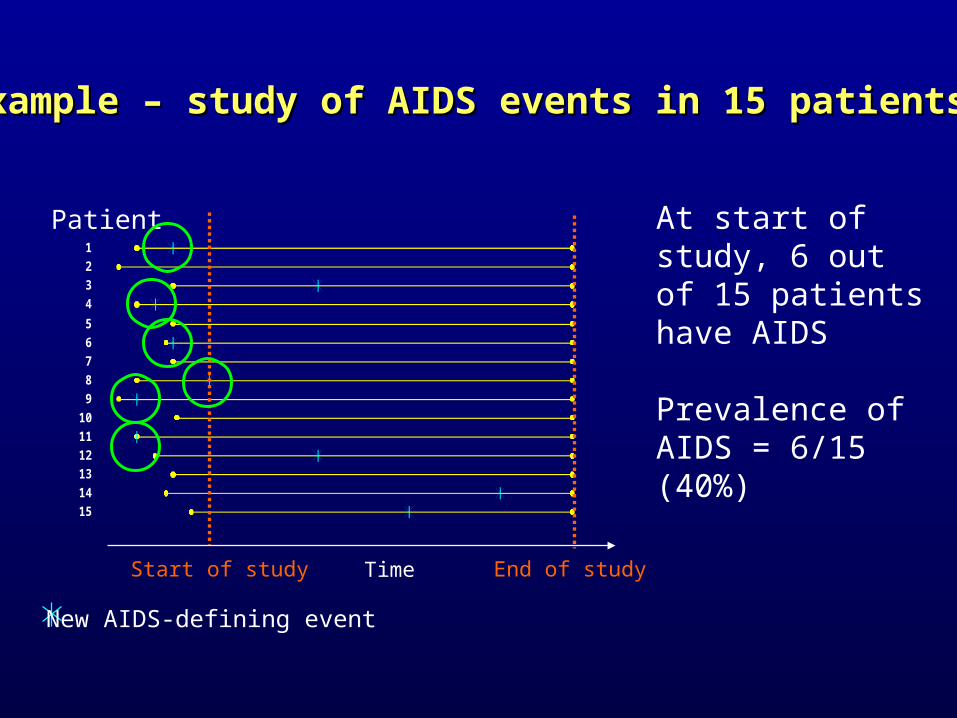
Example – study of AIDS events in 15 patientsExample – study of AIDS events in 15 patients
1
2
3
4
5
6
7
8
9
10
11
12
13
14
15
Patient
Time
AIDS defining diagnosis
New AIDS-defining event

1
2
3
4
5
6
7
8
9
10
11
12
13
14
15
Patient
Start of studyTime
End of study
Example – study of AIDS events in 15 patientsExample – study of AIDS events in 15 patients
New AIDS-defining event

1
2
3
4
5
6
7
8
9
10
11
12
13
14
15
Patient
Start of study Time
At start of study, 6 out of 15 patients have AIDS
End of study
Example – study of AIDS events in 15 patientsExample – study of AIDS events in 15 patients
New AIDS-defining event
1
2
3
4
5
6
7
8
9
10
11
12
13
14
15
Patient
Start of study Time
At start of study, 6 out of 15 patients have AIDS
Prevalence of AIDS = 6/15 (40%)
End of study
Example – study of AIDS events in 15 patientsExample – study of AIDS events in 15 patients
New AIDS-defining event

1
2
3
4
5
6
7
8
9
10
11
12
13
14
15
Patient
Start of study Time
At start of study, 6 out of 15 patients have AIDS
Prevalence of AIDS = 6/15 (40%)
15-6=9 patients do not have AIDS at start of studyEnd of study
Example – study of AIDS events in 15 patientsExample – study of AIDS events in 15 patients
New AIDS-defining event

1
2
3
4
5
6
7
8
9
10
11
12
13
14
15
Patient
Start of study Time
Over follow-up, 4 of the 9 patients without AIDS develop new AIDS event
End of study
Example – study of AIDS events in 15 patientsExample – study of AIDS events in 15 patients
New AIDS-defining event

1
2
3
4
5
6
7
8
9
10
11
12
13
14
15
Patient
Start of study Time
Over follow-up, 4 of the 9 patients without AIDS develop new AIDS event
Incidence of AIDS = 4/9 (44%)
End of study
Example – study of AIDS events in 15 patientsExample – study of AIDS events in 15 patients
New AIDS-defining event

Alternative measures of the risk – the OddsAlternative measures of the risk – the Odds
OddsOdds of an event of an event
= = No. patients with the event over study periodNo. patients with the event over study period
No. patients without the event over study periodNo. patients without the event over study period

1
2
3
4
5
6
7
8
9
10
11
12
13
14
15
Patient
Start of study Time
Over follow-up, 4 of the 9 patients without AIDS develop new AIDS event, and 5 do not
End of study
Example – study of AIDS events in 15 patientsExample – study of AIDS events in 15 patients
New AIDS-defining event

What happens if the amount of follow-up differs What happens if the amount of follow-up differs on the patients - the ideal situationon the patients - the ideal situation
1
2
3
4
5
6
7
8
9
10
11
12
13
14
15
Patient
Start of studyTime
End of study
Virological failure (2 consecutive VL>500 copies/ml)

What happens if the amount of follow-up differs What happens if the amount of follow-up differs on the patients - what really happenson the patients - what really happens
1
2
3
4
5
6
7
8
9
10
11
12
13
14
15
Patient
Start of studyTime
End of study
Virological failure (2 consecutive VL>500 copies/ml)

What happens if amount of follow-up differs on What happens if amount of follow-up differs on the patientsthe patients
Six of the patients experienced virological failure Six of the patients experienced virological failure during the studyduring the study
However, some patients were followed for longer However, some patients were followed for longer periods than others periods than others
Follow-up on patients who did not experience Follow-up on patients who did not experience virological failure before dropping out of the study is virological failure before dropping out of the study is censoredcensored – all we know is that these patients had not – all we know is that these patients had not experienced failure by the time they were lost to experienced failure by the time they were lost to follow-upfollow-up

Why is it important to take account of the Why is it important to take account of the different follow-up timesdifferent follow-up times
Patients who were followed for the whole study period Patients who were followed for the whole study period had a greater chance of experiencing virological had a greater chance of experiencing virological failure, simply because they were followed for longerfailure, simply because they were followed for longer
Estimates of the incidence of virological failure (6/15) Estimates of the incidence of virological failure (6/15) will be underestimated, as patients who were will be underestimated, as patients who were censored may have experienced virological failure at a censored may have experienced virological failure at a subsequent time pointsubsequent time point
If censoring differs between groups, there is the If censoring differs between groups, there is the potential for comparisons to be seriously biasedpotential for comparisons to be seriously biased
Must use appropriate methods to analyse these dataMust use appropriate methods to analyse these data

Suitable approaches for analysis – the event rateSuitable approaches for analysis – the event rate
Event rateEvent rate
= Number of patients developing event of interestTotal years of follow-up in the group

Calculating the rateCalculating the rate Person-years of follow-up on
study
4552.64.94.12.452.71.6554.353.7
Total : 60.3 65 years
1
2
3
4
5
6
7
8
9
10
11
12
13
14
15
Patient
Start of studyTime
End of study
Event
ynynnnnynnnynyy
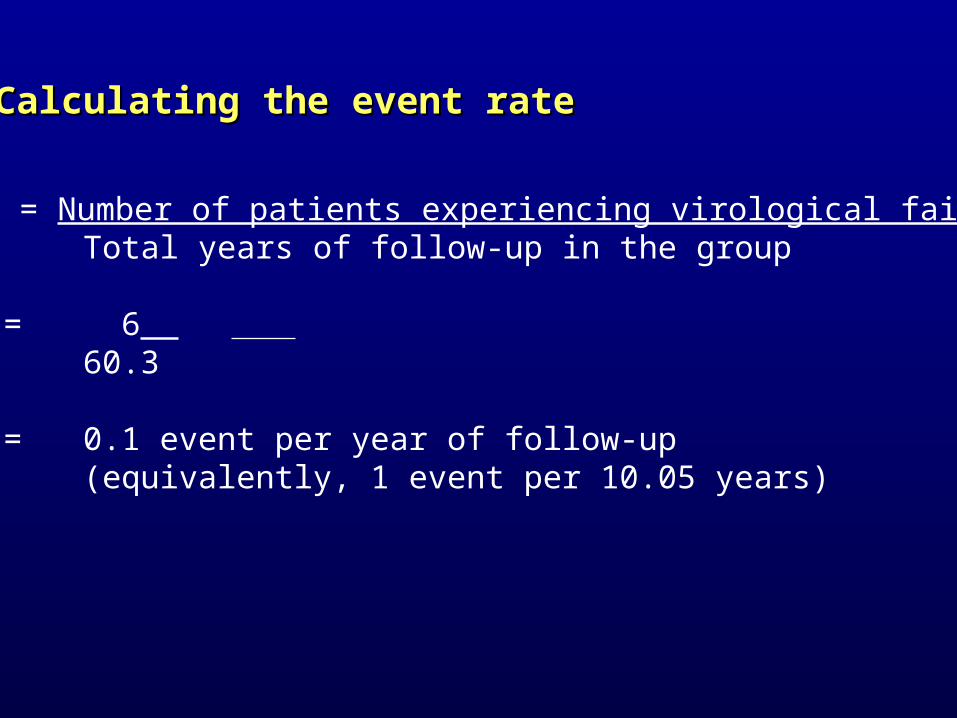
Calculating the event rateCalculating the event rate
Rate = Number of patients experiencing virological failureTotal years of follow-up in the group
= 6 60.3
= 0.1 event per year of follow-up(equivalently, 1 event per 10.05 years)

The rate (cont.)The rate (cont.)
Rate may be expressed relative to any period of time Rate may be expressed relative to any period of time (eg. per 100 patient-years, 1,000 patient-years, per (eg. per 100 patient-years, 1,000 patient-years, per patient-month etc.) depending on frequency of eventpatient-month etc.) depending on frequency of event
Can compare rates in two groups by calculating the Can compare rates in two groups by calculating the relative raterelative rate (rate in group 1 divided by rate in group (rate in group 1 divided by rate in group 2) which is interpreted in a similar manner to RR2) which is interpreted in a similar manner to RR
Can calculate confidence intervals and p-values for Can calculate confidence intervals and p-values for the relative ratethe relative rate

Example : The D:A:D study – relationship Example : The D:A:D study – relationship between exposure to protease inhibitors and MIbetween exposure to protease inhibitors and MI
PI exposure (years)
No. events
Person years
Rate (/1000 years)
None 33 21623 1.5
<1 21 8410 2.5
1-2 33 10947 3.0
2-3 57 13616 4.2
3-4 64 13742 4.7
4-5 57 10734 5.3
5-6 33 7576 4.4
>6 47 7821 6.0
Data taken from The DAD Study Group. Class of Antiretroviral drugs and the risk of myocardial infarction. NEJM 2007; 356: 1723-35

Comparing the rates in different Comparing the rates in different groups – the relative rategroups – the relative rate

Comparing the rate of an event in two or more Comparing the rate of an event in two or more groups groups
We are often interested in whether the rate at which We are often interested in whether the rate at which an event occurs is different in one group compared to an event occurs is different in one group compared to anotheranother
For example, is there a real difference in the rate of MI For example, is there a real difference in the rate of MI in those exposed to PIs for different lengths of time?in those exposed to PIs for different lengths of time?
In order to study this, we can calculate the In order to study this, we can calculate the relative relative raterate
This is calculated as the ratio of the rates in the two This is calculated as the ratio of the rates in the two groupsgroups

Comparing the rate of an event in two or more Comparing the rate of an event in two or more groups groups
Relative rate (RR) Relative rate (RR) of an eventof an event
= = Rate of event in group with factor of interestRate of event in group with factor of interest
Rate of event in group without factor of interestRate of event in group without factor of interest

Comparing the rate of an event in two or more Comparing the rate of an event in two or more groups groups
The RR is a positive numberThe RR is a positive number
Takes values between 0 (when the rate in the group Takes values between 0 (when the rate in the group with the factor is zero) and infinity (when the rate in with the factor is zero) and infinity (when the rate in the group without the factor is zero)the group without the factor is zero)

Interpreting the RR Interpreting the RR
RR

Interpreting the RRInterpreting the RR
RR
> 1

Interpreting the RRInterpreting the RR
RR
Factor is associated with an increased rate of the event.
Factor is a possible RISK FACTOR
> 1

Interpreting the RRInterpreting the RR
RR
Factor is associated with an increased rate of the event.
Factor is a possible RISK FACTOR
> 1
= 1

Interpreting the RRInterpreting the RR
RR
Factor is associated with an increased rate of the event.
Factor is a possible RISK FACTOR
The rate of the event is the same in both groups. Factor
is not associated with either an increased or decreased rate of
the event.
> 1
= 1

Interpreting the RRInterpreting the RR
RR
Factor is associated with an increased rate of the event.
Factor is a possible RISK FACTOR
The rate of the event is the
same in both groups. Factor is not associated with either an
increased or decreased rate of the event.
> 1
= 1
< 1

Interpreting the RRInterpreting the RR
RR
Factor is associated with an increased rate of the event.
Factor is a possible RISK FACTOR
Factor is associated with a decreased rate of the event.
Factor is a possible PROTECTIVE FACTOR
The rate of the event is the
same in both groups. Factor is not associated with either an
increased or decreased rate of the event.
> 1
= 1
< 1

Calculating and interpreting the relative rateCalculating and interpreting the relative rate
PI exposure (years)
No. events
Person years
Rate (/1000 years)
Relative rate
None 33 21623 1.5 Ref.
<1 21 8410 2.5
1-2 33 10947 3.0
2-3 57 13616 4.2
3-4 64 13742 4.7
4-5 57 10734 5.3
5-6 33 7576 4.4
>6 47 7821 6.0
Data taken from The DAD Study Group. Class of Antiretroviral drugs and the risk of myocardial infarction. NEJM 2007; 356: 1723-35

Calculating and interpreting the relative rateCalculating and interpreting the relative rate
PI exposure (years)
No. events
Person years
Rate (/1000 years)
Relative rate
None 33 21623 1.5 Ref.
<1 21 8410 2.5 2.5 / 1.5 = 1.7
1-2 33 10947 3.0
2-3 57 13616 4.2
3-4 64 13742 4.7
4-5 57 10734 5.3
5-6 33 7576 4.4
>6 47 7821 6.0
Data taken from The DAD Study Group. Class of Antiretroviral drugs and the risk of myocardial infarction. NEJM 2007; 356: 1723-35
MI rate is 1.7 times as high in those MI rate is 1.7 times as high in those exposed to PIs for <1 year compared to exposed to PIs for <1 year compared to those never exposed to PIsthose never exposed to PIs

Calculating and interpreting the relative rateCalculating and interpreting the relative rate
PI exposure (years)
No. events
Person years
Rate (/1000 years)
Relative rate
None 33 21623 1.5 Ref.
<1 21 8410 2.5 1.7
1-2 33 10947 3.0 3.0/1.5 = 2.0
2-3 57 13616 4.2
3-4 64 13742 4.7
4-5 57 10734 5.3
5-6 33 7576 4.4
>6 47 7821 6.0
Data taken from The DAD Study Group. Class of Antiretroviral drugs and the risk of myocardial infarction. NEJM 2007; 356: 1723-35

Calculating and interpreting the relative rateCalculating and interpreting the relative rate
PI exposure (years)
No. events
Person years
Rate (/1000 years)
Relative rate
None 33 21623 1.5 Ref.
<1 21 8410 2.5 1.7
1-2 33 10947 3.0 2.0
2-3 57 13616 4.2 2.8
3-4 64 13742 4.7 3.1
4-5 57 10734 5.3 3.5
5-6 33 7576 4.4 2.9
>6 47 7821 6.0 4.0
Data taken from The DAD Study Group. Class of Antiretroviral drugs and the risk of myocardial infarction. NEJM 2007; 356: 1723-35

Limitations of this approachLimitations of this approach
These unadjusted relative rates do not take account of These unadjusted relative rates do not take account of the fact that the characteristics of patients exposed to the fact that the characteristics of patients exposed to PIs for <1 year may be different to those who have PIs for <1 year may be different to those who have never been exposed to PIsnever been exposed to PIs
We have to take account of these differences in our We have to take account of these differences in our analysesanalyses
We usually use We usually use Poisson regressionPoisson regression to obtain to obtain estimates of the RR that are estimates of the RR that are ADJUSTEDADJUSTED for any for any differences in patient characteristicsdifferences in patient characteristics

Relationship between exposure to PIs, NNRTIs Relationship between exposure to PIs, NNRTIs and rate of myocardial infarction (D:A:D)and rate of myocardial infarction (D:A:D)
Variable Relative rate 95% CI
Exposure to PIs (/year) 1.16 1.10-1.23
Exposure to NNRTIs (/year) 1.05 0.98-1.13
Age (/5 years) 1.39 1.31-1.46
Male sex 1.91 1.28-2.86
Smoking status
Current 2.83 2.04-3.93
Former 1.65 1.12-2.42
Never 1 -
Not known 1.70 1.07-2.71
Adapted from: DAD Study Group. N Engl J Med 2007; 356: 1723-1735
* Model also adjusted for body mass index, family history of CHD, previous CV event, cohort, * Model also adjusted for body mass index, family history of CHD, previous CV event, cohort, transmission group, ethnicity, and calendar yeartransmission group, ethnicity, and calendar year

Relationship between exposure to PIs, NNRTIs Relationship between exposure to PIs, NNRTIs and rate of myocardial infarction (D:A:D)and rate of myocardial infarction (D:A:D)
Variable Relative rate 95% CI
Exposure to PIs (/year) 1.16 1.10-1.23
Exposure to NNRTIs (/year) 1.05 0.98-1.13
Age (/5 years) 1.39 1.31-1.46
Male sex 1.91 1.28-2.86
Smoking status
Current 2.83 2.04-3.93
Former 1.65 1.12-2.42
Never 1 -
Not known 1.70 1.07-2.71
* Model also adjusted for body mass index, family history of CHD, previous CV event, cohort, * Model also adjusted for body mass index, family history of CHD, previous CV event, cohort, transmission group, ethnicity, and calendar yeartransmission group, ethnicity, and calendar year
Adapted from: DAD Study Group. N Engl J Med 2007; 356: 1723-1735

SummarySummary
Many statistics aim to describe the ‘risk’ of an event; Many statistics aim to describe the ‘risk’ of an event; the choice of statistic depends on the type of study the choice of statistic depends on the type of study and whether patient follow-up is censoredand whether patient follow-up is censored
Relative rates indicate whether a factor is associated Relative rates indicate whether a factor is associated with an increased (RR>1) or decreased (RR<1) risk of with an increased (RR>1) or decreased (RR<1) risk of the event occurringthe event occurring
Unadjusted RRs do not take account of differences in Unadjusted RRs do not take account of differences in patient characteristics (e.g. age, sex, previous patient characteristics (e.g. age, sex, previous treatment history) between those with and without the treatment history) between those with and without the factor; hence, we use a regression model (e.g. factor; hence, we use a regression model (e.g. Poisson regression) to obtain adjusted RRsPoisson regression) to obtain adjusted RRs