Describing the plastic deformation of aluminium softball bats · 2017-09-07 · Describing the...
10
© 2007 isea Sports Engineering (2007) 10, 185–194 185 Correspondence address: Lloyd Smith Washington State University 201 Sloan, Spokane St., Pullman WA 99164-2920 USA Tel 001 509 335 3221 Fax 001 509 335 4662 Email [email protected] Introduction Much of the work involving finite-element modelling of bat–ball collisions concerns bat performance. An early example involved a viscoelastic ball and an elastic Describing the plastic deformation of aluminium softball bats Eric Biesen and Lloyd Smith School of Mechanical & Materials Engineering, Washington State University, Pullman, WA, USA Abstract Hollow aluminium bats were introduced over 30 years ago to provide improved durability over wooden bats. Since their introduction, however, interest in hollow bats has focused almost exclu- sively around their hitting performance. The aim of this study was to take advantage of the progress that has been made in predicting bat performance using finite elements and apply it to describe bat durability. Accordingly, the plastic deformation from a ball impact of a single-wall aluminum bat was numerically modelled. The bat deformation from the finite-element analysis was then compared with experiment using a high-speed bat test machine. The ball was modelled as an isotropic, homogeneous, viscoelastic sphere. The viscoelastic parameters of the ball model were found from instrumented, high-speed, rigid-wall ball impacts. The rigid-wall ball impacts were modelled numerically and showed good agreement with the experimentally obtained response. The strain response of the combined bat–ball model was verified with a strain-gauged bat at inter- mediate ball impact speeds in the elastic range. The strain response of the bat–ball model exhibited positive correlation with the experimental measurements. High-speed bat–ball impacts were performed experimentally and simulated numerically at increasing impact speeds which induced correspondingly increased dent sizes in the bat. The plastic deformation from the numerical model found good agreement with experiment provided the aluminium work hardening and strain rate effects were appropriately described. The inclusion of strain rate effects was shown to have a signif- icant effect on the bat deformations produced in the finite-element simulations. They also helped explain the existence of high bat stresses found in many performance models. Keywords: bat performance, plasticity, softball bat (Sandmeyer, 1995). His correlations with perform- ance were generally positive, although the accuracy of his ball model was not verified. Another example utilised a Mooney–Rivlin material model to account for the nonlinear properties of a baseball (Mustone & Sherwood, 1998). Finite-element models of wood and aluminium bats were constructed, and their perform- ance values were compared to experimental data. The numerical results proved to be higher than the experi- mental values for both the aluminium and wood bats. This discrepancy may have been due to the level of refinement in the model. Mechanical testing to char- acterise the baseball was also done at a rate that was
Transcript of Describing the plastic deformation of aluminium softball bats · 2017-09-07 · Describing the...

© 2007 isea Sports Engineering (2007) 10, 185–194 185
Correspondence address:Lloyd SmithWashington State University201 Sloan, Spokane St., PullmanWA 99164-2920USATel 001 509 335 3221Fax 001 509 335 4662Email [email protected]
Introduction
Much of the work involving finite-element modellingof bat–ball collisions concerns bat performance. Anearly example involved a viscoelastic ball and an elastic
Describing the plastic deformation of aluminium softball bats
Eric Biesen and Lloyd Smith
School of Mechanical & Materials Engineering, Washington State University, Pullman, WA, USA
Abstract
Hollow aluminium bats were introduced over 30 years ago to provide improved durability overwooden bats. Since their introduction, however, interest in hollow bats has focused almost exclu-sively around their hitting performance. The aim of this study was to take advantage of theprogress that has been made in predicting bat performance using finite elements and apply it todescribe bat durability. Accordingly, the plastic deformation from a ball impact of a single-wallaluminum bat was numerically modelled. The bat deformation from the finite-element analysiswas then compared with experiment using a high-speed bat test machine. The ball was modelled asan isotropic, homogeneous, viscoelastic sphere. The viscoelastic parameters of the ball model werefound from instrumented, high-speed, rigid-wall ball impacts. The rigid-wall ball impacts weremodelled numerically and showed good agreement with the experimentally obtained response.The strain response of the combined bat–ball model was verified with a strain-gauged bat at inter-mediate ball impact speeds in the elastic range. The strain response of the bat–ball model exhibitedpositive correlation with the experimental measurements. High-speed bat–ball impacts wereperformed experimentally and simulated numerically at increasing impact speeds which inducedcorrespondingly increased dent sizes in the bat. The plastic deformation from the numerical modelfound good agreement with experiment provided the aluminium work hardening and strain rateeffects were appropriately described. The inclusion of strain rate effects was shown to have a signif-icant effect on the bat deformations produced in the finite-element simulations. They also helpedexplain the existence of high bat stresses found in many performance models.
Keywords: bat performance, plasticity, softball
bat (Sandmeyer, 1995). His correlations with perform-ance were generally positive, although the accuracy ofhis ball model was not verified. Another exampleutilised a Mooney–Rivlin material model to accountfor the nonlinear properties of a baseball (Mustone &Sherwood, 1998). Finite-element models of wood andaluminium bats were constructed, and their perform-ance values were compared to experimental data. Thenumerical results proved to be higher than the experi-mental values for both the aluminium and wood bats.This discrepancy may have been due to the level ofrefinement in the model. Mechanical testing to char-acterise the baseball was also done at a rate that was
10.4.1 Sports F78 14/5/08 13:20 Page 185

significantly lower than that of an actual bat–ballimpact.
Using the explicit finite-element program LS-DYNA, a bat–ball impact model was developed forboth aluminium and wood bats (Vedula, 2004). Thebat models were calibrated to the experimental testbats by comparing mass, moment of inertia (MOI),centre of gravity (CG), and centre of percussion(COP). Additionally, an eigen analysis was performed,and the bending and hoop mode shapes and frequen-cies were compared. Unlike the work by Mustone &Sherwood, Vedula chose to model the baseball as ahomogeneous viscoelastic sphere.
A similar but more comprehensive work used boththe Mooney–Rivlin and viscoelastic material proper-ties to model a baseball (Nicholls, 2003). Comparisonof the quasi-static load–displacement response of theball models in ANSYS showed the Mooney–Rivlinmodel to be superior. Explicit finite-element simula-tions were run in LS-DYNA for the bat–ball impactsand friction was included. Although more comprehen-sive, Nicholls’ focus was not on determining batperformance or durability, but on how advances intechnology have increased the potential for injury toplayers on the field.
A study has modelled wood and aluminium batsusing LS-DYNA where the bats were calibrated usingtheir MOI in addition to modal analysis (Mustone,2003). Of particular interest with this work was theinclusion of plasticity effects within the simulations.The effect of plasticity on bat deformation or per-formance was not reported, however. The ball modelwas calibrated in a similar fashion to his previouswork (Mustone & Sherwood, 1998) using theMooney–Rivlin material model. Based on theirregular ball deformations and the overestimated batperformance developed within the finite-element sim-ulations, it was concluded that the Mooney–Rivlin ballmodel did not accurately describe the nonlinearbehaviour of a baseball during impact.
Improved ball models involving dynamic character-isation have also been considered (Shenoy et al., 2001;Duris, 2004). In these works, the ball models utilised aviscoelastic material model within LS-DYNA andperformed well when compared to experimentalvalues. The viscoelastic material model was based onthe time-dependent shear modulus G(t),
G(t) = G�
+ (G0 – G�)e–βt (1)
where G�
is the long-term shear modulus, G0 is theshort-term shear modulus, and β is the decay constant. A fourth parameter was also needed for use with thismaterial model: the bulk modulus, k. Poisson’s ratio νis a function of both the shear and bulk modulus,making it time dependent according to
ν(t) = (2)
In the following, a finite-element method was used todescribe the plastic deformation occurring in analuminum softball bat during a bat–ball impact. Thestudy considered both the numerical and experimentalplastic deformation as a function of impact speed. Thenumerical results relied on a dynamic characterisationof the ball response, which is also described.
Ball characterisation
ExperimentThe test fixture used for both the bat and ball testingwas a high-speed pneumatic ball cannon as depicted inFig. 1. The fixture and test protocol are described inASTM F2219 (ASTM, 2005). The speeds of the ball,before and after impact, were measured by the use ofinfrared light gates. Ball velocity was controlled by anelectronic regulating valve on the air tank thatpowered the cannon. The impact target was mountedon a massive x, y, z table (milling machine base), whoseposition was adjusted to provide normal impacts andcollinear rebound trajectories. The ball travelled in asabot which separated from the ball before impact andhelped control its speed and position.
3G(t) – 2k6G(t) – 2k
186 Sports Engineering (2007) 10, 185–194 © 2007 isea
Describing the plastic deformation of aluminium softball bats Biesen & Smith
Ball speed gate
Ball cannon
Bat pivot assembly
Figure 1 Ball cannon used for ball and bat experiments
10.4.1 Sports F78 14/5/08 13:20 Page 186

The hardness and compliance of softballs is afunction of the impact speed and surface geometry. Atest was developed to account for these effects asdepicted in Fig. 2. This test used the ball cannondescribed above, where the ball was fired at a 4 inchlong (202 mm) solid steel half cylinder 2.25 inches(57 m) in diameter which was rigidly mounted by anangle bracket to the mill base. The impact force wasmeasured by three load cells (PCB Model 208C05),arranged in an equilateral triangle, and placedbetween the cylindrical impact surface and the rigidsupport.
An idealised dynamic stiffness of the ball can beobtained by equating its incoming kinetic energy withits stored potential energy at maximum displacement.If we assume that the ball acts as a linear spring duringdeformation, the unknown displacement can be elimi-nated, from which the dynamic stiffness DS is foundfrom (Smith et al., 2007)
DS = ( )2
(3)
where m is the ball mass, F is the peak impact force, andvp is the pitch speed. Comparing balls by their dynamicstiffness (as opposed to their impact force) reduces theinfluence of variations in ball mass or test speed.
The test balls used for this work were 12 inch(305 mm) in circumference, polyurethane core ASAcertified slow-pitch softballs (ASA, 2005). Thedynamic stiffnesses (DS) of the balls were measured asa function of speed between 60 and 130 mile h–1 (27and 58 m s–1). [Note: the relative bat–ball speed in atypical softball bat–ball impact is 110 mile h–1
(49 m s–1).] Seven groups of six balls were randomly
Fvp
1m
selected, and each of these groups was tested at one ofthe speeds within the selected range. These balls werestored and tested in a laboratory space that was held to72°F ± 4° (22°C ± 2°C) and 40% RH ± 10%. With thepeak force, pitch speed, rebound speed, and ball massnow known, a cylindrical impact surface COR(CCOR) and dynamic stiffness for every impact couldbe calculated (Biesen, 2006).
The results for CCOR and DS as a function ofspeed are presented in Figs. 3 and 4, respectively. Theerror bars represent the standard deviation of themean at each speed. The CCOR is observed todecrease with increasing speed. This is characteristicof many sports balls, where dissipated energy increaseswith ball deformation. The DS is observed to increase18% over the range of impact speeds considered here,in comparison to the peak force which increased134%. While the DS increased at a lower rate than thepeak impact force, it suggests that the ball behaves as anon-linear spring. This non-linear response is not sur-prising and has been examined in detail elsewhere(Smith et al., 2007). For the purposes of describing ballhardness and its effect on impact force DS is moreeffective than quasi-static measures, such as ASTMF1888 (ASTM, 2002). The data gathered here, forinstance, are a function of speed, and account for thenon-linearity.
Numerical modelThe ball impacts were modelled using LS-DYNAversion 970 release 5434a (Livermore SoftwareTechnology Corporation, Livermore, CA). Thegeometry was created using ETA/FEMB-PC version
© 2007 isea Sports Engineering (2007) 10, 185–194 187
Biesen & Smith Describing the plastic deformation of aluminium softball bats
Load cell(s)
Impact surface
1st speedmonitor
2nd speedmonitor
Ball cannon
12 in(0.3 m)
12 in(0.3 m)
Rigid wall
Figure 2 Impact cylinder and load cells used for dynamic stiffness testing
10.4.1 Sports F78 14/5/08 13:20 Page 187
28 (Engineering Technology Associates, Inc., Troy,MI). The ball was modelled as a 12 inch (305 mm)circumference solid, isotropic sphere using 10 240 8-noded solid elements. The ball tuning wasaccomplished by simulating the dynamic stiffnessexperiment. The numerical model used a ball weightof 6.745 oz (192 g).
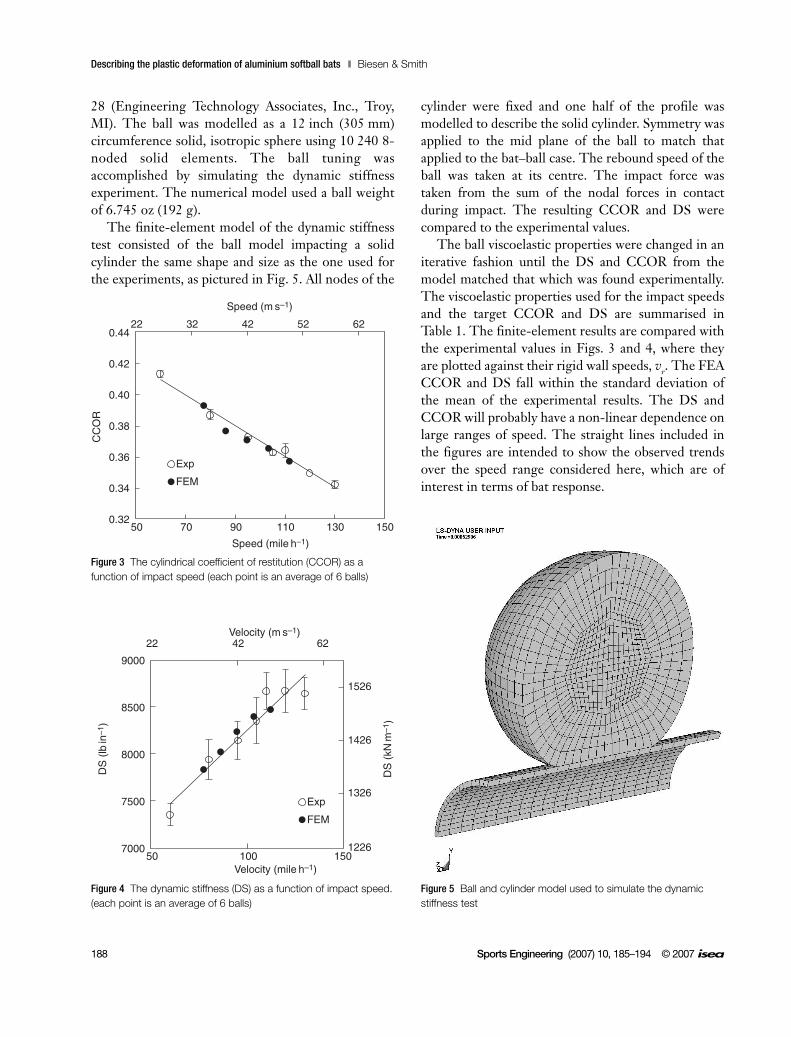
The finite-element model of the dynamic stiffnesstest consisted of the ball model impacting a solidcylinder the same shape and size as the one used forthe experiments, as pictured in Fig. 5. All nodes of the
cylinder were fixed and one half of the profile wasmodelled to describe the solid cylinder. Symmetry wasapplied to the mid plane of the ball to match thatapplied to the bat–ball case. The rebound speed of theball was taken at its centre. The impact force wastaken from the sum of the nodal forces in contactduring impact. The resulting CCOR and DS werecompared to the experimental values.
The ball viscoelastic properties were changed in aniterative fashion until the DS and CCOR from themodel matched that which was found experimentally.The viscoelastic properties used for the impact speedsand the target CCOR and DS are summarised inTable 1. The finite-element results are compared withthe experimental values in Figs. 3 and 4, where theyare plotted against their rigid wall speeds, vr. The FEACCOR and DS fall within the standard deviation ofthe mean of the experimental results. The DS andCCOR will probably have a non-linear dependence onlarge ranges of speed. The straight lines included inthe figures are intended to show the observed trendsover the speed range considered here, which are ofinterest in terms of bat response.
188 Sports Engineering (2007) 10, 185–194 © 2007 isea
Describing the plastic deformation of aluminium softball bats Biesen & Smith
Speed (m s–1)
CC
OR
Exp
FEM
Speed (mile h–1)
50
22 32 42 52 62
0.32
0.34
0.36
0.38
0.40
0.42
0.44
70 90 110 130 150
Velocity (m s–1)
DS
(lb
in–1
)
DS
(kN
m–1
)
Exp
FEM
Velocity (mile h–1)50
22 42 62
7000 1226
1326
1426
1526
7500
8000
8500
9000
100 150
Figure 4 The dynamic stiffness (DS) as a function of impact speed.(each point is an average of 6 balls)
Figure 3 The cylindrical coefficient of restitution (CCOR) as afunction of impact speed (each point is an average of 6 balls)
Figure 5 Ball and cylinder model used to simulate the dynamicstiffness test
10.4.1 Sports F78 14/5/08 13:20 Page 188

Bat–ball collisions and simulations
ExperimentThe slow pitch bats used in this work were made byLouisville Slugger (Model SB806). The aluminium,single-wall bats had a nominal length of 34 inches(0.86 m) and weight of 28 ounces (795 g). Prior totesting, the grips and end caps were removed tosimplify the FEA of the bat as well as apply straingauges to the barrel interior. The sample included sixbats whose mass properties were found according toASTM F2398 (ASTM, 2004). Using the batted-ball-speed scale, preliminary numerical simulationsshowed the bat performed at its highest whenimpacted at 19 inches (0.48 m) from the pivot point,so this location was used for the subsequent testingand analysis.
The bats had an average length, weight, balancepoint and MOI of 33.5 in (0.85 m), 27.2 oz (0.77 kg) ,18.9 in (0.48 m), and 7029 oz in2 (129 g m2), respec-tively. (The balance point was measured from the baseof the knob, while the MOI was taken about a point6 inches (152 mm) from the base of the knob.) Theywere made from 7046-T6 aluminium with thefollowing reported properties (Suchy, 2005): yieldstrength of 60 ksi (414 MPa), ultimate tensile strengthof 65 ksi (448 MPa), Young’s modulus of 10.4 Msi(71.7 GPa), density of 0.102 lb in–3 (2.82 g m–3), and aPoisson’s ratio of 0.30. The yield properties werefound from a sectioned bat so that process inducedstrain-hardening and heat-treating effects would beaccounted for. The effects of crystallographic orienta-tion from the swaging process should be small, giventhe relatively similar yield and ultimate strengths, andwere not considered.
The speed of the rigid-cylinder dynamic stiffnessimpacts must be related to the recoiling bat tests.Assuming the ball must undergo the same deforma-
tion in both cases, then the recoiling, vr, and fixed, vf ,speeds are related according to (Smith et al., 2007)
vf = vr(1 + )–1/2
(4)
where mb is the mass of the ball, r is the distance fromthe pivot to the impact location on a bat, and I is theMOI of the bat about that same pivot point. Theforegoing assumes the barrel remains cylindricalduring impact, which is a good approximation forsolid wood bats. The barrel of hollow metal batsdeforms approximately 0.12 inches (3 mm) duringimpact. Since this is small in comparison to theapproximately 0.75 inches (19 mm) of ball deforma-tion, and will depend on the design of the bat beingimpacted, barrel deformation was not considered ineqn. 4.
Comparison of elastic responseTo verify the ball tuning procedure and bat model cal-ibration, a low-speed impact-strain comparison wasperformed. This comparison consisted of instrument-ing a bat at three locations and impacting it at78.5 mile h–1 (35 m s–1) in the fully elastic range of thebat. Strains were measured in the taper, barrel, andimpact location (14.2 and 19 inches {0.36 and 0.48 m}from the end of the knob, respectively) as shown inFig. 6.
Strain was measured using stacked rosette straingauges (C2A-13-062WW-350, MicroMeasurements),a signal conditioner, and a 200 kHz data acquisitionboard. Each strain channel was sampled at 65 kHz.
The profile of the numeric bat model followedexperimental measurements of its thickness anddiameter along its length, taken from a sectioned bat.The bats were made from a swaging process whichheld the wall thickness of the bats to within0.002 inches (0.05 mm).
mbr2
I
© 2007 isea Sports Engineering (2007) 10, 185–194 189
Biesen & Smith Describing the plastic deformation of aluminium softball bats
Table 1 Viscoelastic material properties of the ball used in the FEA models
vf vr k G0 G�
β(mile h–1) / (m s–1) (mile h–1) / (m s–1) (Msi) / (GPa) (ksi) / (MPa) (ksi) / (MPa) (Hz)
90 / 40.2 77.6 / 34.7 0.8 /5.5 28 / 193 1.59 / 11.0 66 000100 / 44.7 86.2 / 38.5 0.8 / 5.5 28 / 193 1.52 / 10.5 64 000110 / 49.2 94.8 / 42.4 0.8 / 5.5 28 / 193 1.48 / 10.2 68 000120 / 53.6 103.4 / 46.2 0.7 / 4.8 28 / 193 1.4 / 9.6 71 000130 / 58.1 112 / 50 0.7 / 4.8 28 / 193 1.3 / 9.0 74 000
10.4.1 Sports F78 14/5/08 13:20 Page 189

The FEA bat model is shown in Fig. 7 and usedprimarily thick shell elements. These eight-nodedelements allowed a smooth transition in wall thickness(2.5 to 5 mm) and were computationally moreefficient than solid brick elements. A convergencestudy (Biesen, 2006) showed that five integrationpoints through the element thickness were sufficient.The thick shell elements had difficulty describingplasticity under flexure, however. Eight noded,
constant stress, solid brick elements were thereforeemployed in the impact region, as shown in Fig. 7.
The impact region of the bat undergoes significantflexure. Accordingly, multiple solid elements throughthe thickness were required to describe this region. Aconvergence study, comparing low-speed impactstrain response and batted ball speed, showed that fourelements through the thickness, maintaining a 3:1aspect ratio, were sufficient. A total of 16 344 elementswere used in the converged model (3816 thick shell,and 12 528 solid), and the collinear nodes that fell onthe axis of rotation were constrained to simulate thepivot used in the experimental setup. The elasticresponse of the converged model was compared withexperimental impact data. One comparison involvedbat performance as described in ASTM F2219. (Thecannon speed was reduced from 110 mile h–1
{49 m s–1} to 78.5 mile h–1 {35 m s–1} to avoid denting.)The numerical and experimental bat performancemeasurements were within 0.9% using a batted-ballspeed scale (Biesen, 2006).
190 Sports Engineering (2007) 10, 185–194 © 2007 isea
Describing the plastic deformation of aluminium softball bats Biesen & Smith
Impact
Solid elementregion
BarrelTaper
Rotation point
Y
X
Z
8.2 in(0.21 m) 19 in
(0.48 m)
33.5 in(0.85 m)
6 in(0.15 m)
Figure 6 Strain gauge locations on an instrumented bat
Figure 7 Mesh of numeric model used to simulate bat–ball impacts
10.4.1 Sports F78 14/5/08 13:20 Page 190

Another comparison involved the numerical andexperimental strain response at the taper and barrellocations (Fig. 6). The longitudinal direction strainresponse at the taper is presented in Fig. 8. Thenumerical model appears slightly out of phase with theexperiment and describes the tension response of thefirst oscillation better than compression. This locationmay have been influenced by the mass of the testmachine pivot (which was not included in the numericalmodel). Added inertia at the pivot would affect both theperiod of oscillation and strain magnitude and is consis-tent with the observed difference.
The hoop-direction strain response at 90° circum-ferentially from the impact location is presented inFig. 9. The model captured the initial compressivestrain, from the hoop free vibration, before describingthe larger tensile strains from the impact inducedbarrel deformation. While the frequencies of theexperimental and numerical strain responses are com-parable, the shapes of the curves differ. This disparitymay be related to differences in the numerical andexperimental ball. While the two ball responses matchclosely in total energy loss and impact force, theydiffer slightly in stiffness (Smith et al., 2007). This dif-ference in stiffness could be responsible for straindifferences during contact (approximately 1 ms) aswell as free-vibration response after impact.
The longitudinal-direction strain response on theinside surface behind the impact location is presentedin Fig. 10. The experimental response again showed asmall initial compressive strain. Excepting an initialinstability, the associated numerical response agreedwith the experimental strains. The instability was onlyobserved near the impact location, in the longitudinaldirection. The magnitude of the instability tended todecrease at higher impact speeds, and did not invokeplastic strains. The instability was probably related tothe numerical contact algorithms which apply forcesbetween contacting surfaces to prevent penetration.
© 2007 isea Sports Engineering (2007) 10, 185–194 191
Biesen & Smith Describing the plastic deformation of aluminium softball bats
–0.3%
–0.2%
–0.1%
0.1%
0.2%
0.3%
0.0000 0.0005 0.0010 0.0015 0.0020
Time (s)
Str
ain
Experiment
FEA
–0.3%
–0.2%
–0.1%
0.0%
0.1%
0.2%
0.3%
0.0000 0.0005 0.0010 0.0015 0.0020
Time (s)
Str
ain
Experiment
FEA
–0.3%
–0.2%
–0.1%
0.0%
0.1%
0.2%
0.3%
0.0000 0.0005 0.0010 0.0015 0.0020
Time (s)
Str
ain
Experiment
FEA
Figure 8 Longitudinal direction strain comparison at the taperlocation for a 78.5 mile h–1 (35 m s–1) impact
Figure 10 Longitudinal direction strain comparison at the impactlocation (inside of barrel) for a 78.5 mile h–1 (35 m s–1)
Figure 9 Hoop direction strain comparison 90° from the impactlocation for a 78.5 mile h–1 (35 m s–1) impact.
10.4.1 Sports F78 14/5/08 13:20 Page 191

While capturing the peak impact strain at the impactlocation, the numerical and experimental responseshere have a small phase difference that is similar tothat observed at the other locations.
Comparison of plastic responseThe plastic deformation was measured experimentallyby comparing dent depth. This measurement wasaccomplished by placing the bat in a lathe andscanning its surface circumferentially and longitudi-nally with a dial indicator. Once the centre of the dentwas located, the indicator was zeroed and measure-ments were taken at 0.5 inches (13 mm) incrementslongitudinally along the bat for 3.5 inches (89 mm) ineither direction. Because the bat barrel is not a perfectcylinder, manufacturing anomalies were separatedfrom plastic deformation. A straight line was foundfrom the outermost measurements (3.5 inches{89 mm} from the dent) where plasticity did not occur.Dent depth was taken as the normal distance from thedent centre to this line.
The deformation from the numerical simulationswas determined from the outer diameter of the bat atthe point of impact. These measurements were takenas the bat oscillated, which required averaging.Figure 11 shows a typical example of the oscillatingdiameter with the average. The large reduction duringthe first 1 ms is dominated by the elastic response ofthe bat. The dent depth was found by taking the
average of the oscillating residual from the originaldiameter.
The numerical model used an isotropic power lawto describe hardening. The strength coefficient andthe strain hardening exponent were found from tensilestress–strain data provided by Louisville Slugger, as82 657 psi (570 MPa) and 0.0684, respectively.Unfortunately, the numerical model over estimatedthe dent depth by a factor of 10 using this plasticitymodel alone.
While the plasticity of many aluminium alloys israte sensitive, this effect has not been included for batimpacts found in the literature. Strain rate effects wereincorporated into the numeric model following thatproposed by Cowper and Symonds (LS-Dyna, 2003),where the yield strength becomes a function of strainrate. The scaling factor is given as,
1 + ( )1/P
(5)
where ε. is the strain rate, and C and P are scaling coef-ficients.
While scaling coefficients for the 7046-T6 alloycould not be found, they are reported for a similaralloy, 7075-T65 (Stanart, 2000) as 1300 and 5 for Cand P, respectively. For a 130 mile h–1 (58 m s–1)impact, for example, strain rates for the numericalmodel were of the order of 1100 s–1, effectively scalingthe yield strength by a factor of two.
Predictions from numerical models involvingbat–ball impacts often report bat stresses far exceedingthe alloy’s yield strength. This apparent anomalousresult contradicts the generally positive correlationobtained in performance comparisons. The contradic-tion appears to be addressed by consideration of strainrate effects. It also suggests that bat alloy selectionshould involve both static strength and strain-ratedependence.
A comparison of the experimental and numericdent depth is presented in Fig. 12 for five impactspeeds. The comparison is favourable, showing thatdents can be reliably predicted at a variety of speedsand develop at relatively low impact speeds.
Bat durability is often described as a fatigueproblem. The results clearly show here, however, that,for a relative impact speed of 90 mile h–1 (40 m s–1), ameasurable dent would occur on the first impact,
ε.
C
192 Sports Engineering (2007) 10, 185–194 © 2007 isea
Describing the plastic deformation of aluminium softball bats Biesen & Smith
2.08
2.12
2.16
2.20
2.24
2.28
0.000 0.001 0.002 0.003 0.004
Time (s)
Dia
met
er (
in)
53
54
55
56
57
58
Dia
met
er (
mm
)
FEA
Avg
Figure 11 Representative diameter measurement taken from finite-element simulation
10.4.1 Sports F78 14/5/08 13:20 Page 192
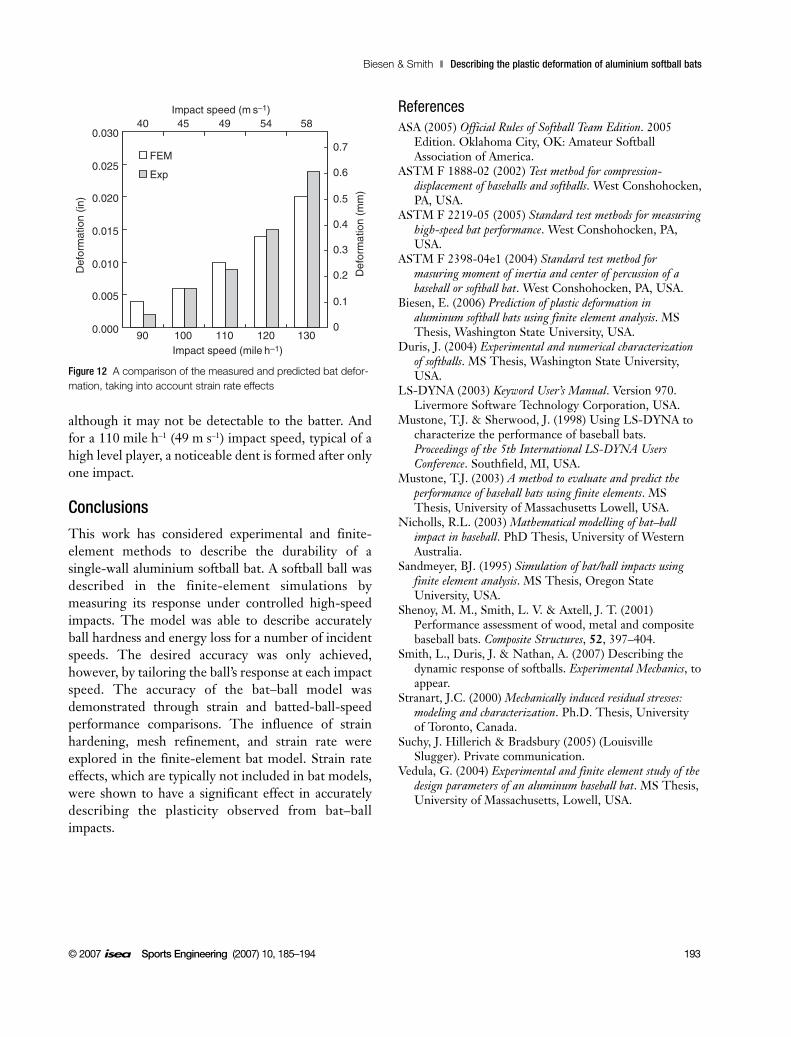
although it may not be detectable to the batter. Andfor a 110 mile h–1 (49 m s–1) impact speed, typical of ahigh level player, a noticeable dent is formed after onlyone impact.
Conclusions
This work has considered experimental and finite-element methods to describe the durability of asingle-wall aluminium softball bat. A softball ball wasdescribed in the finite-element simulations bymeasuring its response under controlled high-speedimpacts. The model was able to describe accuratelyball hardness and energy loss for a number of incidentspeeds. The desired accuracy was only achieved,however, by tailoring the ball’s response at each impactspeed. The accuracy of the bat–ball model wasdemonstrated through strain and batted-ball-speedperformance comparisons. The influence of strainhardening, mesh refinement, and strain rate wereexplored in the finite-element bat model. Strain rateeffects, which are typically not included in bat models,were shown to have a significant effect in accuratelydescribing the plasticity observed from bat–ballimpacts.
ReferencesASA (2005) Official Rules of Softball Team Edition. 2005
Edition. Oklahoma City, OK: Amateur SoftballAssociation of America.
ASTM F 1888-02 (2002) Test method for compression-displacement of baseballs and softballs. West Conshohocken,PA, USA.
ASTM F 2219-05 (2005) Standard test methods for measuringhigh-speed bat performance. West Conshohocken, PA,USA.
ASTM F 2398-04e1 (2004) Standard test method formasuring moment of inertia and center of percussion of abaseball or softball bat. West Conshohocken, PA, USA.
Biesen, E. (2006) Prediction of plastic deformation inaluminum softball bats using finite element analysis. MSThesis, Washington State University, USA.
Duris, J. (2004) Experimental and numerical characterizationof softballs. MS Thesis, Washington State University,USA.
LS-DYNA (2003) Keyword User’s Manual. Version 970.Livermore Software Technology Corporation, USA.
Mustone, T.J. & Sherwood, J. (1998) Using LS-DYNA tocharacterize the performance of baseball bats.Proceedings of the 5th International LS-DYNA UsersConference. Southfield, MI, USA.
Mustone, T.J. (2003) A method to evaluate and predict theperformance of baseball bats using finite elements. MSThesis, University of Massachusetts Lowell, USA.
Nicholls, R.L. (2003) Mathematical modelling of bat–ballimpact in baseball. PhD Thesis, University of WesternAustralia.
Sandmeyer, BJ. (1995) Simulation of bat/ball impacts usingfinite element analysis. MS Thesis, Oregon StateUniversity, USA.
Shenoy, M. M., Smith, L. V. & Axtell, J. T. (2001)Performance assessment of wood, metal and compositebaseball bats. Composite Structures, 52, 397–404.
Smith, L., Duris, J. & Nathan, A. (2007) Describing thedynamic response of softballs. Experimental Mechanics, toappear.
Stranart, J.C. (2000) Mechanically induced residual stresses:modeling and characterization. Ph.D. Thesis, Universityof Toronto, Canada.
Suchy, J. Hillerich & Bradsbury (2005) (LouisvilleSlugger). Private communication.
Vedula, G. (2004) Experimental and finite element study of thedesign parameters of an aluminum baseball bat. MS Thesis,University of Massachusetts, Lowell, USA.
© 2007 isea Sports Engineering (2007) 10, 185–194 193
Biesen & Smith Describing the plastic deformation of aluminium softball bats
0.000
0.005
0.010
0.015
0.020
0.025
0.030
90 100 110 120 130Impact speed (mile h–1)
Def
orm
atio
n (in
)
0
0.1
0.2
0.3
0.4
0.5
0.6
0.7
40 45 49 54 58Impact speed (m s–1)
Def
orm
atio
n (m
m)
FEM
Exp
Figure 12 A comparison of the measured and predicted bat defor-mation, taking into account strain rate effects
10.4.1 Sports F78 14/5/08 13:20 Page 193

10.4.1 Sports F78 14/5/08 13:20 Page 194