Deriving Process Safety KPIs for the Oil Processing Industry · Deriving Process Safety KPIs for...
27
Deriving Process Safety KPIs for the Oil Processing Industry for the Oil Processing Industry Swiss Aviation Safety Conference –SASCON, November 2012, Olten Safety Performance Indicators (SPI)
Transcript of Deriving Process Safety KPIs for the Oil Processing Industry · Deriving Process Safety KPIs for...
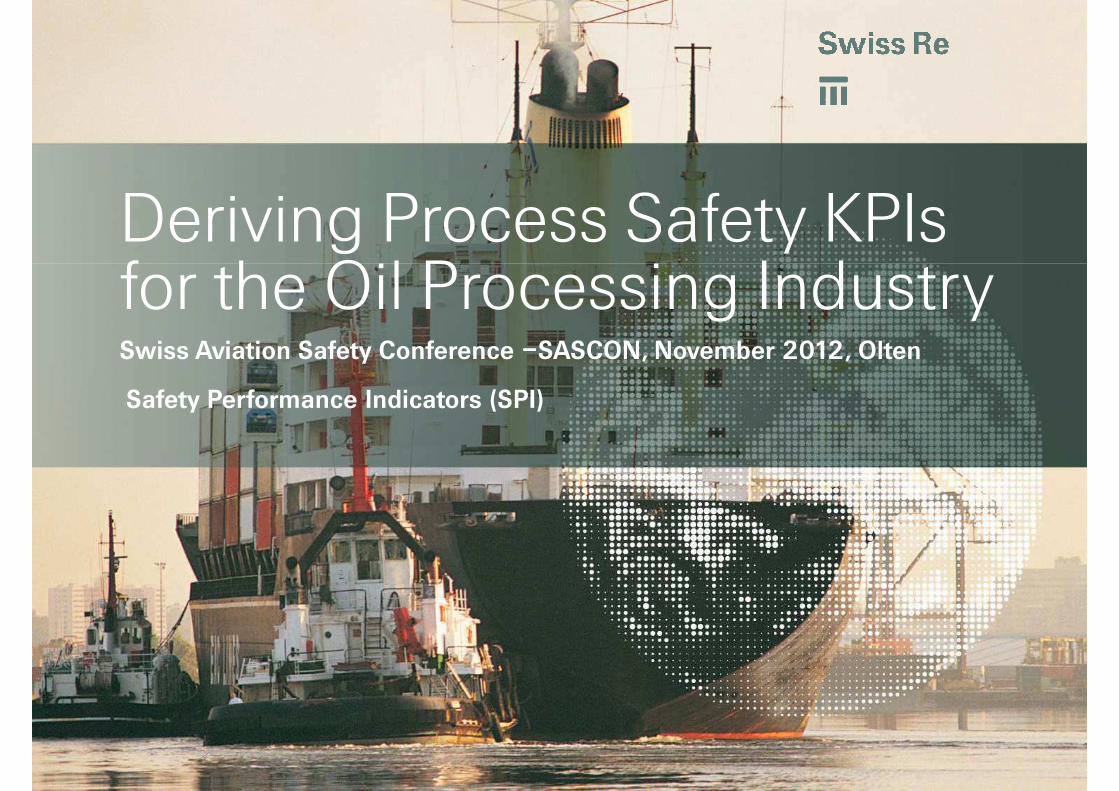
Deriving Process Safety KPIs for the Oil Processing Industryfor the Oil Processing IndustrySwiss Aviation Safety Conference –SASCON, November 2012, Olten
Safety Performance Indicators (SPI)

� High Loss Burden in US Refining
� Personal Safety vs Process Safety
Agenda
� Personal Safety vs Process Safety
� SwissRe Process Safety KPI Suggestions
� American Petroleum Institute API 754 on Process Safety KPI
� Chemical Safety Board CSB on Process Safety KPI
� Occupational Health and Safety Admin OSHA on Process Safety KPI
� Analogy between Processing Industry and Aviation
2

Initiative for Process Safety KPI's, because of high normalized loss burden in the USA
Personal safety key performance indicators KPIs
(“OSHA recordables”) are monitored closely and (“OSHA recordables”) are monitored closely and
made public, however process safety KPI are not
controlled in the same way and still unknown to
the public.
Defining and measuring process safety KPIs
would be beneficial to identify the good
3
would be beneficial to identify the good
performers, additionally it would create a level
playing field for all operators.

Backlog Cluster
� backlog of work orders WO (Macondo Platform, Avon Refinery el al)
� Accumulated overtime
Process Safety KPI acc. to SwissReObservation after Large Losses
� Accumulated overtime
� backlog of inspection
� Backlog of safety critical equipment maintenance, audit, testing etc
� number of clamps per line
Operational Cluster
� Bypassed trips (Macondo, Texas City Refinery)
� Loss of primary containment LOPC, including lifted pressure safety valves
PSV PSV
� excursion form the operating envelope
� Unplanned shutdown, plant wide and partial (Macondo, Pembroke, Puerto
Llano)
� Startup without applying Prestart up safety reviews PSSR (Lysekil)
� Observed failure on demand on a safety instrumented system SIS,
4

Engineering Cluster
� Status of recommendations from HAZOP , Safety Management System Audit,
Process Safety KPI acc. to SwissReObservation after Large Losses
� Status of recommendations from HAZOP , Safety Management System Audit,
MOC and external audits (Texas City, Macondo)
� Postponed turnaround without formal risk assessment, (Humberside)
� not updated P&IDs and operating procedures SOP, EOP, (Kuwait)
� Loss mitigation system fails on demand, (Mexico)
� Incident investigation and near miss reporting system low priority
5

6

API 754, Process Safety Performance Indicators for the Refining and Petrochem. Industry4 Tier reporting system
7

Tier 1 PSE Rate = Total Tier 1PSE counts/total work hours * 200,000h
� Property damage of more than 25,000 USD
API 754, Performance IndicatorTier 1 Process Safety Events PSE
� Property damage of more than 25,000 USD
� Spills of more than 500 kg of flashable material eg propane within one
hour, LOPC loss of primary containment
� Pressure release to flare or vent of more than 500 kg of flashable material
Resulting in:
– Fatality
– Injury resulting in days away from work
– on site "shelter in place"
– road closure
– community evacuation or "shelter in place"
8

Tier 2 PSE Rate = Total Tier 2PSE counts/total work hours * 200,000h
� Property damage of more than 2,500 USD
API 754, Performance IndicatorTier 2 Process Safety Events PSE
� Property damage of more than 2,500 USD
� Spills of more than 50 kg of flashable material eg propane within one
hour
� Pressure release to flare or vent of more than 50kg of flashable material
Resulting in:
– Injury resulting in a OSHA recordable
– on site "shelter in place"
– road closure
– community evacuation or "shelter in place"
9

Tier 3 some use a rate, others prefer a count of PSE, not uniform presently
� Safe operating limit SOL excursions, eg working beyond alarms, power
API 754, Performance IndicatorTier 3 Challenges to Safety Systems
� Safe operating limit SOL excursions, eg working beyond alarms, power
failures
� Metals inspection or testing results outside acceptable limits eg below
min. wall thickness, test release pressure PSV too high or low
� Demands on safety systems
– activation of safety instrumented system SIS, eg trip,
– activation of a mechanical shutdown system, eg overspeed trip
– activation of pressure safety valve PSV
10

Tier 4 some use a rate, percentage , others prefer a count of PSE, not
uniform presently
API 754, Performance IndicatorTier 4 Operating Discipline & Mgmt Systems
� Process Hazard Evaluations done on time
� Process safety action items done on time, coming from:
– Process hazard evaluations (and MoCs??)
– incident and near miss investigations
– Safety audits
� Training completed on schedule
� Updated procedures and drawings
� Permit to work, Lock-out Tag-out procedures compliance
� Safety critical equipment inspection done on time
11

cont'd
� Action items after Failure on demand of Safety critical equipment
API 754, Performance IndicatorTier 4 Operating Discipline & Mgmt Systems
� Action items after Failure on demand of Safety critical equipment
� MoC and PreStartup Safety Review PSSR procedure compliance
� Completion of emergency response drills
� Fatigue risk management
– overtime percentage
– number of open shift positions
– number of extended shifts– number of extended shifts
– number of consecutive shifts worked
– number of exceptions
12

General on lessons learnt from losses:
� Process Safety KPIs must be part of the incentive program at all
Priority Process safety KPIs per CSBChemical Safety Board, Washington DC
� Process Safety KPIs must be part of the incentive program at all
hierarchies, because completion rate 90% when rewarded but else less
than 70%
� Note that all KPIs are subject to manipulation
� 3 to 8 Layers of protection have been penetrated per large loss, on avg 5,
(Swiss Cheese model)
� all contributing causes can be attributed to the 14 PSM (OSHA's PSM
regulations at 29CFR1910.119) elements (mainly mech integrity, MoC, regulations at 29CFR1910.119) elements (mainly mech integrity, MoC,
HAZOP, Process Safety Info)
� management oversight (safety culture, "production first")
� Product stewardship (understanding eg Material Data Sheet MDS,
blaming supplier)
13

Layers of Protection, Swiss Cheese Mod
14
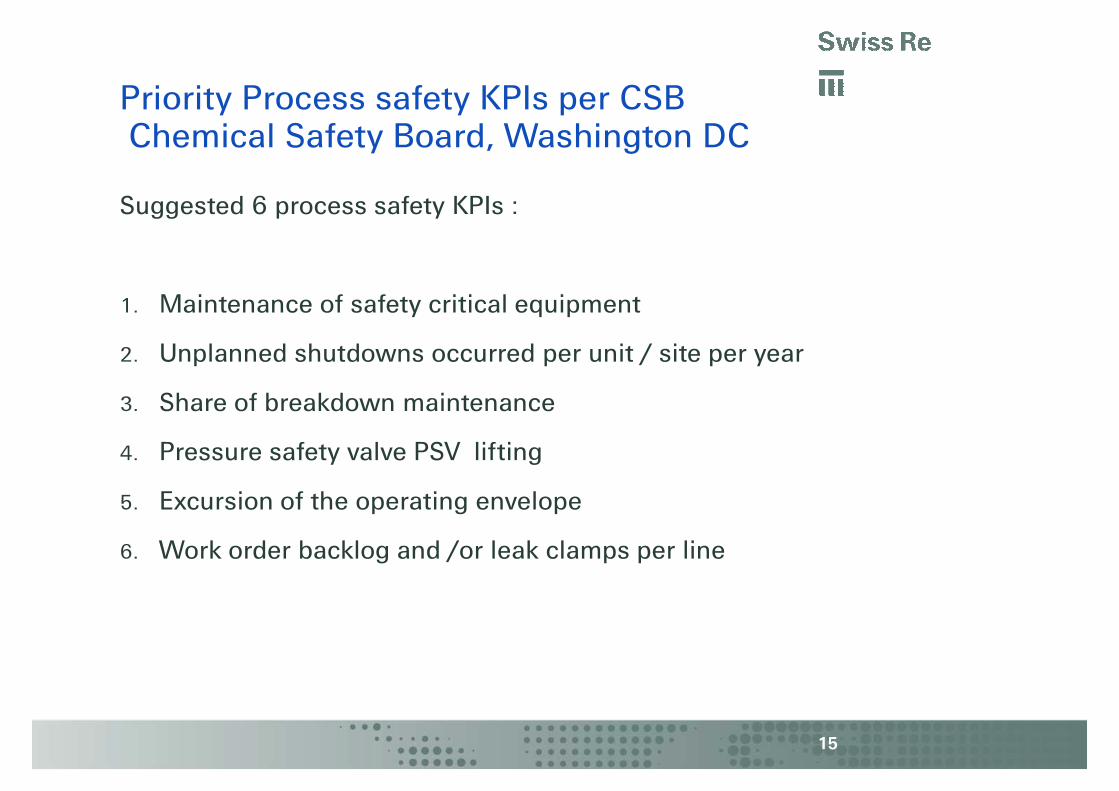
Suggested 6 process safety KPIs :
Priority Process safety KPIs per CSBChemical Safety Board, Washington DC
1. Maintenance of safety critical equipment
2. Unplanned shutdowns occurred per unit / site per year
3. Share of breakdown maintenance
4. Pressure safety valve PSV lifting
5. Excursion of the operating envelope
6. Work order backlog and /or leak clamps per line
15

Suggested 6 process safety KPIs :
These were mentioned to SwissRe after the National Emphasis Program
Priority Process safety KPIs per OSHA,Occupational Safety and Health Admin, Washington DC
These were mentioned to SwissRe after the National Emphasis Program
NEP, a nation wide refinery audit program, after TX City explosion. Repeat
findings at same site were main frustration for auditors (fines ineffective)
1. Near miss reporting system with a degree of confidence
2. Implementation of Process Hazard Analysis PHA findings
3. Past due inspections, eg PSVs, vessels, piping, ESD etc3. Past due inspections, eg PSVs, vessels, piping, ESD etc
4. increasing work order WO backlog with increasing overtime
5. Loss of primary containment LOPC and PSV lifting
6. Incident investigation and recommendations
16

� Low probability - high consequence losses are of concern
� Personal safety indicators (slips, trips, and falls) are useless for process
Analogies between Processing Industry and Aviation
� Personal safety indicators (slips, trips, and falls) are useless for process
safety indication
� Need to learn from near misses rather than from seldom losses
� Main issue: Oil processing Aviation
Leak Spacing
17

� Spiral dive (Nassenwil)
� TCAS off or unclear priority with controller´s instruction (Ueberlingen)
Tier 1 of API 754 analogy ??
� TCAS off or unclear priority with controller´s instruction (Ueberlingen)
� Min. separation (Ueberlingen)
� Uncalibrated altimeter – ILS (Stadlerberg)
� Decent below MSA without "in sight" (Bassersdorf ?)
� Changes to aircraft with weak approval process (Halifax), MoC
� Little "pitch and power" training hours (AF447) or little no autopilot /
autothrottle flight experience (fear blame from Flight Data Monitoring??) autothrottle flight experience (fear blame from Flight Data Monitoring??)
18

Tier 1 of API 754 analogy ??
19Source: Flight International 16.10.12
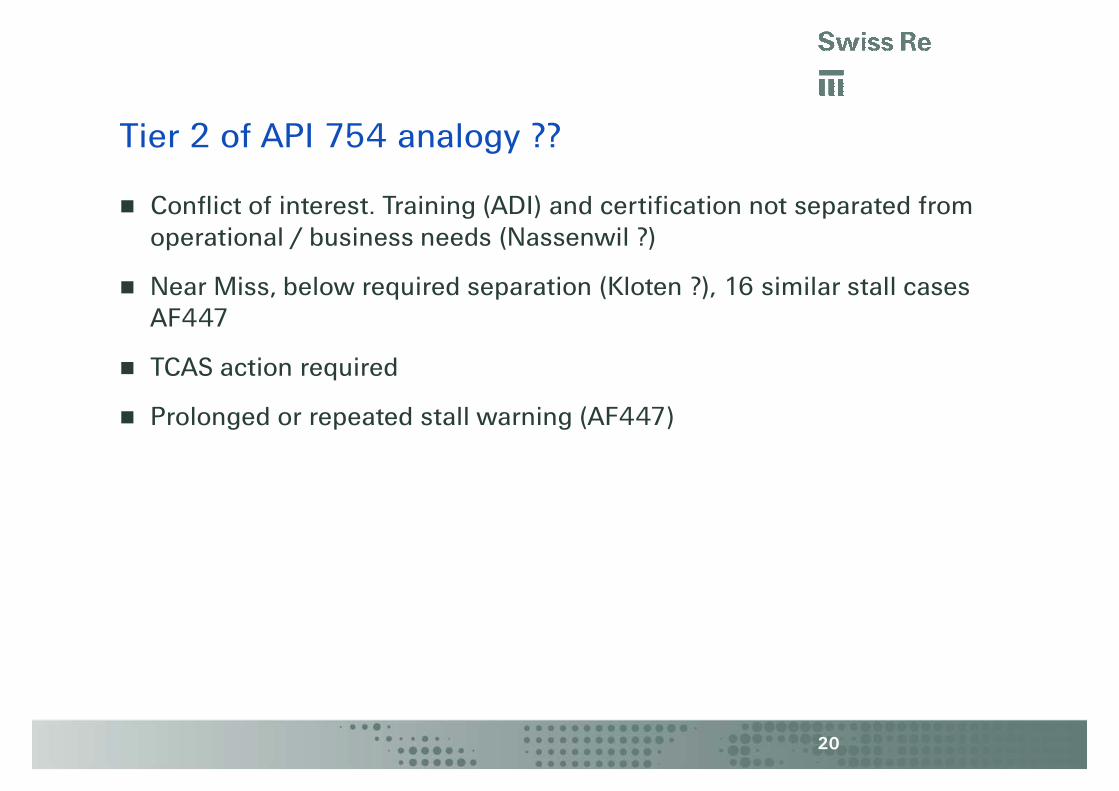
� Conflict of interest. Training (ADI) and certification not separated from
operational / business needs (Nassenwil ?)
Tier 2 of API 754 analogy ??
� Near Miss, below required separation (Kloten ?), 16 similar stall cases
AF447
� TCAS action required
� Prolonged or repeated stall warning (AF447)
20
Tier 1 of API 754 analogy ??
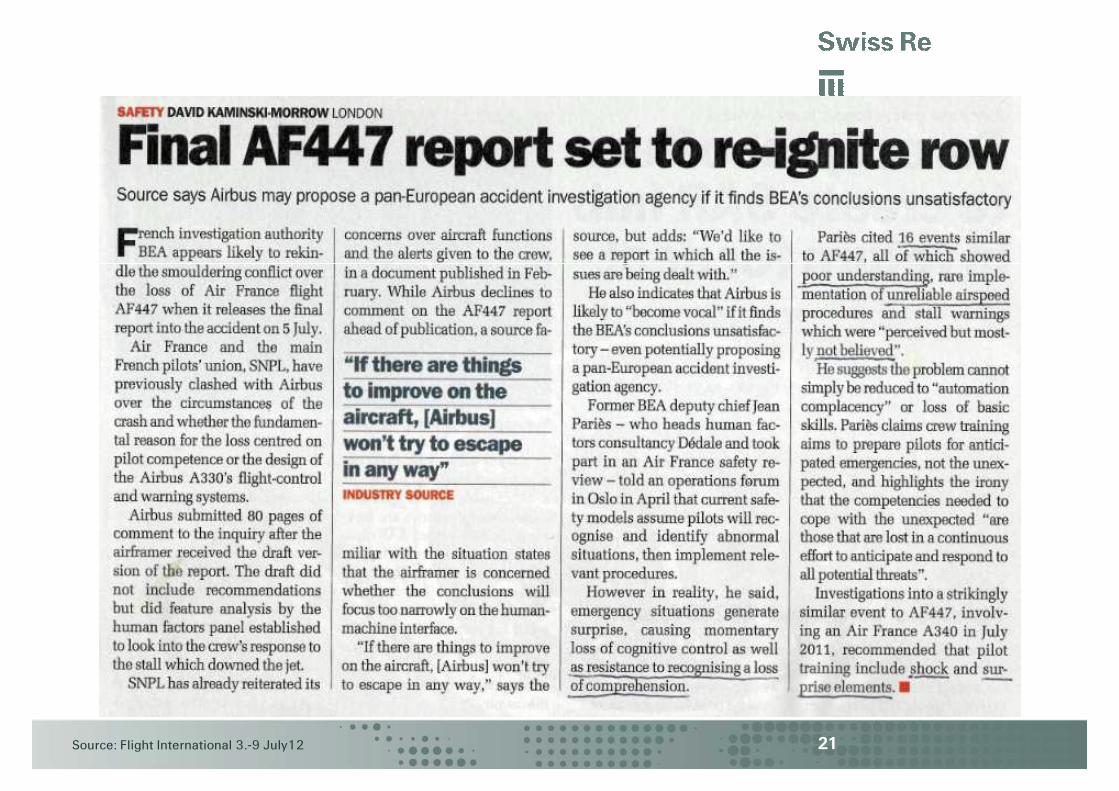
21Source: Flight International 3.-9 July12
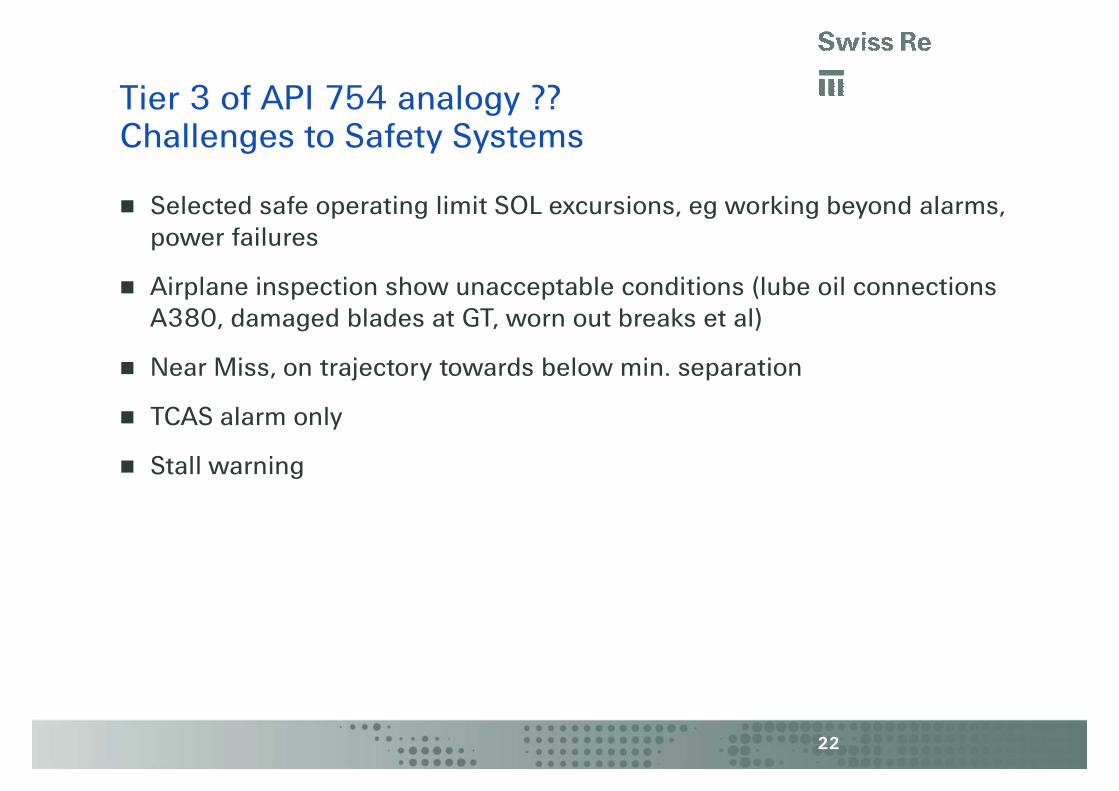
� Selected safe operating limit SOL excursions, eg working beyond alarms,
power failures
Tier 3 of API 754 analogy ??Challenges to Safety Systems
� Airplane inspection show unacceptable conditions (lube oil connections
A380, damaged blades at GT, worn out breaks et al)
� Near Miss, on trajectory towards below min. separation
� TCAS alarm only
� Stall warning
22

� Flight safety action items done on time, coming from:
– incident and near miss investigations, own and others
– Safety audits
Tier 4 of API 754 analogy ??Operating Discipline & Mgmt Systems
– Safety audits
– Safety meetings
– Airplane manufacturer (Thales Pitot, Concorde wheel bar)
� Training completed on schedule
� Updated procedures
� Safety critical procedures compliance
� Safety critical equipment inspection done on time
� Action items after failure on demand of Safety critical equipment
� Completion of emergency response drills
� Fatigue risk management
23

Be pragmatic –use lessons learnt from losses
24
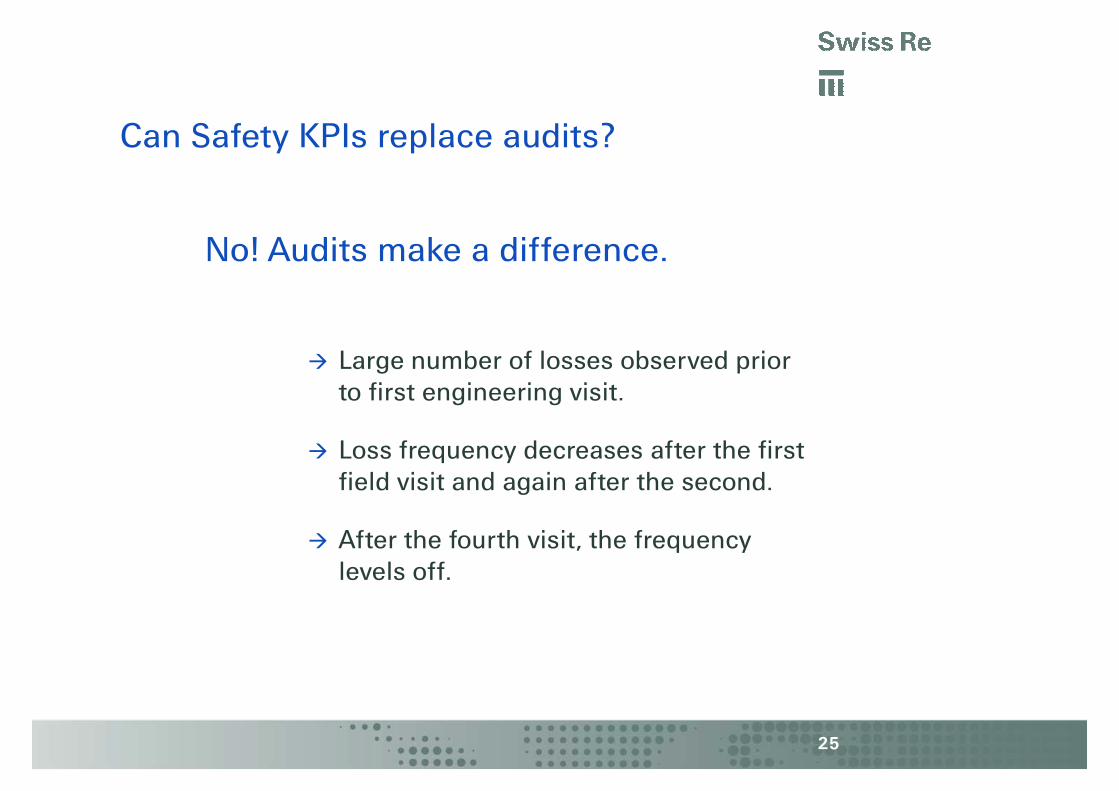
Can Safety KPIs replace audits?
No! Audits make a difference.No! Audits make a difference.
� Large number of losses observed prior
to first engineering visit.
� Loss frequency decreases after the first
field visit and again after the second.
After the fourth visit, the frequency
25
� After the fourth visit, the frequency
levels off.

Thank you

Legal notice
©2012 Swiss Re. All rights reserved. You are not permitted to create any
modifications or derivatives of this presentation or to use it for commercial
or other public purposes without the prior written permission of Swiss Re.or other public purposes without the prior written permission of Swiss Re.
Although all the information used was taken from reliable sources, Swiss Re
does not accept any responsibility for the accuracy or comprehensiveness of
the details given. All liability for the accuracy and completeness thereof or
for any damage resulting from the use of the information contained in this
presentation is expressly excluded. Under no circumstances shall Swiss Re
or its Group companies be liable for any financial and/or consequential loss
relating to this presentation.relating to this presentation.
27