Depressional Wetlands Monitoring Plan
20
Assessment of Extent and Condition of Depressional Wetlands in southern California Jeff Brown and Eric Stein Southern California Coastal Water Research Project For the Surface Water Ambient Monitoring Program (SWAMP March 2011 Depressional Wetlands Monitoring Plan 2011
Transcript of Depressional Wetlands Monitoring Plan

Assessment of Extent and Condition of Depressional
Wetlands
in southern California
Jeff Brown and Eric Stein
Southern California Coastal Water Research Project
For the Surface Water Ambient Monitoring Program (SWAMP
March 2011
CALIFORNIA REGIONAL WATER QUALITY CONTROL BOARD
SAN DIEGO REGION
9174 Sky Park Court, Suite 100, San Diego, California 92123-4340
Phone (858) 467-2953 Fax (858) 571-6972
http://www.waterboards.ca.gov/sandiego/.
Depressional Wetlands Monitoring Plan 2011
i
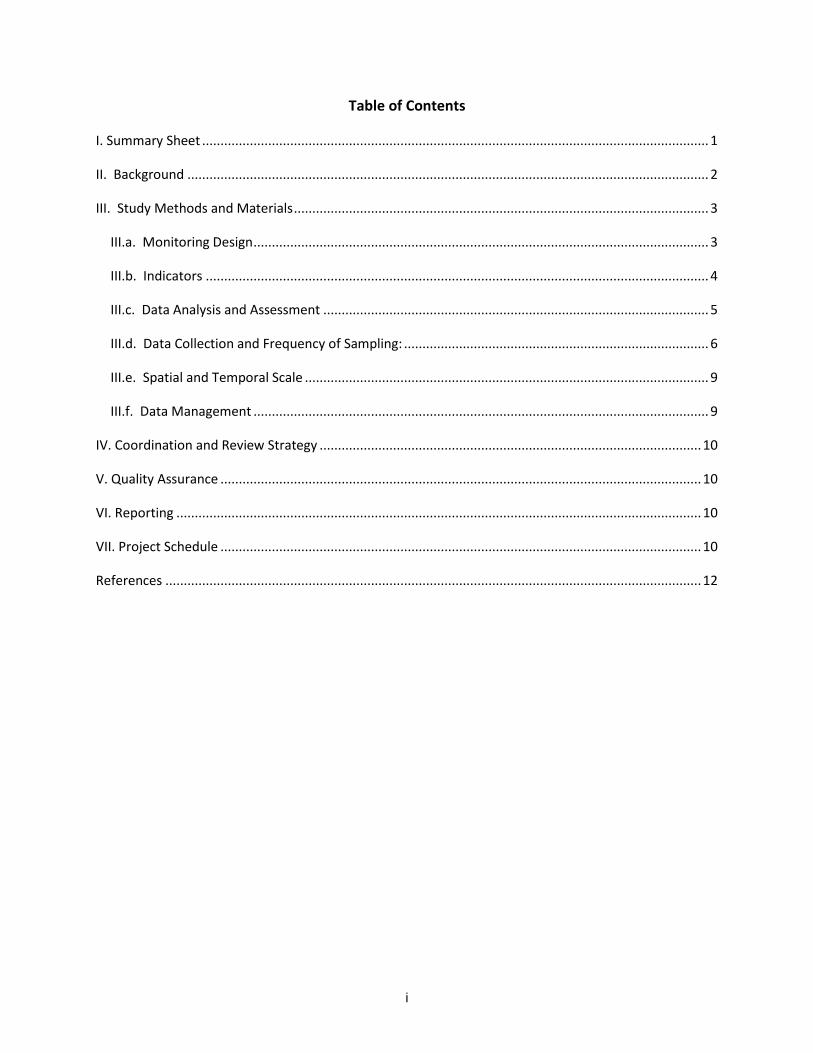
Table of Contents
I. Summary Sheet .......................................................................................................................................... 1
II. Background .............................................................................................................................................. 2
III. Study Methods and Materials ................................................................................................................. 3
III.a. Monitoring Design ............................................................................................................................ 3
III.b. Indicators ......................................................................................................................................... 4
III.c. Data Analysis and Assessment ......................................................................................................... 5
III.d. Data Collection and Frequency of Sampling: ................................................................................... 6
III.e. Spatial and Temporal Scale .............................................................................................................. 9
III.f. Data Management ............................................................................................................................ 9
IV. Coordination and Review Strategy ........................................................................................................ 10
V. Quality Assurance ................................................................................................................................... 10
VI. Reporting ............................................................................................................................................... 10
VII. Project Schedule ................................................................................................................................... 10
References .................................................................................................................................................. 12

1
I. Summary Sheet
Beneficial Uses
This study will be the first-ever systematic condition assessment of southern California depressional
wetlands, including an evaluation of indicators that will help assess the condition and stressors
associated with the beneficial uses in these areas. In addition, this project will help expand the science
of depressional wetland assessment by developing a study design and indicators that could be adopted
or modified for other regions of the State. This will allow future management actions to be better
targeted toward addressing deficiencies and in improving beneficial uses over the long-term.
Assessment Questions
The depressional wetland assessment will address the following questions of importance to regulatory
agencies and regulated communities, and public:
1. What is the extent and distribution of depressional wetlands in Southern California?
2. What is the condition of depressional wetlands in Southern California?
3. What are the major stressors affecting depressional wetland condition in Southern California?
To answer these questions, the following steps will be taken:
1. Map the location and distribution of depressional wetlands.
2. Address the condition of depressional wetlands using an indicator of general wetland condition
or health, and a set of more intensive indicators to address the hydrologic, water quality, and
habitat conditions within the wetlands.
3. Measure sediment chemistry and toxicity, as well as measurements of potential stressors in the
surrounding landscape (e.g. agriculture, flow diversions, industrial activities). Investigate
potential stressor-response relationships.
Link to Statewide Monitoring Framework
The statewide SWAMP program assesses the protection of beneficial uses, with a special focus on
aquatic ecosystem health. Large monitoring programs funded by SWAMP on a statewide and on a
regional basis are conducted to assess the health of the watersheds in California. This proposed
monitoring plan focuses a detailed assessment of depressional wetlands in southern California. Data
that will be collected through this monitoring program will be SWAMP comparable. The SWAMP QA
program and the SWAMP data management program will be included into the proposed program to
ensure consistency with the statewide SWAMP program.
Clean Water Act Sections 305(b)/303(d)
The data produced by this monitoring plan will be used in water body assessments required under Clean
Water Act (CWA) sections 305(b) and 303(d).

2
II. Background
California’s Surface Water Ambient Monitoring Program (SWAMP) was established to provide a
comprehensive, unbiased assessment of all surface waters and to coordinate all water quality
monitoring programs and projects conducted by the State Board and the nine Regional Boards. Ambient
condition assessment has been a cornerstone of the SWAMP program and serves to provide context for
evaluating a range of regulatory and management decisions, including impairment listings under Section
303(d) of the Clean Water Act, permitting, and restoration activities (SWRCB, 2000).
SWAMP has focused mainly on perennial wadeable streams, with limited state or regional assessments
completed for large rivers, lakes, estuaries, and nearshore marine environments. This focus is a result of
limited funding by the State legislature and limitations on available assessment tools for other
waterbody types. To date, the SWAMP program has not focused on freshwater depressional wetlands,
despite the fact that they comprise approximately 45% of the State’s 3.6 million acres of wetlands
(Sutula et al. 2008). Most monitoring and assessment of depressional wetlands is associated with
specific impact or mitigation projects. As a result, available information is limited in space and time and
there is little knowledge of overall extent and condition of depressional wetlands.
Depressional wetlands (such as vernal pools, freshwater marshes, and wet meadows) occur in
topographic depressions that exhibit closed contours on at least three sides. Elevations within the
wetland are lower than in the surrounding landscape. The shape of depressional wetlands varies, but in
all cases, the movement of surface water and shallow subsurface water is toward the lowest point in the
depression. Depressional wetlands may be isolated with no surface water inflow or outflow through
defined channels, or they may have near persistent to intermittent surface water flows that connect
them to other surface waters or other wetlands. These wetlands may be natural, actively maintained
manmade features, or abandoned manmade features. They lose most of their water to evaporation,
evapotranspiration, and/or movement into the ground. Surface inundation or saturation may occur
perennially, seasonally, or over multi-year cycles depending on the location, climate, size, and substrate
type. These wetlands perform then entire suites of functions typically associated with wetlands, but are
particularly important as seasonal refugia and breeding areas in dry habitats. Cumulatively, they
contribute to groundwater recharge and attenuation of surface runoff, thus reducing the impact of
excessive flow to downstream streams, lentic waterbodies and coastal environments, and fostering
improved water quality.
Successful assessment of wadeable streams over the past five years combined with the development of
new assessment tools, such as the California Rapid Assessment Method (CRAM; Collins et al. 2007)
provide an opportunity for Regional Boards to begin focusing on assessment of other water body types.
The San Diego, Santa Ana, and Los Angeles Regional Water Quality Control Boards have determined that
evaluation of the extent and condition of depressional wetlands will be a priority for the next several
years as a new element of the cooperative regional monitoring and assessment in southern California.
Depressional wetlands are of particular interest since they are the most abundant wetland type, are
subject to ongoing impacts, and are seldom systematically monitored. This study will be the first-ever
systematic condition assessment of southern California depressional wetlands, in addition, this project

3
will help expand the science of depressional wetland assessment by developing a study design and
indicators that could be adopted or modified for other regions of the State. This study will be
conducted on a region-wide basis for one year, with the anticipation that that the monitoring will be
continued if the Water Boards decide to implement this plan over time.
Monitoring Questions
The depressional wetland assessment will address the following questions of importance to regulatory
agencies and regulated communities, and public:
1. What is the extent and distribution of depressional wetlands in Southern California?
2. What is the condition of depressional wetlands in Southern California?
3. What are the major stressors affecting depressional wetland condition in Southern California?
The first question involves mapping the location and distribution of depressional wetlands. In addition
to providing an initial estimate of extent, the wetland map establishes the sample frame from which to
select sampling sites for the condition assessment (question #2) and for future status and trends
assessment. The second question addresses the condition of depressional wetlands using an indicator
of general wetland condition or health, and a set of more intensive indicators to address the hydrologic,
water quality, and habitat conditions within the wetlands. The third question will involve measurements
of sediment chemistry and toxicity, as well as measurements of potential stressors in the surrounding
landscape (e.g. agriculture, flow diversions, industrial activities). The intensive indicators sampled as
part of the condition assessment will be used to investigate potential stressor-response relationships.
Where thresholds exist, they can be used to assess the importance of the stressor. Where they don’t
exist, general distributions of the data can be used to infer relative risk due to individual stressors (Van
Sickle et al. 2006). This component requires no additional sampling, but rather a more thorough analysis
of the data.
III. Study Methods and Materials
III.a. Monitoring Design
The project has the dual goals of developing and testing new assessment tools for depressional wetlands
and implementing an ambient assessment of southern California depressional wetlands. It includes
elements of mapping, rapid condition assessment (using CRAM), and intensive assessment using more
detailed indicators of wetland condition (e.g. algae, invertebrates) and stressors (e.g. sediment
chemistry and toxicity).
Monitoring site selection is an iterative process, where a subset of the sites identified through
characterizing the extent and distribution of depressional wetland will be used for the assessment of
4
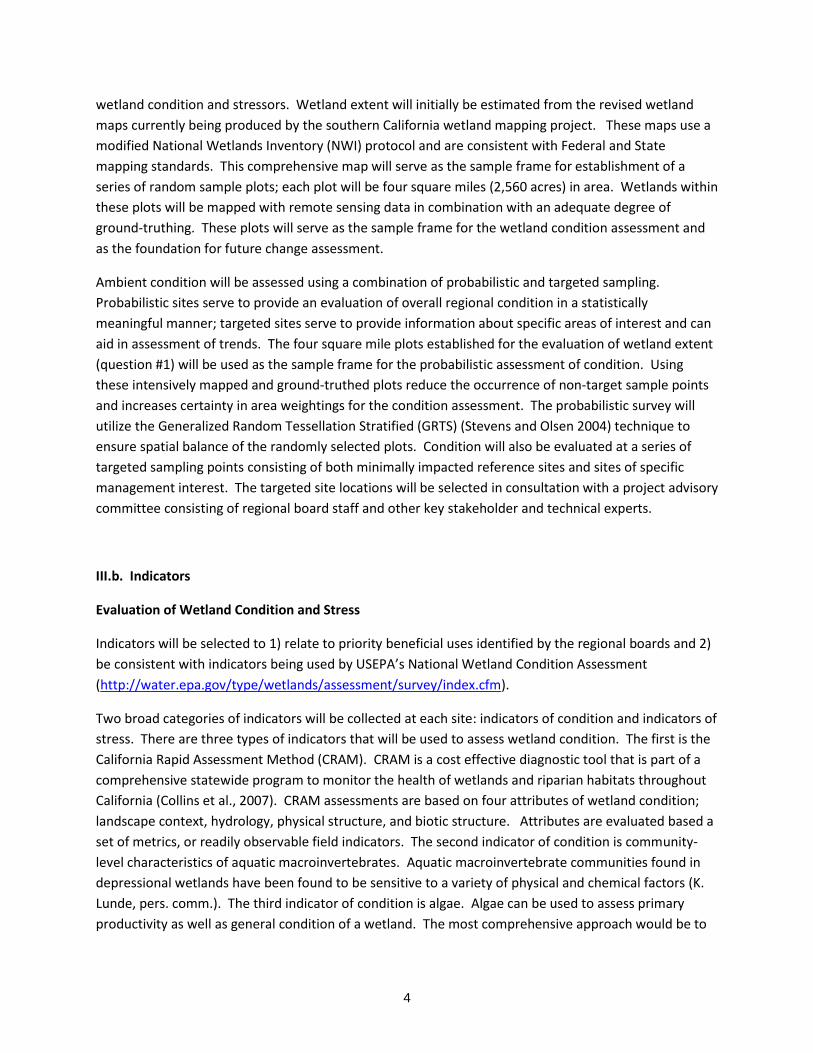
wetland condition and stressors. Wetland extent will initially be estimated from the revised wetland
maps currently being produced by the southern California wetland mapping project. These maps use a
modified National Wetlands Inventory (NWI) protocol and are consistent with Federal and State
mapping standards. This comprehensive map will serve as the sample frame for establishment of a
series of random sample plots; each plot will be four square miles (2,560 acres) in area. Wetlands within
these plots will be mapped with remote sensing data in combination with an adequate degree of
ground-truthing. These plots will serve as the sample frame for the wetland condition assessment and
as the foundation for future change assessment.
Ambient condition will be assessed using a combination of probabilistic and targeted sampling.
Probabilistic sites serve to provide an evaluation of overall regional condition in a statistically
meaningful manner; targeted sites serve to provide information about specific areas of interest and can
aid in assessment of trends. The four square mile plots established for the evaluation of wetland extent
(question #1) will be used as the sample frame for the probabilistic assessment of condition. Using
these intensively mapped and ground-truthed plots reduce the occurrence of non-target sample points
and increases certainty in area weightings for the condition assessment. The probabilistic survey will
utilize the Generalized Random Tessellation Stratified (GRTS) (Stevens and Olsen 2004) technique to
ensure spatial balance of the randomly selected plots. Condition will also be evaluated at a series of
targeted sampling points consisting of both minimally impacted reference sites and sites of specific
management interest. The targeted site locations will be selected in consultation with a project advisory
committee consisting of regional board staff and other key stakeholder and technical experts.
III.b. Indicators
Evaluation of Wetland Condition and Stress
Indicators will be selected to 1) relate to priority beneficial uses identified by the regional boards and 2)
be consistent with indicators being used by USEPA’s National Wetland Condition Assessment
(http://water.epa.gov/type/wetlands/assessment/survey/index.cfm).
Two broad categories of indicators will be collected at each site: indicators of condition and indicators of
stress. There are three types of indicators that will be used to assess wetland condition. The first is the
California Rapid Assessment Method (CRAM). CRAM is a cost effective diagnostic tool that is part of a
comprehensive statewide program to monitor the health of wetlands and riparian habitats throughout
California (Collins et al., 2007). CRAM assessments are based on four attributes of wetland condition;
landscape context, hydrology, physical structure, and biotic structure. Attributes are evaluated based a
set of metrics, or readily observable field indicators. The second indicator of condition is community-
level characteristics of aquatic macroinvertebrates. Aquatic macroinvertebrate communities found in
depressional wetlands have been found to be sensitive to a variety of physical and chemical factors (K.
Lunde, pers. comm.). The third indicator of condition is algae. Algae can be used to assess primary
productivity as well as general condition of a wetland. The most comprehensive approach would be to
5
sample both benthic and planktonic community composition for diatoms, soft-bodied algae, and
cyanobacteria, including microalgae and macroalgae, and sample for biomass and algal toxins.
There are four types of indicators that will be used to assess stress. The first of these is sediment
toxicity. The 10-day chronic test (EPA 2000) with the epifaunal amphipod Hyalella azteca will be used to
assess the toxicity of the wetland sediments. The second indicator of stress is sediment chemistry.
Measures of sediment chemistry will include metals, nutrients, total organic carbon, and pesticides. The
samples for chemistry will be held for analysis, pending the outcome of the sediment toxicity test
results. The third set of stress indicators are hydrology (water inputs and outputs) and hydroperiod
(magnitude, duration, and extent of inundation or saturation). Evaluation of hydrology and hydroperiod
can provide insight to wetland health/condition. These factors will affect the wetland’s plant and animal
community structure and growth and thus can be used to both explain and potentially predict wetland
condition scores. The fourth set of stress indicators are landscape-scale stressors. Factors such as
surrounding land use and land cover, proximity to other wetlands, and alterations in overland flow
pathways can affect the ability of a wetland to support characteristic flora and fauna. Features of the
surrounding landscape may alternatively serve to explain or predict wetland condition.
III.c. Data Analysis and Assessment
Each of the indicators has a set of thresholds to evaluate the collected data, in order to characterize the
level of disturbance at a given wetland. Each indicator also has a set of quality assurance (QA)
procedures which must be met in order for the data to be acceptable. These procedures may exist as a
set of standardized benchmarks for laboratory performance (e.g., for sediment chemistry and toxicity
analysis), as periodic field audits (e.g., for CRAM), or as required demonstration of competence as part
of a training course (e.g., for landscape-scale stressors).
CRAM attributes are evaluated based a set of metrics, or readily observable field indicators. Each metric
is evaluated based on a standardized set of mutually exclusive descriptions representing a full range of
possible condition. Metrics are scored based on narrative descriptions, quantitative measures, or
diagrams (depending on the metric). Scores range from 3 to 12 for each metric; metric scores can be
aggregated to overall attribute scores and attribute scores aggregated to an overall index score based
on simple combination rules. Attribute and index scores are expressed as percent possible, ranging
from 25 (lowest possible) to a maximum of 100. Details of CRAM assessments can be found in the
CRAM User’s Manual (Collins et al. 2008) or on the CRAM web site at www.cramwetlands.org.
Part of this study will be used to help create biological metrics or indices for macroinvertebrates and
algae in depressional wetlands, similar to those developed for streams [e.g. macroinvertebrate and
periphyton Indices of Biological Integrity (IBI)]. Quality assurance procedures for macroinvertebrates
and algae include re-analysis on a subset of samples in order to evaluate precision in identification and
enumeration, and creating sample vouchers in order to conduct sorting and identification audits.

6
Toxicity will be assessed with unpaired one-way Student t-test. Samples will be considered toxic if they
are significantly different and <80% of the control value. Sediment collected with the test organisms will
be used as a negative control. A water-only Cu reference toxicant test will be conducted as a positive
control.
Sediment chemistry measurements will be assessed by comparing the values to freshwater Probable
Effects Concentrations (MacDonald et al. 2000), or published LC50 values (concentrations that cause a
50% reduction in survival) for pyrethroid pesticides (Amweg et al. 2005).
The range in hydrologic alterations will be assessed by comparing data distributions at the probabilistic
sampling sites to the reference sites. Hydrologic alteration measures will be compared to the habitat
condition measures as part of the stressor-response investigation.
Lansdcape-scale stressors will be assessed by applying the approach used by SWAMP’s Reference
Condition Monitoring Program (Ode and Schiff 2009), modified for depressional wetlands. This
approach was designed to characterize natural and stressor gradients relating to biological condition in
streams, at both local and watershed scales. Spatial data layers will be analyzed to look for gradients
and will be compared to measures of wetland function/condition.
III.d. Data Collection and Frequency of Sampling:
The 2011 field season will be used to test protocols and conduct a pilot assessment on a small number
of sites in order to determine efficacy of various indicators. Some sites will be sampled repeatedly in
2011, in order to determine the most appropriate index period for both macroinvertebrates and algae.
Results of the pilot assessment will be used to design the full ambient assessment program, which will
begin in 2012. Elements of the ambient assessment, including method refinement, index period,
sample size, and stratification will be determined in coordination with the technical workgroup following
the 2011 pilot phase. The work plan will be updated to reflect the second phase of the project once it is
developed. .
CRAM
General condition of the vegetated depressional wetland area will be evaluated using the depressional
module of the California Rapid Assessment Method (CRAM; Collins et al. 2008) as modified based on
investigations during the 2011 pilot phase. CRAM assessments are based on four attributes of wetland
condition; landscape context, hydrology, physical structure, and biotic structure. Attributes are
evaluated based a set of metrics, or readily observable field indicators. CRAM assessment areas (AAs)
will be established at each study site according to the guidance provided in the CRAM User’s Manual
(Collins et al. 2008). Some sites may require multiple CRAM AAs depending on the size of the wetland.
Each metric will be evaluated for each AA based on a standardized set of mutually exclusive descriptions
representing a full range of possible condition. Metrics are scored based on narrative descriptions,
quantitative measures, or diagrams (depending on the metric).

7
MACROINVERTEBRATES
The SWAMP program currently has accepted sampling protocols for streams, but not depressional
wetlands. The stream protocols can be used to inform decisions regarding sampling in wetlands.
However, because there are no standard SWAMP protocols for sampling macroinvertebrates in
depressional wetlands, these details will be determined by the technical workgroup. Our preliminary
recommendation for a sampling approach includes a multi-habitat design, including an emergent
vegetation zone, an open (no vegetation) emergent zone, a surface vegetation zone, and a surface
vegetation zone. All of these zones will be restricted to the 1.5 m depth nearshore area. Sampling will
be conducted using dip (sweep) nets with a standardized and repeatable protocol based on the urban
IBI (K. Lunde, pers. comm.)
ALGAE
This study will be used to help create biological metrics or indices for algae in depressional wetlands,
similar to the SWAMP-approved periphyton IBI developed for streams. GIS will be used to delineate the
perimeter of each wetland and to draw, starting at a random spot, 10 points equidistant from one
another, along the wetland perimeter. In the field, the 10 points will be identified and a transect starting
at the wetland edge will be placed perpendicularly to the edge associated with each point. The
transects will extend from each point into the wetland, up to a depth of 1m, or halfway across the
wetland, for shallow water bodies. For sampling the soft sediment benthic substrate, a clear 1”
diameter acrylic tube with a sharpened edge will be used as a corer to obtain a series of 20-mm cores,
off of which the top 5mm will be used for isolating benthic algal specimens. One “representative”
sampling spot will be identified along each of the transects, that falls within a depth range of 0.25 to
0.75 meters deep. All 10 samples will be combined into a “composite”, which will then be subsampled
for taxonomic identification of both the diatom and soft-bodied/cyano assemblages, as well as for a
benthic algae toxin assay.
Phytoplankton will be sampled by immersing a 200 mL sampler attached to a pole into the water in the
center of each of the 10 transects, at a fixed depth, for a total of at least 1.5 L of composite sample.
Final volume of the composite will be measured with a graduated cylinder in order to derive
quantitative information about phytoplankton abundance. Aliquots of known volume will be removed
from the composite for sampling of suspended biomass and presence of algae toxins in the water
column. The remaining composite will be concentrated by filtration or settling (e.g., Wetzel and Likens
1991, APHA 1998) to facilitate determination of taxonomic composition.
An estimation of macroalgal percent cover will be carried out via point-intercept assessment of
presence/absence of macroalgae at objectively determined locations within each wetland. Floating
mats, filaments and masses suspended in the water column, and algal mats on the wetland bottom
(both true algae and cyanobacteria) will all be included as “macroalgae” for assessment purposes. Along
each of the transects, at 50-cm intervals starting from the point on the wetland edge, the presence or
absence of macroalgae will be scored. The number of sampled points will be tallied as will the number
of points at which macroalgae was intercepted (i.e., was present). The percent cover will be calculated

8
as the percent of assessed points that had macroalgae present. In addition to this, a visual estimate of
floating macroalgae (on the water’s surface) for the wetland at large will be made.
The purpose of the qualitative macroalgae sample (i.e., floating mats, filaments and masses suspended
in the water column, and algal mats on the wetland bottom (both true algae and cyanobacteria)) is to
capture the taxonomic diversity of this assemblage. This will facilitate taxonomic determination of the
species in the quantitative sample, as well as help establish the presence of indicator and toxin-
producing taxa in the wetland. Specimens from each visually distinct taxon observed in the wetland will
be collected and composited into a large Whirlpak bag for subsequent identification by a taxonomist. An
attempt will be made to be as exhaustive as possible in sampling the various taxa present.
SEDIMENT CHEMISTRY & TOXICITY
One composite sediment sample will be collected from each site at the hydrologic point of entry into the
wetland. This will be identified based on best professional judgment of where fine-grained sediments
will most likely first settle upon entry. At this location, water column characteristics will be measured
before sediment collection, and will include water column depth, physiochemical parameters (dissolved
oxygen, pH, temperature, conductivity).
Sediment samples will be collected with a Ponar grab sampler or shovel, depending on water depth.
The top 8 cm of sediment will be collected from each grab using a plastic scoop. The sediment from
multiple grabs will be homogenized before being distributed to containers for sediment chemistry or
toxicity analysis.
Samples for trace metals will be analyzed by Inductively Coupled Plasma Mass Spectrometry (ICPMS)
using EPA Method 6020m. Samples for organic constituents will be analyzed by Gas
Chromatography/Mass Spectrometry (GC/MS) using EPA Method 8270c. Total organic carbon
concentrations will be determined by EPA Method 415.1. Quality assurance procedures will include
analysis of field replicates, equipment blanks, method blanks, matrix spikes, and reference materials,
per SWAMP QAPP protocols.
Toxicity testing will be conducted using the Hyalella azteca 10-day survival test following procedures
outlined in USEPA 2000.
HYDROLOGY / HYDROPERIOD
Two types of hydrology measurements will be taken. One set of hydrology measurements are made as
part of the CRAM assessment, including determining water source, entrenchment (hydrologic
connectivity) and channel stability. The source of the water entering the wetlands will be investigated
through consulting maps, wetland managers, and websites (including the County of San Diego’s
Watershed Protection Program site, and the Project Clean Water site). Hydrologic connectivity and
channel stability will be measured on site using the methods specified in the CRAM Field Book.
The second set of hydrology measures will be will be assessed through both direct and indirect
measures. Indirect measures include catchment imperviousness and presences and height of inlet and

9
outlets to the wetland, which can affect the frequency, extent, and duration of inundation. A subset of
wetlands will be directly monitored. Direct monitoring will consist of installing a rebar stake in the
center of the wetland and attaching a pressure transducer or multi-probe data sonde. Weekly measures
will be conducted during key index periods to quantify water depth, extent of inundation (areal
coverage), salinity, specific conductance, pH, temperature, DO, and turbidity. Data distributions at the
probabilistic sampling sites will be compared to the reference sites to estimate the ranges of hydrologic
alteration. Hydrologic alteration measures will be compared to the habitat condition measures as part
of the stressor-response investigation.
LANDSCAPE STRESSORS
Local and large-scale landscape units are identified for each wetland, at multiple spatial scales. For each
unit, a large number of metrics are calculated to characterize the natural gradients and anthropogenic
stressors affecting the wetland. These metrics are based on several sources of spatial data, including:
geology (type and mineral content), ecoregion, climate, land cover, timber harvesting, wildfires,
population density, mining activity, grazing, pesticide use, invasive species, and road or railroad density.
III.e. Spatial and Temporal Scale
This study will provide a statistically valid representation of the overall regional condition based on
probabilistically selected sites. This study will also include targeted locations, consisting of reference
sites (which represent the least impacted sites in the region and will provide a benchmark against which
the condition at other sites can be gauged) and sites of specific management interest (selected in
coordination with the project’s technical advisory committee; these sites may be restoration sites, sites
subject to specific stressors or interest, or regionally significant sites). The ability of this program to
answer questions regarding trends in wetland condition will depend on the availability of funding for
continued sampling beyond 2012.
III.f. Data Management
Data generated from this project will reside on SCCWRP’s data exchange servers, in a SWAMP-
compatible database for available data fields. The data on these servers are backed up twice per day.
Access to the database will be available via the Wetlands Portal of the State Water Resources Control
Boards My Water Quality Web site. Data may also be submitted to CEDEN if the system is modified to
be able to accept the type of data compiled by this study.

10
IV. Coordination and Review Strategy
SCCWRP scientists will serve as the project manager, and will be responsible for producing the study
work plan, coordinating field collection and laboratory analysis activities, data management, and report
preparation. The project’s technical advisory committee (TAC) will assist in the production of the work
plan, and will be responsible for data review and final report review. The TAC is currently made up of
members from the State Water Resources Control Board, the San Diego, Los Angeles and Santa Ana
Regional Water Quality Control Boards, California Department of Fish and Game, US Army Corps of
Engineers, US Fish and Wildlife Service, US Forest Service, and UC Berkeley.
V. Quality Assurance
This document should serve as a general framework for project development and implementation.
More detailed Standard Operating Procedures, Quality Assurance Project Plans, and Data Management
Plans will be developed as companion documents. SWAMP quality assurance practices will be followed
if possible.
VI. Reporting
SCCWRP staff will be responsible for producing the final study reports. A technical report will be
produced and submitted to all funding agencies, and a manuscript will be produced for submission to a
scientific journal (e.g., Journal of American Water Resources Association). Sampling for the project is
expected to be conducted in spring/summer 2012, followed by laboratory analysis, quality assurance
screening, and data interpretation. A first draft of the report will be produced in summer 2013, and a
final report in fall 2013. Data for the project will be made available to the public through the Wetlands
Portal, following quality assurance screening.
VII. Project Schedule
Initial implementation of this program will be a two year process. Preliminary work to refine indicators
will occur in spring 2011. Sample draw and preparation of the final methodology will be conducted in
winter 2011/2012. This will provide sufficient time to use what lessons were learned during the
preliminary sampling and improve the full-scale sampling. The full-scale sampling will occur in
spring/summer 2012. Laboratory analysis should take approximately 6 months. Compiling data,
examining results, and making our assessments should require approximately three months (spring
2013). A written first draft report should be completed by summer 2013. Additional
sampling/implementation will be contingent on ongoing funding.
The schedule for the proposed project is as follows:

11
2011 2012 2013
3 4 5 6 7 8 9 10 11 12 1 2 3 4 5 6 7 8 9 10 11 12 1 2 3 4 5 6 7 8 9
Convene
meetings of
technical
advisory
committee
Complete
plan for
preliminary
sampling
Preliminary
sampling to
refine
indicators
Analysis of
preliminary
sampling
Sample
draw and
method
refinement
Final
sampling
Laboratory
analysis
Data
compilation
and
analysis
First draft
Final draft
.
12
References
American Public Health Association (APHA). 1998. Standard Methods for the Evaluation of Water and
Wastewater. 20th ed. Washington, D.C.: American Public Health Association.
Amweg, E.L., D.P. Weston and N.M. Ureda. 2005. Use and toxicity of pyrethroid pesticides in the Central
Valley, California, USA. Environmental Toxicology and Chemistry 24:966-972.
Collins, J.N., E.D. Stein, M. Sutula, R. Clark, A.E. Fetscher, L. Grenier, C. Grosso, and A. Wiskind. 2007.
California Rapid Assessment Method (CRAM) for Wetlands and Riparian Areas.
Corbet, PS. 1999. Dragonflies: Behavior and Ecology of Odonata. Comstock Publishing Associates. Ithaca, NY: Cornell University Press. Cowardin L.M et al. 1979. Classification of wetlands and deepwater habitats of the United States. FWS/OBS-79/31 Dahl, T.E. and M.T. Bergeson. 2009. Technical procedures for conducting status and trends of the Nation’s wetlands. U.S. Fish and Wildlife Service, Division of Habitat and Resource Conservation, Washington, D.C. Fetscher AE, L Busse, PR Ode. 2009 Standard operating procedures for collecting stream algae samples
and associated physical habitat and chemical data for ambient bioassessment in California.
Bioassessment SOP 002. Prepared for the California State Water Resources Control Board.
MacDonald, D.D., C.G. Ingersol and T.A. Berger. 2000. Development and evaluation of consensus-based
sediment quality guidelines for freshwater systems. Archives of Environmental Contamination and
Toxicology 39:20-31.
Minnesota Pollution Control Agency Biological Monitoring Program. 2010. Standard Operating Procedure: Macroinvertebrate Community Sampling Protocol for Depressional Wetland Monitoring Sites. Ode, P. and K. Schiff. 2009. Recommendations for the development of a reference condition
management program (RCMP) to support biological assessment in California. Southern California
Coastal Water Research Project. Technical Report #581.
State Water Resources Control Board. 2000. Proposal for a comprehensive ambient surface water
quality monitoring program. Report to the Legislature, 37pp.
Schneider DW, Frost TM. 1996. Habitat duration and community structure in temporary ponds. J North
Am Benthol Soc 15:64-86
Stevens, D. L., Jr. and A. R. Olsen. 2004. Spatially-balanced sampling of natural resources. Journal of the
American Statistical Association 99:262–77.
Sutula, M., J.N. Collins, R. Clark, C. Roberts, E. D. Stein, C. Grosso, A. Wiskind, C. Solek, M. May, K.
O’Connor, A.E. Fetscher, J. L. Grenier, S. Pearce, A. Robinson, C. Clark, K. Rey, S. Morrissette, A. Eicher, R.

13
Pasquinelli, and K. Ritter. 2008. California’s Wetland Demonstration Program Pilot. Southern California
Coastal Water Research Project Technical Report #572.
U.S. EPA. 2002. Methods for Evaluating Wetland Condition: Developing an Invertebrate Index of Biological Integrity for Wetlands. Office of Water, U.S. Environmental Protection Agency, Washington, DC. EPA-822-R-02-019. U.S. EPA. 2000. Methods for measuring the toxicity and bioaccumulation of sediment-associated contaminants with freshwater invertebrates (2nd edition). EPA 600/R-99/064. USEPA. Washington, D.C. U.S. Fish and Wildlife Service. 1995. Photointerpretation conventions for the National Wetlands Inventory. US. Fish and Wildlife Service, St. Petersburg, FL. U.S. Fish and Wildlife Service 1997. A System/or Mapping Riparian Areas in the Western United States Van Sickle, J., J.L. Stoddard, S.G. Paulsen and A.R. Olsen. 2006. Using relative risk of aquatic stressors at a
regional scale. Environmental Management 38:1020-1030.
Wetzel RG and GE Likens. 1991. Limnological Analyses, 2nd ed. New York: Springer Verlag.
Wiggins GB, Mackay RJ, Smith IM. 1980. Evolutionary and ecological strategies of animals in annual temporary pools. Arch Hydrobiol (Suppl 58)1/2:97-206.

14
Appendix A – Potential Analytes and Analytic Methods for Sediment Chemistry Analysis
Typ
e
Analyte
Laboratory Project Quantitation Limit (units, wet or dry weight, ng/g unless otherwise stated)
Analytical Method and Achievable Laboratory
Limits (units, wet or dry weight, ng/g unless
otherwise stated)
Ph
ysio
-ch
emic
al
pH Field NA
SM4500H+B NA
Conductance Same 10 mhos SM2510B NA
DO Same 0.1 mg/L SM4500OG 0.1 mg/L
Temperature Same -5 o C SM2550B -5 o C
Bu
lk S
edim
ent
Ch
arac
teri
stic
s Ammonia CRG Lab
0.01 mg/kg SM 4500-NH3F
0.01 mg/kg
Sediment grain size CRG Lab 0.1% Plumb 1981 0.1 %
Total organic carbon CRG Lab 0.01 mg/kg EPA 9060 0.01 mg/kg
Trac
e M
etal
s
Antimony CRG Lab
0.025 mg/kg EPA 6020
0.025 mg/kg
Arsenic CRG Lab 0.025 mg/kg EPA 6020 0.025 mg/kg
Barium CRG Lab 0.025 mg/kg EPA 6020 0.025 mg/kg
Beryllium CRG Lab 0.025 mg/kg EPA 6020 0.025 mg/kg
Bismuth CRG Lab 0.5 mg/kg EPA 6020 0.5 mg/kg
Boron CRG Lab 0.025 mg/k EPA 6020 0.025 mg/k
Cadmium CRG Lab 0.025 mg/kg EPA 6020 0.025 mg/kg
Calcium CRG Lab 1 mg/kg EPA 6020 1 mg/kg
Cesium CRG Lab 0.05 mg/kg EPA 6020 0.05 mg/kg
Chromium CRG Lab 0.025 mg/kg EPA 6020 0.025 mg/kg
Cobalt CRG Lab 0.025 mg/kg EPA 6020 0.025 mg/kg
Copper CRG Lab 0.025 mg/kg EPA 6020 0.025 mg/kg
Iodine CRG Lab 0.05 mg/kg EPA 6020 0.05 mg/kg
Iron CRG Lab 1 mg/kg EPA 6020 1 mg/kg
Lead CRG Lab 0.025 mg/kg EPA 6020 0.025 mg/kg
Lithium CRG Lab 0.05 mg/kg EPA 6020 0.05 mg/kg
Magnesium CRG Lab 1 mg/kg EPA 6020 1 mg/kg

15
Typ
e
Analyte
Laboratory Project Quantitation Limit (units, wet or dry weight, ng/g unless otherwise stated)
Analytical Method and Achievable Laboratory
Limits (units, wet or dry weight, ng/g unless
otherwise stated)
Manganese CRG Lab
0.025 mg/kg
EPA 6020
0.025 mg/kg
Mercury CRG Lab 0.005 mg/kg EPA 6020 0.005 mg/kg
Molybdenum CRG Lab 0.025 mg/kg EPA 6020 0.025 mg/kg
Nickel CRG Lab 0.025 mg/kg EPA 6020 0.025 mg/kg
Phosphorus CRG Lab 0.5 mg/kg EPA 6020 0.5 mg/kg
Potassium CRG Lab 1 mg/kg EPA 6020 1 mg/kg
Selenium CRG Lab 0.025 mg/kg EPA 6020 0.025 mg/kg
Silicon CRG Lab 0.1 1 mg/kg EPA 6020 0.1 1 mg/kg
Silver CRG Lab 0.025 mg/kg EPA 6020 0.025 mg/kg
Sodium CRG Lab 1 mg/kg EPA 6020 1 mg/kg
Strontium CRG Lab 0.025 mg/kg EPA 6020 0.025 mg/kg
Thallium CRG Lab 0.025 mg/kg EPA 6020 0.025 mg/kg
Tin CRG Lab 0.025 mg/kg EPA 6020 0.025 mg/kg
Titanium CRG Lab 0.025 mg/kg EPA 6020 0.025 mg/kg
Vanadium CRG Lab 0.025 mg/kg EPA 6020 0.025 mg/kg
Zinc CRG Lab 0.025 mg/kg EPA 6020 0.025 mg/kg
Po
lyar
om
atic
hyd
roca
rbo
ns
1-Methylphenanthrene
CRG Lab 1 µg/kg EPA8270
1 µg/kg
2,3,5-Trimethylnaphthalene CRG Lab 1 µg/kg EPA8270 1 µg/kg
2,6-Dimethylnaphthalene CRG Lab 1 µg/kg EPA8270 1 µg/kg
2-Methylnaphthalene CRG Lab 1 µg/kg EPA8270 1 µg/kg
Acenaphthene CRG Lab 1 µg/kg EPA8270 1 µg/kg
Acenaphthylene CRG Lab 1 µg/kg EPA8270 1 µg/kg
Anthracene CRG Lab 1 µg/kg EPA8270 1 µg/kg
Benz[a]anthracene CRG Lab 1 µg/kg EPA8270 1 µg/kg
Benzo[a]pyrene CRG Lab 1 µg/kg EPA8270 1 µg/kg
Benzo[b]fluoranthene CRG Lab 1 µg/kg EPA8270 1 µg/kg
Benzo[e]pyrene CRG Lab 1 µg/kg EPA8270 1 µg/kg

16
Typ
e
Analyte
Laboratory Project Quantitation Limit (units, wet or dry weight, ng/g unless otherwise stated)
Analytical Method and Achievable Laboratory
Limits (units, wet or dry weight, ng/g unless
otherwise stated)
Benzo[g,h,i]perylene CRG Lab 1 µg/kg EPA8270 1 µg/kg
Benzo[k]fluoranthene CRG Lab 1 µg/kg EPA8270 1 µg/kg
Biphenyl CRG Lab 1 µg/kg EPA8270 1 µg/kg
Chrysene CRG Lab 1 µg/kg EPA8270 1 µg/kg
Dibenz[a,h]anthracene CRG Lab 1 µg/kg EPA8270 1 µg/kg
Fluoranthene CRG Lab 1 µg/kg EPA8270 1 µg/kg
Fluorene CRG Lab 1 µg/kg EPA8270 1 µg/kg
Indeno[1,2,3-c,d]pyrene CRG Lab 1 µg/kg EPA8270 1 µg/kg
Naphthalene CRG Lab 1 µg/kg EPA8270 1 µg/kg
Perylene CRG Lab 1 µg/kg EPA8270 1 µg/kg
Phenanthrene CRG Lab 1 µg/kg EPA8270 1 µg/kg
Pyrene
CRG Lab 1 µg/kg EPA8270 1 µg/kg
Org
ano
chlo
rin
e P
esti
cid
es
Aldrin
CRG Lab 1 µg/kg EPA 8270 1 µg/kg
a-Chlordane CRG Lab 1 µg/kg EPA 8270 1 µg/kg
trans-Chlordane CRG Lab 1 µg/kg EPA 8270 1 µg/kg
Dacthal CRG Lab 1 µg/kg EPA 8270 1 µg/kg
2,4-DDD CRG Lab 1 µg/kg EPA 8270 1 µg/kg
4,4-DDD CRG Lab 1 µg/kg EPA 8270 1 µg/kg
2,4-DDE CRG Lab 1 µg/kg EPA 8270 1 µg/kg
4,4-DDE CRG Lab 1 µg/kg EPA 8270 1 µg/kg
2,4-DDT CRG Lab 1 µg/kg EPA 8270 1 µg/kg
4,4-DDT CRG Lab 1 µg/kg EPA 8270 1 µg/kg
Dieldrin CRG Lab 1 µg/kg EPA 8270 1 µg/kg
Endosulfan sulfate CRG Lab 1 µg/kg EPA 8270 1 µg/kg
Endosulfan I CRG Lab 1 µg/kg EPA 8270 1 µg/kg
Endosulfan II CRG Lab 1 µg/kg EPA 8270 1 µg/kg
Endrin CRG Lab 1 µg/kg EPA 8270 1 µg/kg

17
Typ
e
Analyte
Laboratory Project Quantitation Limit (units, wet or dry weight, ng/g unless otherwise stated)
Analytical Method and Achievable Laboratory
Limits (units, wet or dry weight, ng/g unless
otherwise stated)
Heptachlor CRG Lab 1 µg/kg EPA 8270 1 µg/kg
Heptachlor Epoxide CRG Lab 1 µg/kg EPA 8270 1 µg/kg
Methoxychlor CRG Lab 1 µg/kg EPA 8270 1 µg/kg
Mirex CRG Lab 1 µg/kg EPA 8270 1 µg/kg
Oxychlordane
CRG Lab 1 µg/kg EPA 8270 1 µg/kg
Toxaphene CRG Lab 1 µg/kg EPA 8270 1 µg/kg
Org
ano
ph
osp
ho
rus
Pes
tici
des
Azinphos-methyl
CRG Lab 10 µg/kg EPA 8270 10 µg/kg
Bolstar CRG Lab 10 µg/kg EPA 8270 10 µg/kg
Chlorpyrifos CRG Lab 5 µg/kg EPA 8270 5 µg/kg
Demeton CRG Lab 10 µg/kg EPA 8270 10 µg/kg
Diazinon CRG Lab 5 µg/kg EPA 8270 5 µg/kg
Dichlorvos CRG Lab 10 µg/kg EPA 8270 10 µg/kg
Dimethoate CRG Lab 5 µg/kg EPA 8270 5 µg/kg
Disulfoton CRG Lab 10 µg/kg EPA 8270 10 µg/kg
Ethoprop CRG Lab 10 µg/kg EPA 8270 10 µg/kg
Ethyl CRG Lab 10 µg/kg EPA 8270 10 µg/kg
Fencholorphos CRG Lab 10 µg/kg EPA 8270 10 µg/kg
Fensulfothion CRG Lab 10 µg/kg EPA 8270 10 µg/kg
Fenthion CRG Lab 10 µg/kg EPA 8270 10 µg/kg
Malathion CRG Lab 5 µg/kg EPA 8270 5 µg/kg
Merphos CRG Lab 10 µg/kg EPA 8270 10 µg/kg
Methamidophos CRG Lab 10 µg/kg EPA 8270 10 µg/kg
Methidathion CRG Lab 10 µg/kg EPA 8270 10 µg/kg
Methyl CRG Lab 10 µg/kg EPA 8270 10 µg/kg
Mevinphos CRG Lab 10 µg/kg EPA 8270 10 µg/kg
Phorate CRG Lab 10 µg/kg EPA 8270 10 µg/kg
Phosmet CRG Lab 10 µg/kg EPA 8270 10 µg/kg

18
Typ
e
Analyte
Laboratory Project Quantitation Limit (units, wet or dry weight, ng/g unless otherwise stated)
Analytical Method and Achievable Laboratory
Limits (units, wet or dry weight, ng/g unless
otherwise stated)
Methyl CRG Lab 10 µg/kg EPA 8270 10 µg/kg
Tetrachlorvinphos CRG Lab 10 µg/kg EPA 8270 10 µg/kg
Tokuthion CRG Lab 10 µg/kg EPA 8270 10 µg/kg
Trichloronate CRG Lab 10 µg/kg EPA 8270 10 µg/kg
Pyr
eth
roid
s
Allethrin CRG Lab 10 µg/kg EPA 625 10 µg/kg
Bifenthrin CRG Lab 10 µg/kg EPA 625 10 µg/kg
Cyfluthrin CRG Lab 10 µg/kg EPA 625 10 µg/kg
Cypermethrin CRG Lab 10 µg/kg EPA 625 10 µg/kg
Danitol CRG Lab 10 µg/kg EPA 625 10 µg/kg
Deltamethrin CRG Lab 10 µg/kg EPA 625 10 µg/kg
L-Cyhalothrin CRG Lab 10 µg/kg EPA 625 10 µg/kg
Permethrin CRG Lab 10 µg/kg EPA 625 10 µg/kg
Prallethrin CRG Lab 10 µg/kg EPA 625 10 µg/kg
*EPA, Method for Chemical Analysis of Water and Waste Water ** SM, Standard Methods for the Examination of Water and Waste Water