Dépositaire Central/Banque de Règlement (DC/BR) of UEMOA · The West African Economic and...
29
Dépositaire Central/Banque de Règlement (DC/BR) of UEMOA
-
Upload
phungtuyen -
Category
Documents
-
view
223 -
download
0
Transcript of Dépositaire Central/Banque de Règlement (DC/BR) of UEMOA · The West African Economic and...
Dépositaire Central/Banque de Règlement (DC/BR) of UEMOA
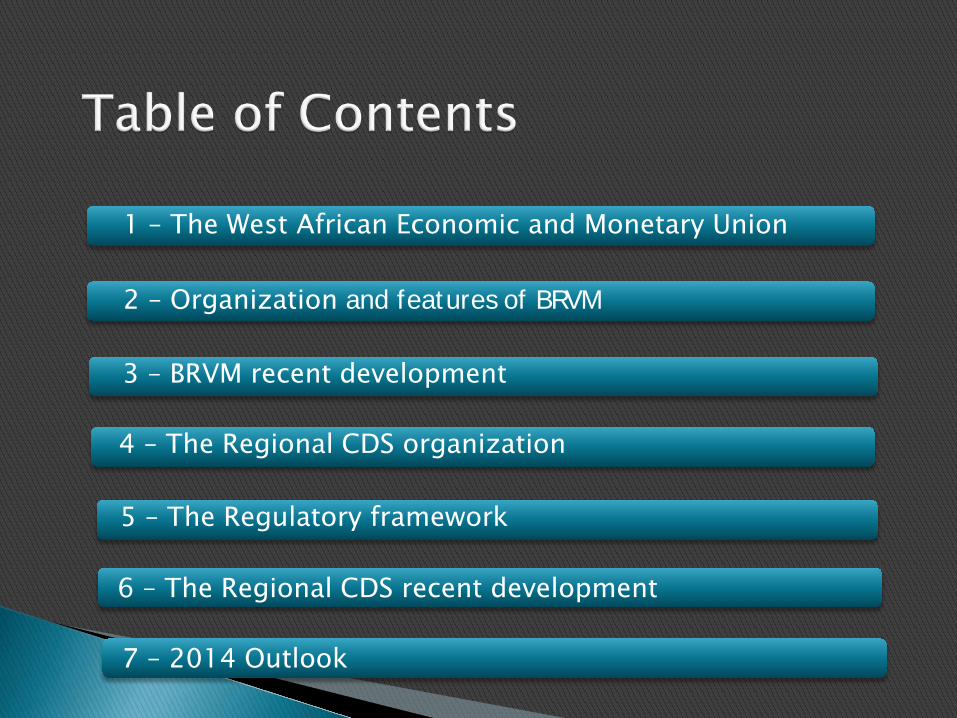
2 – Organization and features of BRVM
3 – BRVM recent development
4 – The Regional CDS organization
6 – The Regional CDS recent development
5 – The Regulatory framework
1 – The West African Economic and Monetary Union
7 – 2014 Outlook

1 – The West African Economic and Monetary Union
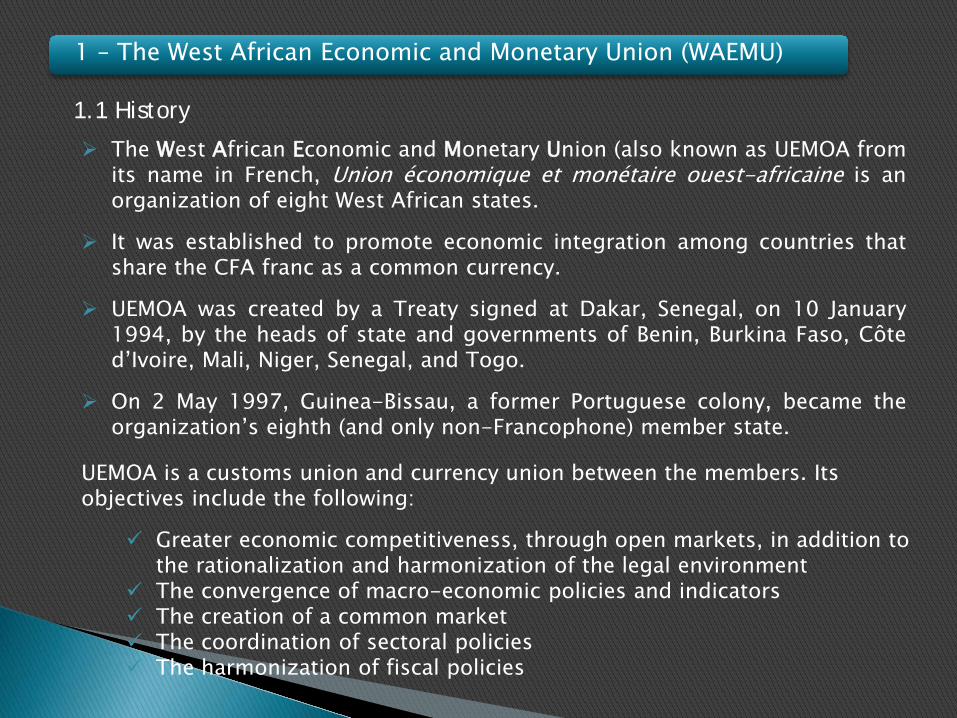
1.1 History
1 – The West African Economic and Monetary Union1 – The West African Economic and Monetary Union (WAEMU)
The West African Economic and Monetary Union (also known as UEMOA fromits name in French, Union économique et monétaire ouest-africaine is anorganization of eight West African states.
It was established to promote economic integration among countries thatshare the CFA franc as a common currency.
UEMOA was created by a Treaty signed at Dakar, Senegal, on 10 January1994, by the heads of state and governments of Benin, Burkina Faso, Côted’Ivoire, Mali, Niger, Senegal, and Togo.
On 2 May 1997, Guinea-Bissau, a former Portuguese colony, became theorganization’s eighth (and only non-Francophone) member state.
UEMOA is a customs union and currency union between the members. Its objectives include the following:
Greater economic competitiveness, through open markets, in addition to the rationalization and harmonization of the legal environment
The convergence of macro-economic policies and indicators The creation of a common market The coordination of sectoral policies The harmonization of fiscal policies

1 – The West African Economic and Monetary Union (WAEMU)
NigerMali
Burkina Faso
BeninPopulation: 9,0 million
GDP 2011 : 3444,303 Billion FCFA
GDP 2012 : 3762,684 Billion FCFA Investment 2012 : 772,665 Billion FCFA
Burkina FasoPopulation: 16,3 million
GDP 2011 : 4905,342 Billion FCFA
GDP 2012 : 5546,285 Billion FCFAInvestment 2012 : 1245,614 Billion FCFA
Côte d’IvoirePopulation : 22,7 million GDP 2011 : 11 359,822 Billion FCFA GDP 2012 : 12 460,064 Billion FCFA Investment 2012 : 1745,957 Billion FCFA
Guinea BissauPopulation : 1,5 million
GDP 2011 : 465,083 Billion FCFA
GDP 2012 : 482,635 Billion FCFA Investment 2012 : 35,420 Billion FCFA
MaliPopulation : 15,4 million GDP 2011 : 5 016,968 Billion FCFA GDP 2012 : 5 140,406 Billion FCFA Investment 2012 : 967,981 Billion FCFA
NigerPopulation : 15,7 million GDP 2011 : 3 004,395 Billion FCFA GDP 2012 : 3 567,416 Billion FCFA Investment 2012 : 1 693,842 Billion FCFA
Togo Population : 6,0 million
GDP 2011 : 1743,274 Billion FCFA
GDP 2012 : 1878,955 Billion FCFA Investment 2012 : 422,829 Billion FCFA
Senegal
Population : 12,8 million
GDP 2011 : 6 816,444 Billion FCFA
GDP 2012 : 7 225,049 Billion FCFA Investment 2012 : 2 195,806 Billion FCFA
WAEMU GDP : 40 063,494 Billion FCFA
1.1 WAEMU Key indicators (1/2)

1.1 WAEMU Key indicators (2/2)
7.53
11.09
24.92
0.97
10.28
7.13
14.45
3.76
- 5.00 10.00 15.00 20.00 25.00 30.00
Benin
Burkina Faso
Côte d'Ivoire
Guinea Bissau
Mali
Niger
Senegal
Togo
8,840,000
15,710,000
22,890,000
1,450,000
15,100,000
14,860,000
12,340,000
5,870,000
0 10,000,000 20,000,000
Benin
Burkina Faso
Côte d'Ivoire
Guinea Bissau
Mali
Niger
Senegal
Togo
110.9
37.1
417.9
8.8
147.6
946.9
237.2
41.1
0 500 1000
Benin
Burkina Faso
Côte d'Ivoire
Guinea Bissau
Mali
Niger
Senegal
Togo
Population
FDI 2010 (million USD)
1 – The West African Economic and Monetary Union1 – The West African Economic and Monetary Union

2 – Organization and features of BRVM
2 – Organization and features of BRVM
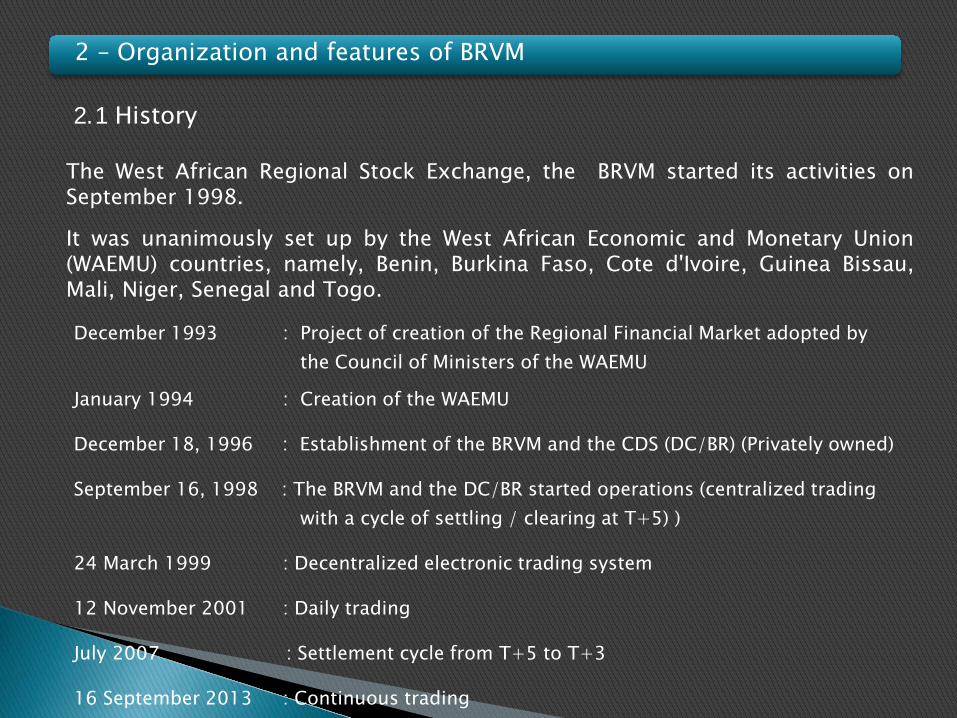
The West African Regional Stock Exchange, the BRVM started its activities onSeptember 1998.
It was unanimously set up by the West African Economic and Monetary Union(WAEMU) countries, namely, Benin, Burkina Faso, Cote d'Ivoire, Guinea Bissau,Mali, Niger, Senegal and Togo.
December 1993 : Project of creation of the Regional Financial Market adopted by the Council of Ministers of the WAEMU
January 1994 : Creation of the WAEMU
December 18, 1996 : Establishment of the BRVM and the CDS (DC/BR) (Privately owned)
September 16, 1998 : The BRVM and the DC/BR started operations (centralized trading with a cycle of settling / clearing at T+5) )
24 March 1999 : Decentralized electronic trading system
12 November 2001 : Daily trading
July 2007 : Settlement cycle from T+5 to T+3
16 September 2013 : Continuous trading
2.1 History
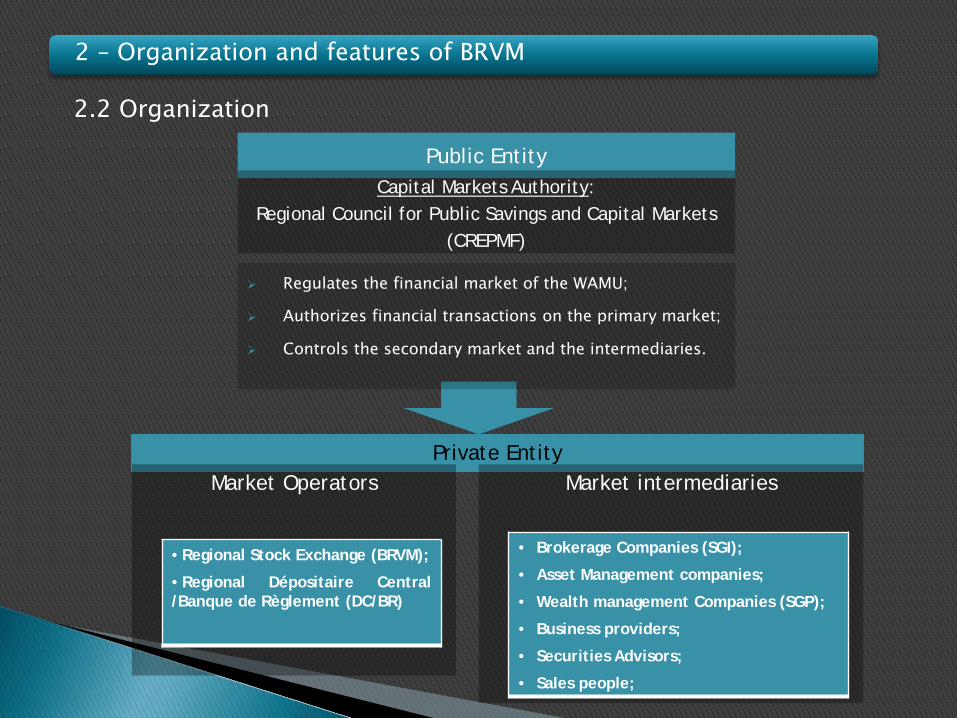
2 – Organization and features of BRVM
Public EntityCapital Markets Authority:
Regional Council for Public Savings and Capital Markets(CREPMF)
Private EntityMarket Operators
• Regional Stock Exchange (BRVM);
• Regional Dépositaire Central/Banque de Règlement (DC/BR)
Market intermediaries
• Brokerage Companies (SGI);
• Asset Management companies;
• Wealth management Companies (SGP);
• Business providers;
• Securities Advisors;
• Sales people;
Regulates the financial market of the WAMU;
Authorizes financial transactions on the primary market;
Controls the secondary market and the intermediaries.
2.2 Organization

Fully demutualized stock exchange structure
1 regional electronic stock Exchange for the 8 countries of WAEMU
World-class stock exchange infrastructure across the Region
BRVM operates under the regulatory oversight of the Capital Markets Authorities (CREPMF)
Modern and disclosure-based Listing Rules with an Automated Trading Systems
BRVM became a affiliate member of the World Federation of Exchanges (WFE) in 2012
Electronic link with Regional CDS depository which complies with G30 Standards
2 – Organization and features of BRVM
2.3 Features

3 – BRVM recent development
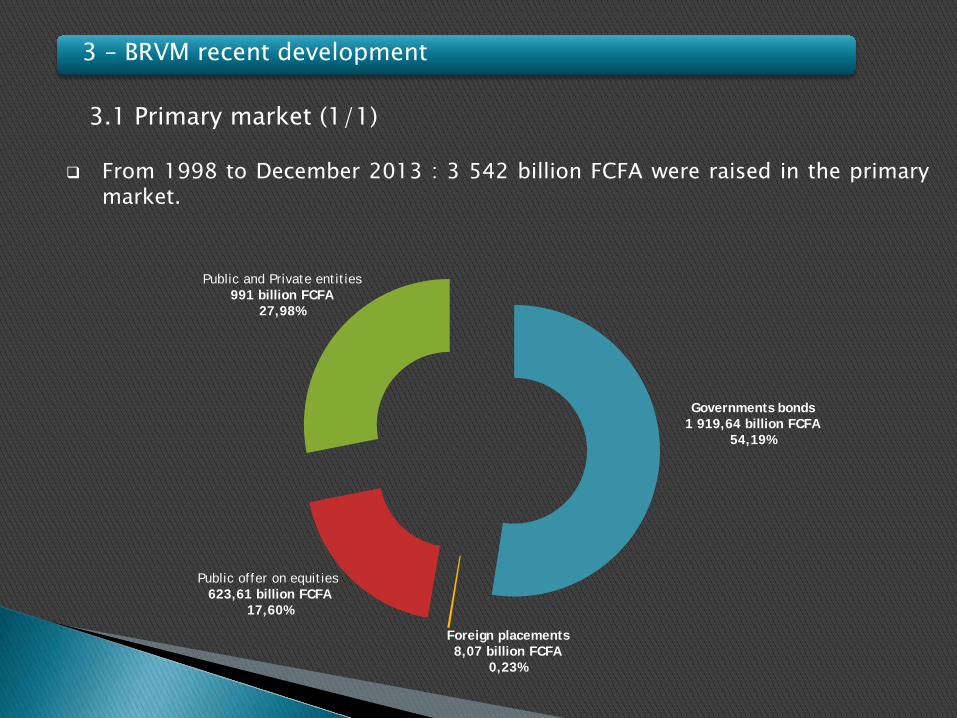
From 1998 to December 2013 : 3 542 billion FCFA were raised in the primarymarket.
3.1 Primary market (1/1)
3 – BRVM recent development
Foreign placements8,07 billion FCFA
0,23%
Governments bonds1 919,64 billion FCFA
54,19%
Public and Private entities991 billion FCFA
27,98%
Public offer on equities 623,61 billion FCFA
17,60%

3.2 Secondary market (1/6)
3 – BRVM recent development
BRVM 10 et BRVM All shares(2008 –2013)
Sectors indices (2013)
192.08
143.6
182.96
158.49
246.34
178.17
132.05
159.1138.88
232.02
0
50
100
150
200
250
300
2008 2009 2010 2011 2012 31-Jan-13 31-Dec-13
BRVM 10 BRVM Composite
+35,66 %
+40,64 %
31/12/2013
31/12/2013
+126,21%
+90,48%
+55,73% +52,62%+43,05% +39,87%
6,54%-20.00%
0.00%
20.00%
40.00%
60.00%
80.00%
100.00%
120.00%
140.00%
BRVM-Agriculture
BRVM-Transport
BRVM-Finances
BRVM-Distribution
BRVM-Industrie
BRVM-Autres
SecteursBRVM-
Services Publics

3.2 Secondary market (2/6)
3 – BRVM recent development
Market Capitalisation : bond market(2008 – 2013)
Market Cap : Equity market(2008 – 2013)
41,10 %
3,337
2,808
3,471
3,177
4,031
5,001
5,633
0
1,000
2,000
3,000
4,000
5,000
6,000
2008
2009
2010
2011
2012
31-Ja
n-13
27-M
ay-1
3
31-D
ec-1
3
+68,8 %
- Dec 31st, 2012 Market cap exceeded 4k billion FCFA
- May 27th, 2013 : Market cap exceeded 5k billion FCFA
+108,34 %
515
457
1,0011,073
0
200
400
600
800
1,000
1,200
2008
2009
2010
2011
2012
18-A
pr-1
3
31-D
ec-1
3
Billi
on - April 18th, 2013 : Market cap exceeded 1k billion FCFA
29,12 %
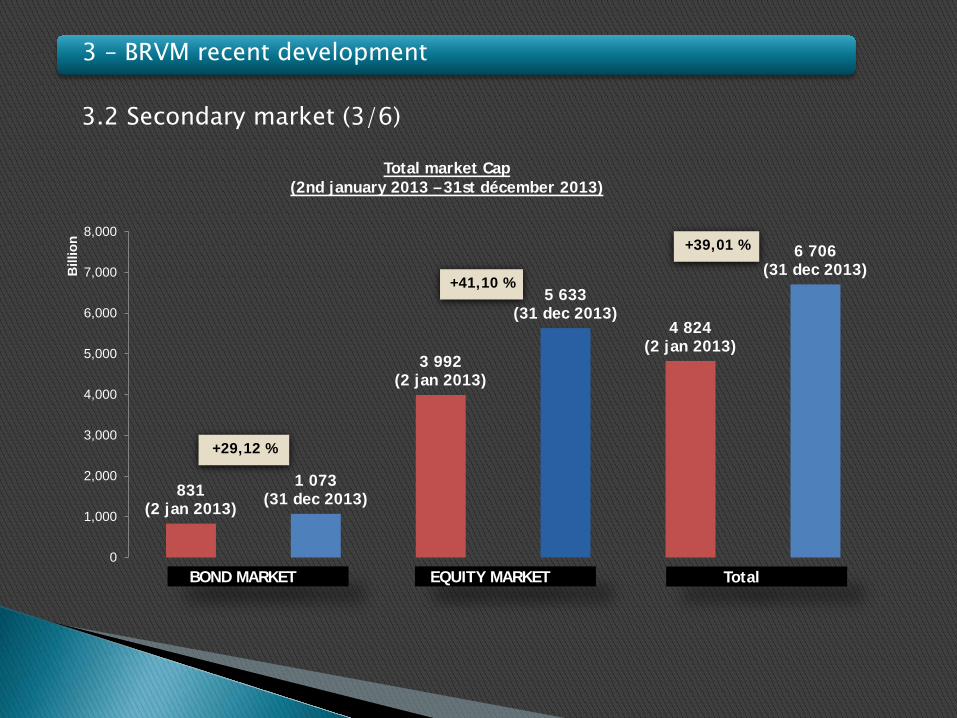
3.2 Secondary market (3/6)
3 – BRVM recent development
Total market Cap(2nd january 2013 – 31st décember 2013)
+39,01 %
831(2 jan 2013)
1 073(31 dec 2013)
3 992(2 jan 2013)
5 633(31 dec 2013)
4 824(2 jan 2013)
6 706(31 dec 2013)
0
1,000
2,000
3,000
4,000
5,000
6,000
7,000
8,000
Bill
ion
Total
+29,12 %
+41,10 %
EQUITY MARKETBOND MARKET
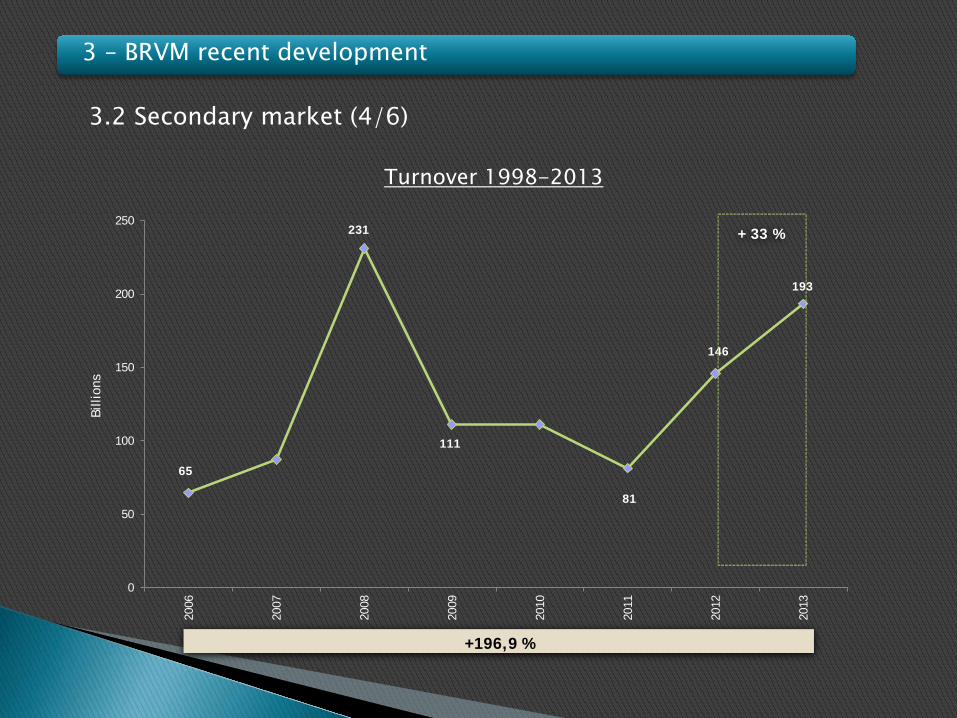
Turnover 1998-2013
3.2 Secondary market (4/6)
3 – BRVM recent development
65
231
111
81
146
193
0
50
100
150
200
250
2006
2007
2008
2009
2010
2011
2012
2013
Billi
ons
+ 33 %
+196,9 %
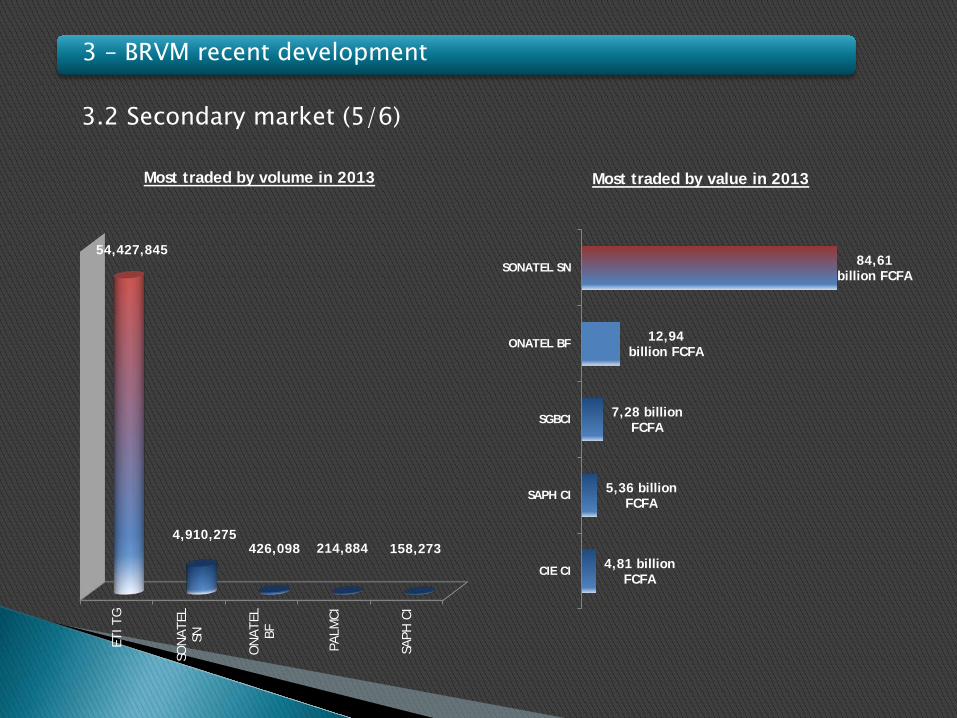
3.2 Secondary market (5/6)
3 – BRVM recent development
Most traded by value in 2013
4,81 billion FCFA
5,36 billion FCFA
7,28 billion FCFA
12,94 billion FCFA
84,61 billion FCFA
CIE CI
SAPH CI
SGBCI
ONATEL BF
SONATEL SN
Most traded by volume in 2013
ETI T
G
SON
ATEL
SN
ON
ATEL
BF
PALM
CI
SAPH
CI
54,427,845
4,910,275426,098 214,884 158,273

3.2 Secondary market (6/6)
3 – BRVM recent development
5 highest 5 lowest
UNIWAX CI(+550 %)
SERVAIR CI (+142,21 %) NEI CEDA
(+133,46 %) BOLLORE (+128,57 %) VIVO ENERGY
(+120,51 %)
SICOR CI(-7,50 %) CFAO
(-14,78 %)SAPH
(-15,04 %)SOGB
(-17,69 %)TRITURAF (-38,75 %)
-200
-100
0
100
200
300
400
500
600

4 – The Regional CDS Organization
Dépositaire Central/Banque de Règlement of WAEMU

4 – The Regional CDS organization
One CDS for 8 WAEMU countries. Operational since September 1998 Fully demutualized CDS Provides Depository, Clearing and Settlement services to market
brokers and custodian banks Manages equity and debt instruments Full member of ANNA covering 8 countries of WAEMU in 2013 Efficient system that has greatly reduced risks:
- Meets international standards
- Securities are dematerialized (+ISIN numbers issuance)- DVP (T+3)- Net settlement of funds with central bank money- Settlement guaranteed through a Market Guarantee Fund- Participants settlement limit based on their contribution to theGuarantee fund.- Buy-in procedures in the event of securities settlement failure
No failed trades until now.

5 – Regulatory framework of the Regional CDSDépositaire Central/Banque de Règlement of WAEMU

The Dépositaire Central/Banque de Règlement of WAEMU Act1998 provides the legal framework for the operations of the CDS.
The object of the Act is “to provide regulation of a central,depository, clearing and settlement service in order to facilitatedealings in securities in the WAEMU.”
The Dépositaire Central/Banque de Règlement of WAEMU isguided in its day-to-day management by the CDS Rules andOperational Procedures.
The Dépositaire Central/Banque de Règlement of WAEMU is underthe regulatory oversight of the Capital Markets Authority (ConseilRegional de l’Epargne Publique et des Marchés Financiers).
5 – Regulatory framework of the Regional CDS

6 – The Regional CDS recent development
Dépositaire Central/Banque de Règlement of WAEMU

Assets under management in the CDS books at the end 2013
6.1 CDS activities (1/2)
6 – The Regional CDS recent development
AUM (31 December 2013)
Listed equities5 633,4
billion FCFA (80,46%)
Non Listed equities
550 billion FCFA
(0,01%)
Listed bonds1 072,7
billionFCFA (15,32%)
Non Listed bonds
294,8 billion FCFA
(1,79%)
…Total AUM end of 2013 = 7 001 billion FCFA
AUM(2012 – 2013)
0
1,000
2,000
3,000
4,000
5,000
6,000
7,000
8,000
+39,53 %
5 017 31/12/2012
7 001,5 29 nov. 2013
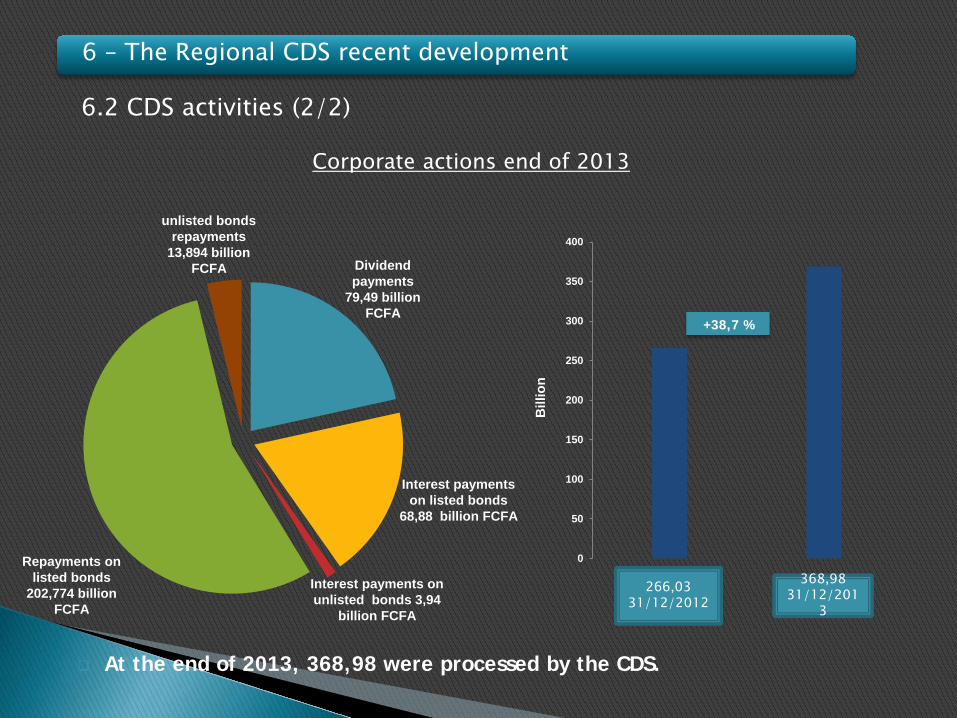
At the end of 2013, 368,98 were processed by the CDS.
Corporate actions end of 2013
6.2 CDS activities (2/2)
6 – The Regional CDS recent development
+38,7 %
0
50
100
150
200
250
300
350
400
Bill
ion
Interest payments on listed bonds
68,88 billion FCFA
Dividend payments
79,49 billion FCFA
Interest payments on unlisted bonds 3,94
billion FCFA
Repayments on listed bonds
202,774 billion FCFA
unlisted bonds repayments
13,894 billion FCFA
368,9831/12/201
3
266,0331/12/2012

Members Total
Issuers
Listed equities 37
92Unlisted equities 2
Listed bonds 35
Unlisted bonds 18
Brokers
Benin 4
21
Burkina Faso 2
Côte d'Ivoire 10
Mali 1
Niger 1
Senegal 2Togo 1
Custodian banks 6
Total members 119
6 – The Regional CDS recent development
6.3 CDS participants
7 – 2014 Outlook

Focus on the listing of new companies in 1st and 2nd board
Launch a 3rd board for SME’s, growth enterprises and star ups
Implement a new CDS system
Draft a project for the implementation of Stock lending/borrowing
The launch of the ECOWAS stock exchange integration project
Signing of MOUs with the Private Equity Funds to build pipeline of new listing
Signing MOUs with the Chambers of Commerce to leverage on their experience and
database of companies to bring more companies in the market
Forecasting 2014 year, BRVM will engage in various projects to boots over the stock exchange.
7 – 2014 Outlook

THANK YOU