
Depleted Uranium (DU) Follow-Up Program UpdateDepleted Uranium (DU) Follow-Up Program Update Melissa...
32
Depleted Uranium (DU) Follow-Up Program Update Melissa A. McDiarmid, MD, MPH, DABT Katherine S. Squibb, PhD VA Maryland Health Care System University of Maryland Baltimore, USA
Transcript of Depleted Uranium (DU) Follow-Up Program UpdateDepleted Uranium (DU) Follow-Up Program Update Melissa...
Depleted Uranium (DU) Follow-Up Program Update
Melissa A. McDiarmid, MD, MPH, DABTKatherine S. Squibb, PhD
VA Maryland Health Care SystemUniversity of Maryland
Baltimore, USA

Report Documentation Page Form ApprovedOMB No. 0704-0188
Public reporting burden for the collection of information is estimated to average 1 hour per response, including the time for reviewing instructions, searching existing data sources, gathering andmaintaining the data needed, and completing and reviewing the collection of information. Send comments regarding this burden estimate or any other aspect of this collection of information,including suggestions for reducing this burden, to Washington Headquarters Services, Directorate for Information Operations and Reports, 1215 Jefferson Davis Highway, Suite 1204, ArlingtonVA 22202-4302. Respondents should be aware that notwithstanding any other provision of law, no person shall be subject to a penalty for failing to comply with a collection of information if itdoes not display a currently valid OMB control number.
1. REPORT DATE NOV 2010 2. REPORT TYPE
3. DATES COVERED 00-00-2010 to 00-00-2010
4. TITLE AND SUBTITLE Depleted Uranium (DU) Follow-up Program Update
5a. CONTRACT NUMBER
5b. GRANT NUMBER
5c. PROGRAM ELEMENT NUMBER
6. AUTHOR(S) 5d. PROJECT NUMBER
5e. TASK NUMBER
5f. WORK UNIT NUMBER
7. PERFORMING ORGANIZATION NAME(S) AND ADDRESS(ES) University of Maryland ,620 W. Lexington St,Baltimore,MD,21201
8. PERFORMING ORGANIZATIONREPORT NUMBER
9. SPONSORING/MONITORING AGENCY NAME(S) AND ADDRESS(ES) 10. SPONSOR/MONITOR’S ACRONYM(S)
11. SPONSOR/MONITOR’S REPORT NUMBER(S)
12. DISTRIBUTION/AVAILABILITY STATEMENT Approved for public release; distribution unlimited
13. SUPPLEMENTARY NOTES Presented at the Depleted Uranium Symposium, held November 4, 2010, at the Armed ForcesRadiobiology Research Institute
14. ABSTRACT
15. SUBJECT TERMS
16. SECURITY CLASSIFICATION OF: 17. LIMITATION OF ABSTRACT Same as
Report (SAR)
18. NUMBEROF PAGES
31
19a. NAME OFRESPONSIBLE PERSON
a. REPORT unclassified
b. ABSTRACT unclassified
c. THIS PAGE unclassified
Standard Form 298 (Rev. 8-98) Prescribed by ANSI Std Z39-18

Gulf War Exposures to DU• Friendly-fire incidents
exposed US soldiers to:– DU shrapnel – Aerosolized DU oxides
• Inhalation, ingestion, wound contamination
• Burning of munitions storage facility
• Decontamination of military equipment

Purpose of DU Surveillance Program
• Determine DU-related health effects, if any, in exposed soldiers
• Develop methods to measure uranium exposure– Inhalation exposure/wound contamination– Embedded fragment
• Examine medical and surgical management of fragments

Measurements of DU Exposure
• Urine uranium concentrations– Relation between fragment status and
elevated urinary uranium levels first observed in 1994 visit
– Confirmed in all 7 subsequent visits• Developed analytical method for
measuring DU vs total U – U235/U238 isotopic analysis

Summary of Surveillance VisitsGulf War I OIF
Visit Year DU-exposed Non-exposed DU-exposed Total1993-4 33 33
1997 29 38 57
1999 21 + 29 new 50
2001 31 + 8 new 39
2003 32 32
2005 30 + 4 new 3 37
2007 32 + 3 new 2 (1 new) 37
2009 38 + 2 new 2 40
79 unique cases have been evaluated from Gulf War I.4 unique cases have been evaluated from OIF.
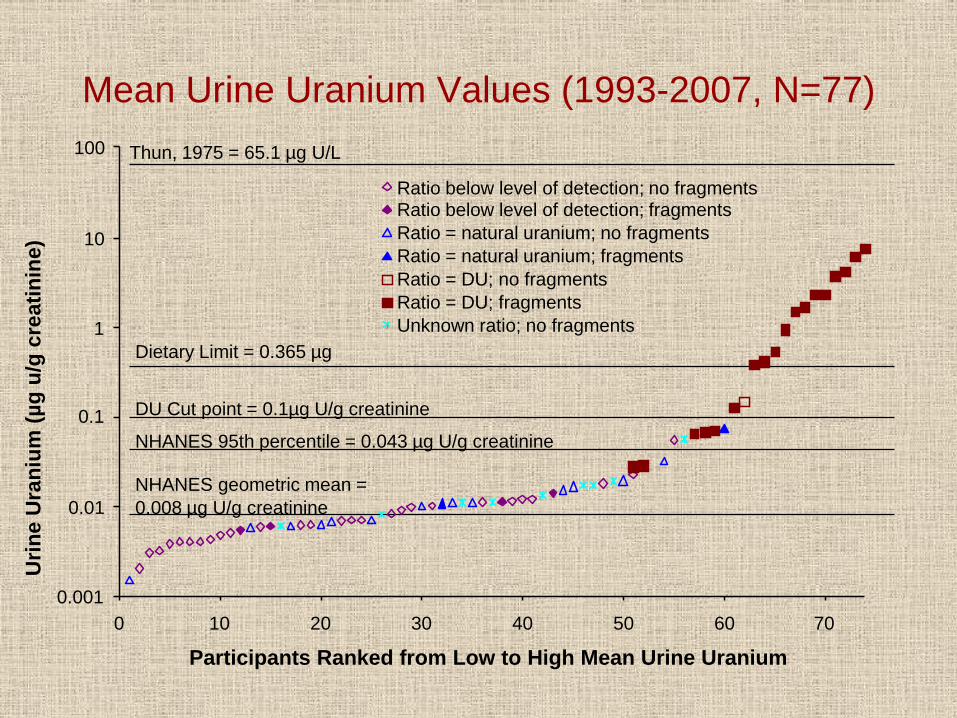
Mean Urine Uranium Values (1993-2007, N=77)
0.001
0.01
0.1
1
10
100
0 10 20 30 40 50 60 70
Participants Ranked from Low to High Mean Urine Uranium
Urin
e U
rani
um (µ
g u/
g cr
eatin
ine)
Ratio below level of detection; no fragmentsRatio below level of detection; fragmentsRatio = natural uranium; no fragmentsRatio = natural uranium; fragmentsRatio = DU; no fragmentsRatio = DU; fragmentsUnknown ratio; no fragments
Thun, 1975 = 65.1 µg U/L
Dietary Limit = 0.365 µg
DU Cut point = 0.1µg U/g creatinine
NHANES 95th percentile = 0.043 µg U/g creatinine
NHANES geometric mean = 0.008 µg U/g creatinine

Individual Participant’s with 4 or More Visits Mean uU with Minimum and Maximum uU Values (n=35)
0.001
0.01
0.1
1
10
100
0 5 10 15 20 25 30 35
Participants Ranked from Low to High Mean Urine Uranium
Ura
nium
(µg
U/g
cre
atin
ine)
Mean uUMinimum uUMaximum uU

Correlation between Urine and Blood Uranium When Urine U >0.1 µg/g Creatinine
0
0.2
0.4
0.6
0.8
1
1.2
0 10 20 30 40 50 60
Urine Uranium (µg/g creatinine)
Blo
od U
rani
um (µ
g/L)
r=0.95p<.01

0.001
0.01
0.1
1
0 5 10 15 20 25 30 35
Blood Uranium Values Ranked from Low to High
Blo
od U
rani
um (
µg/L
)
Insufficient total uranium to measure isotopesDU presentNo DU
Fisene and Perry 1985 = 0.14 µg U/L
Blood Uranium Values from the 2007 Cohort
Fisene and Perry (1985) Mean U concentration in blood of residents of NYC with no known occupational exposure to U
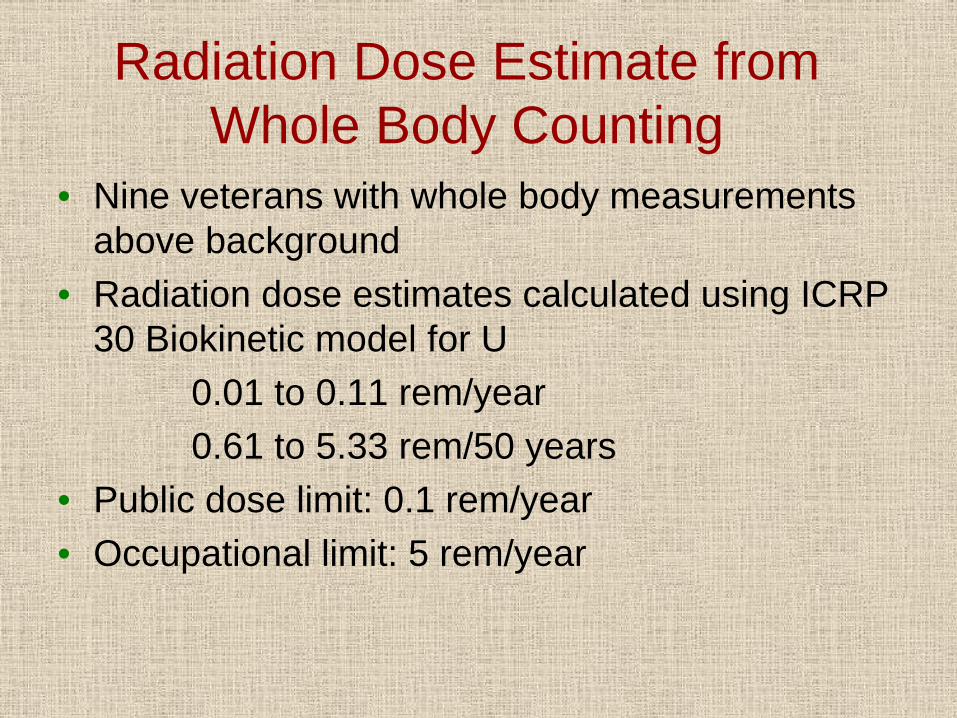
Radiation Dose Estimate from Whole Body Counting
• Nine veterans with whole body measurements above background
• Radiation dose estimates calculated using ICRP 30 Biokinetic model for U
0.01 to 0.11 rem/year0.61 to 5.33 rem/50 years
• Public dose limit: 0.1 rem/year• Occupational limit: 5 rem/year
Health Surveillance Results from 2009 Visit

Demographic Characteristics of the 2009 Participants Compared to All Participants
N %* N %
RACE
African American 12 34% 24 30%
Asian American 1 3% 1 1%
Caucasian 20 57% 45 57%
Hispanic 2 6% 8 8%
Native American 1 1%
AGE**
** Mean age a time of 2009 evaluation (± standard deviation)* May not add to 100% due to rounding
All GWI Participants (n = 79)
2009 Cohort (n = 35)
43.62 ± 5.35 43.12 ± 4.80
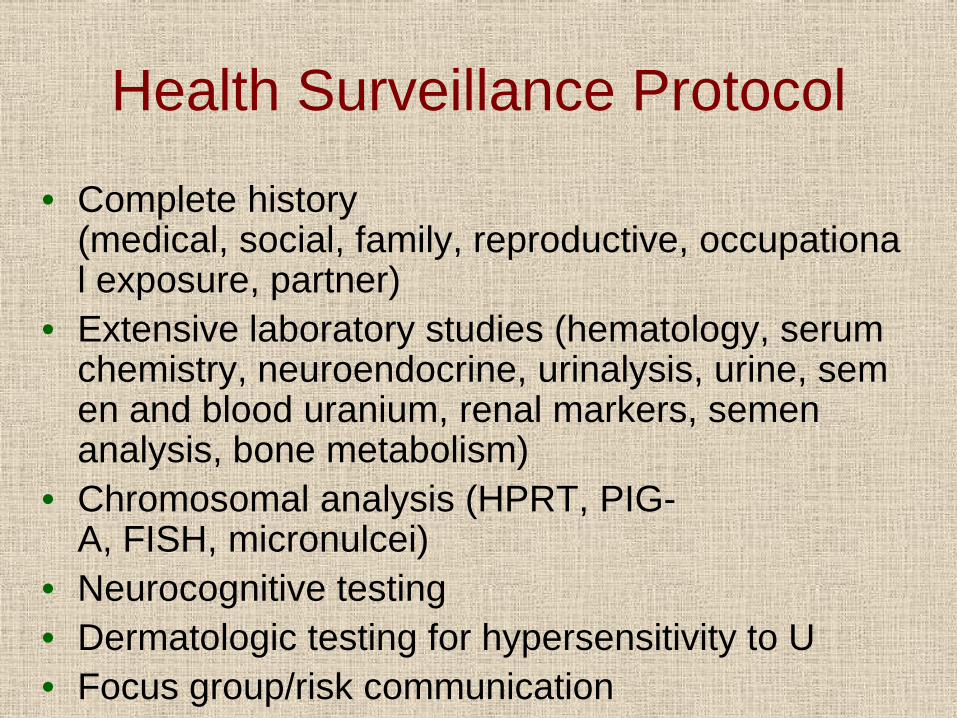
Health Surveillance Protocol
• Complete history (medical, social, family, reproductive, occupational exposure, partner)
• Extensive laboratory studies (hematology, serum chemistry, neuroendocrine, urinalysis, urine, semen and blood uranium, renal markers, semen analysis, bone metabolism)
• Chromosomal analysis (HPRT, PIG-A, FISH, micronulcei)
• Neurocognitive testing• Dermatologic testing for hypersensitivity to U• Focus group/risk communication

Summary of Renal Effect Measures

Proximal Tubule Markers – 2009 Cohort
Mann-Whitney
(mean ± SE) (mean ± SE) pUrine β2 microglobulin (0-0.3 mg/L) 0.10 ± 0.02 0.10 ± 0.01 0.50
Urine intestinal alkaline phosphatase (IAP) (<2 U/g creatinine) 0.20 ± 0.04 0.22 ± 0.04 0.79
Urine N -acetyl -β-glucosaminidase (NAG) (<5 U/g creatinine) 0.68 ± 0.23 0.45 ± 0.05 0.74
Urine total protein (1-150 mg/24 h) 110.24 ± 18.15 127.43 ± 16.80 0.15
Urine micro-albumin (<25 mg/g cre)c 3.36 ± 1.24 4.39 ± 2.48 0.39
Urine retinol binding protein (<610µg/g cre) 33.23 ± 4.32 35.51 ± 8.37 0.79a < 0.10 μg/g creatinine (n=21)b > 0.10 μg/g creatinine (n=14)c Low n = 18, High n = 12
2009 Laboratory test(normal range)
Low Mean Uranium
Groupa
High Mean Uranium
Groupb

Summary of Renal Parameters 1994-2009Renal parameter 1994 1997 1999 2001 2003 2005 2007
Urine creatinine ns ns l>h¹(p=.07) ns ns ns ns
Urine calcium ns ns ns ns
Urine PO4 ns ns l>h(p=.10) ns
Urine β-2 microglobulin ns ns ns ns ns ns h>l(p=0.11)
Urine intestinal alkaline phosphatase (IAP) ns ns ns ns ns
Urine N-acetyl-ß-glucosa-minidase (NAG) ns ns ns ns ns
Urine total protein ns ns H>L l>h(p=.21) ns ns
Urine microalbumin ns ns ns
Retinol binding protein (RBP) ns ns h>l(p=.06)
h>lns² ns h>l
(p=.07)Serum creatinine ns ns ns L>H ns ns L>H
Serum calcium ns ns ns ns
Serum PO4 ns H>L l>hns -
Serum uric acid ns ns ns ns ns ns -
Evaluation Year
L = Low urine uranium group (U < 0.1 µg/g creatinine)H = High urine uranium group (U > 0.1 µg/g creatinine)ns = no significant differences between groups¹ Lower case letters = non-significant findings² High uranium group 80.5 µg/g creatinine ± 51.4, low uranium group 27.3 µg/g creatinine ± 3.1, p=.54

Predicted Kidney Uranium Concentrations
0
0.2
0.4
0.6
0.8
1
1.2
1.4
1 2 3 4 5 6 7
Individual Participants
[U] i
n m
icro
gram
s/gr
am Ten years Twenty years
Summary of Genotoxicological Measures

Summary of Differences in Genotoxicity Parameters across Evaluations
1994 1997 1999 2001 2003 2005 2007 2009Sister chromatid exchange (SCE)
l>h*ns H>L** l>h
ns ns - - -
Chromosomal aberrations (CA) ns ns H>L ns ns ns -
Hypoxanthine-guanine phosphoribosyl transferase (HPRT) Mutation frequency
h>lns
h>lns
h>lns ns ns
Mutation frequency adjusted for cloning efficiency
ns ns ns ns
Mutation frequency adjusted for cloning efficiency and age
ns ns ns ns
Fluorescent in-situ hybridization (FISH); Mean number of total mutations per subject in chromo-somes 5, 7, 11, and 13
h>lp=.08 ns ns
PIG-A l>hp=.08
Micronuclei ns
ns = no significant differences between groups* lower case letters = non-significant findings
GenotoxicityParameter
Evaluation Year
** upper case letters = significant findings (p ≤ 0.05)
Low urine uranium group (U < 0.1 µg/g creatinine)High urine uranium group (U ≥ 0.1 µg/g creatitine)

Other Clinical Findings
• No clinically significant differences detected between low and high uranium exposure groups for– Semen characteristics– Neuroendocrine measures– Neurocognitive measures

Summary• Subtle health effects observed in DU exposed
veterans are most likely the result of chemical effects of U– Decreased reabsorption of filtered proteins in renal
proximal tubules– Subtle changes in bone metabolism
• Weak genotoxicity results are consistent with epi studies examining carcinogenicity in U millers and miners– Mechanisms of DU genotoxicity may be a mix of
chemical and radiologic effects– Potential for foreign body reaction in vicinity of
embedded fragments is a concern

2nd Mission of the DU Follow-Up Program
• Since 1998:To provide biologic monitoring by mail for uranium for all GWI and OIF veterans

Purpose of the Urine Biomonitoring Program
• Determine urine uranium concentration in veterans from GWI and forward
• Passively survey for exposure scenarios linked to DU exposure other than friendly fire
• Provide assistance to veterans’ primary care providers in interpreting results and answering veterans questions

Comparison of Urine Uranium Values from DUP, GWI and OIF(as of 10/31/10)
0.0001
0.001
0.01
0.1
1
10
100
0 200 400 600 800 1000 1200 1400 1600 1800 2000
Samples for Low to High Urine Uranium (µg U/g creatinine)
Urin
e U
rani
um (µ
g U
/g c
reat
inin
e)
Mean uU thru 2007 for 2009 cohort; no DU (n=21)Mean uU thru 2007 for 2009 cohort; DU (n=15)Gulf War mailin; no DU (n=820)Gulf War mailin; isotopic not done (n=469)Gulf War mailin; DU (n=1)OIF/OEF mailin; no DU (n=1899)OIF/OEF mailin; DU (n=3)
Thun, 1975 65.1 µg U/g creatinine
Thun, 1980 9.1 µg U/g creatinine
Occ. Dec. Level 0.8 µ/LDietary limit 0.365 µ/L
DU program (Mail In) cut point 0.05 µ U/g
NHANES 95th% 0.34 μ U/g creatinine
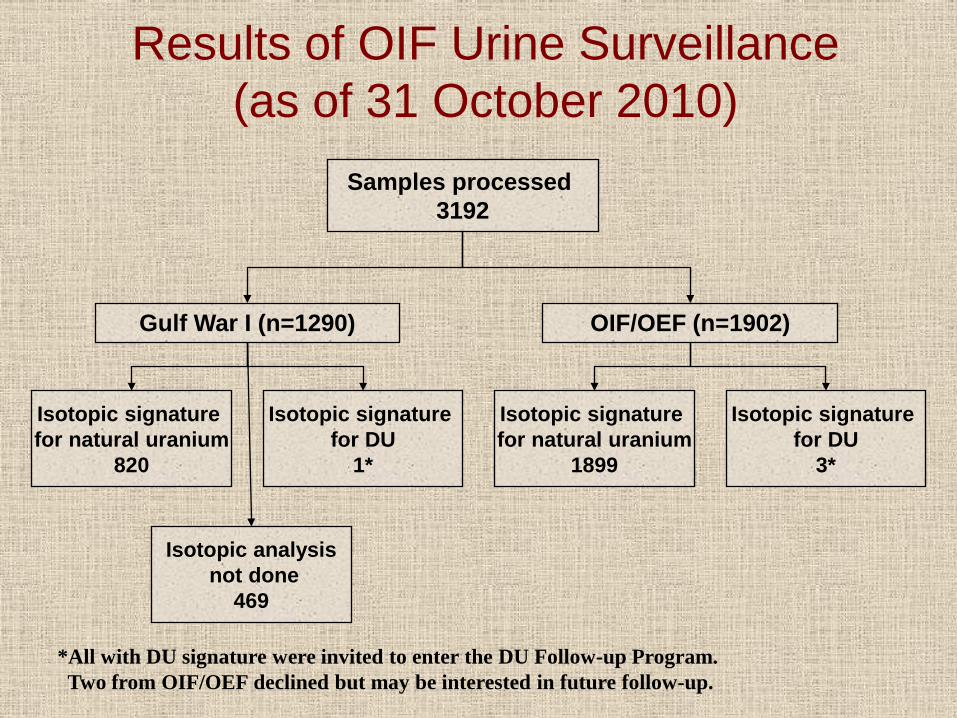
Results of OIF Urine Surveillance(as of 31 October 2010)
*All with DU signature were invited to enter the DU Follow-up Program. Two from OIF/OEF declined but may be interested in future follow-up.
Samples processed 3192
Gulf War I (n=1290) OIF/OEF (n=1902)
Isotopic signature for natural uranium
820
Isotopic signature for natural uranium
1899
Isotopic signature for DU
1*
Isotopic signature for DU
3*
Isotopic analysisnot done
469
Outstanding Questions• Will health effects of DU develop in the
cohort as it grows older?
• What are the health effects of concern related to effects of DU embedded fragments on adjacent tissues?
• Should even small pieces of DU shrapnel be removed?

Fate of DU Metal Fragments in Rat Muscle in Situ
Correlation of radiographic appearance with histologic appearance. (A) Thick fibrotic capsule with shards of corroded DU in lumen; (B) thick cellular capsule lined by squamous metaplasia, particles, and shards of corroded DU in wall and lumen; (C) particles and shards of disintegrated DU fragment scattered throughout a soft tissue sarcoma (Hahn et al, 2002).

1995 film 2001 film

Development of in Situ Surveillance Protocol
• Objective: To identify and manage (prevent) health effects related to fragment retention
– Risk of the development of tumors at fragment sites• Foreign body effects?
– Medical implants (hip, knee joints; dental implants, etc)
– Bullets• Chemical effects?

In Situ Imaging Methods for Surveillance of Fragments and Surrounding Tissue
• Currently using x-ray films to look for changes in the shape and other physical characteristics of the fragments
• Exploring other available imaging methods for identifying pre-neoplastic lesions or primary stage tumors – Ultrasound– MRI– PET/CT


![Western Uranium Corporation [Type text]western-uranium.com/media/Western Uranium Corp...2015, Western Uranium acquired Black Range Minerals Ltd to acquire additional uranium assets](https://static.fdocuments.in/doc/165x107/5e9e2fdc39245c320521c248/western-uranium-corporation-type-textwestern-uranium-corp-2015-western-uranium.jpg)


