Dependence of Micelle Size and Shape on Detergent Alkyl ...
10
Dependence of Micelle Size and Shape on Detergent Alkyl Chain Length and Head Group Ryan C. Oliver 1 , Jan Lipfert 2 , Daniel A. Fox 1 , Ryan H. Lo 1 , Sebastian Doniach 3,4 , Linda Columbus 1 * 1 Department of Chemistry, University of Virginia, Charlottesville, Virginia, United States of America, 2 Department of Bionanoscience, Kavli Institute of Nanoscience, Delft University of Technology, Delft, The Netherlands, 3 Departments of Physics and Applied Physics, Biophysics Program, Stanford, California, United States of America, 4 Stanford Synchrotron Radiation Laboratory, Stanford University, Stanford, California, United States of America Abstract Micelle-forming detergents provide an amphipathic environment that can mimic lipid bilayers and are important tools for solubilizing membrane proteins for functional and structural investigations in vitro. However, the formation of a soluble protein-detergent complex (PDC) currently relies on empirical screening of detergents, and a stable and functional PDC is often not obtained. To provide a foundation for systematic comparisons between the properties of the detergent micelle and the resulting PDC, a comprehensive set of detergents commonly used for membrane protein studies are systematically investigated. Using small-angle X-ray scattering (SAXS), micelle shapes and sizes are determined for phosphocholines with 10, 12, and 14 alkyl carbons, glucosides with 8, 9, and 10 alkyl carbons, maltosides with 8, 10, and 12 alkyl carbons, and lysophosphatidyl glycerols with 14 and 16 alkyl carbons. The SAXS profiles are well described by two-component ellipsoid models, with an electron rich outer shell corresponding to the detergent head groups and a less electron dense hydrophobic core composed of the alkyl chains. The minor axis of the elliptical micelle core from these models is constrained by the length of the alkyl chain, and increases by 1.2–1.5 A ˚ per carbon addition to the alkyl chain. The major elliptical axis also increases with chain length; however, the ellipticity remains approximately constant for each detergent series. In addition, the aggregation number of these detergents increases by ,16 monomers per micelle for each alkyl carbon added. The data provide a comprehensive view of the determinants of micelle shape and size and provide a baseline for correlating micelle properties with protein-detergent interactions. Citation: Oliver RC, Lipfert J, Fox DA, Lo RH, Doniach S, et al. (2013) Dependence of Micelle Size and Shape on Detergent Alkyl Chain Length and Head Group. PLoS ONE 8(5): e62488. doi:10.1371/journal.pone.0062488 Editor: Laurent Kreplak, Dalhousie University, Canada Received October 12, 2012; Accepted March 20, 2013; Published May 8, 2013 Copyright: ß 2013 Oliver et al. This is an open-access article distributed under the terms of the Creative Commons Attribution License, which permits unrestricted use, distribution, and reproduction in any medium, provided the original author and source are credited. Funding: This research was funded by the National Science Foundation CAREER award (MCB 0845668), and supported by the Netherlands Organisation for Scientific Research (NWO). The funders had no role in study design, data collection and analysis, decision to publish, or preparation of the manuscript. Competing Interests: The authors have declared that no competing interests exist. * E-mail: [email protected] Introduction Detergents have played a significant role in advancing the understanding of membrane protein structure and function. Detergent monomers in solution self-assemble at and above the critical micelle concentration (cmc) to form micelles. Micelles adopt globular shapes (e.g., spheres, ellipsoids, and cylinders) of various sizes, determined by the detergent head group structure and alkyl chain length [1]. The hydrophilic head groups of the detergent comprise a solvent-exposed outer shell, while the hydrophobic alkyl chains are sequestered from water and form the micelle core. Thus, the cross-sectional composition of the micelle is structurally similar to the lipid bilayer with hydrocarbon chains bound by hydrophilic head groups. Consequently, micelles are often employed as mimics of lipid bilayers to solubilize and stabilize integral membrane proteins for structural and functional in vitro studies [2–5]. Although non- micellar amphiphilic systems, such as nanodiscs [6] and bicelles [7], have been used in membrane protein studies, so far detergents have demonstrated more successes in high-resolution structure determination of membrane proteins. Nonetheless, stable, func- tional protein-detergent complexes (PDC) are difficult to obtain because protein denaturation and aggregation often occur. Determining the optimal conditions that yield a properly folded membrane protein relies heavily on exhaustive screening of detergents [8–11]. This need for empirical detergent screening stems from a lack of understanding of the physical forces between the detergent micelle and membrane protein. Micelle size, shape, and detergent concentration need to be considered in evaluating a PDC for structural and biochemical studies. For instance, recent evidence suggests that the micelle hydrophobic thickness needs to match that of the membrane protein to maintain proper fold and function [12–14] (similar to the hydrophobic match proposed for membrane proteins in bilayers [15–19]). Therefore, a systematic investigation of the size and shape determinants of pure micelles will provide a baseline and foundation for the further understanding of micelle-protein interactions. In this study, the sizes and shapes of micelles formed by four classes of detergents, phosphocholines, maltosides, glucosides, and lysophosphatidyl glycerols (Table 1), are investigated using small- angle X-ray scattering (SAXS). The detergents were selected based on their prevalence in membrane protein structural biology. Approximately 40% of the ,115 membrane protein structures determined by NMR were prepared in dodecyl phosphocholine (FC12) micelles while nearly 40% of the ,1200 membrane protein structures determined by X-ray crystallography were in octyl glucoside (OG), decyl maltoside (DM), or dodecyl maltoside PLOS ONE | www.plosone.org 1 May 2013 | Volume 8 | Issue 5 | e62488
Transcript of Dependence of Micelle Size and Shape on Detergent Alkyl ...

Dependence of Micelle Size and Shape on DetergentAlkyl Chain Length and Head GroupRyan C. Oliver1, Jan Lipfert2, Daniel A. Fox1, Ryan H. Lo1, Sebastian Doniach3,4, Linda Columbus1*
1 Department of Chemistry, University of Virginia, Charlottesville, Virginia, United States of America, 2 Department of Bionanoscience, Kavli Institute of Nanoscience, Delft
University of Technology, Delft, The Netherlands, 3 Departments of Physics and Applied Physics, Biophysics Program, Stanford, California, United States of America,
4 Stanford Synchrotron Radiation Laboratory, Stanford University, Stanford, California, United States of America
Abstract
Micelle-forming detergents provide an amphipathic environment that can mimic lipid bilayers and are important tools forsolubilizing membrane proteins for functional and structural investigations in vitro. However, the formation of a solubleprotein-detergent complex (PDC) currently relies on empirical screening of detergents, and a stable and functional PDC isoften not obtained. To provide a foundation for systematic comparisons between the properties of the detergent micelleand the resulting PDC, a comprehensive set of detergents commonly used for membrane protein studies are systematicallyinvestigated. Using small-angle X-ray scattering (SAXS), micelle shapes and sizes are determined for phosphocholines with10, 12, and 14 alkyl carbons, glucosides with 8, 9, and 10 alkyl carbons, maltosides with 8, 10, and 12 alkyl carbons, andlysophosphatidyl glycerols with 14 and 16 alkyl carbons. The SAXS profiles are well described by two-component ellipsoidmodels, with an electron rich outer shell corresponding to the detergent head groups and a less electron densehydrophobic core composed of the alkyl chains. The minor axis of the elliptical micelle core from these models isconstrained by the length of the alkyl chain, and increases by 1.2–1.5 A per carbon addition to the alkyl chain. The majorelliptical axis also increases with chain length; however, the ellipticity remains approximately constant for each detergentseries. In addition, the aggregation number of these detergents increases by ,16 monomers per micelle for each alkylcarbon added. The data provide a comprehensive view of the determinants of micelle shape and size and provide a baselinefor correlating micelle properties with protein-detergent interactions.
Citation: Oliver RC, Lipfert J, Fox DA, Lo RH, Doniach S, et al. (2013) Dependence of Micelle Size and Shape on Detergent Alkyl Chain Length and HeadGroup. PLoS ONE 8(5): e62488. doi:10.1371/journal.pone.0062488
Editor: Laurent Kreplak, Dalhousie University, Canada
Received October 12, 2012; Accepted March 20, 2013; Published May 8, 2013
Copyright: � 2013 Oliver et al. This is an open-access article distributed under the terms of the Creative Commons Attribution License, which permitsunrestricted use, distribution, and reproduction in any medium, provided the original author and source are credited.
Funding: This research was funded by the National Science Foundation CAREER award (MCB 0845668), and supported by the Netherlands Organisation forScientific Research (NWO). The funders had no role in study design, data collection and analysis, decision to publish, or preparation of the manuscript.
Competing Interests: The authors have declared that no competing interests exist.
* E-mail: [email protected]
Introduction
Detergents have played a significant role in advancing the
understanding of membrane protein structure and function.
Detergent monomers in solution self-assemble at and above the
critical micelle concentration (cmc) to form micelles. Micelles
adopt globular shapes (e.g., spheres, ellipsoids, and cylinders) of
various sizes, determined by the detergent head group structure
and alkyl chain length [1]. The hydrophilic head groups of the
detergent comprise a solvent-exposed outer shell, while the
hydrophobic alkyl chains are sequestered from water and form
the micelle core. Thus, the cross-sectional composition of the
micelle is structurally similar to the lipid bilayer with hydrocarbon
chains bound by hydrophilic head groups.
Consequently, micelles are often employed as mimics of lipid
bilayers to solubilize and stabilize integral membrane proteins for
structural and functional in vitro studies [2–5]. Although non-
micellar amphiphilic systems, such as nanodiscs [6] and bicelles
[7], have been used in membrane protein studies, so far detergents
have demonstrated more successes in high-resolution structure
determination of membrane proteins. Nonetheless, stable, func-
tional protein-detergent complexes (PDC) are difficult to obtain
because protein denaturation and aggregation often occur.
Determining the optimal conditions that yield a properly folded
membrane protein relies heavily on exhaustive screening of
detergents [8–11]. This need for empirical detergent screening
stems from a lack of understanding of the physical forces between
the detergent micelle and membrane protein.
Micelle size, shape, and detergent concentration need to be
considered in evaluating a PDC for structural and biochemical
studies. For instance, recent evidence suggests that the micelle
hydrophobic thickness needs to match that of the membrane
protein to maintain proper fold and function [12–14] (similar to
the hydrophobic match proposed for membrane proteins in
bilayers [15–19]). Therefore, a systematic investigation of the size
and shape determinants of pure micelles will provide a baseline
and foundation for the further understanding of micelle-protein
interactions.
In this study, the sizes and shapes of micelles formed by four
classes of detergents, phosphocholines, maltosides, glucosides, and
lysophosphatidyl glycerols (Table 1), are investigated using small-
angle X-ray scattering (SAXS). The detergents were selected based
on their prevalence in membrane protein structural biology.
Approximately 40% of the ,115 membrane protein structures
determined by NMR were prepared in dodecyl phosphocholine
(FC12) micelles while nearly 40% of the ,1200 membrane protein
structures determined by X-ray crystallography were in octyl
glucoside (OG), decyl maltoside (DM), or dodecyl maltoside
PLOS ONE | www.plosone.org 1 May 2013 | Volume 8 | Issue 5 | e62488
(DDM) micelles [20]. Lysophosphatidyl glycerols (LPGs) have also
facilitated solution NMR investigations of membrane proteins
[21]. For each detergent class, multiple alkyl chain lengths were
studied to address structure similarities within the class as well as
common trends among all classes.
To date, few experimental studies have systematically investi-
gated the effects of detergent structure on micelle geometry. In
addition, a limited number of detergents and alkyl chain lengths
have been investigated and inconsistencies in buffer conditions and
methodologies between studies complicate comparison of deter-
gent micelle properties. This study experimentally correlates the
monomer detergent structure with micelle physical properties so
that micelle shapes and sizes can be more accurately predicted, in
particular with a view towards assessing PDC structure and
function.
The shapes and sizes of micelles formed by the eleven detergents
(Table 1) were analyzed under the same experimental conditions.
The model independent and dependent parameters were then
analyzed to establish trends in micelle size and shape. With an
increase in the alkyl chain by a carbon atom, the aggregation
number increases by 1663 detergent monomers. The short axis of
the micelles increases with a distance expected for an additional
alkyl carbon, while ellipticity (the ratio of the minor and major
axes) is maintained. These results establish ellipsoid micelle models
that are consistent through a detergent series and are expected to
provide predictive measures for other detergent micelle size and
shapes.
Materials and Methods
Sample PreparationThe detergents n-decyl-phosphocholine (FC10), n-dodecyl-
phosphocholine (FC12), n-tetradecyl-phosphocholine (FC14), n-
octyl-b-D-glucopyranoside (OG), n-nonyl-b-D-glucopyranoside
(NG), n-decyl-b-D-glucopyranoside (DG), n-octyl-b-D-maltopyra-
noside (OM), n-decyl-b-D-maltopyranoside (DM), and n-dodecyl-
b-D-maltopyranoside (DDM) (Fig. S1) were purchased from
Anatrace (Affymetrix). The lysophospholipid detergents 1-myris-
toyl-2-hydroxy-sn-glycero-3-phospho-(19-rac-glycerol) (14:0 Lyso
PG, LMPG) and 1-palmitoyl-2-hydroxy-sn-glycero-3-phospho-
(19-rac-glycerol) (16:0 Lyso PG, LPPG) were purchased from
Avanti Polar Lipids. Deuterium oxide (D2O) was purchased from
Cambridge Isotope Labs and all other chemicals were obtained
from Fisher Scientific, unless otherwise noted.
Several concentrations up to 200 mM were prepared for each
detergent in a final buffer consisting of 20 mM phosphate buffer,
pH 6.2, 150 mM NaCl, and 10% v/v D2O (necessary for the
NMR deuterium lock). Detergent monomers do not contribute
significantly to the observed scattering [22], and all scattering
profiles presented are at concentrations well above the cmc
(Table 1). Detergent concentrations were verified using 1D 1H-
NMR and standards of known concentration.
Three molecular weight standards were used for the X-ray
scattering experiments: hen egg white lysozyme in 40 mM acetate
buffer, pH 3.8 with 150 mM NaCl, horse heart cytochrome c
(Sigma) in 100 mM acetate buffer, pH 4.6 with 0.5 M guanidi-
nium hydrochloride, and bovine serum albumin (Sigma) in
20 mM HEPES buffer, pH 7.8 with 50 mM NaCl. Five concen-
trations were measured for each protein standard (up to 10.6 mg/
mL lysozyme, 4.2 mg/mL cytochrome c, and 8.6 mg/mL
albumin) to determine any concentration dependent effects on
the scattering. The scattering profiles that did not demonstrate
concentration dependent changes were used to calculate k, the
proportionality constant in Equation 6 (see Methods S1) that is
used to determine micelle aggregation numbers.
SAXS Data CollectionSAXS data were measured at the XOR/BESSRC undulator
beam line 12-ID-B of the Advanced Photon Source (Argonne, IL),
with a sample-to-detector distance of 2 m and a Pilatus 2 M
detector. The data were collected at 25uC using a custom-made
sample holder [23] and an X-ray energy of 12 keV (corresponding
Table 1. Physical properties of pure detergents.
Detergent (abbreviation) FW (Da) cmc (mM)Vmon
a
(A3)rdet
b
(e/A3) Nlit.
n-decylphosphocholine (FC10) 323 11c 494 0.360 24c, 45–53 [22]
n-dodecylphosphocholine (FC12) 351 1.5c 548 0.354 54c, 60–80 [22]
n-tetradecylphosphocholine (FC14) 380 0.12c 602 0.348 108c
n-octyl-b-D-glucopyranoside (OG) 292 18–20 [38] 419 0.382 87 [39], 27–100 [38]
n-nonyl-b-D-glucopyranoside (NG) 306 6.5c 446 0.377 133c
n-decyl-b-D-glucopyranoside (DG) 320 2.2 [40] 472 0.373 200–400 [41]
n-octyl-b-D-maltopyranoside (OM) 454 19.5c 590 0.416 6c, 26 [42]
n-decyl-b-D-maltopyranoside (DM) 483 1.8 [43] 644 0.407 69c, 82–90 [22]
n-dodecyl-b-D-maltopyranoside (DDM) 511 0.17 [44] 698 0.398 132 [36], 78–149 [44], 135–145 [22,45]
1-myristoyl-2-hydroxy-sn-glycero-3- phosphor-(19-rac-glycerol) (LMPG) 478 0.16 [46] 639 0.404 55d
1-palmityl-2-hydroxy-sn-glycero-3- phosphor-(19-rac-glycerol) (LPPG) 507 0.018 [46] 693 0.395 160–170 [22]
aMonomer volumes were calculated from published specific densities, using the Tanford formula (Vtail = N*(24.7+26.9nc)) for alkyl chain volumes to adjust for differentchain lengths.bThe detergent electron density values were computed by summing the number of electrons from the chemical composition and dividing by the molecular volume.cMeasurements performed by Anatrace (Affymetrix, Inc.). All cmcs are reported for conditions of detergent in H2O, except for the cmc of OM which is reported in 20 mMHEPES, pH 7.5 with 100 mM NaCl. Aggregation numbers from ref. [24] are reported in the same buffer used in this study.dA measured value was not found in the literature; although many studies report this aggregation number. However, an estimate can be made from the PDC molecularweight reported by Tian et al. of ,60 kD [47] (detergent contribution of 44 kD), which yields an aggregation number of ,90.doi:10.1371/journal.pone.0062488.t001
Micelle Size and Shape
PLOS ONE | www.plosone.org 2 May 2013 | Volume 8 | Issue 5 | e62488

to a wavelength of l = 1 A). The useable range of momentum
transfer q was 0.02,q,0.3 A21 (q = 4p sin(h)/l, where 2h is the
scattering angle and l is the x-ray wavelength). Additional
descriptions of the beamline setup and measurement are
previously published [23–25].
For the protein molecular weight standard samples, five
exposures of 0.1 s were collected, image corrected, and circularly
averaged. For the detergent samples, at least five exposures of 0.5 s
each were collected. The absence of radiation damage was
confirmed by comparing subsequent exposures of the same sample
with no significant changes in the SAXS profile detected (data not
shown). The five resulting profiles for each condition were
averaged to improve signal quality. Matched buffer profiles were
collected using identical procedures and subtracted from the
sample scattering for background correction.
Analysis of the SAXS profiles for each sample followed the
procedures outlined in Lipfert, et al. [22] for determination of
micelle size and shape parameters (Methods S1). One noted
exception was the use of a nonlinear, least-square fitting routine
implemented in Igor Pro (WaveMetrics) as part of the NCNR
analysis toolkit [26] to fit the two component (core-shell) models to
the full scattering profiles (e.g. sphere, oblate, and prolate; Fig. 1).
Although designed to model fits to small-angle neutron scattering
(SANS) data, this procedure was readily adapted to SAXS data by
replacing scattering length densities (effective atomic scattering
powers in SANS) with electron densities for the micelle core and
shell components. Agreement between model-independent and
similar model-derived values was used for additional validation of
the modeling approach.
Results and Discussion
Eleven micelle-forming detergents, classified by head group
structure, were chosen for this study: zwitterionic phosphocholines
with 10-, 12-, and 14-carbon alkyl chains, nonionic glucosides with
8-, 9-, and 10-carbon alkyl chains, nonionic maltosides with 8-, 10-
, and 12-carbon alkyl chains, and ionic lysophosphatidyl glycerols
with 14- and 16-carbon alkyl chains (Table 1). At least one
detergent studied from each of the four classes has demonstrated
success in membrane protein structure determination. Micelle
scattering data were previously published for some detergents from
each class; however, to obtain meaningful trends in micelle size
and shape with changes in chain length, additional detergents
were studied. The concentration series of scattering profiles,
Guinier plots, calculated aggregation numbers, and the best model
fit to the lowest detergent concentration (to reduce contributions
from interparticle interference) for the FC14, OM, DG, and
LMPG are presented in Figure 2, while data showing agreement
with the previously reported detergents [22] are presented in
Figures S2, S3, S4, S5, S6, S7, and S8. The data, fits, and resulting
shapes and sizes of each detergent are described in Results S1,
where we also compare the results to the available literature. The
physical parameters from model-independent (subscript expt is
used) and dependent (subscript model is used) measurements for all
the detergents are provided in Table 2 and Table S1.
In summary, the micelles were modeled using a two-component
ellipsoid (Fig. 1) for which the ellipsoidal dimensions (a, b. and t),
and the radius of gyration (Rgmodel) and aggregation number (Nmodel)
were determined (Table 2). In addition, model independent
parameters (Rgexpt, Nexpt,and Lexpt) were measured or calculated
directly from the scattering profile or from Guinier analysis of the
low q data (Table 2). For further description of the physical
parameters and determination of each, see Methods S1. Micelle
geometries (sphere, oblate/prolate ellipsoid) for each detergent
were determined by comparing the fits for each shape to the
experimental SAXS profile (Fig. S9) and considering any physical
constraints imposed on the model. In addition, a cylindrical model
was applied to the DG scattering profile (Fig. S10), but did not
provide a more reasonable fit (see Results S1). The phosphocho-
line micelle models share a common 2.7–3.0 A uniform shell
thickness and a prolate ellipsoid geometry. The maltoside micelle
models share a common 5.4–5.8 A uniform shell thickness and an
oblate ellipsoid geometry. The glucoside micelle models share a
common 2.9–3.5 A uniform shell thickness and an oblate ellipsoid
geometry. Finally, the LPG micelle models share a common 5.3–
6.1 A uniform shell thickness and an oblate ellipsoid geometry. All
detergent micelle models have a minor core axis approximating
the length of a detergent monomer with almost fully extended
alkyl chains. The four detergent types with multiple alkyl chain
lengths provided a foundation for a systematic investigation of the
trends in micelle size and shape with varied detergent properties.
Comparison of the Two-component Ellipsoid Models andModel-free Derived Parameters
In order to validate the core-shell ellipsoid micelle model fits to
the experimental data, comparisons were made between param-
eters that could be determined both from the geometric model and
directly from the scattering profile (model-independent). The
agreement between the model-independent radius of gyration,
aggregation number, and dominant head group to head group
length and that of the models strongly support the proposed
ellipsoid models.
Radius of gyration (Rg). The radii of gyration calculated
from the geometric model (Rgmodel) are near or within the reported
Figure 1. Two-component core-shell models used to representthe hydrophobic micelle core and hydrophilic head groupshell. Schematic of the core-shell models having core axial dimensionsof a and b with a uniform shell thickness of t for a (A) sphere (a = b), (B)prolate ellipsoid (a.b), and (C) oblate ellipsoid (a,b). The alkyl chaincore is typically less electron dense (0.27–0.29 e/A3) than the solvent(0.33–0.34 e/A3) and the detergent head group shell (0.49–0.52 e/A3).These differences in scattering power, along with size and shape of themicelle determine the form factors of the SAXS profile (see Methods S1for additional descriptions of SAXS theory and core-shell ellipsoidmicelle models). Panel (D) shows a comparison of the expected formfactors resulting from each of the three different model geometries:prolate ellipsoid in green (a/b = 2); oblate ellipsoid in blue (b/a = 2); andsphere in red (a/b = 1). Core and shell volumes, and electron densities(r1 = 0.28, r2 = 0.50, rs = 0.337) were kept constant; sphere,a = b = 20.0 A, t = 5.0 A; prolate ellipsoid, a = 31.7 A, b = 15.9 A,t = 4.8 A; oblate ellipsoid, a = 12.6 A, b = 25.2 A, t = 4.8 A.doi:10.1371/journal.pone.0062488.g001
Micelle Size and Shape
PLOS ONE | www.plosone.org 3 May 2013 | Volume 8 | Issue 5 | e62488

error from the Guinier analysis of the experimental data (Rgexpt) for
all the detergents except the glucosides and FC14 (Table 2 and
Fig. 3). However, evaluation of the values derived from the
Guinier analysis must be taken with care as the scattering profile
can be altered by attractive and/or repulsive effects between
micelles (particularly at high concentrations), complicating accu-
rate calculation of I(0) and Rg. In the case of FC14 and the
glucosides, where there is some disagreement between the two Rg
values, deviation from linearity in the low q region of the Guinier
Figure 2. Scattering data, Guinier analysis, and core-shell ellipsoid fit for FC14, OM, DG, and LMPG. (A) SAXS profiles (I(q)) for eachdetergent at total detergent concentrations of FC14: 58 (red), 78 (purple), 97 (green), 147 (brown), and 199 (cyan) mM; OM: 36 (yellow), 56 (red), 75(purple), 95 (green), 146 (brown), and 195 (cyan) mM; DG: 12.5 (blue), 25 (yellow), and 50 (red) mM; and LMPG: 16 (blue), 36 (yellow), 54 (red), 75(purple), 94 (green), 144 (brown), and 193 (cyan) mM. (B) Guinier plot (ln(I) as a function of q2) of the low angle data (same color scheme as part A)and Guinier fits (black lines). For DG, the Guinier region deviated from linearity at low q (denoted by *) as described in the results, and preventedaccurate extrapolation to zero-scattering angle. Thus, aggregation numbers for DG could not be determined from the I(0) method, and the plot(panel D, see below) is not presented. An increase in scattering signal with increasing concentration is generally observed, except for LMPG at highconcentration and low q (denoted with **) where interparticle effects described in the results become more apparent at higher concentrations. (C)Two-component ellipsoid fit (black solid line) and scattering intensity recorded at low detergent concentration (same color scheme as part A). Theresiduals of the fit are shown in the upper inset. Fit parameters are presented in Table 2. (D) Apparent aggregation numbers Nexpt (squares, samecolor scheme as in part A) obtained from the extrapolated forward scattering intensity and eq 7 described in Methods S1. The point at 0 mM (black)corresponds to the estimate obtained by linearly extrapolating the measured profiles for [c–cmc] #100 mM to zero micelle concentration (i.e. cmc).Errors are obtained from repeat fits using measurements from three molecular weight standards. Additional descriptions of micelle measurementsand calculations can be found in Methods S1.doi:10.1371/journal.pone.0062488.g002
Micelle Size and Shape
PLOS ONE | www.plosone.org 4 May 2013 | Volume 8 | Issue 5 | e62488

plots indicates micelle interactions that lead to an over-estimation
of the size of the micelle.
Aggregation number (N). Aggregation numbers calculated
from the hydrophobic core volume of the micelle model (Nmodel)
were consistently larger (by about 10 monomers per micelle) than
the aggregation numbers determined from the extrapolated
forward scattering intensity (Nexpt) (Table 2 and Fig. 4A). This
discrepancy between the aggregation numbers may be attributed
to the additional separation between monomers, or monomer
dynamics, in the micelle that is not accounted for in the direct
volume calculation; that is, closest packing is assumed in the
calculation. Although the geometric model parameters showed
negligible concentration dependence (data not shown), a concen-
tration dependence was observed in Nexpt (Fig. 2D) and Rgexpt (data
not shown), which was more pronounced in the charged micelles.
The aggregation number from the forward scattering represents
the value extrapolated back to the cmc concentration (zero micelle
concentration) to provide an estimate free of concentration-
dependent effects. The agreement of the experimentally deter-
mined aggregation numbers with the values reported in the
literature further support the validity of the models. However, it
should be noted that while the aggregation numbers determined
for OM are consistent with the linear trends observed for the
dependence of aggregation number on alkyl chain length
(discussed below), these values do not agree with the available
data from Affymetrix, Inc. (Table 1). Aggregation numbers from
the forward scattering intensity are not reported for the glucoside
detergents in this study (due to unreliable extrapolations of
scattered intensity to zero scattering angle), and uncertainties in
the wide range of published values provide only a qualitative
comparison.
Dominant head group to head group length (L). The
dominant head group to head group length describes the most
frequently occurring distance between head groups separated by a
pair of alkyl chains across the micelle. The 2nd peak in the
scattering profile provides a model-free assessment of the most
frequently observed length scale, correlating to this distance L
[13,22]. The length between opposing head groups from the
model (Lmodel) are mostly within error or slightly shorter (1–2 A)
than the corresponding distance determined from the position of
the 2nd peak in the SAXS profile (Lexpt), except for FC10 and FC12
which are 1–2 A longer (Table 2 and Fig. 5A). A comparison
between the two measured dominant head group to head group
lengths was also useful in assessing the micelle model ellipsoid
shape (oblate vs. prolate). Some fits to the scattering profiles did
not agree with the structure of the detergent monomer and the
observed Lexpt; thus, they were not considered accurate models.
Additionally, the dominant head group to head group length (Lexpt)
is measured at intermediate scattering angles and is not susceptible
to the inter-particle interference observed at low q.
Table 2. Geometrical parameters of detergent micelles.
detergent shaper1
(e/A3)r2
(e/A3)a(A)
b(A)
t(A) a/b
Rgexpt
(A)Rgmodel
(A)Lexpt
(A)Lmodel
(A) Nexpt Nmodel
FC10 (59 mM) prolate 0.273 0.490 20.4–20.9 13.3–13.6 2.7–3.0 1.52–1.55 25.960.2 24.260.5 27.6–28.2 29.3–30.2 39–45 50–56
FC12 (77 mM) prolate 0.277 0.490 24.3–24.8 16.1–16.4 2.7–3.0 1.49–1.52 34.560.8 32.660.5 33.9–34.5 34.9–35.8 68–80 72–80
FC14 (97 mM) prolate 0.280 0.490 29.6–30.1 18.8–19.1 2.7–3.0 1.57–1.60 50.2 a 63.7 44.660.5 41.4–42.0 40.3–41.2 88–91 106–116
OG (50 mM) oblate 0.268 0.540 10.6–11.4 20.6–21.4 2.9–3.5 0.51–0.55 29.6b 62.2 23.560.5 26.9–27.5 24.1–26.3 n.d.b 70–90
NG (50 mM) oblate 0.271 0.540 12.1–12.9 20.7–21.5 2.9–3.5 0.58–0.62 34.2b 62.3 24.260.5 29.6–30.2 27.1–29.3 n.d.b 80–100
DG (50 mM) oblate 0.273 0.540 13.5–14.3 22.6–23.4 2.9–3.5 0.60–0.64 n.d.b 27.560.5 32.1–32.7 29.9–32.1 n.d.b 100–120
OM (56 mM) oblate 0.268 0.520 11.0–11.4 18.4–18.8 5.4–5.8 0.59–0.61 22.060.1 21.160.5 27.9–28.5 27.4–28.6 35–47 65–71
DM (80 mM) oblate 0.273 0.520 13.4–13.8 22.7–23.1 5.4–5.8 0.59–0.61 26.260.1 25.660.5 33.4–34.0 32.2–33.4 86–103 98–104
DDM (94 mM) oblate 0.277 0.520 15.7–16.1 27.9–28.3 5.4–5.8 0.56–0.58 31.860.1 30.760.5 39.4–40.0 36.8–38.0 135–149 145–155
LMPG (16 mM)oblate 0.280 0.470 16.6–17.6 23.5–24.5 5.3–6.1 0.70–0.73 26.962.4 28.860.5 38.7–39.3 38.5–41.3 63–69 90–100
LPPG21
(25 mM)oblate 0.281 0.470 19.0–20.0 28.4–29.4 5.3–6.1 0.67–0.70 35.762.5 34.560.5 45.2–45.8 43.3–46.1 160–170 140–150
aFor FC14, an average Rgexpt from the lower concentration data (#150 mM) was used because deviation from linearity in the Guinier region was observed;bThe Guinier regions for the glucosides are mostly nonlinear in the range that q*Rg,1.3, however estimations were made from lower concentration data wherepossible. In addition, the rise in intensity as q 0 precluded the determination of forward scattering intensities and thus Nexpt could not be determined.Parameters were obtained from optimal core-shell ellipsoid model fits to the experimental SAXS data at given total concentrations of detergent in solution.doi:10.1371/journal.pone.0062488.t002
Figure 3. Radii of gyration obtained from Guinier fits and theellipsoid models correlate. Radii of gyration (Rg’s) for varied alkylchain lengths of phosphocholine (m), glucoside (N), maltoside (&), andlysophosphatidyl glycerol (.) detergent head groups were determinedfrom Guinier analysis of the low angle scattering data and calculatedfrom the model geometry (Methods S1). A correlation plot illustratesthe agreement between the Rg determined from the Guinier analysis ofthe scattering data (Rgexpt) with the Rg calculated from the modelgeometry (Rgmodel) for each detergent. The dashed line represents aperfect correlation between the two approaches.doi:10.1371/journal.pone.0062488.g003
Micelle Size and Shape
PLOS ONE | www.plosone.org 5 May 2013 | Volume 8 | Issue 5 | e62488

Head Group – Head Group Distances Increase with AlkylChain Length
With the data from multiple detergents systematically varying in
chain length, the dependence of micelle physical parameters on
chain length and head group could be investigated. The dominant
head group – head group distances as determined from the
position of the second maximum in the scattering profile (Lexpt) are
plotted as a function of alkyl chain length in Figure 5B. In each
class of detergents studied, the dominant distance between head
groups across the micelle increases by 2.5–3.0 A with the addition
of each carbon to the alkyl chain (note that the distance across the
micelle contains two opposing alkyl chains). The short axial
dimension of the fitted ellipsoid models similarly increases by 2.5–
3.0 A with each added alkyl carbon, while the thickness of the
outer shell in the two-component is independent on alkyl chain
length, as expected (Table 2). The short ellipsoid axis dimension
increases by ,2.5 A for every two carbons added to the alkyl
chain for the phosphocholines, ,2.4 A for every two carbons
added to the alkyl chain for the maltosides, ,1.5 A for each
carbon added to the alkyl chain for the glucosides, and ,2.5 A for
the two carbon increase in the LPG tail length (Table 2). The
average increase in alkyl chain length per added carbon unit for all
micelles in this study is approximately 1.3160.13 A (length of
short axis (a or b) divided by the number of carbons), which is in
good agreement with the additional length expected by the
addition of each carbon, ,1.27 A from Tanford’s formula [27] for
the maximum extension of the alkyl chain (lc = 1.5+1.265 nc).
Aggregation Numbers Increase with Carbon ChainLength
The aggregation numbers calculated from the model for each
detergent are plotted as a function of alkyl chain length in
Figure 4. Dependence of aggregation number on alkyl chainlength. (A) The relationship between aggregation numbers deter-mined from hydrophobic core volume (Nmodel) and Guinier analysis(Nexpt) is shown using same shapes for phosphocholine (m), maltoside(&), and lysophosphatidyl glycerol (.) head groups with a dashed lineillustrating Nmodel = Nexpt. (B) Aggregation numbers for each alkyl chainseries using the same symbols as in (A), as well as glucoside (N), (N-alkylamino)-1-deoxylactitol [30] (%), and sucrose ester [31] (e) headgroups, are plotted against the number of carbons comprising the alkylchain. Solid lines (and dashed line for sucrose esters and lactitols) arelinear fits to each data series, calculated from the hydrophobic corevolume (Nmodel). Equations and quality of fit are as follows: (m),N = 14.5 nc –94, R2 = 0.986; (N), N = 15.0 nc –42, R2 = 0.964; (&), N = 20.5nc –97, R2 = 0.998; (%), N = 13.5 nc –75, R2 = 0.999; (e), N = 14.5 nc –79,R2 = 0.944. Lysophosphatidyl glycerols fits are not reported since thereare only two data points in the series.doi:10.1371/journal.pone.0062488.g004
Figure 5. Dependence of dominant distance between headgroups across the micelle on alkyl chain length. The dominantdistances between head groups across the micelle are shown forphosphocholine (m), glucoside (N), maltoside (&), and lysopho-sphatidyl glycerol (.) detergents. (A) The correlation is shown betweenthe dominant distance determined from the position of the secondpeak in the experimental SAXS profiles (Lexpt) and the correspondingdistance estimated from the model fit (Lmodel). The dashed linerepresents a perfect correlation between the two approaches. (B) Thedistance determined from the best model fit for each detergent (Lmodel)is plotted as a function of the number of carbons in the detergent’salkyl chain (nc). The dotted line represents the distance of two alkylchains having a fully extended hydrocarbon chain according toTanford’s formula for alkyl chain length.doi:10.1371/journal.pone.0062488.g005
Micelle Size and Shape
PLOS ONE | www.plosone.org 6 May 2013 | Volume 8 | Issue 5 | e62488
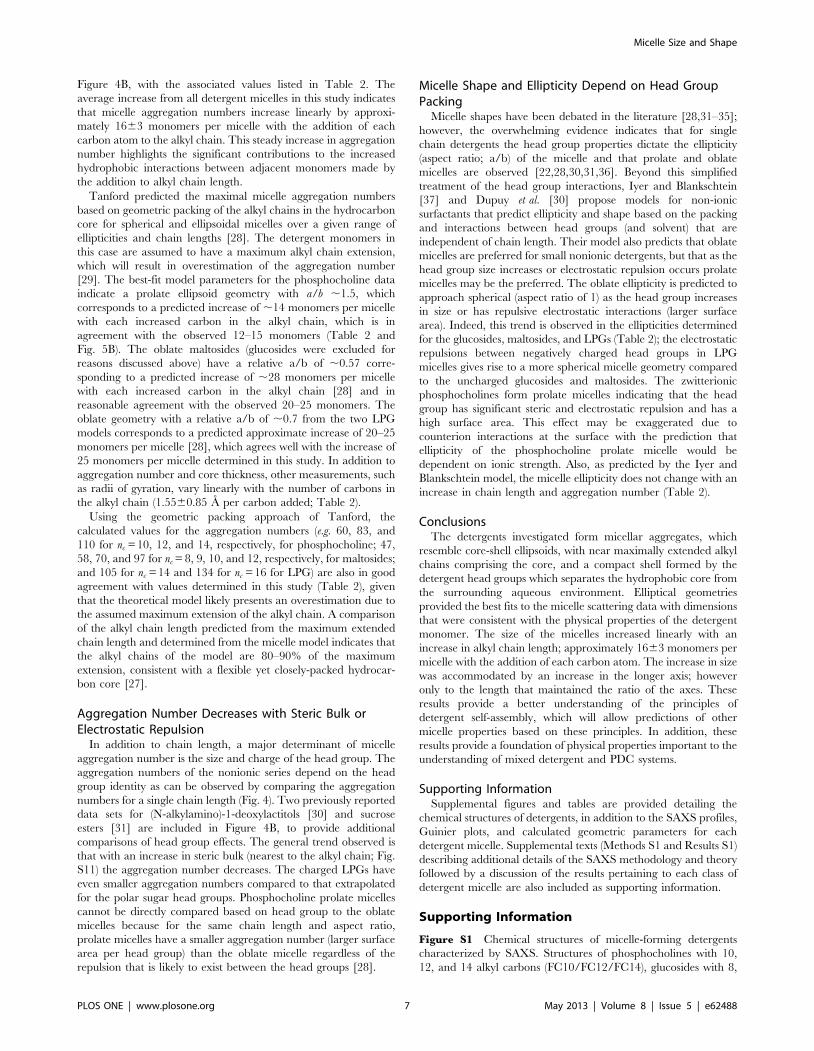
Figure 4B, with the associated values listed in Table 2. The
average increase from all detergent micelles in this study indicates
that micelle aggregation numbers increase linearly by approxi-
mately 1663 monomers per micelle with the addition of each
carbon atom to the alkyl chain. This steady increase in aggregation
number highlights the significant contributions to the increased
hydrophobic interactions between adjacent monomers made by
the addition to alkyl chain length.
Tanford predicted the maximal micelle aggregation numbers
based on geometric packing of the alkyl chains in the hydrocarbon
core for spherical and ellipsoidal micelles over a given range of
ellipticities and chain lengths [28]. The detergent monomers in
this case are assumed to have a maximum alkyl chain extension,
which will result in overestimation of the aggregation number
[29]. The best-fit model parameters for the phosphocholine data
indicate a prolate ellipsoid geometry with a/b ,1.5, which
corresponds to a predicted increase of ,14 monomers per micelle
with each increased carbon in the alkyl chain, which is in
agreement with the observed 12–15 monomers (Table 2 and
Fig. 5B). The oblate maltosides (glucosides were excluded for
reasons discussed above) have a relative a/b of ,0.57 corre-
sponding to a predicted increase of ,28 monomers per micelle
with each increased carbon in the alkyl chain [28] and in
reasonable agreement with the observed 20–25 monomers. The
oblate geometry with a relative a/b of ,0.7 from the two LPG
models corresponds to a predicted approximate increase of 20–25
monomers per micelle [28], which agrees well with the increase of
25 monomers per micelle determined in this study. In addition to
aggregation number and core thickness, other measurements, such
as radii of gyration, vary linearly with the number of carbons in
the alkyl chain (1.5560.85 A per carbon added; Table 2).
Using the geometric packing approach of Tanford, the
calculated values for the aggregation numbers (e.g. 60, 83, and
110 for nc = 10, 12, and 14, respectively, for phosphocholine; 47,
58, 70, and 97 for nc = 8, 9, 10, and 12, respectively, for maltosides;
and 105 for nc = 14 and 134 for nc = 16 for LPG) are also in good
agreement with values determined in this study (Table 2), given
that the theoretical model likely presents an overestimation due to
the assumed maximum extension of the alkyl chain. A comparison
of the alkyl chain length predicted from the maximum extended
chain length and determined from the micelle model indicates that
the alkyl chains of the model are 80–90% of the maximum
extension, consistent with a flexible yet closely-packed hydrocar-
bon core [27].
Aggregation Number Decreases with Steric Bulk orElectrostatic Repulsion
In addition to chain length, a major determinant of micelle
aggregation number is the size and charge of the head group. The
aggregation numbers of the nonionic series depend on the head
group identity as can be observed by comparing the aggregation
numbers for a single chain length (Fig. 4). Two previously reported
data sets for (N-alkylamino)-1-deoxylactitols [30] and sucrose
esters [31] are included in Figure 4B, to provide additional
comparisons of head group effects. The general trend observed is
that with an increase in steric bulk (nearest to the alkyl chain; Fig.
S11) the aggregation number decreases. The charged LPGs have
even smaller aggregation numbers compared to that extrapolated
for the polar sugar head groups. Phosphocholine prolate micelles
cannot be directly compared based on head group to the oblate
micelles because for the same chain length and aspect ratio,
prolate micelles have a smaller aggregation number (larger surface
area per head group) than the oblate micelle regardless of the
repulsion that is likely to exist between the head groups [28].
Micelle Shape and Ellipticity Depend on Head GroupPacking
Micelle shapes have been debated in the literature [28,31–35];
however, the overwhelming evidence indicates that for single
chain detergents the head group properties dictate the ellipticity
(aspect ratio; a/b) of the micelle and that prolate and oblate
micelles are observed [22,28,30,31,36]. Beyond this simplified
treatment of the head group interactions, Iyer and Blankschtein
[37] and Dupuy et al. [30] propose models for non-ionic
surfactants that predict ellipticity and shape based on the packing
and interactions between head groups (and solvent) that are
independent of chain length. Their model also predicts that oblate
micelles are preferred for small nonionic detergents, but that as the
head group size increases or electrostatic repulsion occurs prolate
micelles may be the preferred. The oblate ellipticity is predicted to
approach spherical (aspect ratio of 1) as the head group increases
in size or has repulsive electrostatic interactions (larger surface
area). Indeed, this trend is observed in the ellipticities determined
for the glucosides, maltosides, and LPGs (Table 2); the electrostatic
repulsions between negatively charged head groups in LPG
micelles gives rise to a more spherical micelle geometry compared
to the uncharged glucosides and maltosides. The zwitterionic
phosphocholines form prolate micelles indicating that the head
group has significant steric and electrostatic repulsion and has a
high surface area. This effect may be exaggerated due to
counterion interactions at the surface with the prediction that
ellipticity of the phosphocholine prolate micelle would be
dependent on ionic strength. Also, as predicted by the Iyer and
Blankschtein model, the micelle ellipticity does not change with an
increase in chain length and aggregation number (Table 2).
ConclusionsThe detergents investigated form micellar aggregates, which
resemble core-shell ellipsoids, with near maximally extended alkyl
chains comprising the core, and a compact shell formed by the
detergent head groups which separates the hydrophobic core from
the surrounding aqueous environment. Elliptical geometries
provided the best fits to the micelle scattering data with dimensions
that were consistent with the physical properties of the detergent
monomer. The size of the micelles increased linearly with an
increase in alkyl chain length; approximately 1663 monomers per
micelle with the addition of each carbon atom. The increase in size
was accommodated by an increase in the longer axis; however
only to the length that maintained the ratio of the axes. These
results provide a better understanding of the principles of
detergent self-assembly, which will allow predictions of other
micelle properties based on these principles. In addition, these
results provide a foundation of physical properties important to the
understanding of mixed detergent and PDC systems.
Supporting InformationSupplemental figures and tables are provided detailing the
chemical structures of detergents, in addition to the SAXS profiles,
Guinier plots, and calculated geometric parameters for each
detergent micelle. Supplemental texts (Methods S1 and Results S1)
describing additional details of the SAXS methodology and theory
followed by a discussion of the results pertaining to each class of
detergent micelle are also included as supporting information.
Supporting Information
Figure S1 Chemical structures of micelle-forming detergents
characterized by SAXS. Structures of phosphocholines with 10,
12, and 14 alkyl carbons (FC10/FC12/FC14), glucosides with 8,
Micelle Size and Shape
PLOS ONE | www.plosone.org 7 May 2013 | Volume 8 | Issue 5 | e62488

9, and 10 alkyl carbons (OG/NG/DG), maltosides with 8, 10, and
12 alkyl carbons (OM/DM/DDM), and lyso-phosphatidyl
glycerols with 14 and 16 alkyl carbons (LMPG/LPPG).
(TIF)
Figure S2 Scattering data, Guinier analysis, and two-shell
ellipsoid fit for FC10. (A) SAXS profiles (I(q)) of FC10 at total
detergent concentrations of 36 (yellow), 59 (red), 76 (purple), 96
(green), 145 (brown), and 194 (cyan) mM. (B) Guinier plot (ln(I) as
a function of q2) of the very low angle data (same color code as part
A) and Guinier fits (black lines). An increase in scattering signal
with increasing concentration is observed. (C) Apparent aggrega-
tion numbers N obtained from the extrapolated forward scattering
intensity and eq 7 (squares, same color code as in part A). The
point at 0 mM (black) corresponds to the estimate obtained by
linearly extrapolating the measured profiles for [c–cmc]
#100 mM to zero micelle concentration (i.e. cmc). Errors are
obtained from repeat fits using measurements from three
molecular weight standards. (D) Two-component ellipsoid fit
(black solid line) and scattering intensity recorded at a detergent
concentration of 36 mM (yellow, as before). The residuals of the fit
are shown in the upper inset. Fit parameters are presented in
Table 2.
(TIF)
Figure S3 Scattering data, Guinier analysis, and two-shell
ellipsoid fit for FC12. (A) SAXS profiles (I(q)) of FC12 at total
detergent concentrations of 36 (yellow), 58 (red), 77 (purple), 95
(green), 145 (brown), and 194 (cyan) mM. (B) Guinier plot (ln(I) as
a function of q2) of the very low angle data (same color code as part
A) and Guinier fits (black lines). An increase in scattering signal
with increasing concentration is observed. (C) Apparent aggrega-
tion numbers N obtained from the extrapolated forward scattering
intensity and eq 7 (squares, same color code as in part A). The
point at 0 mM (black) corresponds to the estimate obtained by
linearly extrapolating the measured profiles for [c–cmc]
#100 mM to zero micelle concentration (i.e. cmc). Errors are
obtained from repeat fits using measurements from three
molecular weight standards. (D) Two-component ellipsoid fit
(black solid line) and scattering intensity recorded at a detergent
concentration of 36 mM (yellow, as before). The residuals of the fit
are shown in the upper inset. Fit parameters are presented in
Table 2.
(TIF)
Figure S4 Scattering data, Guinier analysis, and two-shell
ellipsoid fit for DM. (A) SAXS profiles (I(q)) of DM at total
detergent concentrations of 15 (blue), 36 (yellow), 58 (red), 80
(purple), 99 (green), 152 (brown), and 204 (cyan) mM. (B) Guinier
plot (ln(I) as a function of q2) of the very low angle data (same color
code as part A) and Guinier fits (black lines). An increase in
scattering signal with increasing concentration is observed. (C)
Apparent aggregation numbers N obtained from the extrapolated
forward scattering intensity and eq 7 (squares, same color code as
in part A). The point at 0 mM (black) corresponds to the estimate
obtained by linearly extrapolating the measured profiles for [c–
cmc] #100 mM to zero micelle concentration (i.e. cmc). Errors
are obtained from repeat fits using measurements from three
molecular weight standards. (D) Two-component ellipsoid fit
(black solid line) and scattering intensity recorded at a detergent
concentration of 15 mM (blue, as before). The residuals of the fit
are shown in the upper inset. Fit parameters are presented in
Table 2.
(TIF)
Figure S5 Scattering data, Guinier analysis, and two-shell
ellipsoid fit for DDM. (A) SAXS profiles (I(q)) of DDM at total
detergent concentrations of 17 (blue), 32 (yellow), 57 (red), 75
(purple), 94 (green), 145 (brown), and 194 (cyan) mM. (B) Guinier
plot (ln(I) as a function of q2) of the very low angle data (same color
code as part A) and Guinier fits (black lines). An increase in
scattering signal with increasing concentration is observed. (C)
Apparent aggregation numbers N obtained from the extrapolated
forward scattering intensity and eq 7 (squares, same color code as
in part A). The point at 0 mM (black) corresponds to the estimate
obtained by linearly extrapolating the measured profiles for [c–
cmc] #100 mM to zero micelle concentration (i.e. cmc). Errors
are obtained from repeat fits using measurements from three
molecular weight standards. (D) Two-component ellipsoid fit
(black solid line) and scattering intensity recorded at a detergent
concentration of 17 mM (blue, as before). The residuals of the fit
are shown in the upper inset. Fit parameters are presented in
Table 2.
(TIF)
Figure S6 Scattering data, Guinier analysis, and two-shell
ellipsoid fit for OG. (A) SAXS profiles (I(q)) of OG at total
detergent concentrations of 50 (red), 75 (purple), 100 (green), and
150 (brown) mM. (B) Guinier plot (ln(I) as a function of q2) of the
very low angle data (same color code as part A). Aggregation
numbers were unable to be determined from the I(0) method, and
the plot is not presented. (C) Two-component ellipsoid fit (black
solid line) and scattering intensity recorded at detergent concen-
tration of 50 mM (red, as before). The residuals of the fit are
shown in the upper inset. Fit parameters are presented in Table 2.
(TIF)
Figure S7 Scattering data, Guinier analysis, and two-shell
ellipsoid fit for NG. (A) SAXS profiles (I(q)) of NG at total
detergent concentrations of 25 (blue), 50 (red), 100 (green), and
200 (cyan) mM. (B) Guinier plot (ln(I) as a function of q2) of the
very low angle data (same color code as part A). Aggregation
numbers were unable to be determined from the I(0) method, and
the plot is not presented. (C) Two-component ellipsoid fit (black
solid line) and scattering intensity recorded at detergent concen-
tration of 25 mM (blue, as before). The residuals of the fit are
shown in the upper inset. Fit parameters are presented in Table 2.
(TIF)
Figure S8 Scattering data, Guinier analysis, and two-shell
ellipsoid fit for LPPG. (A) SAXS profiles (I(q)) of LPPG at total
detergent concentrations of 5 (blue), 10 (yellow), 25 (red), 50
(purple), 100 (green), 150 (brown), and 200 (cyan) mM. (B) Guinier
plot (ln(I) as a function of q2) of the very low angle data (same color
code as part A) and Guinier fits (black lines). An increase in
scattering signal with increasing concentration is observed. Note
that the Guinier region at high concentrations is highly distorted
by interparticle repulsions between charged micelles. As this data
was not collected with the same molecular weight standards,
aggregation numbers determined from the forward scattering are
not shown. (C) Two-component ellipsoid fit (black solid line) and
scattering intensity recorded at detergent concentration of 5 mM
(blue, as before). The residuals of the fit are shown in the upper
inset. Fit parameters are presented in Table 2.
(TIF)
Figure S9 Best core-shell model fits using different geometries
(oblate/prolate ellipsoid and sphere) to micelle scattering profiles
for multiple alkyl chain lengths of each detergent class. (A) SAXS
profiles (I(q)) of phosphocholine detergents (FC10: blue, FC12:
green, and FC14: red) at total detergent monomer concentrations
Micelle Size and Shape
PLOS ONE | www.plosone.org 8 May 2013 | Volume 8 | Issue 5 | e62488

of 59, 77, and 97 mM (corresponding to ,1 mM of micelle),
respectively, with the best model fits for each geometry shown as
black lines. Residuals are shown above for each alkyl chain length
using the same color coding. Similar comparisons are shown for:
(B) maltoside detergents (OM: blue, DM: green, and DDM: red) at
total monomer concentrations of 56, 80, and 94 mM, respectively,
(C) glucoside detergents (OG: blue, NG: green, and DG: red) at
total monomer concentrations of 50 mM, and (D) lysopho-
sphatidyl glycerol detergents (LMPG: blue and LPPG: red) at
total monomer concentrations of 16 and 25 mM, respectively.
(TIF)
Figure S10 Comparison of sphere (red), oblate ellipse (blue), and
cylinder (cyan) geometrical model fits to OG scattering data. The
sphere model contains a core radius of 17.1 A with a shell
thickness of 3.6 A. The ellipse model is oblate and contains a core
with semi-axes of 21.4 A and 10.5 A with a shell thickness of
3.1 A. The cylinder model has a core radius of 12.3 A with a shell
thickness of 2.9 A, and total length of 92.9 A. Core, shell, and
solvent contrasts were consistent between the models.
(TIF)
Figure S11 Head groups of each of the nonionic detergents
compared in Figure 4. The atom attached to the alkyl chain is
indicated by an arrow. The head groups are in order of increasing
steric bulk from left to right (glucose,maltose,lactitol < sucrose
ester).
(TIF)
Table S1 Values of geometric model fits to the scattering profiles
for each detergent studied classified by model shape (oblate/
prolate ellipsoid and sphere).
(DOCX)
Methods S1 Supporting information for methods of determin-
ing micelle size and shape from small angle X-ray scattering data.
(DOCX)
Results S1 Supporting information and results of micelle
physical properties with comparison to relevant studies.
(DOCX)
Acknowledgments
The authors thank Sonke Seifert for help with data collection at the
Advanced Photon Source of Argonne National Laboratories and Dr.
Alison Dewald for helpful comments on the manuscript. Use of the
Advanced Photon Source, an Office of Science User Facility operated for
the U.S. Department of Energy (DOE) Office of Science by Argonne
National Laboratory, was supported by the U.S. DOE under Contract No.
DE-AC02-06CH11357.
Author Contributions
Conceived and designed the experiments: JL SD LC. Performed the
experiments: RCO RHL DAF. Analyzed the data: RCO JL SD LC.
Contributed reagents/materials/analysis tools: LC. Wrote the paper: RCO
JL LC.
References
1. Wennerstrom H, Lindman B (1979) Micelles. Physical chemistry of surfactant
association. Phys Rep 52: 1–86. Available: http://www.sciencedirect.com/
science/article/pii/0370157379900875.
2. Columbus L, Lipfert J, Klock H, Millett I, Doniach S, et al. (2006) Expression,
purification, and characterization of Thermotoga maritima membrane proteins
for structure determination. Protein Sci 15: 961–975. Available: http://
onlinelibrary.wiley.com/doi/10.1110/ps.051874706/full.
3. Garavito R, Ferguson-Miller S (2001) Detergents as tools in membrane
biochemistry. J Biol Chem 276: 32403–32406. Available: http://www.jbc.org/
content/276/35/32403.short.
4. Sanders CR, Sonnichsen F (2006) Solution NMR of membrane proteins:
practice and challenges. Magn Reson Chem 44S: 24–40. Available: http://
onlinelibrary.wiley.com/doi/10.1002/mrc.1816/abstract.
5. Seddon A, Curnow P, Booth PJ (2004) Membrane proteins, lipids and
detergents: not just a soap opera. Biochim Biophys Acta 1666: 105–117.
Ava i l ab le : h t tp ://www.sc i enced i r ec t . com/sc ience/ar t i c l e/p i i/
S0005273604001610.
6. Denisov IG, Grinkova YV, Lazarides AA, Sligar SG (2004) Directed Self-
Assembly of Monodisperse Phospholipid Bilayer Nanodiscs with Controlled
Size. J Am Chem Soc 126: 3477–3487. Available: http://pubs.acs.org/doi/abs/
10.1021/ja0393574.
7. Sanders CR, Prosser RS (1998) Bicelles: a model membrane system for all
seasons? Structure 6: 1227–1234. Available: http://linkinghub.elsevier.com/
retrieve/pii/S0969212698001233.
8. Bill RM, Henderson PJ, Iwata S, Kunji ER, Michel H, et al. (2011) Overcoming
barriers to membrane protein structure determination. Nat Biotechnol 29: 335–
340. Available: http://www.nature.com/nbt/journal/v29/n4/abs/nbt.1833.
html.
9. Eshaghi S, Hedren M, Nasser MI, Hammarberg T, Thornell A, et al. (2005) An
efficient strategy for high-throughput expression screening of recombinant
integral membrane proteins. Protein Sci 14: 1–8. Available: http://onlinelibrary.
wiley.com/doi/10.1110/ps.041127005/full.
10. Le Maire M, Champeil P, Moller JV (2000) Interaction of membrane proteins
and lipids with solubilizing detergents. Biochim Biophys Acta 1508: 86–111.
Ava i l ab le : h t tp ://www.sc i enced i rec t . com/sc i ence/ar t i c l e/p i i/
S0304415700000101.
11. Prive GG (2007) Detergents for the stabilization and crystallization of membrane
proteins. Methods 41: 388–397. Available: http://www.sciencedirect.com/
science/article/pii/S1046202307000102.
12. Fernandez C, Hilty C, Wider G, Wuthrich K (2002) Lipid-protein interactions
in DHPC micelles containing the integral membrane protein OmpX
investigated by NMR spectroscopy. Proc Natl Acad Sci 99: 13533–13537.
Available: http://www.pnas.org/cgi/doi/10.1073/pnas.212515099.
13. Columbus L, Lipfert J, Jambunathan K, Fox DA, Sim AY, et al. (2009) Mixing
and matching detergents for membrane protein NMR structure determination.
J Am Chem Soc 131: 7320–7326. Available: http://pubs.acs.org/doi/abs/10.
1021/ja808776j.
14. Santonicola MG, Lenhoff AM, Kaler EW (2008) Binding of alkyl polyglucoside
surfactants to bacteriorhodopsin and its relation to protein stability. Biophys J
94: 3647–3658. Available: http://www.sciencedirect.com/science/article/pii/
S0006349508704417.
15. de Planque MR, Killian JA (2003) Protein–lipid interactions studied with
designed transmembrane peptides: role of hydrophobic matching and interfacial
anchoring (Review). Mol Membr Biol 20: 271–284. Available: http://
informahealthcare.com/doi/abs/10.1080/09687680310001605352.
16. Bowie JU (2005) Solving the membrane protein folding problem. Nature 438:
581–589. Available: http://www.nature.com/doifinder/10.1038/nature04395.
17. Baldwin PA, Hubbell WL (1985) Effects of lipid environment on the light-
induced conformational changes of rhodopsin. 2. Roles of lipid chain length,
unsaturation, and phase state. Biochemistry 24: 2633–2639. Available: http://
pubs.acs.org/doi/abs/10.1021/bi00332a007.
18. Lee AG (2004) How lipids affect the activities of integral membrane proteins.
Biochim Biophys Acta 1666: 62–87. Available: http://www.sciencedirect.com/
science/article/pii/S0005273604001592.
19. Pilot JD, East JM, Lee AG (2001) Effects of bilayer thickness on the activity of
diacylglycerol kinase of Escherichia coli. Biochemistry 40: 8188–8195. Available:
http://pubs.acs.org/doi/abs/10.1021/bi0103258.
20. Raman P, Cherezov V, Caffrey M (2006) The Membrane Protein Data Bank.
Cell Mol Life Sci 63: 36–51. Available: http://www.springerlink.com/content/
7q8m567l3746663h/.
21. Krueger-Koplin RD, Sorgen PL, Krueger-Koplin ST, Rivera-Torres IO, Cahill
SM, et al. (2004) An evaluation of detergents for NMR structural studies of
membrane proteins. J Biomol NMR 28: 1–15. Available: http://www.
springerlink.com/content/j766v44m73005118/.
22. Lipfert J, Columbus L, Chu VB, Lesley SA, Doniach S (2007) Size and shape of
detergent micelles determined by small-angle X-ray scattering. J Phys Chem B
111: 12427–12438. Available: http://pubs.acs.org/doi/abs/10.1021/
jp073016l.
23. Lipfert J, Millett I, Seifert S, Doniach S (2006) Sample holder for small-angle x-
ray scattering static and flow cell measurements. Rev Sci Instrum 77: 1–3.
Available: http://rsi.aip.org/resource/1/rsinak/v77/i4/p046108_s1.
24. Beno MA, Jennings G, Engbretson M, Knapp GS, Kurtz C, et al. (2001) Basic
energy sciences synchrotron radiation center undulator sector at the advanced
photon source. Nuc Instrum Methods Phys Res A 467–468: 690–693. Available:
http://www.sciencedirect.com/science/article/pii/S0168900201004557.
25. Seifert S, Winans R, Tiede D, Thiyagarajan P (2000) Design and performance of
a ASAXS instrument at the Advanced Photon Source. J Appl Cryst 33: 782–
784. Available: http://scripts.iucr.org/cgi-bin/paper?S0021889800001333.
Micelle Size and Shape
PLOS ONE | www.plosone.org 9 May 2013 | Volume 8 | Issue 5 | e62488

26. Kline S (2006) Reduction and analysis of SANS and USANS data using IGOR
Pro. J Appl Cryst 39: 895–900. Available: http://scripts.iucr.org/cgi-bin/
paper?S0021889806035059.
27. Tanford C (1980) The hydrophobic effect: formation of micelles and biological
membranes. New York: Wiley.
28. Tanford C (1972) Micelle shape and size. J Phys Chem 76: 3020–3024.
Available: http://pubs.acs.org/doi/abs/10.1021/j100665a018.
29. Dill KA, Flory PJ (1981) Molecular organization in micelles and vesicles. Proc
Natl Acad Sci 78: 676–680. Available: http://www.pnas.org/content/78/2/
676.short.
30. Dupuy C, Auvray X, Petipas C, Anthore R, Costes F, et al. (1996) Small angle
X-ray and neutron scattering study of the micellization of (N-Alkylamino)-1-
deoxylactitols in water. Langmuir 12: 3162–3172. Available: http://pubs.acs.
org/doi/abs/10.1021/la950773e.
31. Kawaguchi T, Hamanaka T, Kito Y, Machida H (1991) Structural studies of a
homologous series of alkyl sucrose ester micelle by x-ray scattering. J Phys Chem
95: 1–10. Available: http://pubs.acs.org/doi/abs/10.1021/j100162a073.
32. Clint JH (1992) Surfactant aggregation. London, UK: Blackie Academic and
Professional.
33. Bogusz S, Venable RM, Pastor RW (2001) Molecular dynamics simulations of
octyl glucoside micelles: Dynamic properties. J Phys Chem B 105: 8312–8321.
Available: http://pubs.acs.org/doi/abs/10.1021/jp004475o.
34. Tieleman DP, van der Spoel D, Berendsen H (2000) Molecular dynamics
simulations of dodecylphosphocholine micelles at three different aggregate sizes:
micellar structure and chain relaxation. J Phys Chem B 104: 6380–6388.
Available: http://pubs.acs.org/doi/abs/10.1021/jp001268f.
35. Israelachvili JN, Mitchell DJ, Ninham BW (1976) Theory of self-assembly of
hydrocarbon amphiphiles into micelles and bilayers. J Chem Soc, Faraday
Transactions 2 72: 1525. Available: http://pubs.rsc.org/en/Content/
ArticleLanding/1976/F2/f29767201525.
36. Dupuy C, Auvray X, Petipas C, Rico-Lattes I (1997) Anomeric effects on the
structure of micelles of alkyl maltosides in water. Langmuir 13: 3965–3967.
Available: http://pubs.acs.org/doi/abs/10.1021/la9604285.
37. Iyer J, Blankschtein D (2012) Are ellipsoids feasible micelle shapes? An answer
based on a molecular-thermodynamic model of nonionic surfactant micelles.
J Phys Chem B 116: 6443–6454. Available: http://pubs.acs.org/doi/abs/10.
1021/jp3012975.
38. Lorber B, Bishop JB, DeLucas L (1990) Purification of octyl b-d-glucopyranoside
and re-estimation of its micellar size. Biochim Biophys Acta, Biomembr. 1023:254–265. Available: http://linkinghub.elsevier.com/retrieve/pii/
000527369090421J.
39. Kameyama K, Takagi T (1990) Micellar properties of octylglucoside in aqueoussolutions. J Colloid Interface Sci 137: 1–10. Available: http://www.
sciencedirect.com/science/article/pii/002197979090037O.40. Helenius A, McCaslin DR, Fries E, Tanford C (1979) Properties of detergents.
Methods Enzymol 56: 734–749. Available: http://www.sciencedirect.com/
science/article/pii/0076687979560662.41. Nilsson F, Soderman O, Hansson P, Johansson I (1998) Physical2Chemical
Properties of C9G1 and C10G1 b-Alkylglucosides. Phase Diagrams andAggregate Size/Structure. Langmuir 14: 4050–4058. Available: http://pubs.
acs.org/doi/abs/10.1021/la980261a.42. He L, Garamus V, Funari S, Malfois M, Willumeit R, et al. (2002) Comparison
of small-angle scattering methods for the structural analysis of octyl-b-
maltopyranoside micelles. J Phys Chem B 106: 7596–7604. Available: http://pubs.acs.org/doi/abs/10.1021/jp020034o.
43. Alpes H, Apell H, Knoll G, Plattner H, Riek R (1988) Reconstitution of Na+/K+-ATPase into phosphatidylcholine vesicles by dialysis of nonionic alkyl
maltoside detergents. Biochim Biophys Acta, Biomembr. 946: 379–388.
Available: http://linkinghub.elsevier.com/retrieve/pii/0005273688904130.44. VanAken T, Foxall-VanAken S, Castleman S, Ferguson-Miller S (1986) Alkyl
glycoside detergents: synthesis and applications to the study of membraneproteins. Methods Enzymol 125: 27–35. Available: http://www.sciencedirect.
com/science/article/pii/S0076687986250053.45. Strop P, Brunger AT (2005) Refractive index-based determination of detergent
concentration and its application to the study of membrane proteins. Protein Sci
14: 2207–2211. Available: http://onlinelibrary.wiley.com/doi/10.1110/ps.051543805/full.
46. Stafford RE, Fanni T, Dennis EA (1989) Interfacial properties and criticalmicelle concentration of lysophospholipids. Biochemistry 28: 5113–5120.
Available: http://pubs.acs.org/doi/abs/10.1021/bi00438a031.
47. Tian C, Vanoye CG, Kang C, Welch RC, Kim HJ, et al. (2007) Preparation,functional characterization, and NMR studies of human KCNE1, a voltage-
gated potassium channel accessory subunit associated with deafness and longQT syndrome. Biochemistry 46: 11459–11472. Available: http://pubs.acs.org/
doi/abs/10.1021/bi700705j.
Micelle Size and Shape
PLOS ONE | www.plosone.org 10 May 2013 | Volume 8 | Issue 5 | e62488