Dependability of Computing Systems
80
Dependability of Computing Systems Jean-Claude Laprie Mastère ENAC - ENSICA — November 2006
Transcript of Dependability of Computing Systems

Dependabilityof Computing Systems
Jean-Claude Laprie
Mastère ENAC - ENSICA — November 2006

Dependability : ability to deliver service that can justifiably be trusted
Service delivered by a system: its behavior as it is perceived by its user(s)
User: another system that interacts with the former
Function of a system: what the system is intended to do
(Functional) Specification: description of the system function
Correct service: when the delivered service implements the systemfunction
System failure: event that occurs when the delivered service deviates fromcorrect service, either because the system does not comply with thespecification, or because the specification did not adequately describe itsfunction
Failure modes: the ways in which a system can fail, ranked according tofailure severities
Dependability: ability to avoid failures that are more frequent or moresevere than is acceptable to the user(s)
When failures are more frequent or more severe than acceptable:dependability failure

Absenceof catastrophic
consequences onthe user(s) and the environment
Continuityof service
Readinessfor usage
Absence of unauthorized disclosure of information
Absenceof improper
systemalterations
Ability toundergo
repairs andevolutions
SafetyReliability ConfidentialityAvailability Integrity Maintainability
SecurityAbsence of unauthorized access to, or handling of, system state
Dependability
Authorized actions

SafetyReliability ConfidentialityAvailability Integrity Maintainability
FaultPrevention
FaultTolerance
FaultRemoval
FaultForecasting
Faults Errors FailuresActivation Propagation Causation
FaultsFailures …… Causation
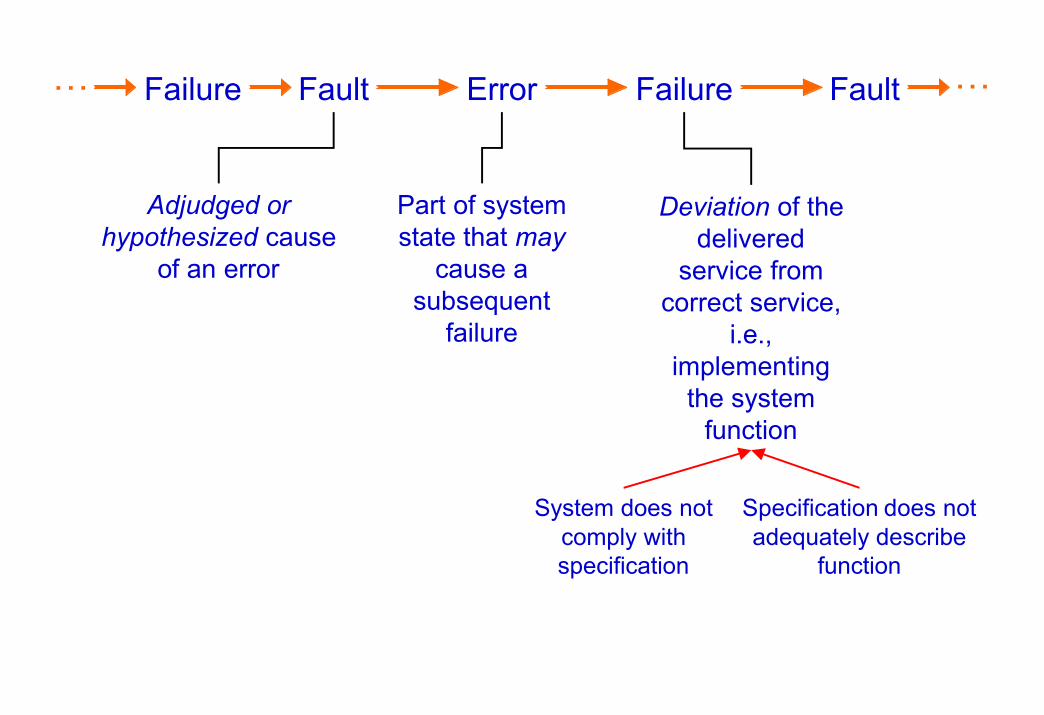
Fault Error Failure
Deviation of thedelivered
service fromcorrect service,
i.e.,implementing
the systemfunction
Part of systemstate that may
cause asubsequent
failure
Adjudged orhypothesized cause
of an error
Failure… …Fault
System does notcomply withspecification
Specification does notadequately describe
function

Internal Fault,
dormant
Error ErrorError
activation
propagation prop.
ServiceInterface
IncorrectService: Outage
CorrectService
Failure
Correct ServiceIncorrectService: Outage
Failure
Occurrence
external fault
Systemboundary
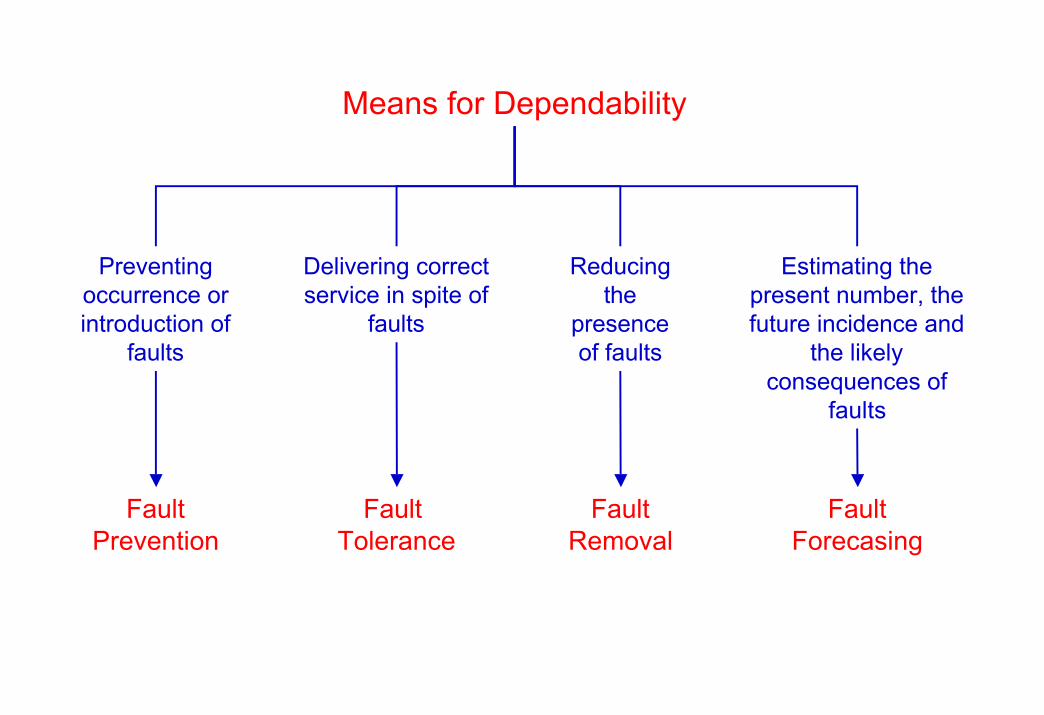
Means for Dependability
Preventingoccurrence orintroduction of
faults
FaultPrevention
Delivering correctservice in spite of
faults
Fault Tolerance
Reducingthe
presenceof faults
FaultRemoval
Estimating thepresent number, thefuture incidence and
the likelyconsequences of
faults
FaultForecasing

Attributes
AvailabilityReliabilitySafetyConfidentialityIntegrityMaintainability
Dependability Means
Fault PreventionFault ToleranceFault RemovalFault Forecasting
ThreatsFaultsErrorsFailures
Security
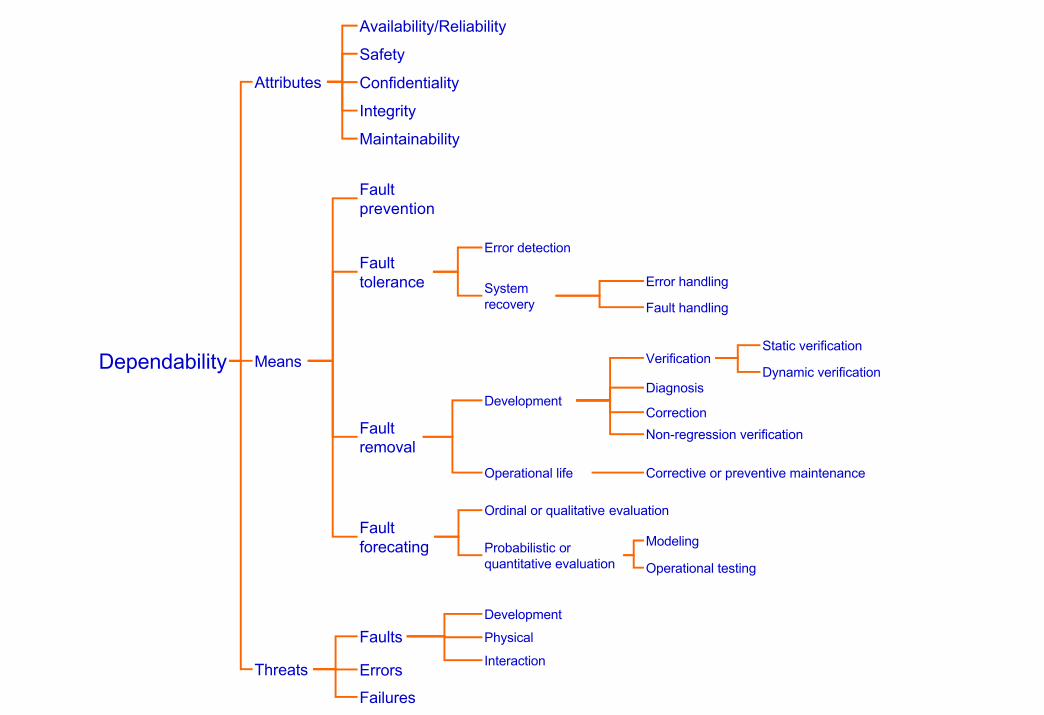
Faultforecating
Ordinal or qualitative evaluation
Probabilistic orquantitative evaluation
Modeling
Operational testing
Faulttolerance
Error detection
Systemrecovery
Error handling
Fault handling
Development
Static verification
Dynamic verificationVerification
Diagnosis
Correction
Non-regression verificationFaultremoval
Operational life Corrective or preventive maintenance
Means
Faultprevention
Attributes
Availability/Reliability
Safety
Confidentiality
Integrity
Maintainability
Threats
Faults
Errors
Failures
Development
Physical
Interaction
Dependability

Faults
Phy
sica
l
Dev
elop
men
t
Inte
ract
ion
Ava
ilabi
lity/
Rel
iabi
lity
Saf
ety
Con
fiden
tialit
y
Loca
lized
Dis
trib
uted
Failures
✔ ✔✔June 1980: False alerts at the North American Air Defense(NORAD)
✔ ✔✔April 1981: First launch of the Space Shuttle postponed
✔ ✔✔June 1985 - January 1987: Excessive radiotherapy doses(Therac-25)
✔ ✔ ✔✔August 1986 - 1987: the "wily hacker" penetrates severaltens of sensitive computing facilities
✔ ✔ ✔✔November 1988: Internet worm
✔ ✔✔15 January 1990: 9 hours outage of the long-distance phonein the USA
✔ ✔ ✔✔✔February 1991: Scud missed by a Patriot (Dhahran, Gulf War)
✔ ✔ ✔✔✔November 1992: Crash of the communication system ofthe London ambulance service
✔✔ ✔✔26 and 27 June 1993: Authorization denial of credit cardoperations in France
4 June 1996: Failure of Ariane 5 maiden flight ✔ ✔ ✔
13 April 1998: Crash of the AT&T data network ✔ ✔ ✔✔
February 2000: Distributed denials of service on large Web sites ✔ ✔ ✔✔
May 2000: Virus I love you ✔ ✔ ✔✔
July 2001: Worm Code Red ✔ ✔ ✔✔
August 2003: Propagation of the electricity blackout in theUSA and Canada
✔ ✔ ✔✔
October 2006: 83000 email addresses, credit card numbersand online transaction files stolen in UK
✔✔✔ ✔

Average outage costs❉
❉ Maintenance costsSpace shuttle on-board software: 100 M $ / an
Yearly cost of failures❉
Accidental faults
Malicious faults
UK
1,25 G£
France (private sector)
0,9 G€ 1 G€
USA
4 G$
❉ Cost of software project cancellation (failure of the development process)
FAA AASEstimate 1983
1 G $
Estimate 1988(contract passed)
4 G $
Estimate 1994
7 G $
Timing shift(estimate 1994)
6 - 8 yrs
USA [Standish Group, 2002,13522 projects]
Success
34%
Challenged
51%
Cancelled
15%
loss ~ 38 G$ (out of total 225 G$)
Estimates of insurance companies
Global estimate USA : 80 G$ UE : 60 G€
1
1,1
1,2
1,4
1,6
2,8
Industrialsectors
Banking
Retail
Insurance
Financial institutions
Manufacturing Millionsof Eurosrevenueper hourlost
Energy

System
Entity interacting withother entities, thus other
systems(« black box »)
Set of componentsinterconnected in order to
interact(« white box »)
Other systems:environment of
considered system
Component: another system
End of decomposition:atomic system
Function: what the system is intended for
Behavior: what the system does for implementing its function
Delivered service: system behavior as perceived by other system(s)interacting with it: it(s) user(s) (physical or human)
Structure: what enables the system to generat eits behavior

Each level of the tree:more or less detailed list ofthe system components
System
Components=
systems
Components =
Atomic systems
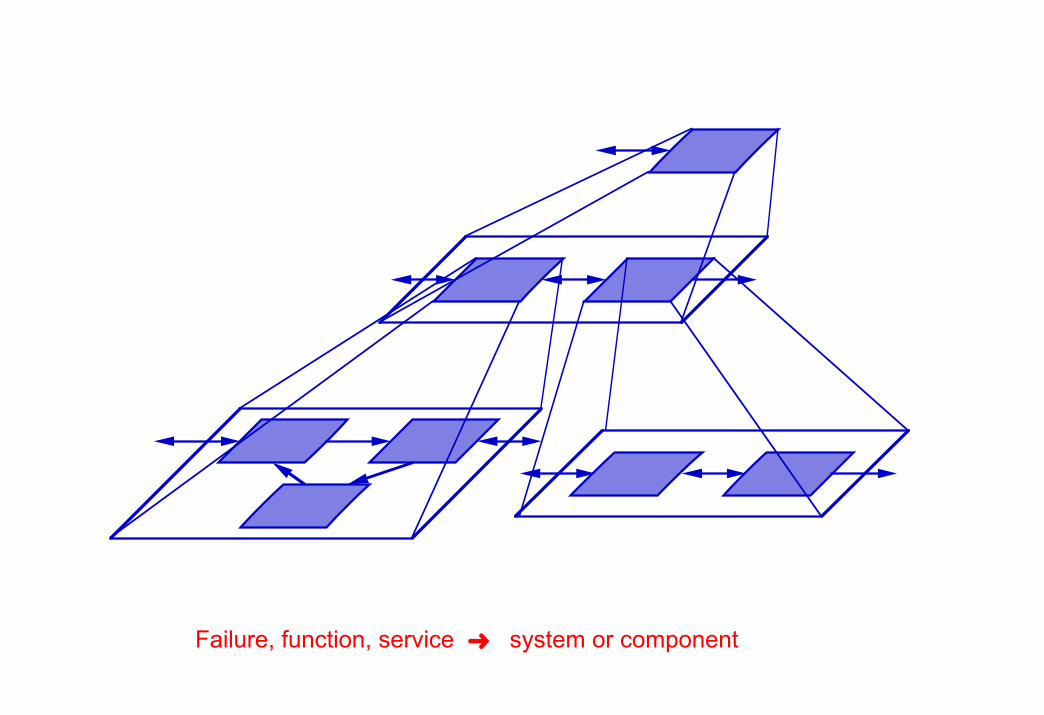
Failure, function, service ➜ system or component

Dependability threats: faults, errors, failures

Error of a programmer
FaultImpaired instructions or data
ActivationFaulty component and inputs
Error
PropagationWhen delivered service deviates (value, timing) from
implementing function
Failure

Short-circuit in integrated circuit
Failure
FaultStuck-at connection, modification of circuit function
ActivationFaulty component and inputs
Error
PropagationWhen delivered service deviates (value, timing) from
implementing function
Failure

Operator errorInappropriatehuman-system interaction
Fault
Error
PropagationWhen delivered service deviates (value, timing) from
implementing function
Failure

Electromagnetic perturbation
Fault
Error
ActivationFaulty component and inputs
FaultImpaired memory data
PropagationWhen delivered service deviates (value, timing) from
implementing function
Failure

Serviceinterface
Correct service
IncorrectserviceFailure
Dormantinternal
faultError ErrorError
activation propagation prop.
Error ErrorErrorpropagation prop.
Operator
error
Hardwarefailure
Programmererror
Electromagneticperturbation

Failures
Détectability
Signalled failures [delivered service is detected as incorrect, and signalled as such]
Unsignalled failures[incorrect service deivery is not detected]
Consistency
Consistent failures[incorrect service identically perceived by all users]
Inconsistent, or Byzantine, failures[some, or all, users perceive differently incorrect service]
Consequences
Minor failures[harmful consequences are of similar cost to the benefits provided by correctservice delivery ]
Catastrophic failures[cost of harmful consequences is orders of magnitude, or even incommensurablyhigher than the benefits provided by correct service delivery ]
•••
Domain
Value failures[value of delivered service deviates from implementing system function]
Timing failures[timing of service delivery (instant or duration) deviates from implementingsystem function]

Failuredomain
Value(correct timing)
Timing(correct value)
Value andtiming
Value failures
Service deliveredtoo early
Early timing failures
Service deliveredtoo late
Late timing failures
Suspendedservice
Halt failures
Erraticservice
Erratic failures
Non signalling of incorrect service: unsignalled failure
Signalling incorrect service in absence of failure: false alarm
• halt failures: fail-halt system
• minor failures: fail-safe system
Failure of detecting mechanisms
System whose all failure are, to an acceptable extent

Faults
Phase of creationor occurrence
Development faults[occur during (a) system development, (b) maintenance during the use phase,and (c) generation of procedures to operate or to maintain the system]
Operational faults[occur during service delivery of the use phase]
Systemboundaries
Internal faults[originate inside the system boundary]
External faults[originate outside the system boundary and propagate errors into the system by interaction or interference]
Phenomenologicalcause
Natural faults[caused by natural phenomena without human participation]
Human-made faults[result from human actions]
Dimension
Hardware faults[originate in, or affect, hardware]
Software faults[affect software, i.e., programs or data]
Intent
Malicious faults[introduced by a human with the malicious objective of causing harmto the system]
Non-malicious faults[introduced without a malicious objective]
Deliberate faults[result of a decision] Capability
Accidental faults[introduced inadvertently]
Incompetence faults[result from lack of professional competence by the authorized human(s),or from inadequacy of the development organization]
Persistence
Permanent faults[presence is assumed to be continuous in time]
Transient faults[presence is bounded in time]
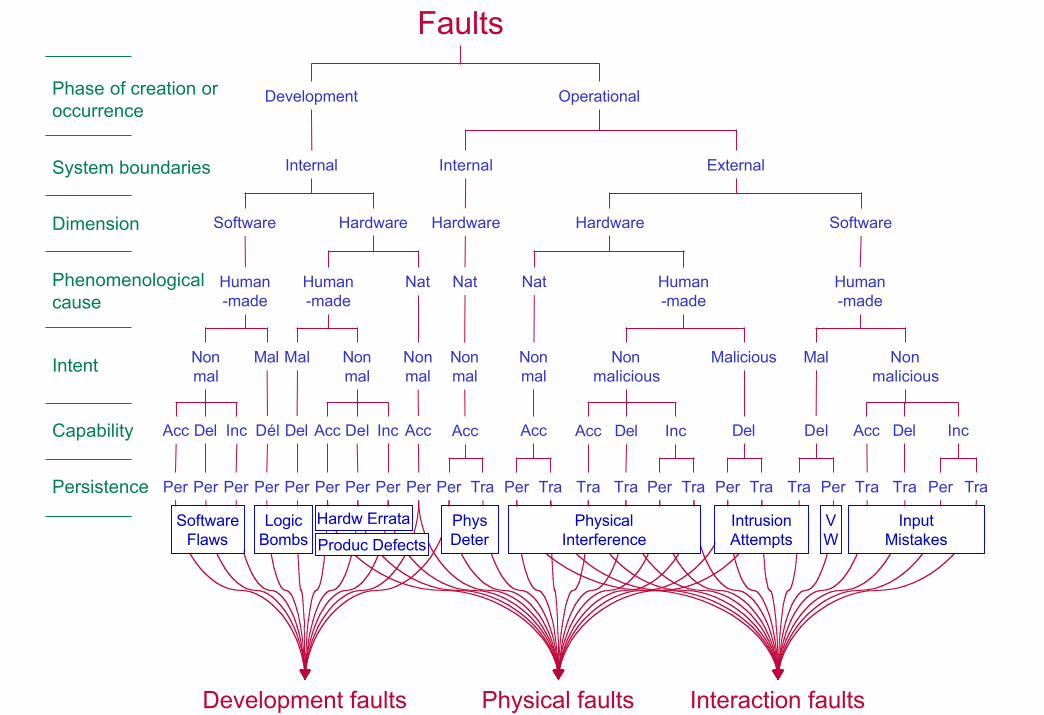
Development faults Physical faults Interaction faults
SoftwareFlaws
LogicBombs
Hardw Errata
Produc Defects
PhysDeter
PhysicalInterference
IntrusionAttempts
VW
InputMistakes
Faults
Persistence Per Per Per Per Per Per Per Per Per Per Tra Per Tra Tra Tra Per Tra Per Tra PerTra Tra Tra Per Tra
Intent Nonmal
Nonmal
Mal Mal Nonmal
Nonmal
Nonmal
Nonmalicious
Nonmalicious
Malicious Mal
Dimension Software Hardware Hardware Hardware Software
System boundaries Internal Internal External
Phase of creation oroccurrence
Development Operational
Capability Acc Del Inc Acc Inc Acc Acc Acc Acc Del Inc Del Del Acc Del IncDél Del Del
Phenomenologicalcause
Human-made
Human-made
Nat Nat NatHuman-made
Human-made

Human-made Faults
Non-malicious MaliciousIntent
Accidental(Mistake)
Deliberate(Bad decision)
DeliberateIncompetenceCapability
Interaction(operators,
maintainers)&
Development(designers)
Malicious logicfaults:
logic bombs,Trojan horses,
trapdoors,viruses, worms,
zombies
Intrusionattempts
Individuals&
organizations
Decision byindependentprofessional
judgement by boardof enquiry or legal
proceedings in courtof law

Failure pathology
Activation of dormant fault by computation process
External fault
Active fault produces error(s)
Error is latent or detected
Error can disappear before detection
Error propagation Other errors
Component failure
Fault as viewed by• Components interacting with failed component• System containing failed component
Fault Error Failure FaultActivation
oroccurrence
Propagation Causation(interaction,composition)

Fault Error Failure FaultActivation
oroccurrence
Propagation Causation(interaction,composition)
Erroraffectsservice
ActivationReproducibility
Solid faults
Elusive faults
Elusive permanent faultsand
Transient faults
Intermittent faults
Interactionfaults
Prior presence ofa vulnerability:
Internal fault thatenables an
external fault toharm the system
Facility forstoppingcausal
recursion
Contextdependent
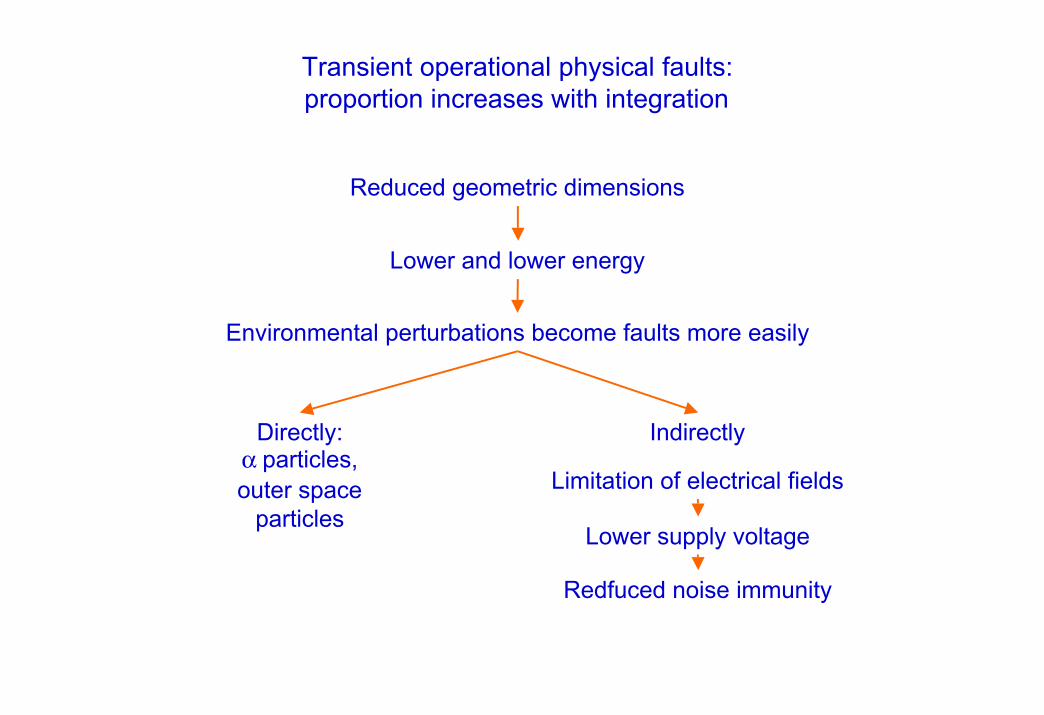
Transient operational physical faults:proportion increases with integration
Reduced geometric dimensions
Lower and lower energy
Environmental perturbations become faults more easily
Directly:α particles,outer space
particles
Indirectly
Limitation of electrical fields
Lower supply voltage
Redfuced noise immunity

Cosmic rays
Low energy deflected
Primariesdisappear~ 25 km
~ 1600/m2-s cascade to sea level
~ 100/cm2-s at 12000 m
~ 1/cm2-s sea-level flux
µ-
γ π0
π+π-
e+
e-
e+e-
γ
γ
γ
γ
n
pp
np
np
np
p
n
n
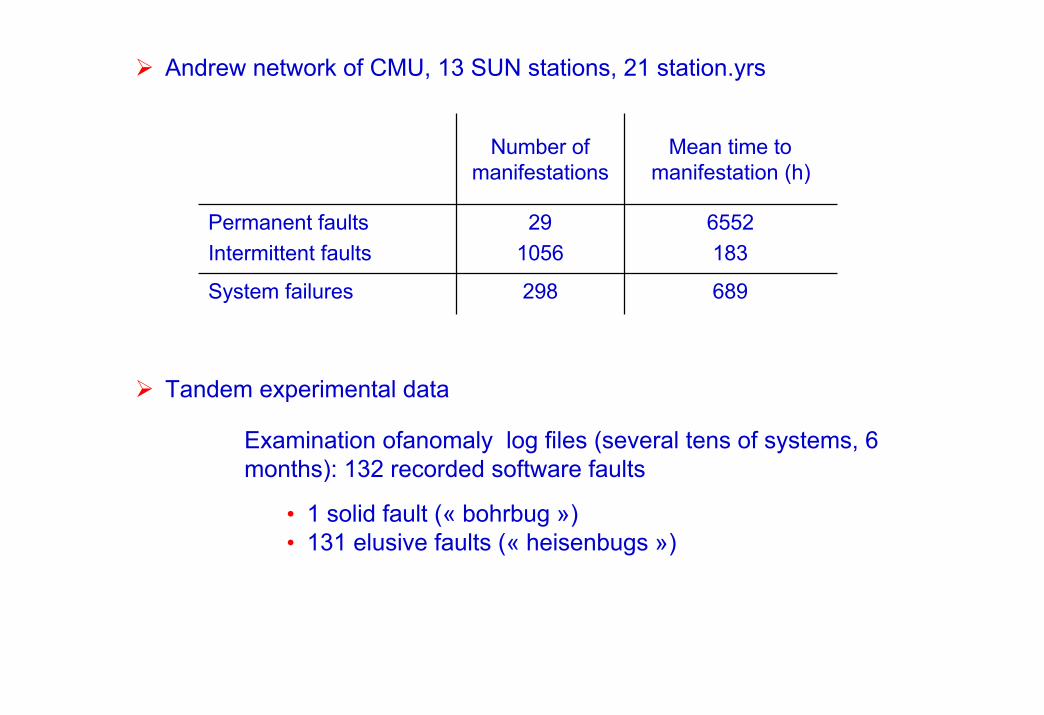
Andrew network of CMU, 13 SUN stations, 21 station.yrs
689298System failures
6552
183
29
1056
Permanent faults
Intermittent faults
Mean time tomanifestation (h)
Number ofmanifestations
Tandem experimental data
Examination ofanomaly log files (several tens of systems, 6months): 132 recorded software faults
• 1 solid fault (« bohrbug »)• 131 elusive faults (« heisenbugs »)

Permanent faults and productionyield for Intel microprocessors Intel
1 FIT = 10-9/hDPM : defects per million
Mean time to system crash, dueto hardware failure, for high end
IBM servers
1985 1990 1995 20000
10
20
30
ECL-TCM
CMOS308X/3090
9020
G1-G5
MT
TF
yrs
)
1
10
100
1000
10000
1972
1976
1980
1984
1988
1992
1996
2000
FITDPM

• Complexity
• Economic pressure
From J. Gray, ‘Dependability in the Internet era’
9%
99%
99.9%
99.99%
99.999%
99.9999%
1950 1960 1970 1980 1990
Computing systems
Phone systems
Cellularphone
Internet
Ava
ilabi
lity
2000
36j 12h0,9
3j 16h0,99
8h 46mn0,999
52mn 34s0,9999
5mn 15s0,99999
32s0,999999
Outage duration/yrAvailability

AvailabilityMTTR
98.598 hours
99.011 hour
99.8310 mins
99.981 minAvailabilityfor 100h
MTBF
Website uptime statistics (Netcraft)
Upt
ime
(hou
rs)
Top 50 most requested sites (July 2006) Top 50 longest running sites (July 2006)
Upt
ime
(hou
rs)
Avg
Upt
ime
(hou
rs)
Evolution over time
0
200
400
600
800
1000
1200
1400
1600
1 5 9 13 17 21 25 29 33 37 41 45 49
AverageMax
600
800
1000
1200
1400
1600
1 5 9 13 17 21 25 29 33 37 41 45 49
AverageMax
0200400600800
100012001400160018002000
Top requ, avg of avg
Top requ, avg of max
Max longest running
Dec2003
Nov2004
July2005
March2006
July2006

System configuration
34%
Hardware22%
Coresoftware
13%
Drivers27%
Anti-virus4%
Failure causeWindows 2000
Hardware15%
Software34%
Operatorerrors51%
Failure sources of Web sites(3 sites, 6 months,
500-5000 servers/site)
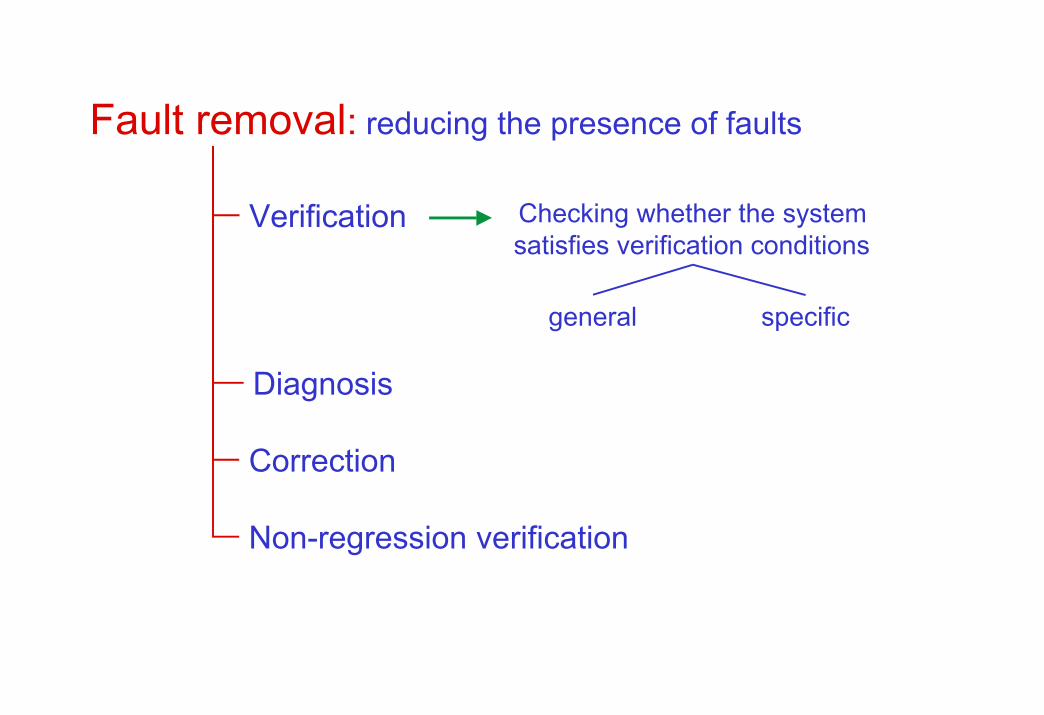
Fault removal: reducing the presence of faults
Diagnosis
Correction
Non-regression verification
Verification Checking whether the systemsatisfies verification conditions
general specific

Verification
DynamicStatic
Static analysis
System
Effective execution
Reviews andinspections
Staticanalysis
Theoremproving
Systembehaviormodel
Modelchecking
Symbolicinputs
Systemmodel
Symbolicexecution
Valued inputs
System
Test
Specification
Design
Implementation
❉ Verification of specification and of system conformance to specification: validation

Reviews and inspections ↔ Testing
Schneider Electric data: nuclear control software
0
50
100
150
200
250
300
Componentstatic
analysis
Unittests
Integration tests
Qualification tests
Number of uncovered faults
Verification effortin man.day
HP data Uncovered faults/hour
Operational testing 0,21
Functional testing 0,28
Structural testing 0,32
Inspections 1,06
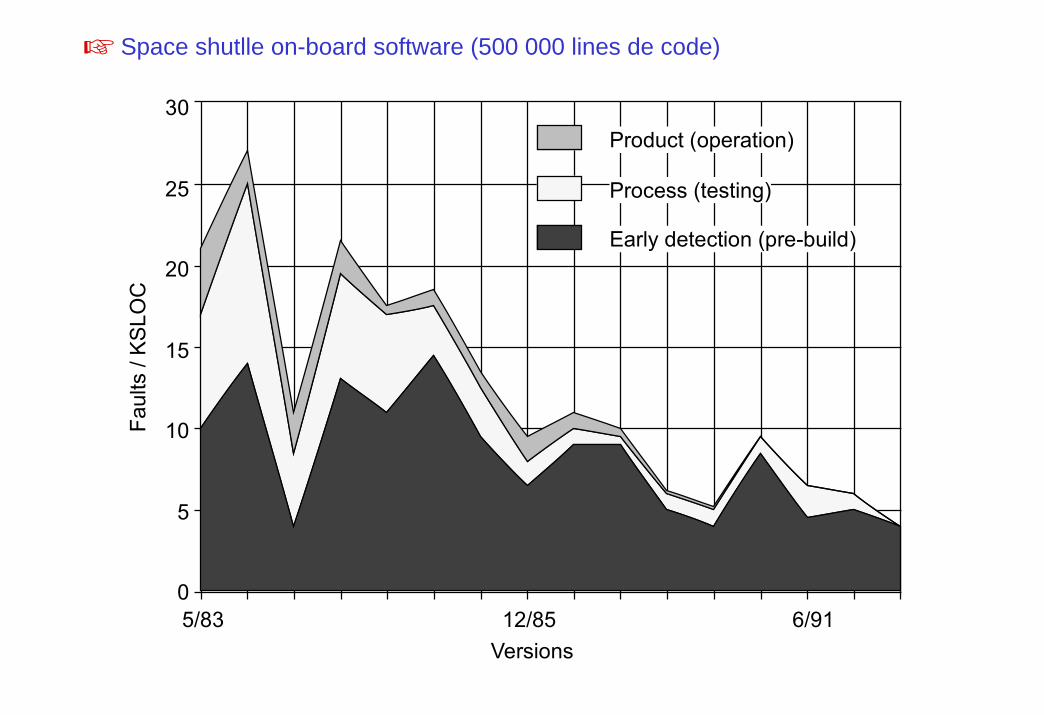
Space shutlle on-board software (500 000 lines de code)
Versions
0
5
10
15
20
25
30
5/83 12/85 6/91
Product (operation)
Process (testing)
Early detection (pre-build)
Fau
lts /
KS
LO
C

Corrective20%
[D,I,V]Adaptative
25%[S,D,I,V]
Perfective55%
[R,S,D,I,V]
Maintenance67%
Verification15%
Implementation7%
Design5%
Specification3%
Requirements3%
Verification45%
Implementation22%
Design17%
Specification 8%
Requirements 7%
Cost of software verification
Average figures: for critical systems, ≥ 70%
Verification46%

Relative cost of fault removal
1976(Boehm)
1995(Baziuk)
Design 5 - 7,5
Implementation 8 - 15
Requirements & specification 1 1
Integration 10 - 25 90 - 440
Qualification 25 - 75 440
Operation/Maintenance 470 - 88050 - 500
Cost of fault removal all the more high as it is late
IBM data
Fau
lt pe
rcen
tage
Implem Unittesting
Integr. testing
Qualif. testing
Operat.life
Faultsintroducedby phase
Faultscorrectedby phase
Cost offault
correctionby phase
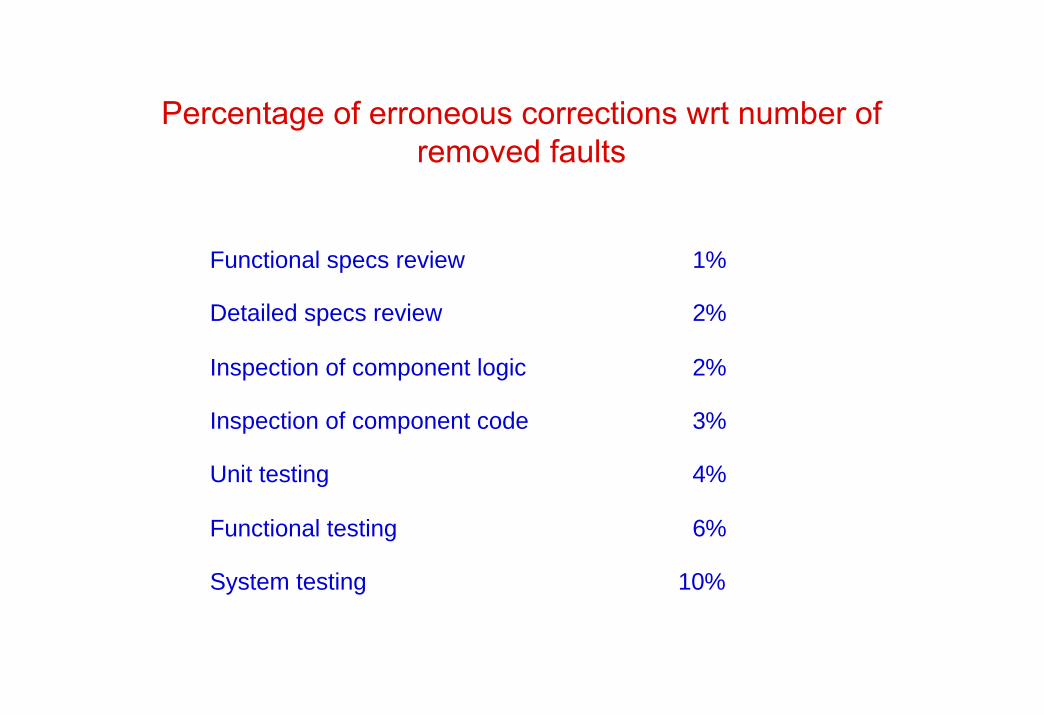
Functional specs review 1%
Detailed specs review 2%
Inspection of component logic 2%
Inspection of component code 3%
Unit testing 4%
Functional testing 6%
System testing 10%
Percentage of erroneous corrections wrt number ofremoved faults

Incorrect or poorly expressed requirements
Incorrect or poorly expressed specification
Design-implementation faults affectingseveral components
Design-implementation faults affectingone components
Typographical fault
Regression fault
Others
0 10 20 30 40
Percentage of uncovered faults
Typical distribution of software faults uncovered during development

Persistent software faults classified by manifestation frequency
(200 faults examined, 100 per project)
1. Omitted logic (existing code too simple)
2. Non re-initialization of data
3. Regression fault
4. Documentation fault (correct software )
5. Inadequate specification
6. Faulty binary correction
7. Erroneous comment
8. IF instruction too simple
9. Faulty data reference
10. Faute d'alignement de donnée (bits de gauche
par rapport aux bits de droite, etc.)
11. Timing fault causing data loss
12. Non-initialization of data
13. Other categories of lesser importance (total less than or
equal to 4)
Category: Project B(100 k ins.)
24
6
12
6
1
11
11
2
4
3
3
1
Total
60
23
17
16
11
11
11
11
10
7
6
5
36
17
5
10
10
0
0
9
6
4
3
4
Project A(500 K ins.)

Fault density
Created faults: 10 à 300 / KLOC
Residual faults: 0.01 à 10 / KLOC
Example : increments of AT&T ESS-5
Size of Density of faults Density of faults Learning Type ofincrement uncovered during uncovered in factor software
development the field (y/x)(x) (y)
42069 28,5 7,2 0,25 Preventive maintenance5422 67,3 21,0 0,31 Billing9313 79,3 27,7 0,35 On-line upgrading14467 26,5 7,2 0,27 System growth
165042 101,6 5,3 0,05 Hardware fault recovery16504 84,1 2 0,02 Software fault recovery38737 149,4 5,8 0,04 System integrity
0
20
40
60
80
100
120
140
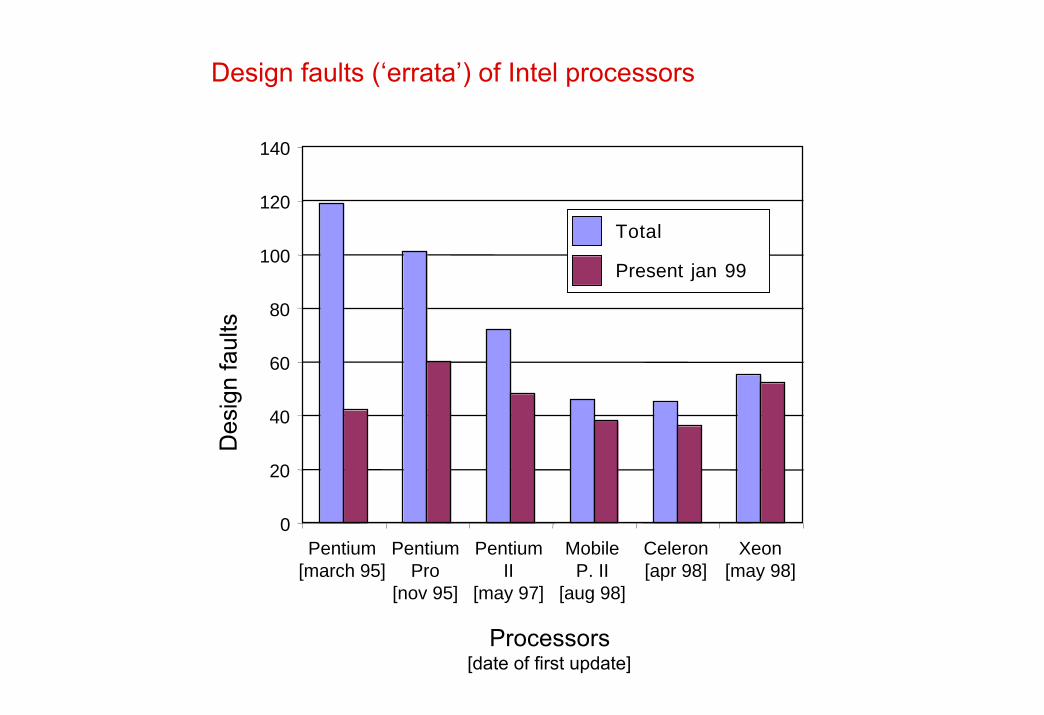
Pentium[march 95]
PentiumPro
[nov 95]
PentiumII
[may 97]
MobileP. II
[aug 98]
Celeron[apr 98]
Xeon[may 98]
Total
Present jan 99
Design faults (‘errata’) of Intel processors
Des
ign
faul
ts
Processors[date of first update]

FAULT FORECASTING
Identification, analysis ofconsequences, and classification
of failures
Probabilistic evaluation of the extentto which some dependability
attributes are satisfied
Ordinal or
qualitativeevaluation
Probabilistic or
quantitative evaluation
Estimation of presence, creation and consequences of faults
DependabilityAttributes
Dependabilitymeasures
Operational testing
Evaluation testaccording to
operational inputprofile
Behavior model of system /failure, maintenance actions,
solicitations
Modelling

ORDINAL EVALUATION
FME(C)A
RELIABILITY DIAGRAMS
FAULT TREES
STATE DIAGRAMS
MARKOV CHAINS
PETRI NETS
PROBABILISTIC EVALUATION

a
b
c
Time
Failure intensity
evolving reliability
non-stationary processesstationary processes
times to failure are stochastically identical
stable reliability
ability to deliver correct service is preserved
reliability growth
ability to deliver correct service is improved
times to failure are stochastically increasing
reliability decrease
ability to deliver correct service is degraded
times to failure are stochastically decreasing

Before version X
Version X
Version X+1
Version X+2
Version X+3
Version X+4
IBM Data18
16
14
12
10
8
6
4
2
0
Ave
rage
num
ber
of u
niqu
e fa
ults
/ 3m
onth
s
Relative month where failure first reported
1 3 5 7 9 11 13 15 17 19 21 23 25 27 29 31 33 35
Version X+1 X+2 X+3 X+4 X+5

0
.1
.2
.3
.4
pack
s pe
r 1k
line
s pe
r m
onth
(/5
0)
Yr 3Yr 2Yr 1
Hardware replacement rate trend
Field data
AT&T Data

Operational testing
Required effort
• Increasing function of the number of observed failures
• Zero-failure: Discrete time Continuous time
N ≥ ln (α)
ln (1-p0)
executions
T ≥ - λ0
hours
≈ln (α)
N
jC p0j
1− p0( )N− j
j =0
f
∑ ≥ α
P{ p ≤ p0 } ≥ 1-αNumber of executions for
p : failure probability per executionp0 : reliability objective1-α : confidence level
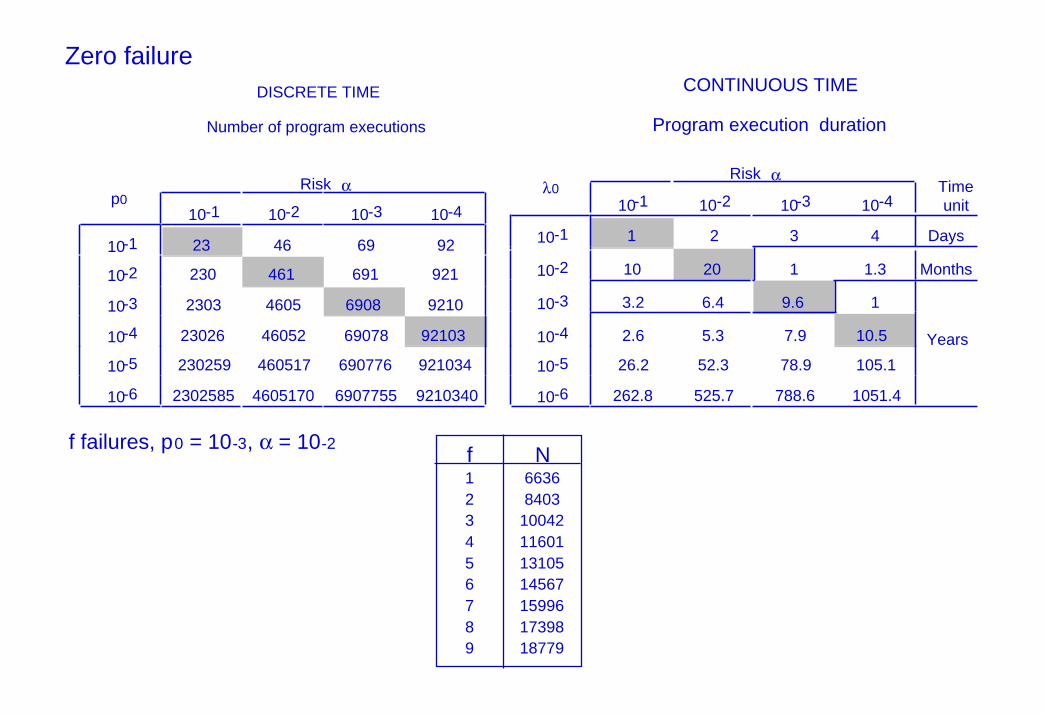
Zero failureDISCRETE TIME
Number of program executions
CONTINUOUS TIME
Program execution duration
Risk α
10-1 10-2 10-3 10-4
10-1 23 46 69 92
10-2 230 461 691 921
10-3 2303 4605 6908 9210
10-4 23026 46052 69078 92103
10-5 230259 460517 690776 921034
10-6 2302585 4605170 6907755 9210340
p0
Risk α
10-1 10-2 10-3 10-4Timeunit
10-1 1 2 3 4 Days
10-2 10 20 1 1.3 Months
10-3 3.2 6.4 9.6 1
10-4 2.6 5.3 7.9 10.5 Years
10-5 26.2 52.3 78.9 105.1
10-6 262.8 525.7 788.6 1051.4
λ0
f failures, p0 = 10-3, α = 10-2f123456789
N66368403
10042116011310514567159961739818779

Study of the FAA Airworthiness Directives (AD)
1 Jan. 1980 - 21 Sept. 1994
Confirmed avionics ADs : 33Hardware : 20 Software : 13
Equipments Rockwell/CollinsBendix/KingHoneywell/SperryTracor Aerospace
Estimation of software reliability
10-610-710-810-910-10
DME (88)
DME (94)
TCAS II (91)
TCAS (94)
Omega
ATC Transp.
AverageNo software problem reported
Failure rate (h-1)

Deliver service implementing system function inspite of faults
Error detection: identification of error presence
FAULT TOLERANCE
Error handling: error removal from system state, if possiblebefore failure occurrence
Fault handling : avoiding fault(s) to be activatedagain
System recovery: transformation of erroneous state in a statefree from detected error and from fault that can be activatedagain
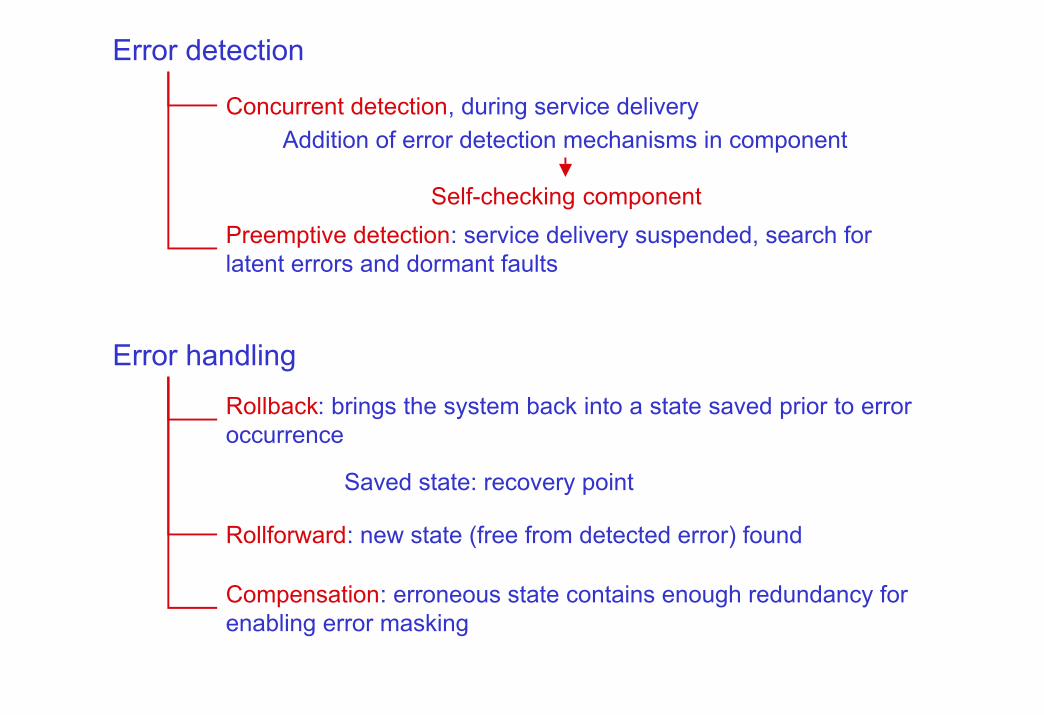
Concurrent detection, during service delivery
Preemptive detection: service delivery suspended, search forlatent errors and dormant faults
Rollback: brings the system back into a state saved prior to erroroccurrence
Saved state: recovery point
Rollforward: new state (free from detected error) found
Compensation: erroneous state contains enough redundancy forenabling error masking
Addition of error detection mechanisms in component
Self-checking component
Error detection
Error handling

Diagnostis: identifies and records the error cause(s), in terms oflocalisation and category
Isolation: performs physical or logical exclusion of the faultycomponent(s) from further contribution to service delivery, i.e.,makes the fault(s) dormant
Reconfiguration: either switches in spare components or reassignstasks among non-failed components
Reinitialization: checks, updates and records the new configuration,and updates system tables and records
Fault handling
Intermittent faults
Isolation and reconfiguration not necessary
Error handling Non recurrenceof error
Fault diagnosis Absenceof fault
Intermittentfault
Identification

Error detection and systemrecovery
orDetection - recovery
Fault masking andsystem recovery
orMasking
Error detection
Error handling
Rollback
Rollforward
Compensation
Fault handling
Systematic application even in error absence
2
1
2
1
3
2
1
3
2
1
3 3

coverage factor influent when 1-c ~
Effectiveness of error processing: coverage factor
c = P{ service is delivered failed component }
Component failure is covered if system error successfully processed
Duplex system, active redundancyComponent failure rate: λ Repair rate: µ -c = 1 - c
Reliability
R(t) ≈ exp{ -2 ( -c + λ/µ ) λ t }
MTTF ≈ 1
2 ( -c + λµ
) λ
Unavailability-A = 1 - A ≈ 2 ( -c + λ/µ ) ( λ / µ )-ANR = λ / µ
Equivalent failure rate λeq = 2 ( -c + λµ
) λ
2 -c λ non-covered failure2 ( λ / µ ) λ two successive failures, first failure covered
⇒ λ/µ

µ
λµ
λ
λ
eq
10-1
10-2
10-3
10-4
1
10-4 10-3 10-2
c = .95
c = .9
c = .99
c = .995
c = .999 c = 1.2
.4
.6
.8
1
0
10 -2 10 -1 10 10 2 10 31λ t
R(t)
c = .95
c = .99
c = .995
c = .999
c = 1
λ
µ = 10 -3
10-4 10 -3 10-2
10 -23,6 j / yr
10 -38,8 h / yr
10 -453 min / yr
10 -55 min / yr
10 -630 sec / yr
10 -73 sec / yr
c = .9
c = .95
c = .99
c = .995
c = .999 c = 1
NON REDUNDANT
λ
-A

TandemDynabus
Dynabus interface
CPU
Memory
I/O channels
Disk control.
Disk control.
Disk control.
Tape control.
VDU control.
Processormodule
Processormodule
Processormodule

Experimental data
Systems 9000Processors 25500Disks 74000MTBF System 21 years
Environment
Total
Maintenance
Operations
Software
Hardware
50
100
150
200
250
300
350
400
450
0
MTBF(yrs)
1 2 3 4 5 6 7 80
50
100
150
200
71
183
53
21
1 1 1
Num
ber
of r
epor
ted
failu
res
Length of fault chains
Length of fault chains having
led to failure

Hierarchy of faulttolerant protocols
according to relation"uses service”
Group membership
Atomic multicast
Clock synchronization
Common mechanism:consensus
Distributed system: set of processors (processing and storage)communicating by messages via communication network
Pro
cess
or
Processor Processor Processor
Processor
Processor Processor Processor
Communication network

Implies self-checking processors
Consequences:
1) Only correct value messages are sent
➠ minimum number of processors for consensus in presence of t faults: n ≥ t+2
2) Error detection: halting detection by interrogating and waiting
3) Resource replication for tolerating t faults ("halts"): ≥ t+1
4) Communication network saturation by “babbling” is impossible
5) Network architecture:
Fail-silent processors
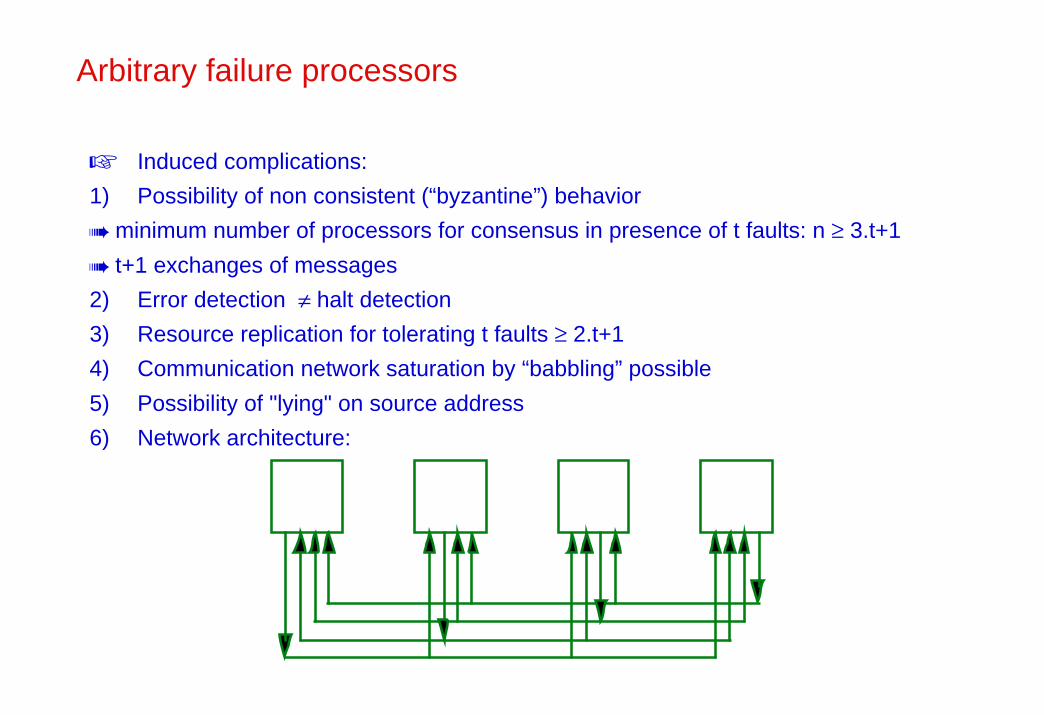
Induced complications:
1) Possibility of non consistent (“byzantine”) behavior
➠ minimum number of processors for consensus in presence of t faults: n ≥ 3.t+1
➠ t+1 exchanges of messages
2) Error detection ≠ halt detection
3) Resource replication for tolerating t faults ≥ 2.t+1
4) Communication network saturation by “babbling” possible
5) Possibility of "lying" on source address
6) Network architecture:
Arbitrary failure processors

(1) 2 3 9
1 (2) 3 4
1 2 (3) 9
X X X (4)
1
2
34
P1P2 P3 P4 P1P2 P3 P4 P1 P2 P3 P4 P1P2 P3 P4Origin
Private values
P1 P2 P3 P4
After 1st exchange
– – 3 4
– 2 – 9
– 5 6 –
– – 3 9
(1 2 3 4)1 – – 9
6 – 7 –
– 2 – 9
1 – – 4(1 2 3 9)
7 8 – – (X X X 4)
(1 2 3 9)
X X – X
X – X X
– X X XFrom P1
From P2
From P3From P4
After 2nd exchange
After majority vote 1 2 3 9 1 2 3 9 1 2 3 9 X X X X
P1P2 P3 P4 P1 P2 P3 P4 P1 P2 P3 P4 P1 P2 P3 P4
Broadcastingprivate values
Broadcastingvalues receivedfrom therprocessors

Practical aspects
Performance overhead due to volume of exchanged data t=1 9 values received by each processor
t=2 156 values received by each processor
Use of signaturesSignatures attached to exchanged data such that corruption probability withoutdetection is neglectable
➜ 2t+1 processors and communication channels
➜ t+1 exchanges
➜ Reduction of volume of data exchanged
t=1 4 values received by each processor
t=2 40 values received by each processor

(176,178,233)
178
(176,178,233)
178
(176,178,233)
178
177
176
233
178
Other utilization: data with likely variations (e.g., from sensors),median vote
(110,176,178)
176
(176,177,178)
177
(176,178,233)
178
177
176
?
178
(176,177,178)
177
(176,177,178)
177
(176,177,178)
177
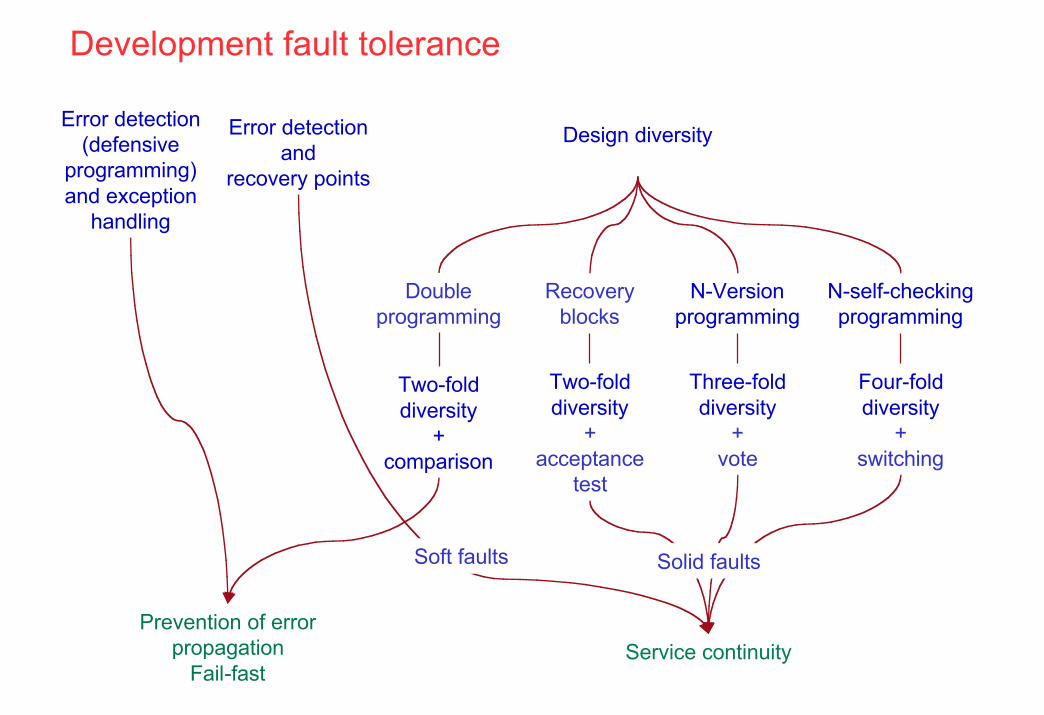
Prevention of errorpropagation
Fail-fast
Error detection(defensive
programming)and exception
handling
Service continuity
Error detectionand
recovery points
Design diversity
Recoveryblocks
Two-folddiversity
+acceptance
test
N-Versionprogramming
Three-folddiversity
+vote
N-self-checkingprogramming
Four-folddiversity
+switching
Two-folddiversity
+comparison
Doubleprogramming
Soft faults Solid faults
Development fault tolerance
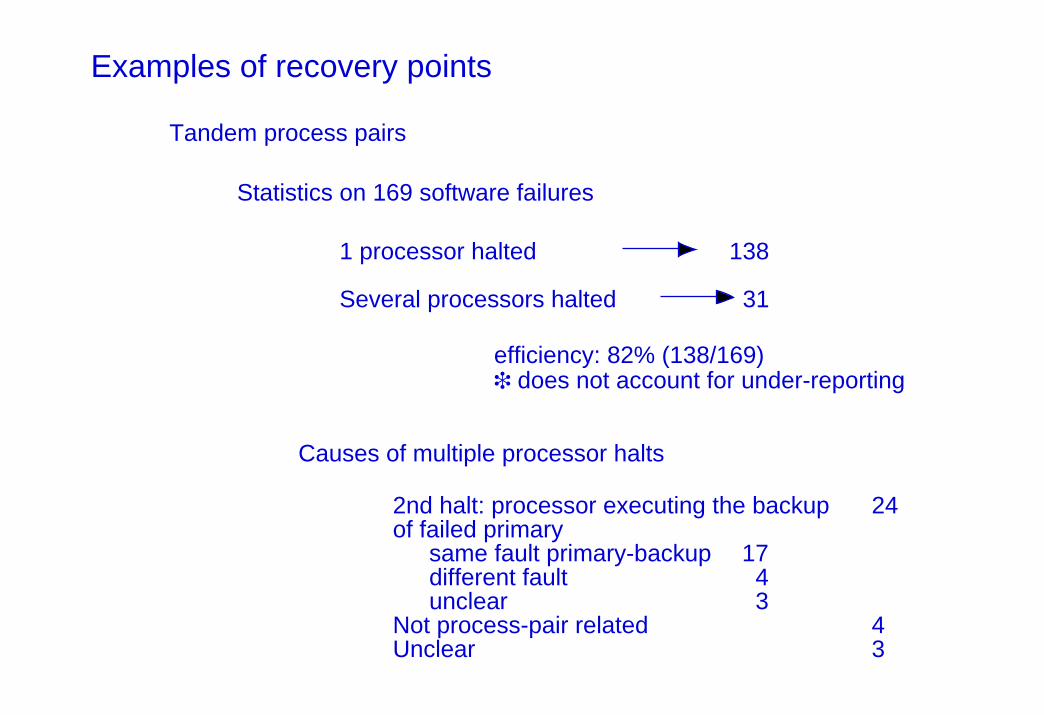
Examples of recovery points
Tandem process pairs
Statistics on 169 software failures
1 processor halted
Several processors halted
138
31
efficiency: 82% (138/169)❉ does not account for under-reporting
Causes of multiple processor halts
2nd halt: processor executing the backup 24of failed primary
same fault primary-backup 17different fault 4unclear 3
Not process-pair related 4Unclear 3

Aim: fault independency
Obstacles: common specification, commondifficulties, inter-variant synchronizations anddecisions
Operational use
Civil avionics: generalized, at differing levels
Railway signalling: partial
Nuclear control: partial
Dependability improvement
Gain, although less than for physical fault tolerance
Contribution to verification of specification
Design diversity

CRA - NCSU - RTI - UCLA/UCSB - UIUC - UVA EXPERIMENT
Sensor management in a redundant inertia platform
20 programmes (1600 to 5000 lines)
920746 tests on flight simulator
Average failure probab 1 version 5,3 10-3
Average failure probab 3 -version systems 4,2 10-4
Reliability improvement : 13

Architecture of Airbus computers
28V
ProcessorMemory I/O
PowerControl channel
Monitoring channelPower
ProcessorMemory I/O
Protection lightning, EMI, over/under voltage
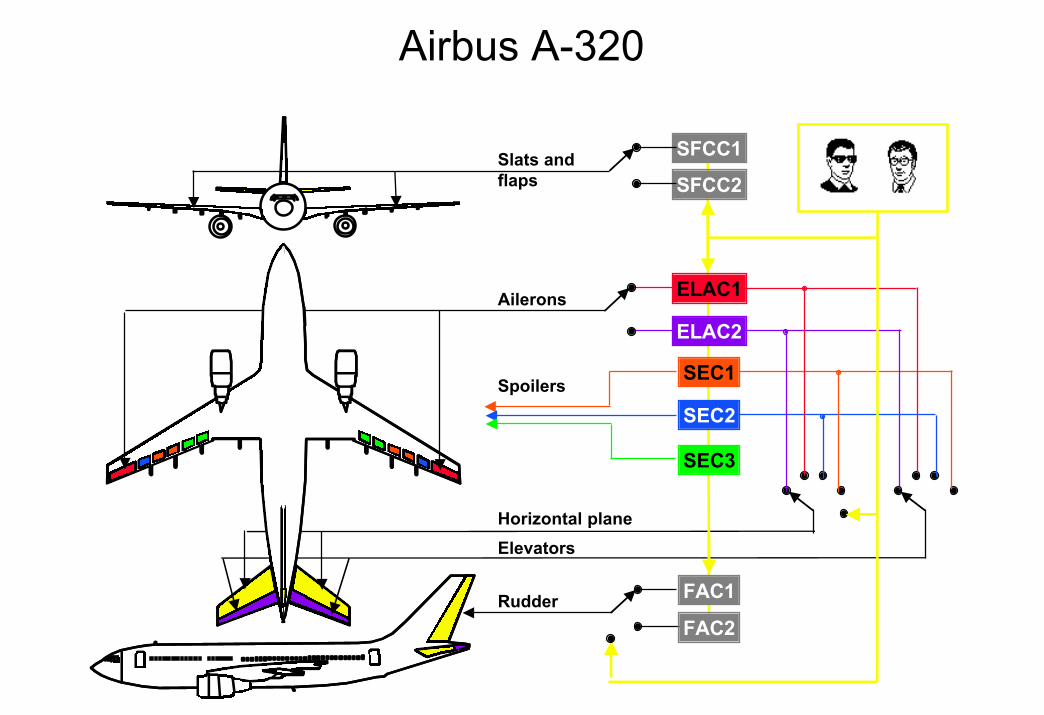
Airbus A-320
Ailerons
Horizontal plane
Elevators
SFCC1
SFCC2
Rudder
Slats andflaps
FAC1
FAC2
SpoilersSEC1
SEC2
SEC3
ELAC1
ELAC2

Boeing 777
PFC left
PFC center
PFC right
LeftCenterRight
Motorola68040
Intel80486
Lan
e2
ACE Actuateurssurfaces de
vol
Actuateurssurfaces de
vol
Actuateurssurfaces de
volActuators
ARINC 629 Data bus
PFC : Primary Flight Computer
ACE : Actuator Control Electronics
AMD29050
Lan
e1L
ane3

L C R
ACEACEACEACE
Ailerons
Flaps
Spoilers
Elevator
Rudder
Pilots
ARINC 629
Other
PFC : Primary Flight Computer
ACE : Actuator Control Electronics
LeftPFC
CenterPFC
RightPFC
Other Other

Verification and evaluation of fault tolerance
Faults (deficiencies) in algorithms and mechanisms of fault tolerance
Fault toleranceCoverage
Modelling Test
Evaluation / Influence
Fault forecasting
Improvement
Fault removal
Test
Dynamicverification
Staticverification
Model checking
Fault injection

ActivityTargetsystem
Inputs
Faults
OutputsCorrect/Incorrect
Error detection,error and faulthandling
Fault injection
By hardware•Radiations
•Interferences
•Pins
Physical
By software•Memory
•Executive
•Processor
Insimulation
Informational
Injection
Prototype oractual system
Simulationmodel
Target system
Representativityof faults

Delta-4 system (LAAS)
Robustness testing of POSIX calls (CMU) Test of Chorus Classix R3 (LAAS)
Detectederrors
Toleratederrors
ErrorsFaults
Failures
94% 85% 99%
3% 1%
12%
Dig
ital U
nix
4.0
Fre
e B
SD
2.2
.5
HP
UX
B.1
0.20
0
0,05
0,1
0,15
0,2
0,25
Fai
lure
pro
babi
lity
AIX
4.1
Irix
6.2
Linu
x 2.
0.18
Lynx
OS
2.4
.0
Net
BS
D 1
.3
QN
X 4
.2.4
Sun
OS
5.5
Ker
nel
Deb
ug.
No
obs
Err
or
stat
us
0
10
20
30
40
50
60
70
80
90
Sys
t. ha
ng
Exc
ep.
App
l .h
ang
Inco
r.
res.
% r
espo
nses
Internal faults
External faults
Average Min-Max
Average Min-Max

integration
inte
rcon
nect
ion perform
ance
vanishing substitutes for computers
funnel factor decreasing natural
robustness
unavoidability of faults ill-mastered complexity
dependency

Functional design + Over-dimensioning
Construction of reliable systems: an all time concern
[Fiabilité — de fiable, fiableté, XIIème siècle — caractère de ce qui est digne de confiance]
Traditional, pre-computer, approach
Reliability approach
Discrete and abstract characters of digital computers
Over-dimensioning not (currently?) foreseeable
Consciousness that all faults are development faults
Dependability-explicit development approach


![Dependable Systems Software Dependability · Dependable Systems Course PT 2014 Software Dependability • Four inherent properties that make software hard [Brooks 87] • Complexity](https://static.fdocuments.in/doc/165x107/5e08d780496b3921261359f5/dependable-systems-software-dependability-dependable-systems-course-pt-2014-software.jpg)