Department of Public Enterprises DATE - 5 October, 2015 Page 1 Transformation of Eskom Enterprises...
15
Department of Public Enterprises DATE - 22 March 2022 Pag Transformation of Eskom Enterprises Presenter: JUSTICE MAVHUNGU:DIRECTOR ENERGY & TELECOMMUNICATIONS Venue: CAPE TOWN Date : 18 JUNE 2003 Time :
-
Upload
virgil-blair -
Category
Documents
-
view
218 -
download
3
Transcript of Department of Public Enterprises DATE - 5 October, 2015 Page 1 Transformation of Eskom Enterprises...

Department of Public Enterprises DATE - 19 April 2023 Page 1
Transformation of Eskom Enterprises
Presenter: JUSTICE MAVHUNGU:DIRECTOR ENERGY & TELECOMMUNICATIONS
Venue: CAPE TOWN
Date : 18 JUNE 2003
Time :

EE is facing significant challenges
Our goal is to maximise value for the Group, and for our customers, through the provision of total solutions across the energy industry value chain.
421
556
13083 108
9
Gross Profit Net Oper. Income Net Profit
'01 '02
R’
mil
lio
ns
Revenue:
2001 – R2 370 m
2002 – R 2 906 m
* IBM report stated that EE would require cash in approx. 18 months

E E structure diagram
Eskom suppliedservices:— Internal Audit— Treasury— Confidential Investigations— Safety
FinanceManage
r
H / RManage
r
Co. Secr/ Legal
Committees of the Board:— Management— Audit— Remuneration— Investment & Procurement— Finance
H / O
Gvt Liaison
Esk EntAfrica Investmen
t
Electricity Africa
EON Solution
s
TSI Consulting
Trans Afr
Projects
Rotek Engineerin
g
RotekIndustrie
s
Commercial
Sapphire Exec Air
ALS
Amazing
Amanzi
Telecomms
EE~KOM
ESI~TEL
TEL~ENG
Venture Development
Equity Management
EE Africa: Regions
EE Marketing
Primary Energy
Bonesa
Coal
Natural Gas
ELGAS
FBC
Mountain Comm’s
Tele-Com Lesotho
Golang Coal
IT Services
Arivia.kom
e-Commerce
SDCT
EE Global West Africa Ltd (Nigeria)
Roshcon Division
RVS Division
Roshprop
Division
Roshcon
RVSDorman
tRoshpro
pDorman
t
PBMR
Waste Energy
PTMGESCO
SKIEskom Energie Mananta
li
HEM~KOM
TSI Operating
Lunsemfwa
(Zambia)
Co-ordination, Marketing,Deal Making,Funding
#:
# #
Board of Directors
* * * * * * * *
: Execution*

Current analysis shows net EVA “loss”
Rotek and Roshcon are the primary value creators while head office and the telecomms businesses alone destroy more value than is created.
-250
-200
-150
-100
-50
0
50
1 2 3 4 5 6 7 8 9 10 11 12 13Mil
lio
ns
EskomHead Office
PTN
Mountain Comms
Sapphire Exec Air & Helicopter
TSI ALS
Rest of BU’s
RotekRoshcon
Manantali EON Enerweb
2002 Results

Project Lambda: Transformation Programme

The challenge is to prepare Eskom Enterprises for the next stage of its evolution as a multi-business corporate
Time
EE Business Value
Jan 2003
Initial objectives:
• Formation
• Exploration
• Early growth
New challenges:
• Consolidation
• Transformation
• Repositioning
1999 / 2000 2006 & beyond
. . . where the key challenges for corporate & business strategy are consolidation, transformation and repositioning
. . . where the key challenges for corporate & business strategy are consolidation, transformation and repositioning

EE vision & strategy needs to be aligned to that of EH and ER, recognising key intra-group relationships
Eskom Holdings
Eskom Regulated
Eskom Enterprises
Eskom Holdings -
focus on industry & external Stakeholder Management
Eskom Regulated - focus on Supply &
Operations Management
Eskom Enterprises -
focus on Asset & Value Management
• Customer - Supplier relationship
• Shareholder - Investment relationship
• Principal - Agent relationship

Strategy analysis stream will develop corporate and Business Unit strategy
Objectives:Develop a coherent and compelling business vision for EEDevelop the high level strategy for EE to achieve this vision:
At corporate levelAt business unit level
Ensure the EE vision and strategy is integrated with the broader Eskom strategy (EH and ER)

Three strategic themes defined for overall direction of EE
Provision of Support Services for the ESI
Development of a Globalisation capability to drive the growth of EE and Eskom as a whole
New Enterprise Development and Management

The 3 pillar structure will allow us to focus on our different strategic objectives

The transformation project will design and drive necessary changes
We have engaged Gemini Consulting to assist in the process.

Strategic decisions will affect the portfolio and structure
The Strategy and Value Analysis streams will drive these decisions.

Business Case translates transformation benefits into financial statements
Understanding the company’s financial
levers
Focus stream efforts at points of greatest
leverage
Understanding the impact of identified
benefits on company financials
Profit & Loss Impacts
Balance Sheet Impacts
Cash flow Implications
Gross benefit
Investments
Net benefit
Revenue enhancement
Cost reduction
Cost avoidance
Capital reduction
Capital avoidance
Investment required
Time to realise
The analysis will allow EE to weigh up the benefits of transformation versus the investment required.

The result . . . a business case for EE’s future to be presented to the Board
Proposed Strategy
Investment required
Risk profile
Potential business benefits
Impact on financial
performance returns
Go / no go
decision
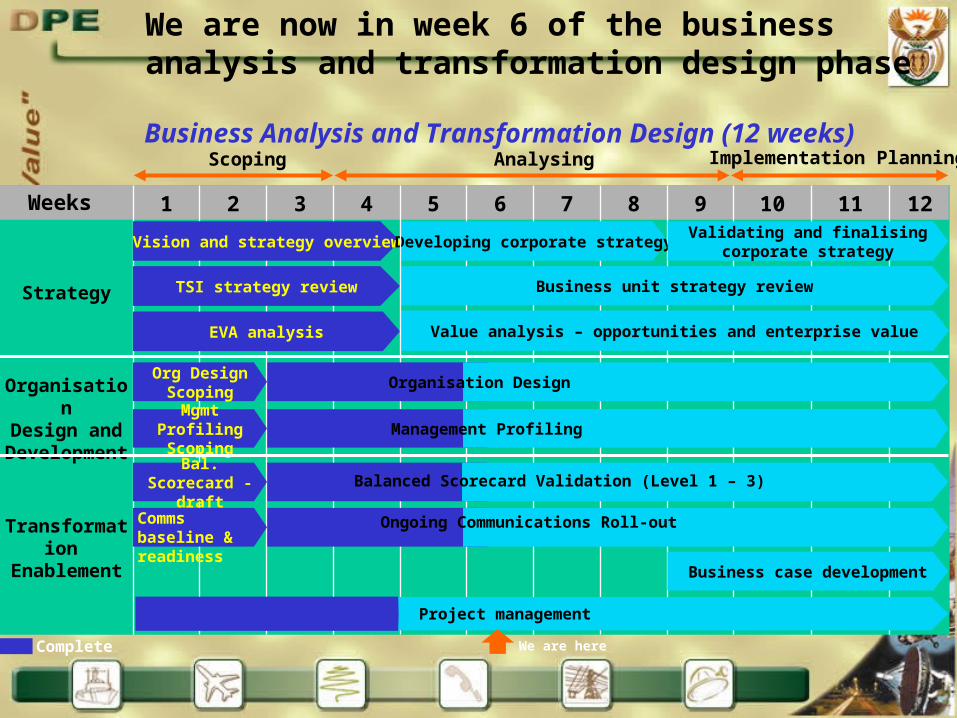
We are now in week 6 of the business analysis and transformation design phase
Business Analysis and Transformation Design (12 weeks)Scoping Analysing Implementation Planning
1 2 3 4 5 6 7 8 9 10 11 12
Strategy
OrganisationDesign and
Development
Transformation Enablement
Vision and strategy overview
TSI strategy review
EVA analysis
Developing corporate strategy
Business unit strategy review
Value analysis – opportunities and enterprise value
Org Design Scoping
Mgmt Profiling Scoping
Bal. Scorecard - draft
Business case development
Weeks
Complete
Validating and finalising corporate strategy
Comms baseline & readiness
Organisation Design
Management Profiling
Balanced Scorecard Validation (Level 1 – 3)
Ongoing Communications Roll-out
Project management
We are here