Department of Physics and Astronomy, Texas A&M University ...
33
1 Department of Physics and Astronomy, Texas A&M University, 4242 TAMU, College Station TX 77843 2 Idaho National Lab, P.O. Box 1625, Idaho Falls ID 83403, 3 Chemical and Materials Engineering and Nuclear Engineering Program, University of Idaho, Idaho Falls ID 83402 August 27, 2012 IPRC Fontana, WI August 2012 Slide 1
Transcript of Department of Physics and Astronomy, Texas A&M University ...

1Department of Physics and Astronomy, Texas A&M University, 4242 TAMU, College Station TX 778432Idaho National Lab, P.O. Box 1625, Idaho Falls ID 83403,
3Chemical and Materials Engineering and Nuclear Engineering Program, University of Idaho, Idaho Falls ID 83402
August 27, 2012IPRC Fontana, WI August 2012
Slide 1

August 27, 2012
Used Nuclear Fuel (UNF) andThe Fuel Cycle
Slide 2
Reference: Blue Ribbon Commission on America’s Nuclear Future, Jan 2012
• UNF is stored on location in waterponds and dry casks.
• In this form it would remainhazardous for thousands of years.
• The only way to remove thosehazards is to literally destroy themby fission for the transuranics(TRU).

August 27, 2012
A Call for Waste Disposal
• U.S. UsedNuclear FuelInventory:
– Currently67,000Metric Tonsof UNF instorage
– Growth Rateof ~2000Metric Tonsper year
Slide 3
Reference: Blue Ribbon Commission on America’s Nuclear Future, Jan 2012

August 27, 2012
Benefits to ADSMS
• ADSMS can destroy the transuranics (TRU) at a rateequivalent to their production in conventional reactors.
• It is a green and profitable technology.
• The core is sub-critical with all its fuel dissolved in amolten salt matrix; therefore, it cannot melt down in aconventional sense.
• It uses used nuclear fuel as its power source to producehundreds of Megawatts of power.
• It can incinerate the long-lived radioactive waste that isproduced by conventional reactors.
• It can recycle used fuel into fertile fuel for conventionalreactors.
4

August 27, 2012
Accelerator Driven Systems
• Why an accelerator?– An on-off switch to fission.– Capable of operating subcritical– Can run off of UNF
• Fission Driven by Spallation Neutrons
• Fast neutron source from 800 MeV Proton Beam• Flux Coupled Stack of Isochronous Cyclotrons
– 1 footprint– Redundancy → reliability– Sustainable driver for fission cores
Slide 5
Proton Beam Beam Window Molten Salt Core

August 27, 2012
Accelerator Complex
• Injector– 2.5 MeV proton beam is fed to the TAMU 100.
• TAMU 100– Produces a 100 MeV proton beam is fed to the TAMU 800.
• TAMU 800– 10 mA beam from each cyclotron is chopped at injection and then
separated into 3 beams after extraction from TAMU 800.– The 4-stack of cyclotrons can produce 12 2.7 MW beams.
• 12 beam lines– Each beam can drive an 65 MWth ADS molten salt core.
Slide 6
Reference: McIntyre, IPAC 2012, Poster Session

August 27, 2012
Accelerator Technology Advances
• Flux CoupledStack
• Strong FocusingCyclotron– Quadruple
focusing channelsat the magnet polefaces
– Novel Design forSuperconductingRF Cavities
Slide 7

August 27, 2012
Molten Salt Fission Pot
• 12 Molten Salt Pots– 65 MWTH Each– Produce 300MWE together
• Energy gain of 5.3 taking into account thermal-electric conversion and the efficiency of theaccelerators
– Together they can burn the contents of anAP1000
• NaCl-Based Molten Salt– NaCl – 69%– TRU (0.878) +Lanthanides (0.122) = 31%
• Salt processing and refueling every year
Slide 8

August 27, 2012
Chloride Molten Salt System
• Why Chlorides?– High actinide solubility– Compatibility with very
fast neutronics– Stable operating
temperature range~500-700 ᵒC
– Low chemicalcorrosiveness
• Why not Chlorides?– Cl36 Production
• Solution: Isotope Separation(USEC)
– Complex chemistry• Multiple oxidation states
– Limited Experimental Data
Slide 9
Fluorides Chlorides
Actinide Solubility atAcceptableTemperature Low High
Vapor Pressure Very Low Low
OperatingTemperature 700 ᵒC+ 500 ᵒC+
Electronegativity(Pauling Scale) 3.98 3.16
Number of OxidationStates 1 8
Number of StableActinide IonizationStates Several 1-2

August 27, 2012
Chloride Molten Salt Systems
• LiCl-KCl– Pyroprocessing advantages– Wealth of available data– Secondary Salt– Not suitable for primary salt
• KCl– n,α reaction, 36Cl production
• MgCl2• NaCl
– High actinide solubility– Well modeled– Primary Salt Choice
Slide 10
0
100
200
300
400
500
600
700
800
900
0 20 40 60 80 100
T (ᵒ
C)
Mole % PuCl3
Binary Phase Diagram: NaCl-PuCl3
with ADSMS Operating Range
NaCl PuCl3
Reference: Bjorklund, et al, 1959.

August 27, 2012
Fuel Salt Preparation
• Preparation of Oxide Spent Nuclear fuel:– Electrolytic Oxide Reduction– Rare Earth and
Actinide Oxidation– Uranium Reduction
• Avoids typical proliferation hazards– Non-aqueous– 1 Pot Process– No segregation of Pu– Radioactive lanthanides remain with
the minor actinides throughout the process
Slide 11
90%
1%2%
2%
5%238U235UTRUOther
Lanthanides

August 27, 2012
Electrolytic Reduction
• Developed at ANL and INL– LiCl-1wt% Li2O– Uranium, TRU, Noble Metals,
and Rare Earth Reduction inCathode Basket
– >90% Reduction of TRU
Slide 12
Sintered Oxide
Fuel
Post
Electrolytic
Reduction of
Oxide Fuel
Oxide Fuel before and after
Voloxidation

August 27, 2012
Heavy Metal Oxidation
• CdCl2 Oxidation• Lanthanides Oxidize first• Uranium oxidizes last of the Actinides• Noble Metals are left as waste product• UCl3 can provide lower melt temp for
operation.
Slide 13

August 27, 2012
Molten Salt Reconditioning
• Similar steps as Salt Preparation• Potassium reduction helps to keep lower operating
temperature and avoid salt freezing• Criticality concerns mitigated via batch processing
Slide 14

August 27, 2012
Criticality Concerns DuringReconditioning
• During reconditioning, TRU is reduced into metal form from themolten salt.
• Criticality calculations were performed with the Monte Carlocode MCNPX for several vessel designs and depositionscenarios.
• Critical mass calculations are sensitive to:– Deposition Geometry
• Dendrite formation or preferred TRU deposition decreases the critical mass
– Vessel Design• Bucket Shape• Infinite lattice geometry- series of individual cells can be modeled and share
neutrons
– Absorber width and placement• Hafnium wall thickness has an exponential on criticality- diminishing returns
Slide 15
Cone half-angle 75°Critical mass: 35.1 kg
Cone half-angle 15°Critical mass: 14.4 kg
Uniform depositionCritical mass: 168.3 kg

August 27, 2012
Conclusions
• Proposing a power producing solution tothe nuclear waste problem.
• Making innovative advances inaccelerator technology.
• Actively seeking– Experimental and modeling support,
suggestions, and lessons learned and
– Collaborations to assist with actinide saltexperiments, corrosion, and radiationdamage testing.
Slide 16

August 27, 2012
The ADSMS Collaboration
Texas A&M University: Nuclear Engineering:Physics: Saeed Assadi Marvin Adams
Karie Badgley Pavel TsvetkovWilliam Baker Idaho National Lab:Austin Baty Michael SimpsonJustin Comeaux Prabhat TripathyTim ElliottJames Gerity University of Idaho:Ray Garrison Supathorn PhongikaroonJoshua KellamsAl McInturff Brookhaven National Lab:Peter McIntyre Ilan Ben-ZviNate Pogue Bill HorakAkhdiyor Sattarov Hans LudewigElizabeth Sooby Francois Meot
Mechanical Engineering: Deepak RapariaTed Hartwig Nick SimosDavid Foley Mike TodosowShreyas Balachandran Bill Weng
Chemistry:Abraham Clearfield

August 27, 2012
Questions?
Slide 18
Thank youfor yourattention!

August 27, 2012
0.8
0.9
1.0
1.1
1.2
1.3
1.4
0 20 40 60 80 100
ton
s
years
239Pu and TRU' inventories 1 core
0
10
20
30
40
50
60
70
80
90
0 5 10 15 20
MW
years
Wth one core
Wth from 12 core ADSMS
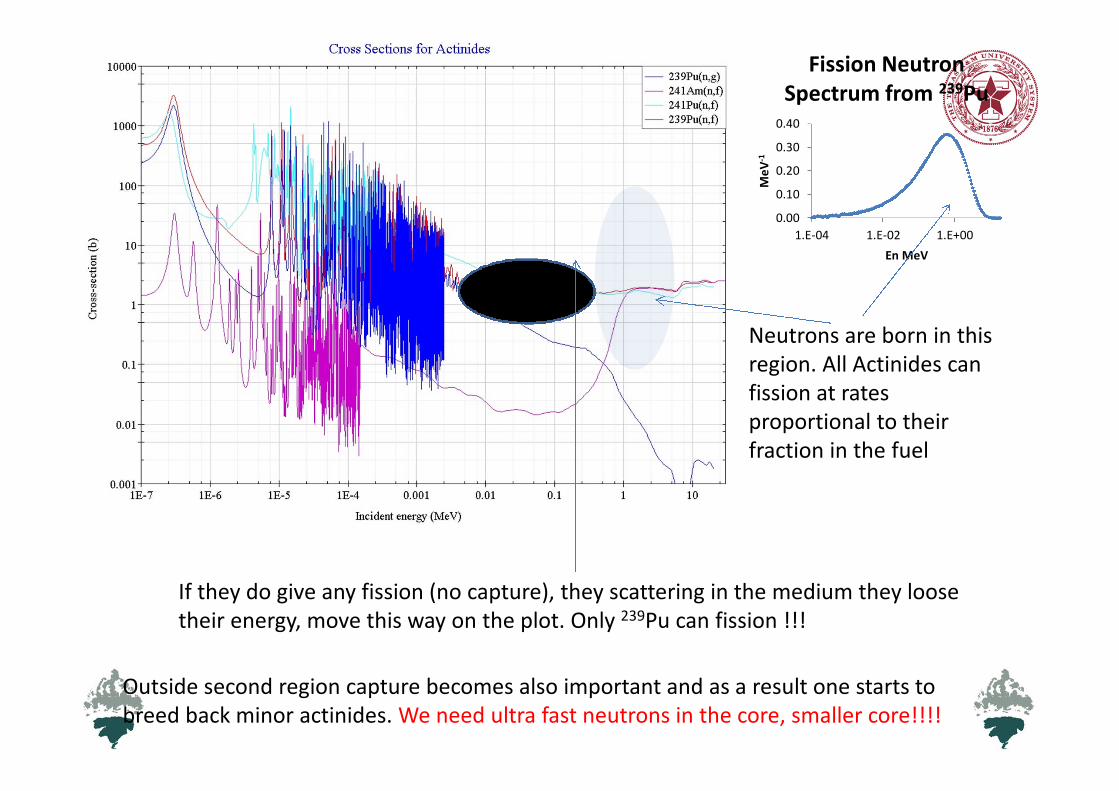
Neutrons are born in thisregion. All Actinides canfission at ratesproportional to theirfraction in the fuel
0.00
0.10
0.20
0.30
0.40
1.E-04 1.E-02 1.E+00
Me
V-1
En MeV
Fission NeutronSpectrum from 239Pu
If they do give any fission (no capture), they scattering in the medium they loosetheir energy, move this way on the plot. Only 239Pu can fission !!!
Outside second region capture becomes also important and as a result one starts tobreed back minor actinides. We need ultra fast neutrons in the core, smaller core!!!!

August 27, 2012
Main vessel dimensions
Inner radius 0.32 m
Height 1.5 m
Outer radius of downflow
tube
0.27 m
Thickness of downflow tube 0.0254 m
Manifold plate thickness 0.01 m
Wall material/Thickness
Ni 0.00635 m
Hastelloy-N 0.0127 m
HT-9 0.0254 m
Ni Beam line and beam “windows”
OD 0.26 m
Beam window shape half sphere
Thickness 0.003 m
Absorber/Reflector
B4C 0.48 m radius, 0.1 m thick
Lead 0.65 m radius, 0.3 m thick
Wth, MW 800
Proton Beam 4, 800MeV, 10mA
Total flux, 1015cm-2s-1 1.3
Fast fraction, nf 28%
keff 0.96
Burn Up (GWd/tHM) 500 (100y)
Tmelt,oC 515
Composition 31%(TRU+La)Cl3 69%NaCl
Density, g/cc 3.142
Total load, t 22.2 (56 in 100y) Actinide
Power density, W/cc 165W
Tin/Tout,oC 565/575

August 27, 2012
Objectives of Corrosion Testing
• Identify corrosion resistantmaterials in chloride molten salts
• Quantify the effect of variousoxygen concentrations in the salt– Mimic realistic operating
conditions– Simulate worst-case scenarios
• Control the environment andsuppress corrosion– Monitor and stabilize redox
potential in the salt– Cathodic Protection: Naval Ships
and your Hot Water Heater
• Combine molten salt corrosionwith neutron damage effects– Swelling– He Embrittlement
Centrifugal pump operatedcontinuously for one year inmolten salt at 500 C
Slide 22

August 27, 2012
Initial Mass Spectroscopy Data
A clear trend was seen in the refractory material:
0
0.000005
0.00001
0.000015
0.00002
0.000025
0.00003
0.000035
0 5 10 15 20 25 30
Wt%
inS
alt
Sam
ple
Time (hours)
Wt% Metal in the salt through the Chloride Salt
Corrosion Test
Nb Wt %
ECAE Nb
Wt%
Ta Wt %
Evaporation?
Passivation?
Slide 23

August 27, 2012
2) Blue salt: Zircaloy Exposure inChloride Salt, t=2hr
Slide 24

August 27, 2012
3) Stainless Steel Exposure in ChlorideSalt, t=6hrs
Slide 25

August 27, 2012
Initial Testing at the Center forAdvanced Energy Studies
• Baseline corrosion test:– LiCl-KCl and LiBr-KBr– 11 different materials– Inert, argon glove box– 24 hour experiments– Each experiment run at 700 C
• Samples:– 6 samples per metal
• 3 samples per salt compound– 1 Control– 2 Exposed to salt
– All samples were etched and prepared in the same manner
• Salt and Materials Characterization– Inductively Coupled Plasma Mass Spectrometry– Scanning Electron Microscopy– Tension Test
Slide 26

August 27, 2012
Sample Prep and ExperimentalControls
• Etched according to ASM Handbook recommendations• Rinsed with nano-pure water then dried using isopropyl
alcohol and baked at 150 ᵒC• Exposed to salt for 24 hours• Salt samples taken at 2, 4, 6, 12, 18, and 24 hours• Same operating temperature for each experiment• Eutectic salt cations remained consistent, i.e. LiBr-KBr
and LiCl-KClZircaloy Samples before and after
corrosion test

August 27, 2012
Future Corrosion Work
• Continue salt analysis and evaluate precisionof results
• Experiment with sample preparationtechniques
• Next round of corrosion tests:– 500 hours– Like materials for corrosion crucible and coupons– Nickel and Nickel Alloys in comparison with
Stainless Steel– Gas monitoring of a closed system
• Radiation damage of testing of Nickel andNickel Alloys– Simulate He embrittlement– Assess possibility to use Hastelloy-N or Pure
Nickel for both vessel and heat exchanger tubingSlide 28

August 27, 2012
Initial Mass Spectroscopy Data
0
50
100
150
200
250
300
350
-5 0 5 10 15 20 25 30
Concentr
ati
on
of
Meta
l(m
icro
gra
ms/lit
er)
Time (hours)
Raw Mass Spec Data from 316 Stainless Steel Salt
Sample
Chromium / 53 [#2]
Manganese / 55 [#1]
Manganese / 55 [#3]
Iron / 56 [#1]
Cobalt / 59 [#3]
Nickel / 60 [#2]
Nickel / 60 [#3]
Copper / 63 [#2]
Copper / 63 [#3]
Slide 29

We are seeking collaborators!
• Neutronics
• Molten salt chemistry /corrosion
• High-power spallation targetry
• Beam dynamics – strong-focusing cyclotron
• Superconducting magnetics
• Superconducting RF
• Fuel cycle simulation/optimization
• Counter-flow heat exchanger
• Safety analysis, what-if scenarios
Please contact us - [email protected]
Slide 30

August 27, 2012
Metal SamplesTested:
• Niobium• ECAE Niobium
(Equal ChannelAngular Extrusion)
• Tantalum• Nickel• Zircaloy (two types)• 316 Stainless Steel• Tungsten• Hastelloy-N• HT-9 Steel• T91 Steel
Initial ObservationsMade
• Salt changed colors ina number ofexperiments
• Often times a metallicfilm appeared to coverthe bottom of thecrucible
• Vapor formed throughthe duration of thebromide studies
• Any wire used in earlyiterations of theexperimental set uphad clear vaporeffects-color changeand hardening
Tungsten Salt Column after Test (LiBr-KBr)
Slide 31
August 27, 2012
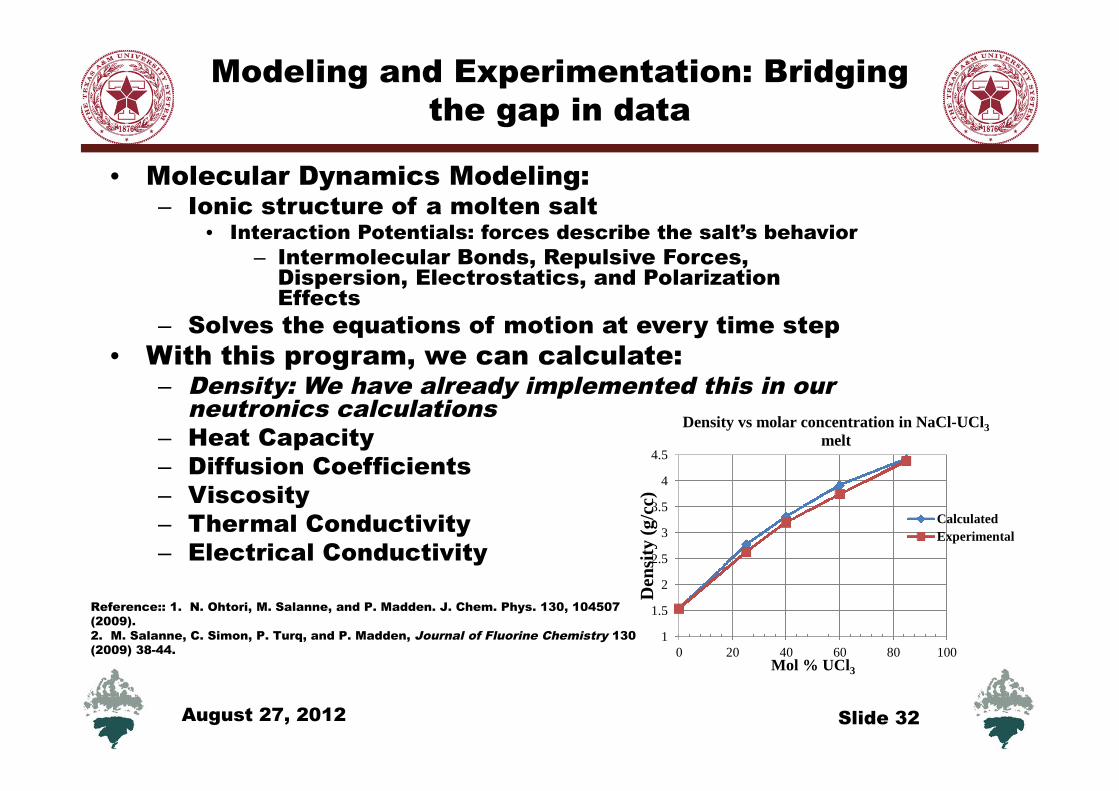
Modeling and Experimentation: Bridgingthe gap in data
• Molecular Dynamics Modeling:– Ionic structure of a molten salt
• Interaction Potentials: forces describe the salt’s behavior
– Intermolecular Bonds, Repulsive Forces,Dispersion, Electrostatics, and PolarizationEffects
– Solves the equations of motion at every time step
• With this program, we can calculate:– Density: We have already implemented this in our
neutronics calculations– Heat Capacity– Diffusion Coefficients– Viscosity– Thermal Conductivity– Electrical Conductivity
Reference:: 1. N. Ohtori, M. Salanne, and P. Madden. J. Chem. Phys. 130, 104507(2009).2. M. Salanne, C. Simon, P. Turq, and P. Madden, Journal of Fluorine Chemistry 130(2009) 38-44.
Slide 32
1
1.5
2
2.5
3
3.5
4
4.5
0 20 40 60 80 100D
ensi
ty(g
/cc)
Mol % UCl3
Density vs molar concentration in NaCl-UCl3
melt
Calculated
Experimental

August 27, 2012
Density Calculations
Slide 33
2.9
3
3.1
3.2
3.3
3.4
3.5
3.6
650 700 750 800 850 900 950 1000 1050 1100 1150
Den
sity
(g/c
c)
Temperature (K)
Density Map of NaCl-PuCl3 System with and withoutLanthanide Additions
66-34 mol% (No Lanthanides)
67-33 mol% (No Lanthanides)
68-32 (No Lanthanides)
69-31 mol% (No Lanthanides)
67-33 mol% ( 87.8% PuCl3 and 12.2% La)
68-32 mol% ( 87.8% PuCl3 and 12.2% La)
69-31 mol% ( 87.8% PuCl3 and 12.2% La)