Department of Pharmacology and Cancer Biology Date:
133
Investigating the Fate of Pre-neoplastic Cells in a Mouse Model of Medulloblastoma by Jessica Dawn Kessler Department of Pharmacology and Cancer Biology Duke University Date:_______________________ Approved: ___________________________ Robert J. Wechsler-Reya, Ph.D, Supervisor ___________________________ Dennis Thiele, Ph.D. ___________________________ Fan Wang, Ph.D. ___________________________ Xiao-Fan Wang, Ph.D. ___________________________ Sally Kornbluth, Ph.D. Dissertation submitted in partial fulfillment of the requirements for the degree of Doctor of Philosophy in the Department of Pharmacology and Cancer Biology in the Graduate School of Duke University 2009
Transcript of Department of Pharmacology and Cancer Biology Date:

Investigating the Fate of Pre-neoplastic Cells in a Mouse Model of Medulloblastoma
by
Jessica Dawn Kessler
Department of Pharmacology and Cancer Biology Duke University
Date:_______________________ Approved:
___________________________
Robert J. Wechsler-Reya, Ph.D, Supervisor
___________________________ Dennis Thiele, Ph.D.
___________________________
Fan Wang, Ph.D.
___________________________ Xiao-Fan Wang, Ph.D.
___________________________
Sally Kornbluth, Ph.D.
Dissertation submitted in partial fulfillment of the requirements for the degree of Doctor of Philosophy
in the Department of Pharmacology and Cancer Biology in the Graduate School
of Duke University
2009

ABSTRACT
Investigating the Fate of Pre-neoplastic Cells in a Mouse Model of Medulloblastoma
by
Jessica Dawn Kessler
Department of Pharmacology and Cancer Biology Duke University
Date:_______________________ Approved:
___________________________
Robert J. Wechsler-Reya, Ph.D. Supervisor
___________________________ Dennis Thiele, Ph.D.
___________________________
Fan Wang, Ph.D.
___________________________ Xiao-Fan Wang, Ph.D.
___________________________
Sally Kornbluth, Ph.D.
An abstract of a dissertation submitted in partial fulfillment of the requirements for the degree of Doctor of Philosophy in the Department of
Pharmacology and Cancer Biology in the Graduate School of Duke University
2009

Copyright by Jessica Dawn Kessler
2009

iv
Abstract
Studying the early stages of cancer can provide important insight into the
molecular basis of the disease. In many human cancers, such as prostate, pancreatic, and
colon cancer, a pre-neoplastic, or intermediate, stage of the disease has been identified.
The pre-neoplastic stage is presumed to be a transition during which normal cells
undergo malignant transformation. However, the link between the pre-neoplastic cells
and end-stage disease has never been formally established. To investigate the fate of
such cells, the patched (ptc) mutant mouse, a model for the brain tumor medulloblastoma
was used. Pre-neoplastic cells (PNCs) are found in most ptc mutants during early
adulthood, but only 15% of these animals develop tumors. Although PNCs are found in
mice that develop tumors, the ability of PNCs to give rise to tumors has never been
demonstrated directly, and the fate of cells that do not form tumors remains unknown.
Genetic fate mapping and orthotopic transplantation provided definitive evidence that
PNCs give rise to tumors and showed that the predominant fate of PNCs that do not form
tumors is differentiation. Moreover, N-myc, a gene commonly amplified in
medulloblastoma, can dramatically alter the fate of PNCs, preventing differentiation and
driving progression to tumors. Importantly, N-myc allows PNCs to grow independently
of hedgehog signaling, making the resulting tumors resistant to hedgehog antagonists.
These studies provide the first direct evidence that PNCs can give rise to tumors, and
demonstrate that identification of genetic changes that promote tumor progression is
critical for designing effective therapies for cancer.

v
Dedication
This dissertation is dedicated to my family. I could never have accomplished this without
their love, support, and unswerving faith in me. I love you Mommy, Daddy, and
Marissa. Thank you for always being there for me, no matter what. Without you, none of
this would have been possible.

vi
Contents
Abstract .............................................................................................................................. iv
List of Tables ..................................................................................................................... ix
List of Figures ..................................................................................................................... x
List of Abbreviations ........................................................................................................ xii
Acknowledgements........................................................................................................... xv
1. Introduction..................................................................................................................... 1
1.1 The cerebellum........................................................................................................ 1
1.2 Medulloblastoma..................................................................................................... 2
1.3 Granule Neuron Precursors..................................................................................... 6
1.4 Sonic Hedgehog pathway ....................................................................................... 8
1.5 Ptc+/- mouse model................................................................................................ 10
1.6 Pre-neoplastic lesions in the ptc+/- mutant mice.................................................... 12
2. Tracking the fate of pre-neoplastic cells....................................................................... 15
2.1 Introduction........................................................................................................... 15
2.2 Results................................................................................................................... 17
2.2.1 Pre-neoplastic cells disappear from the surface of the cerebellum.................. 17
2.2.2 Pre-neoplastic lesions exhibit little apoptosis .................................................. 21
2.2.3 BrdU labeling cannot be used to in vivo track the fate of pre-neoplastic cells 22
2.2.4 Generation of a transgenic reporter mouse to label PNCs in vivo ................... 24
2.2.5 Math1+ cells labeled with AP retain label after cell cycle exit ....................... 28
2.2.6 Most pre-neoplastic cells undergo differentiation and migration .................... 29

vii
2.2.7 Differentiated pre-neoplastic cells have lost the WT allele of ptc ................... 31
2.2.8 Pre-neoplastic cells can give rise to tumors ..................................................... 33
2.3 Discussion ............................................................................................................. 35
3. Altering the fate of pre-neoplastic cells ........................................................................ 40
3.1 Introduction........................................................................................................... 40
3.2 Results................................................................................................................... 42
3.2.1 Pre-neoplastic cells form tumors in an orthotopic transplantation assay......... 42
3.2.2 N-myc increases the tumorigenic potential of pre-neoplastic cells ................. 45
3.2.3 N-myc maintains proliferation and prevents differentiation of PNCs ............. 49
3.2.4 N-myc renders tumors resistant to hedgehog antagonists................................ 53
3.3 Discussion ............................................................................................................. 56
4. Identifying other genes important for PNC transformation.......................................... 62
4.1 Introduction........................................................................................................... 62
4.1.1 FosB ................................................................................................................. 63
4.1.2 KLF4 ................................................................................................................ 64
4.1.3 FoxF2 ............................................................................................................... 65
4.2 Results................................................................................................................... 67
4.2.1 Overexpression of anti-differentiation genes in GNPs and tumor cells........... 67
4.2.2 The role of FosB, KLF4, and FoxF2 in tumor initiation ................................. 71
4.3 Discussion ............................................................................................................. 75
5. Discussion ..................................................................................................................... 80
5.1 Pre-neoplastic lesions are an intermediate stage of tumorigenesis....................... 81
5.2 Pre-neoplastic lesions in human tumors ............................................................... 83

viii
5.3 Pre-neoplastic cells are susceptible to additional mutations................................. 84
5.4 Resistance to Shh antagonists ............................................................................... 86
5.5 Oncogene addiction .............................................................................................. 89
5.6 Concluding Remarks............................................................................................. 90
6. Materials and Methods.................................................................................................. 92
6.1 Animals ................................................................................................................. 92
6.2 In vivo labeling of GNPs, pre-neoplastic, and tumor cells ................................... 93
6.3 Tissue preparation, cryosectioning, and staining.................................................. 93
6.3.1 Tissue Preparation............................................................................................ 93
6.3.2 Hematoxylin and Eosin staining ...................................................................... 93
6.3.3 Alkaline Phosphatase staining ......................................................................... 94
6.3.4 Immunofluorescence........................................................................................ 94
6.3.5 Double IF/AP staining ..................................................................................... 95
6.3.6 X-gal staining................................................................................................... 95
6.4 TUNEL ................................................................................................................. 95
6.5 Pre-neoplastic lesion quantitation and analysis .................................................... 96
6.6 Laser capture microdissection............................................................................... 96
6.7 Isolation and retroviral infection of PNCs and tumor cells .................................. 97
6.8 Intracerebellar transplantation .............................................................................. 97
6.9 Proliferation Assays .............................................................................................. 98
6.10 RNA isolation, cDNA synthesis, and real-time RT-PCR................................... 99
References....................................................................................................................... 100
Biography........................................................................................................................ 117

ix
List of Tables
Table 1: The majority of M-ptc mice have GFP+ lesions at 6 weeks but most disappear by 12 weeks of age............................................................................................................ 19
Table 2: Pre-neoplastic lesions decrease in frequency and size over time ....................... 21
Table 3: Pre-neoplastic cells rarely form tumors after transplantation............................. 45
Table 4: Expression of genes-of-interest identified between GNPs and ptc+/- tumor cells........................................................................................................................................... 68
Table 5: Tumor incidence after PNC infection with microarray genes ............................ 72

x
List of Figures
Figure 1: The anatomy of the cerebellum........................................................................... 2
Figure 2: Granule neuron precursor development .............................................................. 7
Figure 3: Sonic hedgehog signaling pathway ................................................................... 10
Figure 4: Ptc+/- mice have large cerebellar tumors and pre-neoplastic lesions ................ 13
Figure 5: ptc+/- mice have ectopic Math1-GFP+ cells on the surface of their cerebellum.18
Figure 6: Volume and number of pre-neoplastic lesions in 6- and 12-week old mice. .... 20
Figure 7: Pre-neoplastic lesions contain few apoptotic cells ............................................ 22
Figure 8: BrdU labeling cannot be used to long-term label GNPs or PNCs .................... 24
Figure 9: Generation of transgenic reporter mouse to label PNCs ................................... 25
Figure 10: MAP mice can be used to label Math1+ cells. ................................................ 27
Figure 11: Math1+ cells retain expression of the AP reporter long term ......................... 28
Figure 12: The majority of pre-neoplastic lesions undergo differentiation and migration31
Figure 13: Differentiated PNCs have lost the wild-type allele of ptc............................... 33
Figure 14: Pre-neoplastic lesions can give rise to tumors in vivo..................................... 34
Figure 15: Pre-neoplastic cell transplantation experimental design ................................. 43
Figure 16: PNCs differentiate after orthotopic transplantation......................................... 44
Figure 17: Pre-neoplastic cells that do not form tumors after transplantation.................. 45
Figure 18: Experimental design for viral infection and transplantation of PNCs............. 46
Figure 19: N-myc increases the tumorigenic potential of PNCs ...................................... 48
Figure 20: Pre-neoplastic cells can be induced to differentiate by bFGF......................... 50
Figure 21: N-myc overexpression prevents FGF induced differentiation of PNCs.......... 50

xi
Figure 22: N-myc promotes proliferation and prevents differentiation of PNCs ............. 52
Figure 23: N-myc prevents differentiation by suppressing p27 expression ..................... 53
Figure 24: Cyclopamine does not prevent N-myc infected PNCs from forming tumors . 54
Figure 25: Tumors from N-myc infected PNCs are resistant to hedgehog antagonists.... 55
Figure 26: Ptc+/- tumors overexpress FosB and KLF4 as compared to WT GNPs .......... 69
Figure 27: Ptc+/- tumor cells express KLF4 and FoxF2 protein ....................................... 70
Figure 28: KLF4 infected PNCs gave rise to a tumor ...................................................... 73
Figure 29: Tumor from KLF4 infected PNCs expresses KLF4 and GFP......................... 74

xii
List of Abbreviations 3H-Td [methyl-3H]thymidine
aCGH array comparative genomic hybridization
AP Alkaline Phosphatase
β2-M Beta-2-microglobulin
β-gal Beta-galactosidase
bFGF Basic fibroblast growth factor
BMP Bone morphogenic protein
BrdU Bromodeoxyuridine
CC-3 Cleaved caspase 3
Cos2 Costal-2
EGL External granule layer
ER Estrogen receptor
ES Embryonic stem cells
FACS Fluorescence activated cell sorting
GFP Green fluorescent protein
GNP Granule neuron precursor
FGF Fibroblast growth factor
FosB FBJ osteosarcoma viral oncogene homolog B
FoxF2 Forkhead transcription factor F2
Fu Fused

xiii
H&E Hematoxylin and Eosin staining
Hh Hedgehog
IF Immunofluorescence
IGL Internal granule layer
IP Intraperitoneal
iPS Induced pluripotent stem cells
KLF4 Krüppel-like factor 4
LCA Large-cell anaplastic tumors
LCM Laser capture microdissection
LSL LoxP-stop-LoxP cassette
MAP Math1-CreER/AP/ ptc+/- mice
MB Medulloblastoma
Math1 Mouse atonal homolog 1
ML Molecular layer
M-ptc Math1-GFP/ptc+/- mice
MSCV Mouse stem cell virus
PACAP Pituitary adenylate cyclase activating polypeptide
PBS Phosphate buffered saline
PFA Paraformaldehyde
hPLAP human placental alkaline phosphatase
PNC Pre-neoplastic cell

xiv
Ptc Patched
RT Room temperature
Shh Sonic Hedgehog
Smo Smoothened
SUFU Suppressor of Fused
Tam Tamoxifen
TUNEL Terminal deoxynucleotidyl transferase dUTP nick end labeling
VZ Ventricular zone
WT Wild‐type

xv
Acknowledgements
First and foremost, I have to thank my mentor, Rob, for all of his support. No
mere words can express my gratitude for his role in my graduate training. When I entered
graduate school, I knew the most important decision that I would have to make would be
deciding who to choose as a mentor. Lucky for me, the decision turned out to be
surprisingly easy. Rob, throughout the past five years, you have provided me with
immeasurable support, encouragement, wisdom, and laughter. You believed in me and
my project at a time when even I didn’t. For that, I will always be grateful. You have
taught me to be the best scientist I can be, to think critically, to ask important, tough
questions, and to never give up. I am so thankful that I was on this journey with you at
the helm. You have been more than a boss to me…you’ve been a teacher and a friend. As
I move on to the next phase in my career, I know for certain that I will continue to have
your support and encouragement. Thank you for making this process, while at times
difficult, overwhelming, and stressful, an absolute joy and a source of great pride.
I would also like to acknowledge my committee for all of their help and support
throughout this entire process. Dennis, Sally, Xiao-Fan, and Fan, I truly appreciate your
willingness to help guide me in my career, both scientifically and personally.
A gigantic thank you also goes to the members of the Wechsler-Reya lab.
Working with all of you has been an absolute pleasure. From lab meetings, to holiday
parties, to lunch time in Rob’s outer office, I have treasured both my personal and my
professional relationships with each of you. A special thank you goes to Tracy-Ann Read.

xvi
TAR, we started this road together, and we’re ending it together. I cannot imagine this lab
without you, and your friendship means the world to me.
No acknowledgement page would be complete without thanking my rock, Zack
Hartman. Zack, you are my best friend and one of the major reasons that I can smile at
the end of a rough day filled with failed experiments. Thank you for always being there
for me, no matter what. You always know exactly how to make me laugh and you
constantly challenge me. What more could I ask for? I’m so lucky to have you in my life.
Graduate school would have been a lot tougher without you, and I am eternally grateful
for your unending faith in me!
Last, I have to thank my family. Mom, Dad, and Marissa, you three are the very
best family in the world. It hasn’t always been easy, and the road to the Ph.D. has often
seemed interminable. The three of you know better than anyone how much achieving this
goal means. Mom and Dad, thank you for always pushing me to be the very best version
of myself. You gave me all of the tools in life I needed to succeed and supported me
every step of the way. Mommy, my very first scientific mentor, thank you for always
encouraging my intellectual curiosity, for being a shoulder to cry on (in happiness and
sadness), and for being the world’s best cheerleader. Daddy, thank you for molding me
into the strong, independent person that I have become. Your love and support know no
bounds. Marissa, you are simply the best sister. Wise, understanding, compassionate, and
honest, you have carried me through many tough times. You’re my best friend. It goes
without saying, I love you all.

1
1. Introduction
1.1 The cerebellum
The cerebellum (Latin for “little brain”) is located in the hindbrain, and although
it constitutes only 10% of total brain volume, it contains 50% of the total neurons in the
entire brain. Its anatomy is composed of three main regions: the midline vermis and two
lateral hemispheres (Figure 1). The cerebellum undergoes most of its maturation
postnatally in the rodent brain and increases dramatically both in size and complexity
throughout the first several weeks of life. As the mature cerebellum develops, it becomes
highly foliated with many lobes and fissures (Goldowitz and Hamre 1998). The adult
cerebellar cortex itself is comprised of three main neuronal classes, the granule neurons,
Purkinje cell neurons, and deep cerebellar nuclei. It is the connections between these
neurons that modulates output from the cerebellar cortex (Chizhikov and Millen 2003).
The primary function of the cerebellum is to coordinate motor control. However, in
humans, more recent evidence has suggested a role for the cerebellum in cognitive
functions such as learning, language, and perception (Glickstein 2007).
The cerebellum has also been linked to a number of human syndromes that are
characterized by cerebellar defects causing ataxia, cerebral palsy, and epilepsy. These
syndromes are often associated with hypoplasia or agenesis of the cerebellum. Defects in
the cerebellum have more recently been implicated in mental retardation, as well as
autism (Chizhikov and Millen 2003). While these syndromes are usually caused by a lack
of cerebellar neuron proliferation or premature differentiation, the cerebellum can also be
affected by hyperplasia, which can lead to tumorigenesis. Thus, proper formation of the

2
cerebellum is critical for normal brain function and developmental defects can lead to
severe consequences in humans.
Figure 1: The anatomy of the cerebellum
The cerebellum is located in the hindbrain above the brain stem. It is composed of three regions, the two lateral hemispheres (H) and the midline vermis (V).
1.2 Medulloblastoma
Elucidating the link between development and tumorigenesis is critical for
understanding the molecular basis of human cancers. Cancer is largely viewed as a
disease initiated by aberrant regulation of normal cells, cell functions, and signaling
pathways. It is knowledge of these cellular and molecular changes that will ultimately
lead to improvements in early identification and diagnosis, as well as molecularly
targeted therapeutics. One such tumor in which the translation from the bench to bedside
is becoming increasingly real is the pediatric brain tumor medulloblastoma.

3
Medulloblastoma (MB) is an aggressive tumor of the cerebellum that is the most
malignant childhood brain tumor, and if left untreated can disseminate throughout the
central nervous system (Crawford, MacDonald, and Packer 2007). Although it occurs
primarily in children (mean age of 8), medulloblastoma can present later in adulthood
accounting for approximately 30% of cases (Cervoni et al. 1994). The current treatment
strategy for medulloblastoma includes a combination of surgical resection,
chemotherapy, and radiotherapy (Ellison et al. 2003). Clinical outcomes for
medulloblastoma patients vary widely based on age at diagnosis, residual tumor after
surgical removal, and metastatic stage. Therefore, MB patients can be classified as either
high or standard risk based on these categories (Rossi et al. 2008). The therapeutic
regimens described have significantly improved the 5-year survival rate of high risk
patients to 60-65%, and nearly 90% for standard risk patients (Crawford, MacDonald,
and Packer 2007). While these cure rates are highly encouraging, patients undergoing
these treatments develop severe and lasting side effects that include cognitive and
neurologic defects, as well as occurrence of other tumors later in life (Packer 2008).
Therefore, understanding the molecular basis of these tumors and the cells from which
they arise is critical for developing better diagnostic tools and treatment modalities that
specifically target the tumor cells.
Currently, the World Health Organization (WHO) recognizes five individual
subtypes of medulloblastoma: classic medulloblastoma, nodular/desmoplastic
medulloblastoma, medulloblastoma with extensive nodularity (MBEN), large-cell
medulloblastoma, and anaplastic medulloblastoma (Louis et al. 2007). Each of these

4
subtypes presents with unique features that distinguish it from the others, despite the fact
that they all develop in the cerebellum. Classic medulloblastoma, the most common of
the subtypes occurring in 75-80% of all cases, presents as sheets of small, round,
undifferentiated cells (Gilbertson and Ellison 2008). Classic MB is generally found in
children and is associated with a poorer prognosis than other subtypes.
Nodular/desmoplastic medulloblastoma consists of nodules containing differentiated or
apoptotic neuronal cells (“pale islands”), surrounded by desmoplastic zones of
proliferating cells. This subtype is generally found in the cerebellar hemispheres, in
contrast to other subtypes which are mostly located in the vermis. Nodular/desmoplastic
MBs account for approximately 10% of all cases, primarily occur in adulthood, and have
a better prognosis than classic tumors (McManamy et al. 2003). Finally, the large-
cell/anaplastic (LCA) tumors can be grouped together for purposes of clinical and
molecular analysis, since they share morphological and phenotypic characteristics. These
tumors account for the remaining percentage of cases and are associated with an
extremely poor prognosis. The hallmarks of the LCA tumors include large round cells
with a single nucleolus and both high mitotic and apoptotic indices (Giangaspero et al.
1992; McManamy et al. 2003).
The wide diversity of histological variation, prognoses, and onset that exists
between the medulloblastoma subtypes suggests that these tumors may arise from distinct
subpopulations of cells. In that regard, identifying the “cell of origin” of medulloblastoma
(i.e the cell from which the tumor arose) is of great interest to both researchers and
clinicians. By comparing tumor cells to their cell of origin, one can apply what is known

5
about the biology of the normal cell to understand the behavior of the tumor cell.
Furthermore, insight can be gained into the genes and proteins that are critical for tumor
initiation and progression within a given cell type.
Although it is possible that the medulloblastoma cell of origin could be a stem
cell, it is also possible that other cell types such as lineage restricted progenitors or even
differentiated cells could become transformed with the appropriate mutations. Indeed, the
cerebellum is particularly vulnerable to such mutations because it is comprised of several
different cell types that are highly proliferative that could be targets for transformation.
The cerebellum is unique in that it contains two germinal zones. The first is the
ventricular zone germinal neuroepithelium (VZ). The VZ contains multipotent neuronal
stem cells that give rise to the majority of the cell types in the cerebellum, including
Purkinje cells, golgi cells, basket and stellate cells, as well as glial cells (Altman and
Bayer 1997). The second germinal zone exists on the surface of the cerebellar cortex. The
external granule layer (EGL) is comprised of highly proliferative, lineage restricted
progenitors called granule neuron precursors (GNPs) (Altman and Bayer 1997). GNPs
only give rise to mature granule neurons, which comprise the majority of the neurons
within the cerebellum. In humans, these cells proliferate embryonically, however a subset
of these cells do remain quiescent on the surface of the cerebellum through the first year
of life (Abraham et al. 2001). While these two germinal zones contain the majority of the
stem and progenitor cells, recently investigators have identified a third population of cells
that could serve as the cell of origin for medulloblastoma. In postnatal mouse cerebella
white matter, a small population of CD133+, proliferating, multipotent stem cells was

6
identified that can give rise to astrocytes, oligodendrocytes, and neurons (but not GNPs)
(Lee et al. 2005). Therefore, there are at least three distinct populations of cells within the
cerebellum that could give rise to medulloblastoma.
1.3 Granule Neuron Precursors
At least one subtype of medulloblastoma (nodular/desmoplastic) is thought to
arise from the granule neuron precursors (GNPs). GNPs are the most abundant neurons in
the brain and they undergo a unique developmental life cycle that is quite distinct from
other neurons in the brain which arise in the ventricles and migrate outward. GNPs
proliferate embryonically in the first of two ventricular zones, the rhombic lip, where
they are specified by and require the basic-helix-loop-helix transcription factor mouse
atonal homolog 1 (Math1) (Ben-Arie et al. 1997). By postnatal day 0 (P0), the GNPs
have circumferentially migrated and populated the outer region of the cerebellar anlage
(the EGL) as a single layer of undifferentiated cells (Figure 2) (Goldowitz and Hamre
1998). In the EGL, GNPs undergo a rapid population expansion and proliferate robustly
to the mitogen Sonic Hedgehog (Shh), which is secreted from the Purkinje cell layer
below (Dahmane and Ruiz-i-Altaba 1999; Wallace 1999; Wechsler-Reya and Scott
1999). As newer GNPs are generated, older GNPs will exit the cell cycle and migrate
along Bergmann glia through the molecular layer past the Purkinje cell layer into the
internal granule layer (IGL), where they reside as terminally differentiated granule
neurons (Wechsler-Reya and Scott 2001). This process continues throughout the first

7
three weeks of life, until P21, at which point all of the GNPs have exited the cell cycle
and migrated, leaving the surface of the cerebellum clear of any cell bodies (Figure 2).
Figure 2: Granule neuron precursor development
Granule neuron precursors (GNPs) reside in the external granule layer (EGL) on the surface of the cerebellum at P0. The cells proliferate robustly to Shh, reaching peak proliferation at P7. As newer GNPs are generated, older GNPs exit the cell cycle, differentiate, and migrate past the Purkinje cell layer (PL) into the internal granule layer (IGL). This process continues through P14, with more of the cells differentiating. By adulthood, all of the GNPs have differentiated, leaving the molecular layer (ML) clear of cells, and the mature granule neurons now exist in the IGL.
The life-cycle of GNP development has been extremely well-studied both in vivo
and in vitro. Usefully, GNPs can be isolated intact from the postnatal cerebellum and
cultured in vitro as primary neuronal cultures for up to one week. In this cell isolation
preparation, whole postnatal cerebella can be enzymatically dissociated and fractionated
using a density gradient. Since the GNPs are small, round, undifferentiated cells, they
will fractionate at a distinct density and other differentiated cell types are destroyed in the
process (Wechsler-Reya and Scott 1999). Using this preparation, GNPs can be isolated to
90% purity. After isolation, GNPs can continue to proliferate in vitro when treated with

8
exogenous Shh. Alternatively, cultured GNPs can be induced to differentiate into mature
granule neurons. The ability to isolate and culture these cells in vitro is extremely
powerful and has allowed for in depth study of the signals and mechanisms that govern
proliferation, differentiation, and migration of the GNPs.
Although it is now well established that Shh is the mitogen for GNPs, the signals
that promote GNP differentiation and migration are less clear. Several factors, including
bone morphogenic proteins (BMPs), pituitary adenylate cyclase activating polypeptide
(PACAP), and extracellular matrix molecules such as vitronectin, and fibroblast growth
factors (FGFs) have all been shown to promote GNP differentiation (Fogarty et al. 2007;
Nicot et al. 2002; Pons et al. 2001; Rios et al. 2004; Zhao et al. 2008). Regardless of the
signals that mediate cell cycle exit, it is clear that maintaining the balance between Shh
induced proliferation and differentiation is critical for proper cerebellar formation.
1.4 Sonic Hedgehog pathway
Sonic Hedgehog is member of the Hedgehog (Hh) family, an evolutionarily
conserved group of proteins that are critical for the proper development of a variety of
organisms. Although Hh and many of the components of the Hh pathway were first
identified in Drosophila melanogaster (Nusslein-Volhard and Wieschaus 1980), the
importance of this pathway was soon identified in vertebrate tissues and organs as well
(Echelard et al. 1993; Krauss, Concordet, and Ingham 1993; Riddle et al. 1993). Shh
itself is a secreted protein that undergoes a series of modifications in the signaling cell,
including autocleavage, cholesterol modification, and palmitoylation to produce the

9
active form capable of triggering downstream signaling (Porter, Young, and Beachy
1996). One of the key players in this pathway is the Shh receptor Patched (Ptc). Ptc is a
twelve-pass transmembrane protein expressed on the surface of the receiving cell. In the
absence of Shh ligand, Ptc represses the activity of a seven-pass transmembrane protein
called Smoothened (Smo), thereby preventing transcription of hedgehog pathway target
genes (Figure 3A) (Alcedo et al. 1996). The repression of Smo inhibits target gene
expression by allowing an inactivation complex consisting of the kinesin Costal2 (Cos2)
and the serine-threonine kinase Fused (Fu) to tether the transcription factor Gli to the
microtubules. This effectively retains Gli in an inactive state in the cytoplasm, and a
repressor form of Gli enters the nucleus to keep transcription deactivated. This inhibition
of Gli is aided by the presence of suppressor of fused (Sufu) on the nuclear membrane
(Figure 3A).
In contrast, when Shh binds to Patched, the Shh-Ptc complex is internalized and
its activity is inhibited, thereby alleviating repression of Smo (Hooper and Scott 2005).
As a consequence, Smo becomes activated, which leads to the release of the transcription
factor Gli from the Cos2/Fu complex. The active form of Gli can then translocate to the
nucleus and turn on target genes to mediate downstream cellular effects (Figure 3B)
(Hooper and Scott 2005). In GNPs, previous data have shown that activation of the Shh
pathway leads to upregulation of the Shh target genes N-myc and CyclinD1, thereby
promoting proliferation (Kenney, Cole, and Rowitch 2003; Oliver et al. 2003).

10
Figure 3: Sonic hedgehog signaling pathway
(A) In the absence of Shh ligand, ptc functions as a repressor of the signal transducing molecule Smoothened. This keeps the transcription factor Gli tethered to the microtubules in the cytoplasm by Costal2 and Fused in collaboration with Sufu. Without Shh binding, a repressor form of Gli is present in the nucleus and prevents transcription. (B) When Shh ligand binds ptc, the Shh-ptc complex is internalized and Smo translocates to the cell membrane. Activation of Smo dissociates Gli from the inactivation complex. Gli can then enter the nucleus and turn on downstream target genes.
1.5 Ptc+/- mouse model
Since ptc is both the receptor and the antagonist of the Shh pathway, loss of the
antagonist would lead to constitutive activation of Shh target genes even in the absence of
Shh ligand. To determine the effects of loss of ptc, a homozygous knockout mouse was
generated (Goodrich et al. 1997). The ptc locus was disrupted with the β-galactosidase
gene (β-gal), which allowed for visualization of active Shh signaling, since Shh also
induces expression of the ptc gene in a negative feedback loop. Underscoring the
importance of the Shh pathway for proper embryogenesis, ptc-/- mice die embryonically
at E9.5, due to a variety of causes including heart defects and failed neural tube closure

11
(Goodrich et al. 1997). Interestingly, ptc heterozygotes (ptc+/-) that were mutant for only
one copy of ptc survived until adulthood and were phenotypically normal. However,
between three and six months of age, 15-20% of the ptc+/- mice began to present with
clinical symptoms including ataxia, loss of grooming habits, and disfigured heads that
were ultimately fatal (Goodrich et al. 1997; Wetmore, Eberhart, and Curran 2000). Upon
further analysis, it was discovered that the ptc+/- mice had large cerebellar tumors that
very closely resembled human medulloblastomas (Figure 4A).
These data were quite striking, because patients with inherited mutations in the
ptc gene have nevoid basal cell carcinoma syndrome (Gorlin’s syndrome), (Hahn et al.
1996; Johnson et al. 1996). Gorlin’s syndrome presents with skeletal deformities, basal
cell carcinomas, and a high incidence of sporadic medulloblastomas (Gorlin 1995). In
addition, mutations in the ptc gene were identified in numerous sporadic desmoplastic
medulloblastomas (Pietsch et al. 1997; Raffel et al. 1997). This correlation between ptc
mutations and medulloblastoma led to the theory that ptc may function as a tumor
suppressor gene. Since a significant proportion of human medulloblastomas have
activating mutations in the Shh pathway, these mice have become a valuable model for
the human disease (Dellovade et al. 2006; Fogarty, Kessler, and Wechsler-Reya 2005).
Since the discovery that the ptc+/- mouse developed medulloblastoma, much
attention has been focused on understanding the molecular mechanisms that govern this
process. To that end, numerous other mouse models of the disease have subsequently
been generated. For example, transgenic mice that overexpress the activated form of Smo
(SmoA1 mice) specifically in GNPs develop medulloblastomas at a much higher

12
penetrance (80%) (Hallahan et al. 2004). In addition, the ptc+/- mice have also been
crossed to p53-/- mice, and these mice develop tumors with 100% penetrance (Wetmore,
Eberhart, and Curran 2001). Crossing the ptc+/- mice to DNA repair mutant mice such as
DNA ligase 4 null or BRCA2 null mice also significantly increases the tumor incidence
in these animals (Frappart et al. 2007; Lee and McKinnon 2002). While these variations
on the ptc+/- mouse model have yielded important information, the high degree of
genomic instability and the high incidence of tumors may make them less valuable for
studying the genetic changes necessary for transformation. These models are more useful
for studies involving potential therapeutics in which complete penetrance is necessary to
ensure the efficacy of the treatment being administered (Romer and Curran 2005). The
fact that the ptc+/- mice only develop tumors in a subset of the heterozygous population
suggests that these cells are accumulating mutations at a slower rate that may more
accurately reflect what occurs in the human disease.
1.6 Pre-neoplastic lesions in the ptc+/- mutant mice
One unique aspect of the ptc+/- mice was identified when adolescent cerebella
from these mice were examined. In contrast to wild-type animals that no longer have any
proliferating GNPs on the surface of the cerebellum, by adulthood the majority of ptc+/-
mice still have clusters of proliferating cells on the cerebellar surface (Goodrich et al.
1997; Kim et al. 2003; Oliver et al. 2005). These ectopic cells resemble GNPs in terms of
location, morphology, and active Shh signaling (as evidenced by the expression of β-gal)
(Figure 4B). Based on these observations, it was hypothesized that these cells represent

13
an intermediate stage between normal GNPs and medulloblastoma cells referred to as
pre-neoplastic cells (PNCs). If these cells do in fact represent a pre-neoplastic stage, as
opposed to developmentally delayed GNPs that are not pre-malignant, then the PNCs
could shed light on the steps that are necessary for tumorigenesis. By investigating the
fate of these cells, a greater understanding of the link between normal GNP development
and medulloblastoma can be gained.
Figure 4: Ptc+/- mice have large cerebellar tumors and pre-neoplastic lesions
Cerebella from a 12-week-old ptc+/- mouse with a tumor (A) and from a 6-week-old ptc+/- mouse (B) were fixed and stained with X-gal. Both the tumors and the pre-neoplastic lesions express high levels of the mutant patched allele, which contains the β-galactosidase gene. 70-80% of mutant ptc+/- mice have these X-gal+ lesions on the surface of their cerebella. Figure reproduced with permission from Development (see citation Oliver et. al 2005).
While PNCs are found in 70-80% of mice between 3 and 8 weeks of age, only 15-
20% of ptc+/- will go on to develop tumors (Oliver et al. 2005). These findings raise
several key questions. First, do PNCs actually give rise to tumors? The fact that they are
present in animals destined to develop medulloblastoma is certainly consistent with this
possibility, but it is also possible that tumors arise from a distinct population of cells (e.g.

14
neural stem cells). Second, what is the fate of PNCs in animals that do not develop
tumors? Do they simply die, or can they undergo the same pattern of differentiation and
migration as normal GNPs? And finally, are the PNCs that do not form tumors
irreversibly committed to their fate, or do they retain the capacity to form tumors if given
the appropriate genetic stimuli? These questions will be addressed in the chapters that
follow.

15
2. Tracking the fate of pre-neoplastic cells
2.1 Introduction
Tumorigenesis is a multi-step process in which cells progressively accumulate
changes in genes that regulate growth, survival, differentiation and migration (Hanahan
and Weinberg 2000). Studying the early stages of the disease can provide important
insight into the steps involved in transformation of normal cells into tumor cells. In many
cancers, including colon, prostate, pancreatic, and breast cancer, this transition is thought
to occur through a pre-neoplastic stage (Levine and Ahnen 2006; Mokbel and Cutuli
2006; Montironi et al. 2007; Singh and Maitra 2007). These proliferative lesions
resemble their end-stage tumor in terms of location, morphology, and organization. While
the lesions themselves do not meet the criteria for cancer, their presence is thought to
predispose to cancer, and cancers are thought to arise from them. But while studies of
human tissues are consistent with this view, even in mouse models there has been little
direct evidence that pre-neoplastic lesions give rise to cancer. In order to make
conclusions about the end-stage tumors from the pre-neoplastic lesions, it is imperative to
demonstrate that these lesions represent a true transitional stage that can give rise to the
disease.
The ptc+/- mouse model provides a unique and valuable tool to study the pre-
neoplastic stage. By investigating the transition from normal GNP development to
medulloblastoma, insight into the steps necessary for transformation can be gained.
Although pre-neoplastic lesions have long been assumed to be an intermediate stage of
ptc+/- tumorigenesis, this hypothesis has never been proven (Kim et al. 2003; Oliver et al.

16
2005; Pazzaglia et al. 2006; Pogoriler et al. 2006). PNCs are highly proliferative and
resemble medulloblastoma cells in terms of morphology and location in the cerebellum.
Furthermore, in contrast to GNPs in the ptc+/- mouse, both PNCs and tumor cells have
lost the wild-type (WT) allele of ptc (Oliver et al. 2005). This loss of ptc is hypothesized
to be the “first hit” that allows a GNP to transition into a PNC. Interestingly, microarray
analysis revealed that the gene expression signature of PNCs is distinct from that of both
GNPs and tumor cells. Taken together, these data identify the pre-neoplastic lesions as a
likely candidate for transformation, while leaving several important questions
unanswered.
One such question concerns the fate of PNCs that do not give rise to tumors.
Since 70-80% of ptc+/- mice have pre-neoplastic lesions, but only 15% of these animals
go on to develop tumors, these data suggest that the lesions themselves are transient and
likely not fully transformed. Indeed, Ptc+/- mice that do not develop tumors no longer
have PNCs on the surface of the cerebellum. Do these cells undergo apoptosis, or are
they capable of differentiating and migrating? Understanding what happens to PNCs that
do not give rise to tumors, will shed light on why some of them do. Since it is also
formally possible that PNCs do not represent the source of the tumors, a second
important question to address is whether or not these cells can give rise to tumors in vivo.
Although PNCs are the most obvious candidate, there are several other proliferating cell
types in the cerebellum such as embryonic and postnatal stem cells that could be the cell
of origin for the tumor. Therefore, to make the claim that pre-neoplastic lesions are a true
intermediate stage, it is necessary to show that medulloblastomas arise from PNCs.

17
To address these questions, a detailed analysis of the fate of pre-neoplastic cells in
the ptc+/- mouse was undertaken. Understanding what happens to PNCs required a
method of permanently labeling these cells in vivo. To that end, a novel reporter mouse to
genetically mark PNCs was generated. Using this mouse, the data showed that the
majority of PNCs undergo differentiation and migrate into the internal granule layer
(IGL) of the cerebellum. However, in some animals, PNCs continue to divide and
ultimately give rise to tumors. These data firmly establish the PNCs as a population of
cells that exist at a critical decision point along the path to tumorigenesis.
2.2 Results
2.2.1 Pre-neoplastic cells disappear from the surface of the cerebellum
Although the majority of 3-8-week-old ptc+/- mice have PNCs in their cerebellum
(Oliver et al. 2005), the fate of these cells has never been analyzed in detail. To
investigate this, ptc+/- mice were crossed with Math1-GFP transgenic mice (Lumpkin et
al. 2003; Oliver et al. 2005), which express green fluorescent protein under the control of
the Math1 enhancer. Math1 is a transcription factor that is expressed in proliferating
GNPs and is maintained in PNCs and tumor cells from ptc+/- mice (Ben-Arie et al. 2000;
Kim et al. 2003; Lee et al. 2003; Lumpkin et al. 2003; Oliver et al. 2005). Consistent with
this, GFP expression co-localized with the proliferation marker Ki67 (red) and was
detected in the EGL of neonatal Math1-GFP mice (Figure 5A), and in pre-neoplastic
lesions and tumors in adult Math1-GFP;ptc+/- (M-ptc) mice (Figure 5B, C). Using the M-

18
ptc mouse, detailed quantitative analysis of the number and size of pre-neoplastic lesions
at various stages was performed. At 6 weeks of age, 75% of M-ptc animals had GFP+
lesions on the surface of their cerebellum, whereas at 12 weeks only 19% of mice had
GFP+ lesions (Table 1), approximating the percentage of animals that ultimately develop
medulloblastoma.
Figure 5: ptc+/- mice have ectopic Math1-GFP+ cells on the surface of their cerebellum.
(A-C) Cerebellar sections from P7 Math1-GFP mice, 5-6 week old Math1-GFP/ptc+/- (M-ptc) mice and tumor bearing M-ptc mice were stained with antibodies specific for the proliferation marker Ki67 (red) and with DAPI, to label all nuclei. Sections were imaged at 20X magnification using a Leica AxioImager and Metamorph software. Note the co-localization of GFP with Ki67 in the EGL (A), in pre-neoplastic lesions (asterisk, B), and in tumors (asterisk, C). EGL-external germinal layer, IGL-internal granule layer, ML-molecular layer.

19
Table 1: The majority of M-ptc mice have GFP+ lesions at 6 weeks but most disappear by 12 weeks of age
M‐ptc mice were sacrificed at either 6 or 12 weeks of age and cerebella were examined for the presence of GFP+ lesions. While the majority of M‐ptc mice have GFP+ lesions at 6 weeks, most of these lesions have disappeared by 12 weeks of age.
Since expression of Math1 is normally linked to proliferation, the loss of Math1-
GFP from the cerebellum at 12 weeks could reflect either cell cycle exit (and consequent
loss of GFP) or disappearance of the cells themselves from the surface of the cerebellum.
To distinguish between these possibilities, cerebella from 6 and 12 week old M-ptc mice
were stained with DAPI (to label all cell nuclei) and examined for the presence of ectopic
cells at the cerebellar surface. At 6 weeks of age, most mice had multiple large lesions on
the surface of their cerebellum (Figure 6A). By 12 weeks, the majority of animals had
fewer lesions and the size of each of these lesions was much smaller (Figure 6B). One 12
week-old mouse had large lesions in its cerebellum (Figure 6C), and likely represented an
animal that would have gone on to develop a tumor; therefore, the data from this animal
were analyzed separately. Quantitative analysis of cerebella from these mice (Figure 6D,
Table 2) revealed that the average number of lesions decreased from 7.8 at six weeks to 3
at twelve weeks, and the average lesion volume decreased from 7.7 mm3 at six weeks to

20
1.4 mm3 at twelve weeks. These studies suggested that a large percentage of PNCs
disappear from the surface of the cerebellum by an as yet unknown mechanism.
Figure 6: Volume and number of pre-neoplastic lesions in 6- and 12-week old mice.
Cerebella from 6 week old and 12 week old M-ptc mice (5 each) were sectioned from end to end, stained with DAPI and imaged at 20X magnification (A-C). At 6 weeks, most animals had multiple large lesions that were densely packed with cells (asterisk, A). In the majority of 12 week old animals, lesions were smaller and the cells were more dispersed (asterisk, B). One 12 week old animal had large lesions (asterisk, C) that resembled tumors. (D) The pre-neoplastic lesions from each animal were imaged and quantitated using MetaMorph software. In the scatter-plot, each point represents a single lesion. At 6 weeks (circles), each animal had many lesions and the majority of these were quite large. By 12 weeks (squares), most M-ptc animals displayed fewer lesions and the median lesion size was much smaller. One 12 week-old animal (triangles, 12 week #10) had many large lesions in its cerebellum. Horizontal lines represent the median volume for each group of lesions.

21
Table 2: Pre-neoplastic lesions decrease in frequency and size over time
To quantitate pre-neoplastic lesions, DAPI-stained cerebella were imaged and lesion area and cell number were quantitated using Metamorph software. Total volume (mm3) of each lesion was calculated by multiplying average lesion area by section thickness and by the number of sections in which the lesion was observed. These data are summarized above.
2.2.2 Pre-neoplastic lesions exhibit little apoptosis
In principle, the disappearance of PNCs could reflect cell death or migration away
from the surface of the cerebellum. To determine whether apoptosis contributed to the
loss of PNCs, cerebellar sections from 5-6 week old ptc+/- mice were stained with
antibodies specific for cleaved caspase-3 (CC-3), a marker of apoptotic cells. Whereas
tumors from these animals contained significant numbers of CC-3+ cells (Figure 7C),
neonatal cerebellum and pre-neoplastic lesions exhibited little or no CC-3 staining
(Figure 7A, B). Similar results were observed using terminal deoxynucleotidyl
transferase dUTP nick end labeling (TUNEL) staining (Figure 7D-F). Although we
cannot rule out the possibility that some PNCs undergo apoptosis, these data suggest that
it is not the primary mechanism of PNC disappearance.

22
Figure 7: Pre-neoplastic lesions contain few apoptotic cells
Neonatal cerebellum (A, D), pre-neoplastic lesions (B, E) and tumors (C, F) were stained with antibodies specific for cleaved caspase-3 (CC-3, A-C) or subjected to TUNEL staining (D-F). Significant amounts of CC-3 and TUNEL staining were detected in tumors (asterisks in C, F), but neonatal cerebellum and pre-neoplastic lesions (asterisks in B, E) contained very few apoptotic cells (arrows). Magnification = 20X
2.2.3 BrdU labeling cannot be used to in vivo track the fate of pre-neoplastic cells
In order to determine the mechanism by which PNCs disappear from the surface
of the cerebellum, the PNCs needed to be labeled long term in vivo. Since PNCs are
highly proliferative, bromodeoxyuridine (BrdU) incorporation was utilized. BrdU, a
thymidine analogue, is incorporated into replicating DNA during S-phase. Antibodies
directed against BrdU could then be employed to locate cells that were proliferating and
had incorporated BrdU (Taupin 2007). To determine if replicating cells in the cerebellum
could be labeled by BrdU, P7 WT mice were administered an intraperitoneal injection

23
(IP) of BrdU and sacrificed either 24 hours or one week post injection. Proliferating
GNPs in the EGL were strongly labeled with BrdU after 24 hours (Figure 8A, B),
confirming that BrdU labeling was possible in vivo. However, despite this initial labeling,
the longer time course revealed that the BrdU label was not retained as the GNPs exited
the cell cycle and migrated into the IGL. After one week, GNPs labeled at P7 very
weakly stained for BrdU, and the majority of the cells in the IGL were no longer positive
(Figure 8C, D). Similarly, when 5 week old M-ptc mice were pulsed with BrdU, their
pre-neoplastic lesions were not positive for BrdU, despite the fact that they were
proliferating (Figure 8E, F). These data were confirmed using multiple methods for BrdU
delivery, including serial IP injection, drinking water, and intracisternal injection
(through the cerebellomedullary cistern) (data not shown). Taken together, these data
suggested that BrdU labeling was not an effective method for long term labeling of
PNCs.

24
Figure 8: BrdU labeling cannot be used to long-term label GNPs or PNCs
Wild-type P7 and 5 week old M-ptc mice were pulsed with BrdU (10mg/mL) via IP injection. (A-D) WT P7 pups were pulsed with BrdU and sacrificed either 24 hours (A-B) or 1 week post injection (C-D, at P14). GNPs in the EGL were highly positive for BrdU (A-B) 24 hours after labeling. By P14, most labeled GNPs had migrated to the IGL but did not retain BrdU labeling (C-D). Magnification 20X. (E-F) 5 week old M-ptc mice were pulsed with BrdU and sacrificed 1 week post injection. Although PNCs were clearly visible on the surface of the cerebellum (F), the PNCs were not labeled with BrdU (E). Magnification 10X.
2.2.4 Generation of a transgenic reporter mouse to label PNCs in vivo
Since transiently labeling PNCs using BrdU did not allow for following the fate
of PNCs, a transgenic reporter mouse strategy was designed. In this experimental design,
ptc+/- mice were crossed with Math1-CreER transgenics, which carry a tamoxifen-

25
inducible form of the Cre recombinase under the control of the Math1 enhancer (Machold
and Fishell 2005) and with R26R-hPLAP mice, which carry a loxP-flanked stop sequence
upstream of the human placental alkaline phosphatase (AP) gene (Figure 9A). The triple
transgenics resulting from these crosses, called MAP (Math1-CreER/AP/ptc+/-) mice,
allowed permanent labeling of Math1-expressing cells upon treatment with tamoxifen.
Since Math1 is expressed embryonically, this temporal control of Cre expression was
critical, as it ensured that only the PNCs and not all of the cells of the granule lineage
would be labeled with the AP reporter at the timepoint of interest (Figure 9B).
Figure 9: Generation of transgenic reporter mouse to label PNCs
(A) Math1-CreER transgenic mice were crossed with R26R-hPLAPflox-stop mice and ptc+/- mice to generate an inducible reporter mouse to label cells of the granule lineage, including pre-neoplastic and tumor cells. (B) Triple transgenic mice (MAP mice) were treated with tamoxifen between 5-6 weeks to excise the stop codon and turn on the AP reporter at the pre-neoplastic stage.
To test the utility of these animals for fate mapping, they were treated with
tamoxifen at postnatal day 8 (P8, to label GNPs), at 4 weeks (to label PNCs) or at onset
of clinical symptoms (to label tumor cells). Mice were sacrificed three days after

26
tamoxifen treatment and cerebellar sections were stained with AP substrate to detect
marked cells. As shown in Figure 10A-B, tamoxifen treatment at P8 resulted in staining
of most GNPs in the EGL and a subset of mature granule neurons in the IGL (presumably
derived from recently differentiated GNPs). Pre-neoplastic lesions (Figure 10C-D) and
tumor cells (Figure 10E-F) could also be labeled in this manner; importantly, AP
expression in adults was restricted to these cells, and no staining was seen in the
surrounding normal cerebellum. Thus, MAP mice allow specific labeling of Math1+
GNPs, PNCs and tumor cells.

27
Figure 10: MAP mice can be used to label Math1+ cells.
Math1-CreER/AP mice were treated with a single dose of tamoxifen at P8 (A, B), and Math1-CreER/AP/ptc+/- (MAP) mice were treated at 28 days (C, D), or when they showed symptoms of medulloblastoma (E, F). Animals were sacrificed 3 days later for short-term labeling (A-F). Adjacent sections were stained with H&E to detect tissue morphology (A, C, E) or with the substrate NBT/BCIP to identify cells in which AP expression had been induced (B, D, F). Magnification 10X. Note the expression of AP in the EGL (arrows in A, B), pre-neoplastic lesions (arrows in C, D), and tumor (F).

28
2.2.5 Math1+ cells labeled with AP retain label after cell cycle exit
To determine whether labeled cells retain AP expression over longer time periods,
animals were treated with tamoxifen at P8 and sacrificed at P21. By this stage, all GNPs
that were expressing Math1 at P8 should have turned off Math1 expression,
differentiated, and migrated into the IGL. As expected, histological staining (Figure 11A)
revealed a molecular layer (ML) nearly devoid of cells and an IGL densely packed with
granule neurons. AP staining revealed expression of the marker in a large proportion of
granule neurons in the IGL (Figure 11B). Interestingly, strong AP staining was also seen
at the surface of the cerebellum; this was associated with the axons of granule neurons,
which are left behind when cells migrate inward. This unique feature of the AP transgene
allowed for tracking not only where labeled cells went, but also where they had been.
Figure 11: Math1+ cells retain expression of the AP reporter long term
(A-B) Math1-CreER/AP mice were treated with a single dose of tamoxifen at P8 and sacrificed 13 days later at P21. AP staining persisted in granule neurons that were exposed to tamoxifen at P8 and allowed to undergo differentiation and migration into the IGL (A, B). Staining was also observed in the processes of these cells that remained at the surface of the cerebellum (arrow, B). Magnification is 10X.

29
2.2.6 Most pre-neoplastic cells undergo differentiation and migration
Having established that MAP mice could be used for long-term labeling of
Math1+ cells, these animals could then be used to track the fate of PNCs. MAP mice
were treated with a single dose of tamoxifen at 4-5 weeks of age (a stage at which PNCs
are the only Math1+ cells in the cerebellum) and cerebella were harvested 3 days, 1
month, or 2 months later. Three days after tamoxifen treatment, pre-neoplastic lesions
were strongly positive for both AP and the proliferation marker Ki67 (Figure 12A, B). In
addition to staining within the lesions themselves, small numbers of AP-expressing cells
were observed in the underlying IGL (Figure 12C, D); these cells did not express Ki67,
but did express the differentiation marker NeuN. Thus, even within three days some
PNCs exit the cell cycle and migrate into the IGL.
One month after tamoxifen treatment (Figure 12E-H), large groups of cells could
still be found on the surface of the cerebellum in many MAP mice (Figure 12E). These
cells expressed AP but were no longer proliferating (note the lack of Ki67 staining in
Figure 12F). In addition, many cells had AP-positive processes and appeared to be
migrating towards the IGL (Figure 12F-H). Both migrating cells and cells within the
primary lesion expressed NeuN (Figure 12G-H), indicating that by this time point the
majority of PNCs had undergone differentiation.
Two months after tamoxifen treatment, few cells were observed at the surface of
the cerebellum (Figure 12I). While some regions of the cerebellar surface exhibited very
strong AP staining (arrows in Figure 12J and K), these regions were largely devoid of cell

30
bodies (arrow, Figure 12I), and the staining appeared to represent the processes of cells
that had migrated into the IGL (Figure 12J-L). AP labeled cells in the IGL lacked Ki67
(Figure 12J) and expressed Gabra6, a marker associated with terminally differentiated
granule neurons (Figure 12K, L). In addition to lesions that exhibited extensive
migration, a small number of PNCs that remained on the surface of the cerebellum were
found; staining for Ki67 and NeuN revealed that these cells had ceased proliferating and
undergone differentiation (data not shown). These data indicate that PNCs are capable of
undergoing differentiation and migration in a pattern similar to that exhibited by normal
granule neurons.

31
Figure 12: The majority of pre-neoplastic lesions undergo differentiation and migration
4-5 week old MAP mice were treated with tamoxifen for 3 days (A-D), 30 days (E-H), or 60 days (I-L). Sections were stained with DAPI (A, E, I) or with the AP substrate Fast Red and with antibodies specific for Ki67 (green in B, F, J), NeuN (green in C, D, G, and H) or Gabra6 (green in K and L). Three days after treatment, AP labeled PNCs within surface lesions express Ki67 (B), but some NeuN+ cells can be seen migrating away from the surface and into the IGL (C, D). Thirty days after treatment, AP positive cells no longer express Ki67 (F) and many NeuN+ cells can be seen migrating into the IGL (G-H). Sixty days after treatment, few cells can be detected at the surface (I), but AP-labeled processes (arrows in J and K) are seen in acellular regions at the surface (arrow in I), and AP-labeled cells expressing the terminal differentiation marker Gabra6 can be found in the underlying IGL (K-L). Magnification: A-C, E-G, 10X; I-K, 20X; D, H, 40X; L, 60X. Regions in D, H, and L correspond to boxes in C, G and K respectively.
2.2.7 Differentiated pre-neoplastic cells have lost the WT allele of ptc
Fate mapping using the MAP mice revealed that PNCs are capable of exiting the
cell cycle and migrating in a manner similar to that of their normal GNP counterparts.
Since previous studies have found that the majority of the pre-neoplastic lesions and all
of the tumors in these mice have lost the wild-type allele of ptc, these data led to the
hypothesis that loss of the WT allele is the “first hit” that allows a GNP to transition into

32
an aberrantly proliferating PNC (Oliver et al. 2005). Taken together, these data suggested
that PNCs can differentiate despite the loss of ptc, and that the PNCs are not fully
transformed. However, these experiments were performed on isolated cells, and this
method selects for proliferating, undifferentiated cells in the EGL. Therefore, it was
formally possible that PNCs undergoing differentiation and migration to the IGL had not
lost the WT allele of ptc and were capable of exiting the cell cycle because they no longer
had active Shh signaling. To test this, laser capture microdissection (LCM) was
performed on WT P7 EGL, as well as on 5 week old ptc+/- mice. LCM is an extremely
precise technique that allows for isolation of single cells or a region of interest from thin
tissue sections. Using this assay, cells expressing certain markers could be specifically
isolated without contamination from surrounding tissue. To determine if differentiated
PNCs had lost WT ptc, it was important to separate proliferating cells from differentiated
cells. To that end, the pre-neoplastic lesions were double stained with antibodies specific
for proliferation (Ki67), or differentiation (NeuN) (Figure 13E-F). The lesions were then
classified and captured as either only proliferating (Figure 13A, D), proliferating and
differentiated (Figure 13B, E), or differentiated (Figure 13C, F). Real time RT-PCR
revealed that the majority of the captured pre-neoplastic lesions had lost the WT allele.
All of the lesions that expressed differentiation markers were null for ptc, indicating that
despite loss of ptc, PNCs can still exit the cell cycle and subvert tumorigenesis.

33
Figure 13: Differentiated PNCs have lost the wild-type allele of ptc
(A-F) Unfixed cerebella from 5 week-old M-ptc mice were cut into 10µM thick sections and stained with DAPI (blue, A-C) and with antibodies specific for Ki67 (green) and NeuN (red, D-F). Regions of pre-neoplastic lesions containing only proliferating cells (A, D), proliferating and differentiated cells (B, E), and only differentiated cells (C, F) were isolated using laser capture microdissection. mRNA was isolated from these cells and real-time RT-PCR was performed using primers specific for beta-2-microglobulin (B2M) and for the wild-type allele of patched (G). With the exception of one proliferating pre-neoplastic lesion, all lesions examined had lost expression of the wild-type allele of ptc. Asterisks represent gel lanes corresponding to captured regions shown in panels D, E and F. Magnification 20X.
2.2.8 Pre-neoplastic cells can give rise to tumors
Although the majority of PNCs undergo differentiation and migration, a subset of
these cells is presumed to persist and give rise to medulloblastoma. But while PNCs have
been suggested to represent the source of tumors in ptc+/- mice, this has never been
formally demonstrated; in fact, some investigators have suggested that tumors could arise

34
from a distinct cell type in the adult cerebellum, such as a multipotent stem cell (Berman
et al. 2002; Hemmati et al. 2003; Li et al. 2003; Singh et al. 2004). To determine whether
tumors are derived from Math1+ PNCs, MAP mice were treated with tamoxifen at 5
weeks of age and sacrificed when they exhibited clinical signs of medulloblastoma. Since
the only Math1+ cells in the cerebellum at this stage are PNCs, if tumors arose from these
cells, they would be positive for the AP reporter. Figure 14A shows a brain from one
such mouse after whole-mount staining for AP. Intense staining can be seen in the tumor,
whereas the normal cerebellum and the rest of the brain are unlabeled. In sections, tumors
are clearly detectable by H&E staining (Figure 14B), and are specifically labeled with AP
substrate (Figure 14C). Among the tumors that were analyzed in these studies (n=6), all
were positive for AP. These results indicate that tumors arise from Math1+ PNCs rather
than from Math1– progenitors.
Figure 14: Pre-neoplastic lesions can give rise to tumors in vivo
(A-C) MAP mice were treated with tamoxifen at 5-6 weeks of age and sacrificed when they displayed clinical signs of medulloblastoma. Whole mount NBT/BCIP staining of brains from these mice showed high levels of AP only in the tumor and not in the normal cerebellum or forebrain (A). H&E staining (B) and NBT/BCIP staining (C) of tissue sections confirmed that tumors consisted of cells that had been induced to express AP at 5-6 weeks. Magnification 20X.

35
2.3 Discussion
Studying the early stages of cancer can provide important insight into the steps
involved in transformation. In the studies described above, we use genetic fate-mapping
to determine the fate of pre-neoplastic cells in a mouse model of medulloblastoma. We
show that the majority of PNCs undergo differentiation and migration, but that a subset
of these cells does go on to form tumors. These data underscore the importance of the
pre-neoplastic stage as a critical decision point along the pathway to tumorigenesis and
provide the first definitive evidence that PNCs do in fact give rise to tumors.
Pre-neoplastic lesions have been described in ptc+/- mice (Goodrich et al. 1997;
Kim et al. 2003; Oliver et al. 2005) and in other models of medulloblastoma (Hallahan et
al. 2004; Uziel et al. 2005), but the long-term fate of these lesions has not been
investigated in detail. In part, this is due to limitations in the tools that have been
available to study them. For example, while the Math1-GFP transgene in M-ptc mice can
be used to identify PNCs while they are proliferating, (Goodrich et al. 1997; Oliver et al.
2005), expression of GFP is lost as soon as PNCs exit the cell cycle and differentiate. In
contrast, the βgal gene (which is knocked into the ptc locus in ptc+/- mice) is expressed in
PNCs as well as in post-mitotic granule neurons, so βgal+ PNCs that have migrated into
the IGL are indistinguishable from surrounding cells.
To overcome these limitations, a method to specifically label PNCs in vivo to
follow their long term fate was necessary. The initial attempts to use BrdU to
permanently label the proliferating cells were not successful. Despite the fact that both
GNPs and PNCs could be labeled short term (24-48 hours), over time, BrdU expression

36
was lost from the cells. Since BrdU is incorporated into replicating DNA in finite
amounts, it is possible that as the cells continued to proliferate, BrdU was subsequently
diluted and could not be detected. Alternatively, BrdU has been shown to be toxic to
proliferating neuronal cells, in that the introduction of the halogenated thymidine
analogue can cause DNA instability, which can in turn lead to chromosome breaks and
other mutations (Taupin 2007). The presence of such damage could signal the DNA
repair machinery to either fix the damage or induce apoptosis, which would make BrdU
undetectable by immunfluorescence. Since BrdU could not be used to label the PNCs, a
transgenic mouse strategy was generated.
Previous studies attempting to lineage trace various cell types in vivo have utilized
a conditional mouse strategy in which mice carrying a specific promoter driven Cre
recombinase were crossed with “reporter” mice bearing a transgene (such as GFP),
preceded by a loxP-stop-LoxP cassette (LSL). Mice lacking Cre recombinase do not
express the transgene; however in the presence of Cre, the stop codon is excised and the
reporter is activated (Mao et al. 2001). To employ this strategy to label PNCs, initially
Math1-CreER mice were crossed with the R26R-GFPLSL strain, which were then crossed
onto the ptc+/- background. However, analysis of these mice revealed that the expression
of the GFP transgene was nearly undetectable using immunfluorescence and could only
be seen by FACS analysis. Therefore, these mice could not be used to trace the fate of
PNCs in vivo.
The results of these previous labeling attempts led to the development of the MAP
reporter mouse, which ultimately allowed for permanent labeling of PNCs with alkaline

37
phosphatase. The success of this strategy was due to the R26R-hPLAP reporter which is
driven by the chicken actin promoter, leading to extremely strong expression of the AP
transgene. The triple transgenic MAP mice were used to determine the mechanism by
which PNCs disappear from the surface of the cerebellum. The data demonstrated that
after a period of prolonged proliferation, the majority of PNCs undergo differentiation
and migrate into the IGL. Strikingly, the expression of these differentiation and migration
genes, as well as the pattern of migration, closely resembles the normal GNPs. These data
suggest that despite ectopically proliferating, these cells are not fully transformed and are
capable of subverting tumorigenesis.
In addition to differentiation and migration, another mechanism that could
contribute to the disappearance of PNCs from the surface of the cerebellum is apoptosis.
Indeed, several recent studies suggest that dysregulation of apoptosis may be involved in
medulloblastoma progression. For example, overexpression of the anti-apoptotic protein
Bcl-2 has been observed in human medulloblastoma (Bar et al. 2007), and Bcl-2 can
cooperate with Shh to increase tumor incidence in a retroviral model of the disease
(McCall, Pedone, and Fults 2007). However, using both activated caspase and TUNEL
staining, very few apoptotic cells were detected in pre-neoplastic lesions. This finding,
together with the observation of numerous AP-labeled PNCs at the surface of the
cerebellum and within the IGL of 12-week-old mice (Figure 12), suggests that apoptosis
is not a major mechanism for PNC disappearance. Rather, differentiation and migration
are likely to be the predominant mechanisms by which PNCs disappear from the surface
of the cerebellum.

38
The ability of PNCs to undergo differentiation is significant in light of the
findings ((Oliver et al. 2005) and Figure 13) that the majority of these cells no longer
express the wild-type allele of ptc. This implies that loss of ptc – and the constitutive
hedgehog pathway activation that results from it – is not sufficient to keep cells from
exiting the cell cycle and differentiating. Several factors have been shown to be capable
of overcoming Shh-induced proliferation and promoting differentiation of GNPs (Fogarty
et al. 2007; Nicot et al. 2002; Zhao et al. 2008); it is possible that these factors contribute
to differentiation of PNCs as well.
Our lineage tracing studies also allowed us to test whether PNCs give rise to
medulloblastoma. Although the presence of these cells in the cerebellum of animals that
are destined to develop tumors has suggested that they represent the source of these
tumors, it is also possible that PNCs simply represent persistent or ectopic GNPs (which
have been observed in a number of other mutant mice) (Adams et al. 2002; Kerjan et al.
2005; Messer and Hatch 1984; Wiencken-Barger et al. 2007) and that tumors arise from a
distinct population of progenitors. Indeed, a number of investigators have suggested that
medulloblastomas, including those in ptc+/- mice, might arise from multipotent neural
stem cells (Berman et al. 2002; Hemmati et al. 2003; Li et al. 2003; Singh et al. 2004).
However, our fate-mapping studies demonstrate that tumors arise from cells that express
Math1 between 4-6 weeks of age. Since Math1 is expressed in lineage-restricted GNPs
and PNCs and not in multipotent stem cells (Klein et al. 2005; Lee et al. 2005; Machold
and Fishell 2005; Yang et al. 2008), these studies provide strong support for the notion
that tumors in ptc+/- mice arise from PNCs.

39
Taken together, the data in this chapter demonstrate that pre-neoplastic cells
represent an intermediate stage of tumorigenesis. While the majority of these cells are
fated to differentiate and not form tumors, at least a subset is in fact capable of giving rise
to tumors. These data suggest that PNCs are not fully transformed and additional
mutations that dysregulate differentiation and migration are likely necessary for
tumorigenesis. Investigating the molecular mechanisms that influence this transition will
be important for better understanding and treating medulloblastoma.

40
3. Altering the fate of pre-neoplastic cells
3.1 Introduction
The data generated using the MAP mice revealed that the pre-neoplastic cells are
not fully transformed and can therefore undergo different fates. However, it remained to
be determined if the PNCs were irreversibly committed to differentiate, or if the cells
could be induced to form tumors in the presence of additional mutations. To determine
whether the tumorigenic potential of PNCs could be increased with additional oncogenic
lesions, a “second hit” was provided to the cells. For these experiments, the N-myc
oncogene was chosen as the second hit.
N-myc is a member of the myc family of oncoproteins which also includes c-myc
and L-myc. The myc proteins are potent activators of transcription that can affect cell
proliferation, differentiation, and apoptosis in both normal development and disease
(Hurlin 2005). While all three myc family members have been implicated in a large
number of human cancers, N-myc has been previously shown to play a pivotal role in
both normal brain development and brain tumors (Grimmer and Weiss 2006; Weiss et al.
1997). Conditional knockout of N-myc in Nestin+ progenitors led to a significant
decrease in brain size and neural progenitor population expansion (Knoepfler, Cheng, and
Eisenman 2002). These mice also displayed small, disorganized cerebella with a 30-fold
reduction in GNPs. As mentioned previously, during normal GNP development, the cells
proliferate robustly to Shh. It was later shown in GNPs that N-myc is a direct target of the
Shh pathway and that N-myc is required for Shh induced proliferation (Kenney, Cole,

41
and Rowitch 2003; Oliver et al. 2003). Taken together, these data suggest that N-myc is a
critical regulator of neuronal precursor proliferation.
If N-myc is critical for normal GNP proliferation, it stands to reason that
overexpression of N-myc could also have important roles in medulloblastoma
tumorigenesis. Indeed, N-myc has been shown to be amplified or overexpressed in
human medulloblastoma (Aldosari et al. 2002; Eberhart et al. 2002; Lo et al. 2007;
Pomeroy et al. 2002) as well as in several mouse models of the disease (Frappart et al.
2007; Shakhova et al. 2006; Yan et al. 2006; Zindy et al. 2007). Furthermore, N-myc has
been shown to be critical for Shh induced tumorigenesis in the ND2:SmoA1 mouse, a
high penetrance model of medulloblastoma. In these experiments, conditional deletion of
N-myc completely eliminated medulloblastoma formation (Hatton et al. 2006). These
data suggest that N-myc may be a critical regulator of medulloblastoma pathogenesis and
a good candidate to induce tumorigenesis from PNCs.
In order to test the effects of N-myc on PNCs, an assay for tumorigenicity was
required. In many systems, the standard for this is the colony forming assay. In this assay,
cells (or cell lines) are transduced with an oncogene and allowed to form colonies in soft
agar in vitro. The presence or absence of colonies is a good indicator of transformation
and anchorage-independent growth. While PNCs can be isolated from the intact ptc+/-
cerebellum using the same technique described for GNPs, they too are primary neuronal
cells that cannot be cultured long term. Therefore, the colony forming assay is not useful
for determining tumorigenicity. To overcome these limitations, an intracerebellar
orthotopic transplantation assay was developed (Read et al. 2009). This assay had

42
significant advantages, including reproducible transplantation rates, the ability to
genetically alter cells prior to transplantation, and engraftment into a microenvironment
that is similar to the endogenous environment in which the tumors grow. Using this
technique, the ability of PNCs to form tumors and the effect of various oncogenes on the
cells could then be assessed.
In this chapter, the data reveal that a subset of PNCs can give rise to tumors
following transplantation, but overexpression of the oncogene N-myc dramatically
increases the tumorigenic potential of these cells, allowing them to generate tumors in
100% of recipients. N-myc promotes tumorigenesis by increasing proliferation and
suppressing differentiation, and in the process, renders cells resistant to hedgehog
pathway antagonists. These studies indicate that PNCs represent a critical stage of
tumorigenesis during which cells have the capacity to decide whether to differentiate or
whether to continue proliferating and give rise to medulloblastoma. Moreover, they
suggest that acquisition of certain oncogenic mutations may not only promote tumor
formation but may determine the responsiveness of tumor cells to molecular targeted
therapy.
3.2 Results
3.2.1 Pre-neoplastic cells form tumors in an orthotopic transplantation assay
To investigate the capacity of PNCs to give rise to tumors, an orthotopic
transplantation assay was utilized. PNCs were isolated from individual ptc+/- or M-ptc
mice and 5 x 10⁵ cells from each animal were implanted into the cerebellum of a SCID-

43
beige host (Figure 15). As a positive control, some mice were implanted with 5 x 10⁵
cells from established tumors. To follow the fate of transplanted cells, cerebellar sections
from transplant recipients were stained with antibodies specific for beta-galactosidase
(βgal) (as mentioned previously, ptc+/- mice have the βgal gene inserted into the ptc
locus, and therefore express the enzyme in cells that would normally express ptc,
including GNPs, PNCs and tumor cells and their post-mitotic derivatives (Goodrich et al.
1997; Oliver et al. 2005)).
Figure 15: Pre-neoplastic cell transplantation experimental design
Design of orthotopic transplantation assay. 5 x 10⁵ PNCs or tumor cells were isolated from
ptc+/- or M-ptc mice and transplanted into the cerebellum of SCID-beige hosts to assay for tumorigenicity.
As early as two weeks after transplantation, ptc+/- tumor cells had formed large
proliferating (βgal+Ki67+) masses in the cerebellum of recipients (Figure 16A).
Transplanted PNCs could also be detected at this stage (Figure 16B); while some cells
were still proliferating, many had exited the cell cycle and begun to express markers of
differentiation (NeuN, Figure 16C). By 6-8 weeks after transplantation, 100% (12/12) of
mice that had received tumor cells developed symptoms of medulloblastoma (Table 3,
Figure 17B). In contrast, the majority of mice transplanted with PNCs did not develop

44
symptoms; in these animals, small numbers of βgal+ cells could often be found around
the IGL four months after transplantation (Figure 17A). Notably, 13% (4/32) of animals
transplanted with PNCs did develop tumors 8-11 weeks post-transplantation (Table 3).
Since each PNC transplant was derived from a single donor, and since ~15% of donors
would have developed tumors had they not been sacrificed, these results support the
notion that a subset of PNCs is capable of giving rise to tumors, and demonstrate that the
intrinsic tumorigenic potential of these cells is conserved in the transplantation assay.
Figure 16: PNCs differentiate after orthotopic transplantation
(A-C) PNCs and tumor cells were transplanted as described and hosts were sacrificed two weeks later. Cerebellar sections were stained with antibodies specific for βgal to detect transplanted cells (A, B), Ki67 (A, C), or NeuN (C). Two weeks after transplantation, βgal+ tumor cells had formed a proliferating (Ki67+) mass in the cerebellum (A). βgal+ PNCs could also be detected at this stage (B). Although some of these cells were proliferating (Ki67, C), many had exited the cell cycle and expressed the differentiation marker NeuN (C). Magnification 20X.

45
Table 3: Pre-neoplastic cells rarely form tumors after transplantation
Figure 17: Pre-neoplastic cells that do not form tumors after transplantation
PNCs (A) or tumor cells (B) were isolated from M-ptc mice and transplanted into the cerebellum of SCID-beige hosts to assay for tumorigenicity. Cerebella were harvested after 4 months (A) or when mice showed symptoms of medulloblastoma (B), and sections were stained with the βgal substrate X-gal. Whereas transplanted tumor cells generated a large Xgal+ tumor (B), transplanted PNCs did not form a mass (A), but instead settled at the interface between the IGL and molecular layer (ML). Magnification A, 20X; magnification B, 10X.
3.2.2 N-myc increases the tumorigenic potential of pre-neoplastic cells
The fact that the majority of PNCs do not form tumors – either in their original
hosts or following transplantation – suggests that these cells are not fully transformed.
But whether they are already committed to differentiate, or whether they retain the
capacity to give rise to tumors, is unclear. To test whether non-tumorigenic PNCs can be
induced to form tumors, a second hit was provided. The N-myc oncogene was chosen

46
because it has been shown to be amplified or overexpressed in human medulloblastoma
(Aldosari et al. 2002; Eberhart et al. 2002; Pomeroy et al. 2002) as well as in several
mouse models of the disease (Frappart et al. 2007; Shakhova et al. 2006; Yan et al. 2006;
Zindy et al. 2007). PNCs were isolated from individual ptc+/- mice, and half the cells
were infected with a control GFP retrovirus and half with an N-myc-IRES-GFP
retrovirus. After infection, the cells were implanted into the cerebellum of SCID-beige
hosts (Figure 18). Since a subset of transplanted PNCs will go on to give rise to tumors
regardless of any other mutations, this experimental design allowed for direct comparison
of the fates of both control and N-myc-infected cells from the same donor.
Figure 18: Experimental design for viral infection and transplantation of PNCs
PNCs were isolated from 5-6 week old ptc+/- mice and infected with either control GFP virus or N-myc-IRES-GFP virus. After 24 hours, 5 x 10⁵ cells were implanted into the cerebellum of SCID-beige hosts.
Although a subset of animals (5/15) transplanted with GFP-infected cells
developed tumors, the majority of animals receiving GFP-infected PNCs remained
asymptomatic and exhibited normal cerebellar structure four months after transplantation
(Figure 19A). Transplanted PNCs could often be detected in these animals, but they were
no longer proliferating (Figure 19B). In contrast, all animals transplanted with N-myc-
infected cells developed large tumors within 3 months of transplantation (Figure 19C, D).

47
Compared to tumors derived from GFP-infected PNCs, tumors derived from N-myc-
infected PNCs developed much more rapidly (median latency 45 vs. 95 days) and were
more invasive, often migrating through normal cerebellar tissue and into the forebrain
(see arrow in Figure 19C). Tumors from N-myc infected PNCs could be propagated by
transplantation into secondary hosts, indicating that they were fully transformed and not
simply exhibiting prolonged proliferation. Overall, N-myc increased the tumorigenic
potential of PNCs from 33% to 100% (Figure 19E). In contrast to PNCs, wild-type GNPs
infected with N-myc retroviruses did not form tumors after transplantation (data not
shown). These data suggest that overexpression of N-myc can only promote tumor
formation in cells that have lost ptc (a characteristic of PNCs but not of GNPs). In a
broader sense, they show that while most PNCs are not fully transformed, given an
appropriate oncogenic stimulus they have the capacity to give rise to medulloblastoma.

48
Figure 19: N-myc increases the tumorigenic potential of PNCs
(A) Whole mount imaging of a host brain transplanted with GFP infected PNCs showed normal morphology four months after transplantation. (B) Section from the animal shown in (A), stained with anti-βgal (red) and anti-Ki67 (blue) antibodies. Transplanted PNCs could be located by βgal staining, but were not proliferating. (The faint blue staining is not nuclear and is also seen with isotype-control antibodies, and is therefore non-specific.) (C) Whole-mount imaging of a host brain transplanted with N-myc infected PNCs, showing the large GFP+ tumors that result from such transplants. Tumors from N-myc infected PNCs, unlike those from control PNCs, frequently invade the forebrain (arrow). (D) Section from the animal shown in (C), stained with antibodies specific for N-myc (red) and GFP (green). Magnification in panels B and D is 20X. (E) Survival of mice receiving GFP-infected and N-myc-infected PNCs, showing the increased incidence and decreased latency of tumors arising from N-myc-infected PNCs.

49
3.2.3 N-myc maintains proliferation and prevents differentiation of PNCs
Since both the lineage-tracing and transplantation studies suggested that the
default fate of PNCs was differentiation, it was hypothesized that N-myc allowed PNCs
to form tumors by interfering with their capacity to differentiate. Previous studies have
demonstrated that GNPs and tumor cells from ptc+/- mice can be induced to differentiate
by basic fibroblast growth factor (bFGF) (Fogarty et al. 2007). As shown in Figure 20,
PNCs also exit the cell cycle and differentiate when exposed to bFGF. To investigate the
effects of N-myc on bFGF-induced differentiation, PNCs were infected with either GFP
or N-myc retroviruses and cultured in the presence or absence of bFGF (Figure 21A). N-
myc not only increased the basal proliferation of PNCs, but also rendered cells resistant
to bFGF-induced differentiation.

50
Figure 20: Pre-neoplastic cells can be induced to differentiate by bFGF
PNCs from three 5-6 week old ptc+/- mice were cultured for 48 hours in the absence (untreated) or presence of 25ng/mL bFGF, pulsed for 14 hours with 3H-Td and assayed for thymidine incorporation. Data represent means of triplicate samples ± SEM.
Figure 21: N-myc overexpression prevents FGF induced differentiation of PNCs
PNCs were infected with either GFP or N-myc retroviruses and then cultured for 48 hours in the absence (untreated) or presence of 25 ng/mL bFGF before being pulsed with tritiated thymidine (3H-Td). Although bFGF inhibited proliferation of GFP-infected cells, little inhibition was seen in cells infected with N-myc viruses.

51
To understand the mechanisms by which N-myc exerted its effects, control and
N-myc infected cells were FACS-sorted and analyzed for expression of hedgehog target
genes and markers of proliferation and differentiation. As shown in Figure 22A-C (gray
bars), GFP-infected PNCs expressed low levels of gli1 (a direct target of the hedgehog
pathway), cyclin D1 (a marker of cell cycle progression) and math1 (a marker of
undifferentiated cells). In contrast, N-myc infected PNCs showed elevated levels of these
genes, suggesting that it was capable of maintaining proliferation and preventing
differentiation.
The fact that N-myc induced expression of gli1 raised the possibility that it might
be preventing differentiation simply by maintaining hedgehog pathway activity. To
determine whether the effects of N-myc were dependent on the hedgehog pathway,
control and N-myc infected cells were treated with cyclopamine, a potent inhibitor of Shh
signaling (Figure 22A-C, black bars) (Taipale et al. 2000). In GFP-infected PNCs,
cyclopamine reduced expression of gli1, cyclin D1 and math1, indicating that in these
cells hedgehog signaling was required for continued proliferation and maintenance of the
undifferentiated state. In N-myc infected cells, cyclopamine abrogated expression of gli1
(indicating inactivation of the Shh pathway), but had little effect on expression of cyclin
D1 and Math1. Thus, N-myc allowed PNCs to maintain proliferation and resist
differentiation even in the absence of continued hedgehog signaling.

52
Figure 22: N-myc promotes proliferation and prevents differentiation of PNCs
(A-C) PNCs were infected with either GFP or N-myc retroviruses and then cultured for 48 hours in the absence or presence of 1µM cyclopamine. Infected (GFP+) cells were FACS-sorted and RNA was isolated and analyzed by real time RT-PCR using primers specific for Gli1 (A), CyclinD1 (B) or Math1 (C); data are representative of three replicate experiments.
Previous studies have shown that N-myc can regulate proliferation and
differentiation by controlling the levels of the cyclin-dependent kinase inhibitor p27Kip1
(Nakamura et al. 2003; Zindy et al. 2006). To determine if N-myc affected p27
expression in PNCs, PNCs were infected with control or N-myc retroviruses and then
stained with antibodies specific for p27 (Figure 23A-E). After 48 hours in culture,
approximately half of control PNCs expressed p27 (Figure 23A, E), whereas only 25% of
N-myc infected cells were p27+ (Figure 23B, E). Notably, cyclopamine treatment
markedly increased expression of p27 in control cells (to 80%, Figure 23C, E), whereas it
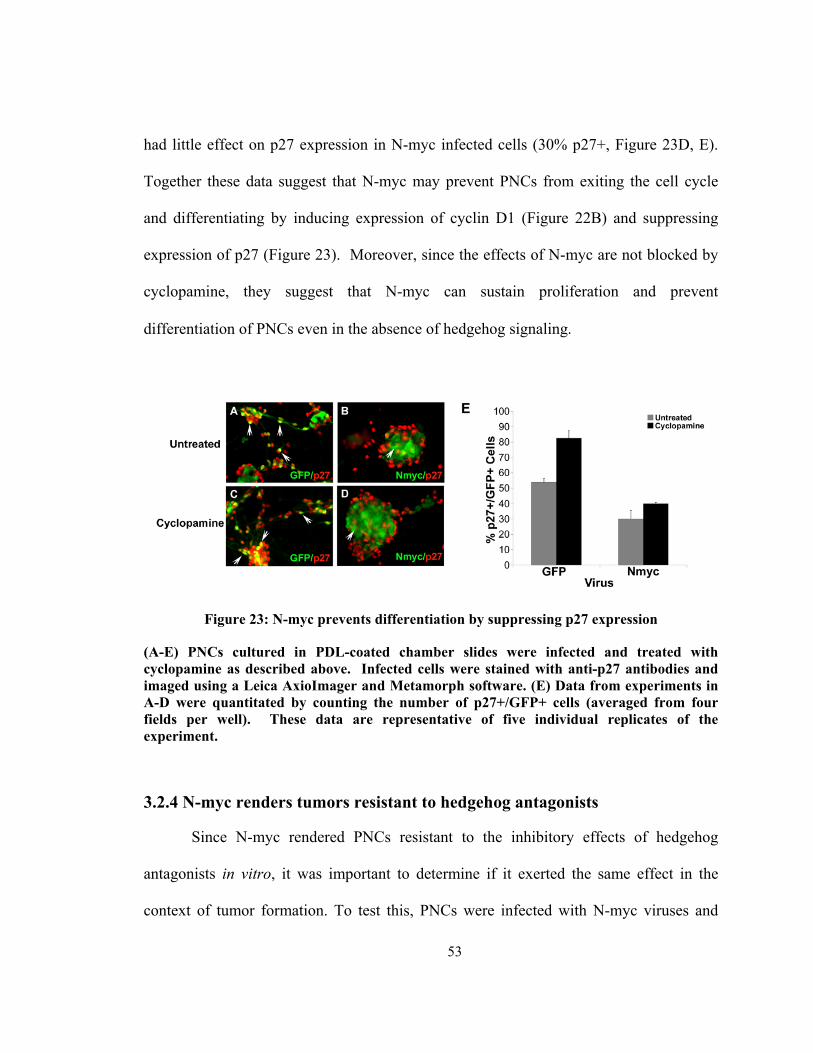
53
had little effect on p27 expression in N-myc infected cells (30% p27+, Figure 23D, E).
Together these data suggest that N-myc may prevent PNCs from exiting the cell cycle
and differentiating by inducing expression of cyclin D1 (Figure 22B) and suppressing
expression of p27 (Figure 23). Moreover, since the effects of N-myc are not blocked by
cyclopamine, they suggest that N-myc can sustain proliferation and prevent
differentiation of PNCs even in the absence of hedgehog signaling.
Figure 23: N-myc prevents differentiation by suppressing p27 expression
(A-E) PNCs cultured in PDL-coated chamber slides were infected and treated with cyclopamine as described above. Infected cells were stained with anti-p27 antibodies and imaged using a Leica AxioImager and Metamorph software. (E) Data from experiments in A-D were quantitated by counting the number of p27+/GFP+ cells (averaged from four fields per well). These data are representative of five individual replicates of the experiment.
3.2.4 N-myc renders tumors resistant to hedgehog antagonists
Since N-myc rendered PNCs resistant to the inhibitory effects of hedgehog
antagonists in vitro, it was important to determine if it exerted the same effect in the
context of tumor formation. To test this, PNCs were infected with N-myc viruses and

54
then cultured for 24 hours in medium lacking or containing cyclopamine before
transplanting them into the cerebellum of SCID-Beige hosts. As expected, all animals
(n=4) transplanted with N-myc infected PNCs developed tumors. Strikingly, all animals
(n=4) receiving cyclopamine-pretreated cells also developed tumors, and cyclopamine
had no effect on latency, mitotic index or invasiveness (Figure 24A, B). In contrast,
cyclopamine and other hedgehog antagonists potently suppress the growth of
conventional ptc+/- tumor cells ((Berman et al. 2002; Sanchez and Ruiz i Altaba 2005;
Sasai et al. 2006) and data not shown). Thus, N-myc allows PNCs to form tumors despite
inhibition of hedgehog signaling.
Figure 24: Cyclopamine does not prevent N-myc infected PNCs from forming tumors
(A-B) PNCs were infected with either GFP or N-myc encoding viruses for 24 hours, and then cultured for an additional 24 hours in the absence or presence of 3 µM cyclopamine prior to transplantation into the cerebellum of SCID-beige mice. Tumors developed in all animals transplanted with N-myc infected cells, whether or not they had been exposed to cyclopamine. (A, B) Sections of a tumor derived from N-myc infected PNCs pre-treated with cyclopamine, stained with DAPI (A) to label all nuclei or with antibodies against N-myc (green) and Ki67 (red) to detect proliferating tumor cells (B). Magnification, 20X.
To determine if tumors arising from N-myc infected PNCs remain resistant to
hedgehog antagonists once they are established, tumor cells were isolated from hosts

55
after they had developed clinical signs of medulloblastoma and then treated with
cyclopamine or bFGF. In contrast to tumor cells from ptc+/- mice, which exhibit almost
complete growth inhibition by these agents (Figure 25A and (Fogarty et al. 2007)) tumor
cells derived from N-myc infected PNCs showed minimal inhibition by these agents
(Figure 25B). These data indicate that N-myc not only promotes transformation of PNCs,
but in the process, renders cells resistant to hedgehog antagonists. Although such
antagonists have shown promise in pre-clinical studies (Romer and Curran 2005) and are
currently moving toward clinical trials (Epstein 2008), these studies raise the possibility
that tumors that are initially dependent on the hedgehog pathway may acquire secondary
mutations that render them insensitive to these agents.
Figure 25: Tumors from N-myc infected PNCs are resistant to hedgehog antagonists
(A) Tumor cells from ptc+/- mice were cultured in the absence or presence of 1µM cyclopamine or 25ng/mL bFGF for 48 hours, and then pulsed with 3H-Td for an additional 18 hours before being assayed for 3H-Td incorporation. (B) Tumors resulting from transplantation of N-myc infected PNCs were harvested and FACS-sorted to purify infected (GFP+) cells. These cells were cultured in the absence or presence of 1µM cyclopamine or 25 ng/ml bFGF and analyzed as described above. Cyclopamine and bFGF markedly inhibited the growth of ptc+/- tumor cells but only modestly inhibited the growth of tumors derived from N-myc infected PNCs (data in A and B are representative of five and three replicates respectively).

56
3.3 Discussion
In order to better understand the tumorigenic potential of PNCs, the experiments
in this chapter were designed to attempt to alter the fate of these cells. The data
demonstrate that PNCs that do not normally form tumors are not irreversibly committed
to differentiate. Rather, given an appropriate oncogenic mutation these cells retain the
capacity to become transformed and give rise to tumors. Furthermore, the nature of this
mutation is critical: N-myc not only promotes tumor progression but also renders cells
resistant to hedgehog antagonists. These studies provide definitive evidence that tumors
in ptc+/- mice arise from PNCs and identify the pre-neoplastic stage as a key decision
point at which cells have the capacity to choose whether or not to progress to malignancy.
Moreover, they demonstrate that genetic changes that occur at the pre-neoplastic stage
may be critical determinants of tumor progression as well as responsiveness to therapy.
The ability of PNCs to undergo differentiation and migration, and the low
incidence of tumors in ptc+/- mice, suggest that the majority of these cells are not
completely transformed. This notion is supported by the transplantation experiments.
While 100% of ptc+/- tumor transplants generated medulloblastoma in SCID-beige hosts,
only 13% of PNC transplants generated tumors. A somewhat higher frequency of tumor
formation (33%) was observed when PNCs were cultured for 24 hours and infected with
GFP-encoding retroviruses. The increased frequency of tumors from GFP-infected PNCs
compared to uninfected PNCs may be due to selection bias: since infection experiments
required more cells, only larger pre-neoplastic lesions could be used, and these may have

57
been more likely to give rise to tumors. Alternatively, retroviral infection itself may have
increased the frequency of tumor formation, for example, through insertional
mutagenesis. In any case, the fact that majority of PNCs were unable to form tumors
following transplantation suggests that these cells have not acquired the additional
mutations necessary to prevent differentiation or maintain long-term proliferation in vivo.
The fact that PNCs only rarely form tumors, either in situ or following
transplantation, suggests that PNCs require additional mutations in order to form tumors.
To test this hypothesis, PNCs were transduced with N-myc retroviruses as a “second hit”.
These studies demonstrated that N-myc caused a significant increase in the tumorigenic
potential of PNCs, allowing them to generate tumors in 100% of recipients. The ability of
N-myc to increase the incidence of medulloblastoma is consistent with several previous
reports. First, amplification or overexpression of N-myc occurs in many cases of human
medulloblastoma (Aldosari et al. 2002; Eberhart et al. 2002; Pomeroy et al. 2002) and in
several mouse models of the disease (Frappart et al. 2007; Shakhova et al. 2006; Yan et
al. 2006; Zindy et al. 2007), often in conjunction with mutation or deletion of ptc.
Moreover, N-myc retroviruses cooperate with Shh retroviruses to transform GNPs in the
neonatal cerebellum (Browd et al. 2006), and overexpression of N-myc in GNPs that lack
p53 and Ink4c allows these cells to give rise to tumors in a transplantation assay (Zindy et
al. 2007).
Interestingly, in many of these systems, N-myc overexpression alone was not
sufficient to induce medulloblastoma. For example, in the retroviral transduction studies
by Browd et al., N-myc viruses increased the frequency of tumors induced by Shh but

58
could not induce tumors on their own. Likewise, in the transplantation studies by Zindy et
al., mutation of p53 and Ink4c were required for tumors to form, and their transplants
used four times as many cells as were used in the PNC transplants described here.
Consistent with these findings, N-myc could not transform wild-type GNPs. The fact that
N-myc is capable of inducing tumors in PNCs suggests that these cells have acquired
changes that render them more sensitive to transformation. One such change is likely to
be loss of ptc expression. However, previous work in the lab has identified a number of
other genes whose expression is altered in PNCs compared to GNPs (Oliver et al. 2005),
and it is possible that these genes may also contribute to the sensitivity of PNCs to
transformation.
In considering how N-myc might promote tumorigenesis, it was noted that PNCs
that do not form tumors usually differentiate into granule neurons. This raised the
possibility that N-myc might transform cells in part by inhibiting differentiation.
Consistent with this possibility, the data demonstrated that N-myc not only increased
proliferation but also allowed cells to resist the differentiation-promoting effects of
bFGF. Likewise, at a molecular level, N-myc not only induced expression of cyclin D1
but also prevented downregulation of p27, critical regulators of differentiation in GNPs
and medulloblastoma cells (Knoepfler, Cheng, and Eisenman 2002; Miyazawa et al.
2000; Pogoriler et al. 2006; Zindy et al. 2006). The transcriptional induction of cyclin D1
by N-myc may be a direct effect, as we and others have shown that overexpression of N-
myc in GNPs increases cyclin D1 (Ciemerych et al. 2002; Kenney, Cole, and Rowitch
2003; Kenney and Rowitch 2000; Oliver et al. 2003). As for repression of p27, in

59
neuroblastoma cells, N-myc increases cyclin E/cdk2 activity, which promotes
phosphorylation of p27 and targets it for ubiquitination by the SCF complex (Nakamura
et al. 2003). N-myc also increases expression of Skp-2, an F-box protein that can form
part of the SCF complex (Bell, Lunec, and Tweddle 2007). These events cooperate to
promote ubiquitination and proteasome-dependent degradation of p27. Further studies
will be necessary to determine whether N-myc promotes p27 degradation in this manner
in PNCs. In any case, the dual capacities of N-myc to promote cell cycle progression and
prevent differentiation appear to be key aspects of its transforming ability.
One of the most provocative findings of these studies was the observation that N-
myc can prevent differentiation and allow PNCs to form tumors even after exposure to
cyclopamine. Previous studies showing cooperation between N-myc and Shh (Browd et
al. 2006) have suggested that these two signals act synergistically to promote
medulloblastoma formation, and that N-myc alone is not sufficient to initiate tumors.
However, the finding that N-myc infected PNCs become hedgehog pathway-independent
suggests that the cooperation between these pathways may only be required during early
stages of tumorigenesis, and that once cells have become transformed by N-myc, the
requirement for continued hedgehog signaling may be diminished. As will be discussed
in more detail later, the possibility that N-myc overexpression can render tumors resistant
to hedgehog antagonists has important clinical implications.
Although the data clearly demonstrate that N-myc is sufficient to induce tumor
formation from PNCs, it remains to be seen if N-myc actually plays such a role in vivo.
Surprisingly, N-myc mRNA expression levels were relatively uniform between GNPs,

60
PNCs, and tumor cells, suggesting that mRNA upregulation does not occur during the
transition from PNC to tumor (Oliver et al. 2005). Furthermore, neither quantitative
genomic PCR for N-myc nor array comparative genomic hybridization (aCGH) revealed
amplification of N-myc in ptc+/- tumors at the DNA level (data not shown). While these
data suggest that N-myc amplification may not play a role in PNC transformation, more
recent evidence has shown that it may actually be N-myc protein stability that helps
initiate tumorigenesis in PNCs. Previous work has shown that N-myc protein degradation
is critical for GNP cell cycle exit (Kenney, Widlund, and Rowitch 2004; Sjostrom et al.
2005). In a recent study, the authors demonstrated that increased N-myc protein stability
caused by serine 62 (S62) phosphorylation was observed at the pre-neoplastic stage. This
S62 phosphorylation prevented N-myc degradation which is promoted by subsequent
phosphorylation of threonine 58 (T58) (Thomas et al. 2009). Interestingly, only a subset
(13%) of the focal lesions was positive for N-myc protein expression, supporting the
notion that N-myc protein stability is required for tumor initiation. These studies are in
agreement with the data included here and underscore the importance of the role of N-
myc in PNC transformation.
Despite the convincing evidence that N-myc is critical for PNC transformation, a
significant unanswered question is whether N-myc is necessary for transformation.
Previous studies demonstrated that N-myc was necessary for medulloblastoma formation
by conditional deletion of N-myc in Nestin+ precursors (Hatton et al. 2006). However,
these studies deleted N-myc embryonically and while no tumors formed, neither did an
intact cerebellum. These data demonstrated that N-myc expression was necessary for

61
proper formation of GNPs, which in turn were required for neoplasia. In order to more
completely address whether N-myc is required for both the pre-neoplastic cell stage and
tumorigenesis, conditional deletion of N-myc using the Math1-CreER transgenic line was
proposed. In these experiments, N-mycfl/fl mice were crossed to Math1-CreER/ptc+/- mice
to generate a triple transgenic mouse. Using these mice, N-myc can be conditionally
deleted upon tamoxifen treatment at any stage. For example, tamoxifen treatment at P7
could be used to determine if N-myc is necessary for transition of the GNPs to PNCs.
Alternatively, N-myc could be deleted at the pre-neoplastic stage to determine if N-myc
is required for progression from PNCs to tumors. These mice will be an extraordinarily
valuable tool to investigate whether N-myc is necessary for the progression to
malignancy in the ptc+/- mice. These experiments are currently in progress and will
continue to shed light on the role of N-myc in medulloblastoma pathology.
In summary, the data in this chapter have demonstrated that PNCs in ptc+/- mice
represent a unique population of cells that is poised on the precipice of malignancy.
While the majority of PNCs proliferate only transiently and then undergo differentiation
and migration, a subset of these cells continues to divide and ultimately gives rise to
tumors. But even PNCs that do not normally form tumors have the capacity to do so with
the introduction of a single oncogenic lesion. Further studies of these cells and additional
genes that regulate their fate will continue to shed light on the molecular etiology of
medulloblastoma.

62
4. Identifying other genes important for PNC transformation
4.1 Introduction
Despite the fact that GNPs, PNCs, and tumor cells share many similar
characteristics, including morphology, Math1 expression, and expression of Shh pathway
genes, there are likely molecular differences that can distinguish between these
populations. Indeed, the fact that these cell types undergo quite different fates suggests
that investigating the underlying genetic differences will be critical for further
understanding the progression to malignancy. To this end, previous work in the lab
compared these three cell types by microarray analysis and found that as compared to
normal adult cerebellum, these populations are remarkably similar. However, when
GNPs, PNCs, and tumors were analyzed compared to each other, principal component
analysis revealed that each of these cell types had a unique molecular fingerprint (Oliver
et al. 2005). The data revealed that between GNPs, PNCs, and tumor cells, a total of 118
genes were altered. Of these, 75 genes changed between the GNP to PNC transition, and
80 changed between GNPs and tumor cells. Only 34 genes were different between PNCs
and tumor cells, supporting the notion that PNCs are more like tumor cells than normal
precursors (Oliver et al. 2005). Further analysis of these genes revealed that they could
largely be clustered by their known functions into three main groups: apoptosis/stress,
differentiation, and migration (Oliver et al. 2005). These gene expression analyses are
consistent with the data presented in earlier chapters that dysregulation of these processes
is critical for tumorigenesis.

63
Interestingly, although many of the genes identified in the screen have been
shown to function in other tumor types, very few of the genes had a known role in either
cerebellar development or medulloblastoma. Thus, the screen highlighted novel
candidates that could play a role in medulloblastoma onset. Of these many genes, three
were chosen for further investigation based on a) their level of overexpression in the
screen, and b) their known roles in preventing differentiation and promoting
tumorigenesis in other tissue types. These genes, FosB, KLF4, and FoxF2 will be
introduced in detail below.
4.1.1 FosB
FBJ osteosarcoma viral oncogene homolog B (FosB) is a member of the AP-1
family of transcription factors that include Fos, Jun and ATF proteins (Jochum, Passegue,
and Wagner 2001). As a family, AP-1 transcription factors have been implicated in a
variety of cellular functions including differentiation, proliferation, and apoptosis (Milde-
Langosch 2005). In particular, FosB has been shown to play a role in cell proliferation by
mediating entry into S-phase through upregulation of CyclinD1 (Jochum, Passegue, and
Wagner 2001). Since data in chapter three highlighted the importance of CyclinD1
expression in pre-neoplastic cell transformation, the fact that FosB can induce expression
of CyclinD1 suggests that it could be involved in this transition. Furthermore, FosB
expression is found in both normal brain and cultured cerebellar granule neurons, making
it spatially and temporally located to play such a role (Kuroda et al. 2008; Lidwell and
Griffiths 2000).

64
FosB has also been implicated as an oncogene in a variety of tumors. The first
evidence that FosB could act as an oncogene came from in vitro studies which
demonstrated that FosB could transform fibroblast cells (Schuermann, Jooss, and Muller
1991). Although FosB overexpressing mice do not develop tumors in vivo (Grigoriadis et
al. 1993), FosB overexpression has been identified in several human cancers, including
breast cancer, thyroid cancer, and hepatocellular carcinoma (Milde-Langosch 2005). To
date, there is no known role for FosB in medulloblastoma pathology or any other brain
tumors, making it a unique candidate for further study.
4.1.2 KLF4
Krüppel-like factor 4 (KLF4) is a DNA-binding zinc finger transcription factor
that is a member of the Sp1/KLF family characterized by homology to the Drosophila
gap gene Krüppel (Black, Black, and Azizkhan-Clifford 2001). In precursor-like cells,
KLF4 has been shown to play a role in self-renewal and repression of differentiation. For
example, in embryonic stem cells (ES), overexpression of KLF4 leads to decreased
differentiation in vitro (Li et al. 2005). More recently, KLF4 has gained notoriety in a
series of studies that have successfully reprogrammed more differentiated cell types into
induced pluripotent stem cells (iPS cells) (Nakagawa et al. 2008; Takahashi and
Yamanaka 2006). Strikingly, KLF4 in combination with Oct4 and c-myc has been shown
to reprogram adult neuronal stem cells into iPS cells (Eminli et al. 2008; Kim et al.
2008). These data strongly support KLF4 as a good candidate for playing a similar role in
PNC proliferation.

65
In addition, KLF4 has also been identified as an oncogene in various cancers. In
breast cancer, high levels of KLF4 have been seen in malignant tissue but not in normal
mammary tissue. These levels of KLF4 correlate with extremely malignant early tumors
and nuclear localization of the protein is associated with a poor prognosis in patients
(Foster et al. 2000; Pandya et al. 2004). A role for KLF4 has also been defined in
pancreatic intraepithelial lesions (PanIN), which are the precursor lesions to pancreatic
cancer. Increased levels of KLF4 have been seen in both PanIN lesions and pancreatic
cancers when compared to normal pancreatic epithelia (Prasad et al. 2005). When the
authors of this study transformed normal pancreatic cell lines with Gli, they discovered
that KLF4 was induced upon activation of the Shh pathway. These data are interesting in
the context of medulloblastoma, since Shh has been shown to play a role in both normal
pancreas development and pancreatic cancer (Thayer et al. 2003). Due to its roles in other
systems in both cell self-renewal and oncogenesis, especially in pre-neoplastic lesions, it
seems likely that KLF4 could function in both GCP development and pre-neoplastic cell
transformation.
4.1.3 FoxF2
Perhaps the least is known about the last of the genes of interest, FoxF2, a
member of the forkhead transcription factor family. These genes have important roles in
pattern formation during embryogenesis (Wang et al. 2003). FoxF2 has been found to be
expressed throughout the mouse embryo, and there is a high level of expression in the
central nervous system. In particular, FoxF2 is expressed in proliferating cells in the

66
cerebellum from E15 until P8 (Aitola et al. 2000). Interestingly, FoxF2 is not expressed
in the adult cerebellum, consistent with the possibility that it may play a role in
proliferation. However, currently there is no known role for FoxF2 in the developing
cerebellum.
Although FoxF2 itself has not been implicated as an oncogene, many of its family
members have been shown to be important for tumorigenesis (Myatt and Lam 2007). In
particular, two members of the forkhead family have been implicated as oncogenes in
medulloblastoma. FoxG1 was found to be amplified in 100% of human medulloblastoma
samples examined, and of those samples 55% also had concurrent amplification of N-
myc (Adesina et al. 2007). When FoxG1 was knocked down in a medulloblastoma cell
line, the cells showed a decrease in proliferation, consistent with a role for the forkhead
genes in proliferation (Adesina et al. 2007). Even more strikingly, recent evidence has
implicated FoxF1 in ptc+/- medulloblastoma. This study found that FoxF1 is highly
upregulated in the ptc+/- tumors as compared to normal tissue, and that this upregulation
is associated with Shh activity (Wendling et al. 2008). Since FoxF1 and FoxF2 are highly
similar and functionally overalap in vivo (Ormestad et al. 2006), these data suggest that
FoxF2 may also be important for hedgehog-driven tumorigenesis.
In this chapter, the role of FosB, KLF4, and FoxF2 in the transition from PNC to
tumor was investigated. Expression analysis of these genes revealed that they are highly
expressed in tumor cells as compared to normal GNPs. To determine if FosB, KLF4, and
FoxF2 were oncogenic in ptc+/- medulloblastoma, these genes were overexpressed in pre-
neoplastic cells and transplanted into host cerebella. The data demonstrated that while

67
FosB did not transform PNCs, KLF4 and FoxF2 could induce tumorigenesis. Although
the sample size was small, these data suggest that with further investigation,
understanding these genes and the mechanism by which they promote tumorigenesis may
be important for medulloblastoma pathology.
4.2 Results
4.2.1 Overexpression of anti-differentiation genes in GNPs and tumor cells
Microarray analysis revealed that between GNPs, PNCs, and tumor cells, a total
of 118 genes were dysregulated. Of these genes, 80 change dramatically between GNPs
and tumor cells. Since the data generated in the previous chapters revealed that
preventing differentiation is critical for transformation of PNCs, it was hypothesized that
the genes involved in differentiation identified in the screen would be important for
tumorigenesis (Table 4). To this end, FosB, KLF4, and FoxF2 were chosen for further
study.

68
Table 4: Expression of genes-of-interest identified between GNPs and ptc+/- tumor cells
Overexpressed Genes
(GNP:Tumor)
Fold
FosB ↑ 43
KLF4 ↑ 11.6
FoxF2 ↑ 15.5
In order to confirm the data generated from the gene expression analyses, real
time RT-PCR was performed on both Math1-GFP P7 GNPs and M-ptc tumor cells that
had been sorted for GFP. Sorting for Math1 expression eliminated any contaminating
cells from the cell preparation and ensured that a pure population of GNPs and tumor
cells would be compared. RT-PCR revealed that the expression levels of these genes
were significantly increased from GNPs to tumors, confirming the accuracy of the
microarray data (Figure 26A, B and (Oliver et al. 2005)). While GNPs expressed little to
no FosB (Figure 26A) or KLF4 (Figure 26B), the levels of both were high in all tumor
samples analyzed.
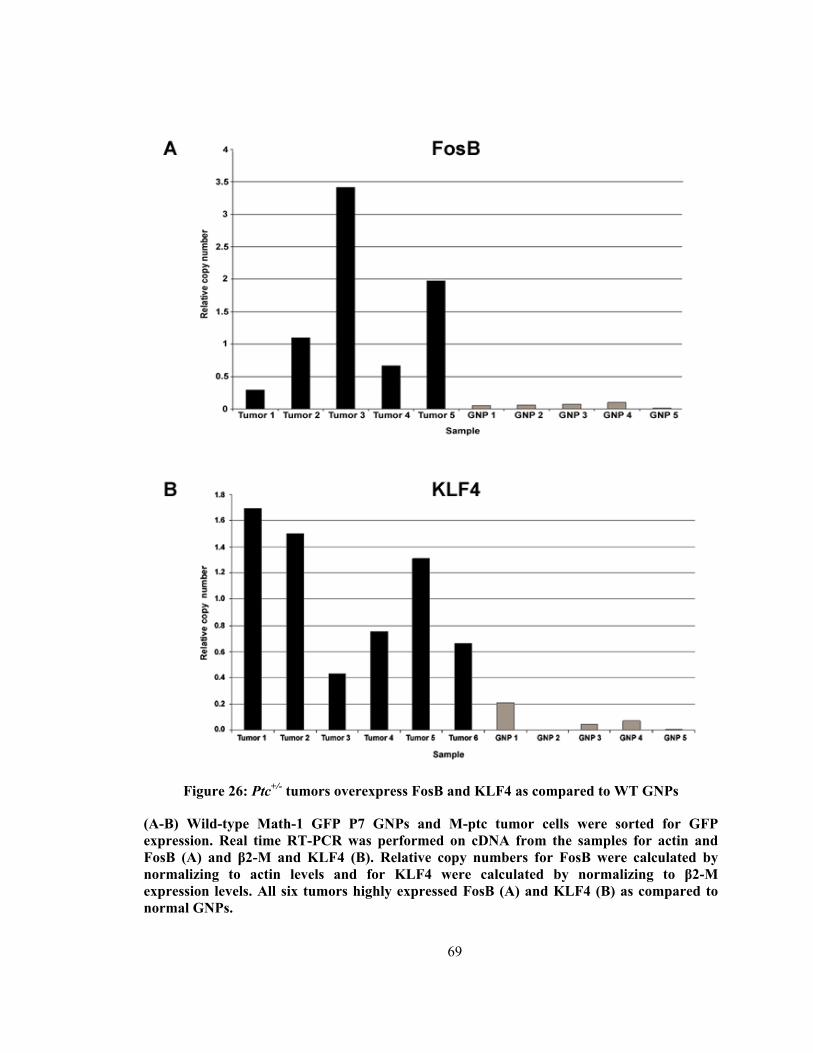
69
Figure 26: Ptc+/- tumors overexpress FosB and KLF4 as compared to WT GNPs
(A-B) Wild-type Math-1 GFP P7 GNPs and M-ptc tumor cells were sorted for GFP expression. Real time RT-PCR was performed on cDNA from the samples for actin and FosB (A) and β2-M and KLF4 (B). Relative copy numbers for FosB were calculated by normalizing to actin levels and for KLF4 were calculated by normalizing to β2-M expression levels. All six tumors highly expressed FosB (A) and KLF4 (B) as compared to normal GNPs.

70
To determine whether the tumor cells expressed the genes of interest at the
protein level, ptc+/- tumor cells were isolated, cultured for 24 hours, and stained for
expression of either KLF4 (Figure 27A, B) of FoxF2 (Figure 27D, E) (antibodies to FosB
were not effective for immunofluorescence). The immunostaining revealed that tumors
are highly positive for KLF4 and FoxF2, confirming that they are present in the cells and
therefore may play a role in tumorigenesis.
Figure 27: Ptc+/- tumor cells express KLF4 and FoxF2 protein
(A-F) Ptc+/- tumor cells were isolated and plated on PDL coated coverslips and cultured for 24 hours. Cells were stained with antibodies against KLF4 (A, B), FoxF2 (D, E), or isotype control (C, F). Note the expression of both KLF4 and FoxF2 in the tumor cells. Magnification 20X.

71
4.2.2 The role of FosB, KLF4, and FoxF2 in tumor initiation
Although the microarray data were independently confirmed at both the RNA and
protein levels and the genes of interest followed the expected expression patterns, the
importance of these genes remained to be seen. Dysregulation of a gene in the screen
does not indicate causality; it was also possible that the expression of these genes was
merely an effect of tumorigenesis rather than a significant contributor. In order to
investigate the importance of these genes for tumorigenesis, retroviral overexpression
constructs for each gene were generated. After validating that these constructs properly
expressed their target gene and the IRES-GFP contained within (data not shown), the
effect of these genes on tumorigenesis could then be assessed. For these experiments,
PNCs were infected with FosB, KLF4, or FoxF2 viruses and transplanted into SCID-
beige hosts as previously described (Figure 18).
For the FosB experiments, five pairs of transplants were generated. As shown in
Table 5, one SCID transplanted with FosB infected PNCs did develop a tumor. However,
the GFP partner to this animal also developed a tumor with the same latency. These data
indicate that these PNCs were already transformed and would have formed a tumor in
vivo, regardless of FosB overexpression. Since the remainder of the experimental animals
did not develop tumors after FosB overexpression, these data demonstrate that FosB is
not a driving force for tumorigenesis.

72
Table 5: Tumor incidence after PNC infection with microarray genes
Gene Tumor Incidence
FosB 1/5
KLF4 1/4
FoxF2 1/1
To determine if KLF4 could promote tumor initiation in PNCs, cells were
infected either with KLF4 or GFP control viruses and transplanted into hosts. Of the four
transplants, one animal bearing KLF4 infected PNCs developed a large tumor (Table 5,
Figure 28B). After the KLF4 animal was sacrificed, its GFP partner was also sacrificed to
look for tumor burden. However, the GFP control did not develop a tumor (Figure 28A).
These data suggest that KLF4 was capable of promoting transformation, although the
penetrance was low. Interestingly, the tumor that arose from the KLF4 infected cells was
not GFP+, despite the fact that the virus contains an IRES-GFP sequence and GFP
expression was observed in vitro prior to transplantation.

73
Figure 28: KLF4 infected PNCs gave rise to a tumor
(A-B) As described previously, PNCs were infected either with GFP control or KLF4 containing retroviruses and transplanted into the cerebellum of SCID-beige hosts. Whereas the KLF4 infected animal (B) developed a large tumor, the GFP infected partner was tumor free (A). The KLF4 infected tumor was not GFP+. T-tumor, CB-normal cerebellum.
The fact that the KLF4 tumor was not GFP+ raised the possibility that the tumor
arose from retroviral insertion and not KLF4 expression itself. To rule out this possibility,
both genomic DNA and RNA were isolated from the tumor to check for KLF4. PCR was
performed on the genomic DNA for the KLF4 gene to determine the presence of viral
DNA. Since the viral KLF4 did not contain introns, it could be distinguished from the
genomic DNA by size (Figure 29A). The presence of a viral KLF4 band confirmed that
the retrovirus had in fact integrated into the PNC DNA. To look for expression of KLF4
mRNA, RT-PCR was performed (Figure 29B). Although the data demonstrated that
KLF4 was being expressed by the tumor cells, viral versus genomic KLF4 could not be
distinguished in this way. Finally, to determine if the viral DNA was being transcribed,

74
RT-PCR was performed for GFP (Figure 29C). The presence of the GFP band indicates
that the viral transcript was being produced. Taken together, these data suggest that
despite the lack of GFP fluorescence, the tumor that arose was likely induced by KLF4
overexpression rather than insertional mutagenesis. Although the small replicate number
does not allow for conclusive evidence that KLF4 can drive tumor initiation, the data are
intriguing and merit further investigation into the effects of KLF4 on pre-neoplastic cells.
Figure 29: Tumor from KLF4 infected PNCs expresses KLF4 and GFP
(A) Genomic DNA was isolated from KLF4 infected PNC tumor cells and PCR was performed for KLF4. Due to the absence of introns in the viral KLF4 construct, viral DNA (V) could be distinguished from genomic DNA (G). The tumor contained both viral and genomic DNA, indicating that the KLF4 virus did integrate into the genome of the PNCs. (B-C) To confirm that KLF4 and GFP were being expressed, RNA was isolated from the KLF4 tumor and cDNA was synthesized. RT-PCR for KLF4 (B) revealed that KLF4 was present, as was GFP (C).
Similarly, while the evidence to support its role as a tumor initiation gene is
preliminary, FoxF2 may also be important for tumorigenesis. Although only one replicate
of this experiment was performed, the FoxF2 infected PNCs gave rise to a tumor,
whereas the GFP infected control did not (Table 5). Much like KLF4, the tumor that

75
arose in this animal was also GFP-negative (data not shown). In light of these findings, it
seems likely that several of the identified microarray genes, either alone or in
combination, may play a role in medulloblastoma formation. Therefore, continued efforts
to elucidate the functions of these genes will be important for better understanding both
normal GNP development and medulloblastoma.
4.3 Discussion
Demonstrating that N-myc is a potent oncogene for pre-neoplastic cell
transformation was critical for proving that the fate of PNCs could be altered with
appropriate genetic lesions. However, it seemed unlikely that N-myc was the only factor
capable of initiating tumorigenesis and that other genes could play a similar role. Insight
into the genes that could be involved in this process was gained from gene expression
studies comparing GNPs, PNCs, and tumor cells. These analyses identified candidate
genes dysregulated in the transition from normal development to medulloblastoma. To
gain a more complete picture of how PNCs undergo transformation, it was important to
investigate if other novel oncogenes could overcome the propensity of PNCs to
differentiate. It was hypothesized that several genes found in the screen, FosB, KLF4,
and FoxF2, could act as oncogenes in these cells. The data demonstrated that although
these genes are highly expressed in tumor cells, only KLF4 and FoxF2 were capable of
generating tumors, albeit at a low frequency. These data suggest that these genes alone
are not sufficient to induce tumors in all PNCs, but that they may play a role in
transformation in combination with other genetic alterations.

76
Accepting the hypothesis that ptc+/- medulloblastoma arises from normal GNP
development gone awry suggests that the microarray genes could be required for normal
GNP development and overexpression of these genes leads to tumorigenesis. However,
while confirmation of the microarray genes revealed that FosB, KLF4, and FoxF2 were
strongly expressed in all tumor samples analyzed, there was an almost complete lack of
expression of these genes in normal GNPs. These data raise two possibilities. First, it is
possible that low levels of these genes are required for proliferation and that
overexpression leads to hyper-proliferation and tumorigenesis. Indeed, the levels of genes
that are potent inducers of proliferation are often critical for determining whether
oncogenesis or initiation of intrinsic tumor suppression mechanisms occurs (Lowe,
Cepero, and Evan 2004; Murphy et al. 2008). Second, it is possible that these genes are
upregulated as either an initiator or as a consequence of malignancy and do not function
in the GNP life cycle. Although the data do not address this distinction, it will be
important to determine the role of these genes in normal GNP development to understand
why these genes are upregulated in tumorigenesis.
To determine if the candidate genes played a role in tumor initiation, they were
overexpressed in PNCs and transplanted to assay for tumorigenesis. While FosB was the
most highly upregulated gene identified in the screen, it did not induce tumors from
PNCs. These results indicate that FosB is not sufficient for tumor initiation in PNCs.
However, it is important to note that the data do not rule out the possibility that FosB
could be a critical mediator of tumor maintenance once the tumor has been established.
To test this hypothesis, FosB shRNA viruses would be used to knockdown FosB in ptc+/-

77
tumor cells to determine the effect of loss of FosB on transplantation. If tumors did not
form after FosB was downregulated, the data would suggest that FosB is necessary for
tumor propagation.
Unlike FosB, PNCs infected with KLF4 and FoxF2 did give rise to tumors after
transplantation. In both cases, the small sample size made it difficult to definitively
conclude what the effects of these genes on PNCs were. In the future, it will be critical to
increase sample size in order to elucidate the functional roles of these genes in
progression to malignancy. However, the preliminary data do suggest that these genes
could play a role in tumor initiation. Strikingly, tumors that arose from both KLF4 and
FoxF2 overexpression were GFP negative, despite the presence of a GFP reporter in the
viruses. Since the infected PNCs were confirmed to be GFP positive prior to
transplantation, the cells lost expression of GFP protein in vivo. Analysis of both DNA
and RNA from the KLF4 induced tumor demonstrated that the viral genome was present
in the cell and that the GFP transcript was being produced. These data raise the
possibility that the PNCs silenced expression of GFP and by corollary, KLF4. If this were
the case, it is possible that the tumor arose from insertional mutagenesis, rather than by
effects of KLF4. However, it seems likely the tumor cells would still express GFP
protein, as there would be no selection pressure to silence expression of viral genes.
Furthermore, there is precedent for methylation based silencing of genes driven
by mouse stem cell virus (MSCV) long terminal repeat-based retroviral vectors (Cherry
et al. 2000). The authors of this study found that MSCV-GFP was silenced in embryonic
and hematopoietic stem cells both in vitro and in vivo. In addition, experiments

78
reprogramming mouse embryonic fibroblasts with Oct4, c-myc, Sox2, and KLF4
retroviruses found that over time, the iPS cells silence the viral transgenes and upregulate
the corresponding endogenous genes (Okita, Ichisaka, and Yamanaka 2007). It seems
likely that this silencing occurred with the KLF4 and FoxF2 transplants, since these were
expressed using MSCV based vectors. This conclusion is strengthened by the fact that N-
myc infected PNCs (Chapter 3) were infected with LZIR retroviruses and did not lose
GFP expression in vivo. These data suggest that in the future, the retroviral backbone
containing KLF4 and FoxF2 should be changed to prevent such silencing and to ensure
that the tumors are arising from overexpression of the gene of interest.
Alternatively, it is possible that the loss of GFP expression is specific to the genes
themselves, such that there may be selection against cells that express excessively high
levels of the oncogenes. In this scenario, the tumors would be comprised of cells
expressing tolerable low levels of the oncogene. Therefore, even using LZIR retroviruses,
the tumors would not express detectable levels of GFP. Performing the transplants using
both MSCV and LZIR retroviruses would resolve these two possibilities and the effects
of KLF4 and FoxF2 on tumorigenesis could be accurately assessed.
Taken together, the data presented in this chapter suggest that KLF4 and FoxF2
are potentially important for tumor formation in the ptc+/- mouse. However, in the case of
KLF4, only 1 of 4 transplants developed a tumor. The low incidence of tumors
(especially compared with the 100% frequency seen with N-myc), suggests that KLF4
alone is not sufficient to drive tumorigenesis. It is likely that additional mutations had
already accumulated in the PNCs that synergized with KLF4 expression to generate the

79
resultant tumor. It may also be useful to infect PNCs with multiple candidate genes in
combination to determine if several genes act in concert to promote tumorigenesis. Since
a significant number of genes were identified in the screen, it is possible that more than
one gene is required for tumor initiation in PNCs. In the future, additional experiments
will investigate the role of other genes identified in the screen to determine their roles as
well.
To conclude, the data described in this chapter demonstrate that microarray
analysis of GNPs, PNCs, and tumor cells revealed a large number of candidate genes that
could be important for medulloblastoma formation in the ptc+/- mice. Using the transplant
assay, preliminary experiments demonstrated that not all of these genes may be
functionally relevant for tumor progression. However, at least a subset show promise as
genes of interest going forward. Determining the mechanism by which these genes
promote tumorigenesis and if they have any role in the pathology of human
medulloblastomas will be important questions to answer in future experiments.

80
5. Discussion
Although pre-neoplastic cells have long been presumed to give rise to
medulloblastoma in ptc+/- mutant mice, no direct correlation between the intermediate
stage and the end-stage tumor has previously been established. Indeed, since the
tumorigenic potential of the PNCs had never been demonstrated, referring to these cells
as “pre-neoplastic” begs the question of whether these cells are capable of giving rise to
the tumors. Therefore, it was critical to determine if the PNCs actually represented a pre-
malignant population of cells. The goal of the above studies was to address several
important unanswered questions concerning the fate of pre-neoplastic cells in the ptc+/-
mouse. First, do pre-neoplastic cells give rise to medulloblastoma? Second, what is the
fate of the PNCs that do not give rise to tumors? Third, can the fate of pre-neoplastic cells
be altered with an appropriate oncogenic lesion?
To address these questions, genetic fate-mapping and orthotopic transplantation
were utilized. The data demonstrated that the majority of PNCs can differentiate and
migrate, but that at least a subset can go on to give rise to tumors. Strikingly, PNCs could
be induced to form tumors with the introduction of a single oncogenic lesion such as N-
myc. Therefore, PNCs do represent an intermediate stage between normal development
and tumorigenesis. These data underscore the importance of continuing to study pre-
neoplastic lesions in order to better understand the molecular mechanisms by which
medulloblastoma can occur.

81
5.1 Pre-neoplastic lesions are an intermediate stage of tumorigenesis
The data in chapter two focused on investigating the fate of pre-neoplastic cells in
vivo. Understanding what happens to the lesions that do not form tumors can yield
valuable information on why some of the lesions do. Previous attempts to follow the fate
of these cells have been unsuccessful, largely due to the limitations of the tools available
to study these cells. The development of the MAP reporter mice allowed for long-term
labeling of the PNCs to follow their fate. Using these mice, the data demonstrated that the
majority of PNCs are capable of undergoing differentiation and migration.
The fact that the majority of PNCs will go on to differentiate and migrate despite
the loss of ptc suggested that these cells are still capable of responding to cell-cycle exit
signals that can override constitutive activation of the Shh pathway. These data illustrate
the necessity of accumulating additional mutations that disrupt the innate ability of these
cells to differentiate. They also raise the question of whether the ability to undergo these
processes is cell-intrinsic or cell-extrinsic. It is notable that PNCs are able to execute a
relatively normal program of differentiation and migration in the adult cerebellum, a
microenvironment that is quite different from the one in which GNPs normally
differentiate. In the postnatal cerebellum, GNPs secrete factors that promote the
formation of a Bergmann glia scaffold that the GNPs use to aid in migration into the IGL
(Lin et al. 2009). In the wild-type adult cerebellum, Bergmann glia are no longer needed
for migration guidance and they ultimately regress (Hatten 1999). However, PNCs can
still migrate into the IGL as differentiated neurons, even in the adult cerebellum where

82
there are no longer any radial glia. One interpretation of this is that PNCs are capable of
creating or maintaining a microenvironment that resembles the neonatal cerebellum, and
thereby preserve the exogenous cues that allow them to differentiate and migrate.
Alternatively, it is possible that the signals necessary for differentiation and migration are
intrinsic to PNCs themselves. Based on the data, it seems likely that both of these
possibilities are occurring. The fact that the PNCs are capable of surviving and
differentiating following transplantation into another animal is consistent with the
existence of a cell-intrinsic differentiation program. However, the transplanted cells
rarely migrate into the host IGL, indicating that the nature of the pre-neoplastic lesion
microenvironment in the intact ptc+/- mouse may maintain the Bergmann glia, allowing
the PNCs to migrate. From these data, it seems probable that the ability of PNCs to
differentiate is cell-intrinsic, while the propensity for these cells to migrate may reflect
cell-extrinsic cues and the ability of PNCs to create a favorable microenvironment. Since
the differentiation of these cells is linked to migration, subverting both of these processes
is likely critical for tumorigenesis.
Despite the fact that the majority of the PNCs retain the ability to subvert
tumorigenesis, using the MAP mice, the data demonstrated that Math1+ PNCs could in
fact give rise to medulloblastoma. Taken together with the transplant data, in which a
subset of transplanted PNCs can also give rise to tumors, these data represent the first
direct evidence that these cells can in fact give rise to medulloblastoma in the ptc+/- mice.
As such, the moniker “pre-neoplastic” can actually be applied to these cells, since these

83
cells teeter precariously at a critical decision point between differentiation and
progression to malignancy.
5.2 Pre-neoplastic lesions in human tumors
Demonstrating that PNCs in ptc+/- mice give rise to medulloblastoma has
important implications for tumorigenesis in other tissues. Pre-neoplastic lesions have
been identified in a number of tissues, including colon, breast, prostate and pancreas
(Levine and Ahnen 2006; Mokbel and Cutuli 2006; Montironi et al. 2007; Singh and
Maitra 2007). In each case, these lesions contain proliferating cells with a morphology or
organization distinct from that of normal tissue. While the lesions themselves do not meet
the criteria for cancer, their presence is presumed to predispose to cancer, and cancers are
thought to arise from them. But while studies of human tissues are consistent with this
view, the data are mostly correlative and there has been little direct evidence that pre-
neoplastic lesions give rise to cancer. In fact, some studies have suggested that removal
of colon polyps does not decrease the incidence of colon cancer in human patients,
raising questions about whether these lesions actually give rise to tumors (Jass and Talbot
2001). Even in mouse models of cancer, there have been few studies linking pre-
neoplastic lesions to end-stage tumors. For example, pre-neoplastic cells from mouse
models of breast cancer (Maglione et al. 2001) and prostate cancer (Kim et al. 2002) can
give rise to adenocarcinoma, but only after serial passaging of these cells in vivo. In
contrast, PNCs from ptc+/- mice can give rise to tumors without multiple passages. The
approaches described here should be readily adaptable to other systems in which there is

84
a promoter that can be used to specifically label pre-neoplastic cells. Defining the
association between pre-neoplastic lesions and the corresponding tumors will
significantly strengthen conclusions that are based on studies of these lesions, both in
animals and in patients.
5.3 Pre-neoplastic cells are susceptible to additional mutations
Since the data presented in chapter two demonstrated that the majority of pre-
neoplastic lesions do not give rise to medulloblastoma, this raised the question of whether
the PNCs were fated to differentiate or whether they could give rise to tumors with
additional genetic mutations. The data in chapters three and four demonstrated that
overexpression of N-myc, KLF4, and FoxF2 could induce tumors from PNCs. Therefore,
PNCs are particularly vulnerable to mutations that can overcome the ability of these cells
to differentiate and migrate. Interestingly, while N-myc induced tumors from 100% of
pre-neoplastic cells, KLF4 only induced tumors from 25% of donors. These results
highlight the importance of N-myc in this process. Furthermore, they also imply that
certain oncogenes such as KLF4 may require the presence of additional mutations,
thereby rendering some pre-neoplastic lesions susceptible to transformation, while others
are not.
To determine the importance of other genes in the transition from PNC to tumor
cell, future experiments should be undertaken to identify such mutations. Although gene
expression analysis has been performed on GNPs, PNCs, and tumor cells, it will be
useful to determine what global genomic changes are occurring in these cells. To that

85
end, array CGH will be performed on PNCs and tumor cells to identify genetic changes
that may be critical for medulloblastoma formation. A small cohort of ptc+/- tumors have
already been analyzed by aCGH and a significant number of mutations (both losses and
gains) have been identified. For example, trisomy of chromosome six was observed in
4/5 tumors, suggesting that chromosome six amplification may be a common event in
tumor formation. These data are currently being analyzed and will yield valuable insight
into novel genes involved in medulloblastoma.
While choosing genes based on mutation or known function is a legitimate and
useful way of screening potential candidates, this approach has several disadvantages.
First, this experimental design is lengthy and requires a large cohort of transplantations
testing each candidate gene. Second, using the literature to select genes is predicated on
the existence of such information. If little information exists about these genes, it is
difficult to analyze their effect on tumorigenesis. Finally, by choosing individual genes,
selection bias can occur and novel genes that may be significant could be overlooked. To
overcome these limitations, a retroviral screen would allow for identification of one or
more genes involved in transformation and could potentially identify previously unknown
candidates. The PNC isolation and transplantation system described in the above chapters
is particularly well suited to a library screen. A retroviral cDNA library would be
generated from pooled ptc+/- tumor RNA. The viral library would then be used to infect
PNCs in the manner previously described and the infected cells would be transplanted
into SCID-beige hosts. Once tumors had formed, the initiating mutation(s) would be

86
identified by PCR. Thus, the retroviral screen would allow for high-throughput
identification of oncogenes that can transform PNCs.
Taken together, the future experiments proposed above all attempt to identify
mutations that can transform PNCs. However, they leave one critical question
unanswered: why do some PNCs give rise to tumors and the majority do not? Identifying
or testing candidate genes will not shed light on this question. To determine what allows
a subset of PNCs to give rise to tumors, the transplant assay can be employed. In this
experimental design, PNCs would be transplanted into SCID-beige hosts and assayed for
tumorigenic potential. Additionally, a portion of the cells would be saved and not
transplanted, and RNA would be isolated. After tumor onset, the lesions that gave rise to
tumors could be compared to those lesions that did not give rise to tumors using
microarray analysis. These experiments would allow for direct gene expression
comparisons between those PNCs that gave rise to tumors and those that were fated to
differentiate. Such data would be extremely valuable in assessing what mutations
predispose some pre-neoplastic lesions to progress to medulloblastoma.
5.4 Resistance to Shh antagonists
Although investigating which mutations can transform pre-neoplastic cells has
important implications for understanding the biology of medulloblastoma, it is also
critical to consider the effects of these mutations on the resultant tumors. The data
presented in chapter three demonstrate that N-myc can potently increase the tumorigenic
potential of PNCs. But more importantly, overexpression of N-myc renders the resultant

87
tumors resistant to the hedgehog antagonist cyclopamine. The fact that N-myc
overexpression can render tumors resistant to hedgehog antagonists has important clinical
implications. N-myc amplification and hedgehog pathway mutations are both relatively
common events in human medulloblastoma. Although the frequency with which these
events coincide is unknown, tumors bearing hedgehog pathway mutations have been
shown to express high levels of N-myc RNA (Pomeroy et al. 2002; Thompson et al.
2006). If overexpression of N-myc renders mouse medulloblastoma cells insensitive to
hedgehog pathway antagonists, it might have a similar effect in human tumors.
To determine the effects of these Shh antagonists on human tumors, it will be
necessary to test these antagonists such as cyclopamine or FGF on actual patient samples.
Identifying human patients with active Shh signaling and treating their tumor cells with
these antagonists will be extremely useful in determining therapeutic efficacy. Currently,
the lab has collaborated with both the Duke and the Texas Children’s Cancer Center brain
tumor centers to obtain such samples and screen for Shh pathway mutations, including
amplification of N-myc. One such tumor demonstrated a molecular profile similar to that
of the ptc+/- tumors (high Gli1, N-myc, and Math1 mRNA expression). In preliminary
experiments, when these cells were treated with cyclopamine and FGF, neither antagonist
could fully block proliferation in vitro (data not shown). These early data suggest that
Shh antagonists may not be effective therapeutics if the underlying mutations render the
cells independent of the Shh pathway.
While the data presented here shed light on the role of second hits in
medulloblastoma biology and treatment, it is likely that these findings could have

88
important implications for other tumors. Although medulloblastoma and basal cell
carcinoma are perhaps the most recognized tumors with activated Shh signaling, recent
evidence has shown that this pathway plays a critical role in other tumors as well.
Activation of the Shh pathway has been identified in rhabdomyosarcoma, pancreatic,
esophageal and lung cancers, in both early and metastatic disease (Huang et al. 2006;
Kappler et al. 2004; Ma et al. 2006; Thayer et al. 2003). Furthermore, Shh activation has
also been shown to play a role in both breast and prostate cancer initiation and
progression (Karhadkar et al. 2004; Kubo et al. 2004).
Due to the broad spectrum involvement of Shh signaling in human cancers, a
significant amount of attention has been devoted to developing Shh antagonists for
molecularly targeted therapeutics. Over a dozen of these antagonists have been developed
to target various components of the pathway ranging from Smo, to the Shh ligand itself
(Xie 2008). While some of these compounds have shown success in treating tumors in
mouse models, the efficacy of such therapeutics remains controversial. In one such study,
a small molecule inhibitor of Smoothened (HhAntag), was used to treat ptc+/-/p53-/- mice,
which develop medulloblastoma with nearly 100% penetrance. Mice treated with
HhAntag were completely cured of medulloblastoma (Romer and Curran 2005),
suggesting that these tumors were entirely dependent on the Shh pathway for their
proliferation and survival. In contrast, rhabdomyosarcomas isolated from ptc+/- mice
treated with cyclopamine showed a decrease in Shh signaling, but cyclopamine did not
prevent tumor growth (Ecke et al. 2008). These data, taken together with the fact that N-
myc renders tumors resistant to Shh pathway inhibition, suggest that many of these

89
tumors may not respond to Shh antagonists. With these and other hedgehog antagonists
moving toward clinical trials for medulloblastoma and other types of cancer (Epstein
2008; Romer and Curran 2005; Xie 2008), it is important to consider the possibility that
some tumors that are initially dependent on hedgehog signaling may acquire secondary
mutations that render them insensitive to these agents.
5.5 Oncogene addiction
Cancers arise from multi-step transformation events and are therefore largely
regarded as heterogeneous and comprised of multiple genetic changes required for
malignant progression. Despite the fact that no one mutation can give rise to tumors,
many studies have shown that tumors initiated by overexpression of an oncogene or loss
of a tumor suppressor become “addicted” to these mutations (Fleming et al. 2005; Jain et
al. 2002; Martins, Brown-Swigart, and Evan 2006; Sharma and Settleman 2007). These
data imply that inhibition of the oncogene or restoration of the tumor suppressor might be
effective approaches to therapy (Weinstein and Joe 2008).
In the ptc+/- mouse model, the initiating transformative event is loss of the wild-
type allele of ptc, which allows the formation of pre-neoplastic cells. Although ptc+/-
tumor cells are sensitive to hedgehog antagonists, N-myc transformed PNCs are not.
Thus, the insensitivity of N-myc expressing PNCs to hedgehog antagonists argues that
tumors initiated by mutations in the hedgehog pathway may not necessarily remain
addicted to this pathway if secondary mutations occur that render the initiating mutation
unnecessary. Similar findings have recently been reported for c-myc-induced lung and

90
mammary tumors (Boxer et al. 2004; Tran et al. 2008). Furthermore, even in mouse
models where “oncogene addiction” has been described, such as Neu induced mammary
tumors, despite initial primary tumor regression after oncogene withdrawal, recurrent
tumors invariably appear that are independent of the initiating oncogene (Moody et al.
2002). Taken together, these data demonstrate that the concept of “addiction” to a
particular pathway may not apply if the tumors have accumulated mutations that render
them independent of the initiating “hit”. Furthermore, the data presented here underscore
the importance of identifying what additional genetic mutations have occurred so that
molecularly targeted therapeutics can be designed that effectively treat the disease.
5.6 Concluding Remarks
Medulloblastoma is an extremely malignant tumor that profoundly affects the
lives of both patients and their families. Encouragingly, research delving into the
molecular mechanisms that underpin this disease has yielded significant amounts of
information that has and will continue to inform upon diagnosis and treatment. In the past
decade, use of animal models that phenotypically resemble the human tumors has been
invaluable for furthering understanding of the etiology of medulloblastoma. Using one
such mouse, the ptc+/- mutant model, the experiments presented here have aimed to
elucidate the mechanism by which the normal cells within the cerebellum undergo
transformation and give rise to medulloblastoma. These data have demonstrated that
tumorigenesis in these mice occurs through a distinct pre-neoplastic intermediate stage.
The pre-neoplastic lesions, while predisposing the ptc+/- mice to cancer, do not in and of

91
themselves represent a malignant population. Rather, it is the successive accumulation of
additional mutations that allow these cells to subvert their normal cell processes such as
differentiation and give rise to medulloblastoma. Furthermore, the fact that these second
hits render the transformed cells resistant to molecularly targeted therapeutics highlights
the importance of understanding the genetic backgrounds of the tumors. These data are
particularly significant when considering the treatment of patients with medulloblastoma.
Although using specifically targeted antagonists to activated pathways will likely be the
future of cancer treatment, it will almost certainly involve targeting multiple mutated
pathways in order to most effectively eradicate the disease. Further research into the
genes and pathways that are involved in the transition from normal granule neuron
precursor, to pre-neoplastic cell, to tumor cell will continue to yield insights into the
pathology of medulloblastoma. In the future, these advances will hopefully improve the
overall survival and quality of life of patients suffering from this disease.

92
6. Materials and Methods
6.1 Animals
ptc+/- mice (Goodrich et al. 1997) were maintained by crossing with 129X1/SvJ
mice (Jackson Laboratories). Math1-GFP mice were obtained from Jane Johnson at UT
Southwestern Medical Center. Math1-GFP/ptc+/- (M-ptc) mice were generated and
maintained as previously described (Oliver et al. 2005). Cre-inducible alkaline-
phosphatase reporter mice (R26R-hPLAP) were generated by first cloning a 2.0-kb
EcoRI-XhoI fragment of the human placental alkaline phosphatase (hPLAP) cDNA
(Leighton et al. 2001), into the pBigT plasmid (Srinivas et al. 2001) immediately after the
loxP-neo-4xpolyA-loxP cassette. The 5.2-kb PacI-AscI fragment containing loxP-neo-
4xpolyA-loxP-hPLAP-polyA (STOP-hPLAP) was then inserted into a R26R-acceptor
plasmid (Srinivas et al. 2001). A 1.6-kb chicken Actin (CAG) promoter was then cloned
into the PacI site upstream of the STOP-hPLAP cassette. This targeting construct was
electroporated into ES cells and Rosa-CAG-STOP-hPLAP knock-in mice were generated
from targeted ES cell clones. Math1-CreERT2 mice (Machold and Fishell 2005) were
generously provided by Gord Fishell at New York University. Math1-CreERT2/R26R-
hPLAP/ptc+/- (MAP) mice were generated by mating Math1-CreERT2 mice with ptc+/-
mice, and then crossing the resulting double transgenics with R26R-hPLAP mice to
generate triple transgenic mice. All mice were bred and maintained in the Cancer Center
Isolation Facility at Duke University.

93
6.2 In vivo labeling of GNPs, pre-neoplastic, and tumor cells
Tamoxifen (Sigma, St. Louis, MO) was prepared as a 20mg/mL stock solution in
corn oil (Sigma). For P8 labeling, Math1-CreER/R26R-hPLAP pups received 30µL of
tamoxifen stock solution by oral gavage. For pre-neoplastic cell and tumor cell labeling,
MAP mice were orally gavaged with 200µL of tamoxifen stock solution.
6.3 Tissue preparation, cryosectioning, and staining
6.3.1 Tissue Preparation
Mice were perfused with PBS and 4% paraformaldehyde (PFA) in PBS to fix all
tissues. Cerebella were harvested and fixed in 4% PFA overnight at 4ºC and then
cryoprotected in 30% sucrose solution. Tissues were embedded in Tissue-Tek OCT
(Sakura Finetech, CA, USA). Cerebella were cut into 12µM sections using a Leica
3050S cryostat (Vashaw Scientific, Norcross, GA).
6.3.2 Hematoxylin and Eosin staining
For hematoxylin and eosin (H&E) staining, slides were dipped in Harris’
Hematoxylin (Sigma) for 5 minutes, cleared in running tap water for 5 min and de-
stained in acid alcohol. Slides were then “blued" in 0.05% lithium carbonate, washed in
dH2O and stained in 50% Eosin (Sigma). After dehydration in ethanol, slides were
permanently mounted in VectaMount (VectorLabs, Burlingame, CA).

94
6.3.3 Alkaline Phosphatase staining
Alkaline phosphatase (AP) staining of MAP cerebella was performed by fixing
sections for 1hr at RT in 4% PFA. Endogenous AP was heat-inactivated by incubating
slides in PBS at 65ºC for 3hrs. Slides were washed in a solution of 100mM NaCl and
100mM Tris-HCl, pH 7.5, and then incubated for 1hr at 37ºC with the AP substrate
NBT/BCIP (Roche, Indianapolis, IN) diluted 1:50 in staining buffer (100mM Tris-HCl,
pH 9.5, 100mM NaCl, 5mM MgCl2). The reaction was stopped in PBS and slides were
mounted in Aquapolymount (Polysciences, Inc, Warrington, PA).
6.3.4 Immunofluorescence
Immunofluorescence (IF) staining was performed as follows: Tissue sections or
cells were re-hydrated in PBS with 0.1% TritonX-100 (PBST) for 10 minutes. Slides
were then blocked in PBST+ 10% normal goat serum (Jackson ImmunoResearch, West
Grove, PA) for 1 hour at RT. Sections were incubated overnight at 4ºC in primary
antibodies diluted in immunostaining buffer (PBST + 2% BSA). Slides were washed and
then incubated with secondary antibodies for 1 hour at RT. Nuclei were stained with
DAPI (Invitrogen, Carlsbad, CA) and slides were mounted in Fluoromount-G (Southern
Biotech, Birmingham, AL). Images were taken using a Leica AxioImager (Leica
Microsystems, Wetzlar, Germany) and Metamorph Software (Molecular Devices,
Sunnyvale, CA). Antibodies used for IF included: Ki67 (1:100, BD Biosciences, San
Jose, CA), NeuN (1:100, Chemicon, Temecula, CA), Gabra6 (1:200, Chemicon), βgal
(1:600, Promega, Madison, WI), GFP (1:100, Invitrogen), N-myc (1:100, Calbiochem,

95
Gibbstown, NJ), cleaved caspase-3 (1:300, Cell Signaling, Danvers, MA), and p27
(1:100, BD Biosciences).
6.3.5 Double IF/AP staining
Double AP/IF staining was performed using the fluorescent AP substrate Fast Red
(Roche). Tissues were fixed and heat inactivated at 65ºC for 3hrs as described above,
and then stained with primary and secondary antibodies. Slides were then washed in
100mM Tris-HCl, pH 8, 100mM NaCl, 10mM MgCl2, and incubated in Fast Red solution
(2mL 0.1M Tris-HCl, pH 8.2/tablet) at RT for 1-4hrs. After staining, slides were washed
in 100mM Tris-HCl, pH 7.5, 150mM NaCl, 0.05% Tween-20 and counterstained with
DAPI as above. Slides were mounted in VectaShield (VectorLabs).
6.3.6 X-gal staining
X-gal staining was performed by permeabilizing sections in 0.01% deoxycholate,
washing in PBS, and incubating in X-gal staining solution (0.4mg/mL X-gal, 10mM
potassium ferrocyanide, 10mM potassium ferricyanide, 1mM MgCl2) overnight at 37ºC.
6.4 TUNEL
TUNEL staining was performed using the In Situ Cell Death Detection Kit, POD
(Roche). Briefly, slides were fixed in 4% PFA for 20 min, washed in PBS, and
permeabilized in 0.1% Triton X-100 + 0.1% sodium citrate. To reduce background, slides

96
were blocked in PBS + 2% BSA for 30 min. The slides were then incubated in TUNEL
labeling reaction mix for 1hr at 37ºC. After termination of the labeling, sections were
counterstained with DAPI and mounted using Fluoromount G. Labeled cells were
visualized using a Leica AxioImager and Metamorph software.
6.5 Pre-neoplastic lesion quantitation and analysis
Cerebella from 6 and 12 week old M-ptc mice were harvested as described above.
The entire cerebellum from each animal was serially sectioned. To identify pre-neoplastic
cells for each cerebellum, every fifth slide (12-14 slides/cerebellum) was stained with
DAPI. Images of the lesions were taken on either the Leica AxioImager or a Zeiss 510
inverted scanning confocal microscope. All images were taken at 10X magnification and
calibrated using Metamorph image software. To determine area, the pre-neoplastic lesion
was defined in Metamorph and area was calculated based on the µM/pixel calibration.
To calculate volume, the average area of the pre-neoplastic lesion was multiplied by the
section thickness (12µM) and the number of sections in which the lesion was observed.
6.6 Laser capture microdissection
Cerebella from WT P7 and 5-6 week old M-ptc mice were frozen (without prior
fixation) in OCT and sectioned as described above at 10µm thickness. Sections were
stained and dehydrated using the Molecular Devices HistoGene LCM Frozen Section
Staining Kit (Molecular Devices, Sunnyvale, CA). Cells were captured using the

97
Arcturus Laser Capture Microsdissection system (Molecular Devices). RNA was
isolated using the PicoPure RNA isolation kit (Molecular Devices).
6.7 Isolation and retroviral infection of PNCs and tumor cells
PNCs were isolated from 5-6 week-old ptc+/- mice, and tumor cells were isolated
from 3-6 month-old ptc+/- mice with signs of medulloblastoma. The cerebella were
minced, incubated at 37ºC in papain to digest the tissue (Worthington Biochemical,
Lakewood, NJ), and triturated to a single cell suspension. The cells were then
fractionated using a Percoll density gradient and cells of the appropriate density were
isolated. Cells were plated on poly-D-lysine coated tissue culture dishes in Neurobasal
media containing B27 supplement, sodium pyruvate, L-glutamine, and
penicillin/streptomycin (NB-B27, all components from Invitrogen). Immediately after
isolation, cells were infected with supernatants from 293T cells transfected with gag-pol
and VSV-G plasmids and either control GFP retroviral vectors (MSCV-IRES-GFP or
LZRS-IRES-GFP) or vectors encoding N-myc (LZRS-N-myc-IRES-GFP) (Oliver et al.
2003). Cells were cultured with virus for 24hrs prior to harvesting for transplantation.
6.8 Intracerebellar transplantation
For transplantation of naive PNCs and tumor cells, freshly isolated cells were re-
suspended in NB-B27 at a concentration of 1 x 10⁵ cells/µL. For retroviral
overexpression experiments, infected cells were removed from the culture dish by
digestion with papain, washed and resuspended in NB-B27 at a concentration of 1 x 10⁵

98
cells/µL. SCID-Beige hosts (4-6 weeks old, Taconic Farms, Hudson, NY) were used for
these transplants because the heterogeneous genetic background of the ptc+/- mice
precludes transplantation into syngeneic hosts. SCID-beige animals were anesthetized by
intraperitoneal injection with 100mg/kg ketamine (Fort Dodge Animal Health, Overland
Park, KS) + 9mg/kg xylazine (Ben Venure Laboratories, Bedford, OH). Once
anesthetized, the fur was shaved from the head and the scalp prepared with ethanol and
betadine scrubs. The animal was positioned in a Kopf stereotaxic frame with a mouse
adaptor (Kopf Instruments, Tujunga, CA), and a 0.5-inch incision was made in the skin
from the top of the skull to just below the ears. A beveled end 18G needle was used to
bore a hole directly above the cerebellum. An unbeveled 24-gauge Hamilton syringe,
loaded with 5µL of the cell suspension and mounted in a micromanipulator, was inserted
into the hole at a depth of 1mm. The cells were injected slowly, the syringe was
removed, and the incision was treated with 1-2 drops of 0.25% bupivicaine (post-
operative analgesic, Hospira, Lake Forest, IL), and sutured using 6-0 fast absorbing plaint
gut suture on a 3/8 PC-1 cutting needle (Ethicon, Somerville, NJ) and the animals were
then allowed to recover. Animals were monitored for symptoms of medulloblastoma for
4-6 months post-transplantation.
6.9 Proliferation Assays
Cells were cultured in poly(d-lysine)-coated 96-well plates at 2 × 10⁵ cells per
well. For infection/treatment experiments, PNCs were infected for 24 hours prior to
addition of either bFGF (25ngl/mL, Peprotech, Rocky Hill, NJ) or cyclopamine (1uM,

99
Toronto Research Chemicals). After 48 hours, cells were pulsed with [methyl-
3H]thymidine (GE Healthcare, Piscataway, NJ). After 16 hours, cells were harvested by
using a Mach IIIM Manual Harvester 96 (TOMTEC, Hamden, CT), and incorporated
radioactivity was quantitated by using a Wallac MicroBeta microplate scintillation
counter (PerkinElmer, Fremont, CA).
6.10 RNA isolation, cDNA synthesis, and real-time RT-PCR
mRNA was isolated from cells and tissue using the Qiagen RNAeasy kit (Qiagen,
Valencia, CA) and treated with DNA-free DNase treatment and removal reagents
(Ambion, Austin, TX). cDNA was synthesized using oligo(dT) and SuperscriptII reverse
transcriptase (Invitrogen). Real-Time RT-PCR reactions were performed in triplicate on
the cDNA using BioRad iQ SYBR green supermix and the BioRad iQ5 Multicolor Real-
Time PCR Detection System (BioRad, Hercules, CA). Mouse primers used for rt-RT-
PCR included beta-2-microglobulin, Gli1, CyclinD1, Math1, and WT patched.

100
References
Abraham, H., T. Tornoczky, G. Kosztolanyi, and L. Seress. 2001. Cell formation in the
cortical layers of the developing human cerebellum. Int J Dev Neurosci 19, no. 1: 53-62.
Adams, N. C., T. Tomoda, M. Cooper, G. Dietz, and M. E. Hatten. 2002. Mice that lack astrotactin have slowed neuronal migration. Development 129, no. 4: 965-72.
Adesina, A. M., Y. Nguyen, V. Mehta, H. Takei, P. Stangeby, S. Crabtree, M. Chintagumpala, and M. K. Gumerlock. 2007. Foxg1 dysregulation is a frequent event in medulloblastoma. J Neurooncol 85, no. 2: 111-22.
Aitola, M., P. Carlsson, M. Mahlapuu, S. Enerback, and M. Pelto-Huikko. 2000. Forkhead transcription factor foxf2 is expressed in mesodermal tissues involved in epithelio-mesenchymal interactions. Dev Dyn 218, no. 1: 136-49.
Alcedo, J., M. Ayzenzon, T. Von Ohlen, M. Noll, and J. E. Hooper. 1996. The drosophila smoothened gene encodes a seven-pass membrane protein, a putative receptor for the hedgehog signal. Cell 86, no. 2: 221-32.
Aldosari, N., S. H. Bigner, P. C. Burger, L. Becker, J. L. Kepner, H. S. Friedman, and R. E. McLendon. 2002. Mycc and mycn oncogene amplification in medulloblastoma. A fluorescence in situ hybridization study on paraffin sections from the children's oncology group. Arch Pathol Lab Med 126, no. 5: 540-4.
Altman, J. and S. A. Bayer. 1997. Development of the cerebellar system: In relation to its evolution, structure and functions. Boca Raton, FL: CRC Press.
Bar, E. E., A. Chaudhry, M. H. Farah, and C. G. Eberhart. 2007. Hedgehog signaling promotes medulloblastoma survival via bc/ii. American Journal of Pathology 170, no. 1: 347-55.
Bell, E., J. Lunec, and D. A. Tweddle. 2007. Cell cycle regulation targets of mycn identified by gene expression microarrays. Cell Cycle 6, no. 10: 1249-56.

101
Ben-Arie, N., H. J. Bellen, D. L. Armstrong, A. E. McCall, P. R. Gordadze, Q. Guo, M. M. Matzuk, and H. Y. Zoghbi. 1997. Math1 is essential for genesis of cerebellar granule neurons. Nature 390, no. 6656: 169-72.
Ben-Arie, N., B. A. Hassan, N. A. Bermingham, D. M. Malicki, D. Armstrong, M. Matzuk, H. J. Bellen, and H. Y. Zoghbi. 2000. Functional conservation of atonal and math1 in the cns and pns. Development 127, no. 5: 1039-48.
Berman, D. M., S. S. Karhadkar, A. R. Hallahan, J. I. Pritchard, C. G. Eberhart, D. N. Watkins, J. K. Chen, M. K. Cooper, J. Taipale, J. M. Olson, and P. A. Beachy. 2002. Medulloblastoma growth inhibition by hedgehog pathway blockade. Science 297, no. 5586: 1559-61.
Black, A. R., J. D. Black, and J. Azizkhan-Clifford. 2001. Sp1 and kruppel-like factor family of transcription factors in cell growth regulation and cancer. J Cell Physiol 188, no. 2: 143-60.
Boxer, R. B., J. W. Jang, L. Sintasath, and L. A. Chodosh. 2004. Lack of sustained regression of c-myc-induced mammary adenocarcinomas following brief or prolonged myc inactivation. Cancer Cell 6, no. 6: 577-86.
Browd, S. R., A. M. Kenney, O. N. Gottfried, J. W. Yoon, D. Walterhouse, C. A. Pedone, and D. W. Fults. 2006. N-myc can substitute for insulin-like growth factor signaling in a mouse model of sonic hedgehog-induced medulloblastoma. Cancer Res 66, no. 5: 2666-72.
Cervoni, L., A. Maleci, M. Salvati, R. Delfini, and G. Cantore. 1994. Medulloblastoma in late adults: Report of two cases and critical review of the literature. J Neurooncol 19, no. 2: 169-73.
Cherry, S. R., D. Biniszkiewicz, L. van Parijs, D. Baltimore, and R. Jaenisch. 2000. Retroviral expression in embryonic stem cells and hematopoietic stem cells. Mol Cell Biol 20, no. 20: 7419-26.
Chizhikov, V. and K. J. Millen. 2003. Development and malformations of the cerebellum in mice. Mol Genet Metab 80, no. 1-2: 54-65.

102
Ciemerych, M. A., A. M. Kenney, E. Sicinska, I. Kalaszczynska, R. T. Bronson, D. H. Rowitch, H. Gardner, and P. Sicinski. 2002. Development of mice expressing a single d-type cyclin. Genes Dev 16, no. 24: 3277-89.
Crawford, J. R., T. J. MacDonald, and R. J. Packer. 2007. Medulloblastoma in childhood: New biological advances. Lancet Neurol 6, no. 12: 1073-85.
Dahmane, N. and A. Ruiz-i-Altaba. 1999. Sonic hedgehog regulates the growth and patterning of the cerebellum. Development 126, no. 14: 3089-100.
Dellovade, T., J. T. Romer, T. Curran, and L. L. Rubin. 2006. The hedgehog pathway and neurological disorders. Annu Rev Neurosci 29: 539-63.
Eberhart, C. G., J. E. Kratz, A. Schuster, P. Goldthwaite, K. J. Cohen, E. J. Perlman, and P. C. Burger. 2002. Comparative genomic hybridization detects an increased number of chromosomal alterations in large cell/anaplastic medulloblastomas. Brain Pathol 12, no. 1: 36-44.
Echelard, Y., D. J. Epstein, B. St-Jacques, L. Shen, J. Mohler, J. A. McMahon, and A. P. McMahon. 1993. Sonic hedgehog, a member of a family of putative signaling molecules, is implicated in the regulation of cns polarity. Cell 75, no. 7: 1417-30.
Ecke, I., A. Rosenberger, S. Obenauer, C. Dullin, F. Aberger, S. Kimmina, S. Schweyer, and H. Hahn. 2008. Cyclopamine treatment of full-blown hh/ptch-associated rms partially inhibits hh/ptch signaling, but not tumor growth. Mol Carcinog 47, no. 5: 361-72.
Ellison, D. W., S. C. Clifford, A. Gajjar, and R. J. Gilbertson. 2003. What's new in neuro-oncology? Recent advances in medulloblastoma. Eur J Paediatr Neurol 7, no. 2: 53-66.
Eminli, S., J. Utikal, K. Arnold, R. Jaenisch, and K. Hochedlinger. 2008. Reprogramming of neural progenitor cells into induced pluripotent stem cells in the absence of exogenous sox2 expression. Stem Cells 26, no. 10: 2467-74.
Epstein, E. H. 2008. Basal cell carcinomas: Attack of the hedgehog. Nat Rev Cancer 8, no. 10: 743-54.

103
Fleming, J. B., G. L. Shen, S. E. Holloway, M. Davis, and R. A. Brekken. 2005. Molecular consequences of silencing mutant k-ras in pancreatic cancer cells: Justification for k-ras-directed therapy. Mol Cancer Res 3, no. 7: 413-23.
Fogarty, M. P., B. A. Emmenegger, L. L. Grasfeder, T. G. Oliver, and R. J. Wechsler-Reya. 2007. Fibroblast growth factor blocks sonic hedgehog signaling in neuronal precursors and tumor cells. Proc Natl Acad Sci U S A 104, no. 8: 2973-8.
Fogarty, M. P., J. D. Kessler, and R. J. Wechsler-Reya. 2005. Morphing into cancer: The role of developmental signaling pathways in brain tumor formation. J Neurobiol 64, no. 4: 458-75.
Foster, K. W., A. R. Frost, P. McKie-Bell, C. Y. Lin, J. A. Engler, W. E. Grizzle, and J. M. Ruppert. 2000. Increase of gklf messenger rna and protein expression during progression of breast cancer. Cancer Res 60, no. 22: 6488-95.
Frappart, P. O., Y. Lee, J. Lamont, and P. J. McKinnon. 2007. Brca2 is required for neurogenesis and suppression of medulloblastoma. Embo J 26, no. 11: 2732-42.
Giangaspero, F., L. Rigobello, M. Badiali, M. Loda, L. Andreini, G. Basso, F. Zorzi, and A. Montaldi. 1992. Large-cell medulloblastomas. A distinct variant with highly aggressive behavior. Am J Surg Pathol 16, no. 7: 687-93.
Gilbertson, R. J. and D. W. Ellison. 2008. The origins of medulloblastoma subtypes. Annu Rev Pathol 3: 341-65.
Glickstein, M. 2007. What does the cerebellum really do? Curr Biol 17, no. 19: R824-7.
Goldowitz, D. and K. Hamre. 1998. The cells and molecules that make a cerebellum. Trends Neurosci 21, no. 9: 375-82.
Goodrich, L.V., L. Milenkovic, K.M. Higgins, and M.P. Scott. 1997. Altered neural cell fates and medulloblastoma in mouse patched mutants. Science 277: 1109-1113.
Gorlin, R. J. 1995. Nevoid basal cell carcinoma syndrome. Dermatol Clin 13, no. 1: 113-25.

104
Grigoriadis, A. E., K. Schellander, Z. Q. Wang, and E. F. Wagner. 1993. Osteoblasts are target cells for transformation in c-fos transgenic mice. J Cell Biol 122, no. 3: 685-701.
Grimmer, M. R. and W. A. Weiss. 2006. Childhood tumors of the nervous system as disorders of normal development. Curr Opin Pediatr 18, no. 6: 634-8.
Hahn, H., C. Wicking, P. G. Zaphiropoulous, M. R. Gailani, S. Shanley, A. Chidambaram, I. Vorechovsky, E. Holmberg, A. B. Unden, S. Gillies, K. Negus, I. Smyth, C. Pressman, D. J. Leffell, B. Gerrard, A. M. Goldstein, M. Dean, R. Toftgard, G. Chenevix-Trench, B. Wainwright, and A. E. Bale. 1996. Mutations of the human homolog of drosophila patched in the nevoid basal cell carcinoma syndrome. Cell 85, no. 6: 841-51.
Hallahan, A. R., J. I. Pritchard, S. Hansen, M. Benson, J. Stoeck, B. A. Hatton, T. L. Russell, R. G. Ellenbogen, I. D. Bernstein, P. A. Beachy, and J. M. Olson. 2004. The smoa1 mouse model reveals that notch signaling is critical for the growth and survival of sonic hedgehog-induced medulloblastomas. Cancer Res 64, no. 21: 7794-800.
Hanahan, D. and R. A. Weinberg. 2000. The hallmarks of cancer. Cell 100, no. 1: 57-70.
Hatten, M. E. 1999. Central nervous system neuronal migration. Annu Rev Neurosci 22: 511-39.
Hatton, B. A., P. S. Knoepfler, A. M. Kenney, D. H. Rowitch, I. M. de Alboran, J. M. Olson, and R. N. Eisenman. 2006. N-myc is an essential downstream effector of shh signaling during both normal and neoplastic cerebellar growth. Cancer Res 66, no. 17: 8655-61.
Hemmati, H. D., I. Nakano, J. A. Lazareff, M. Masterman-Smith, D. H. Geschwind, M. Bronner-Fraser, and H. I. Kornblum. 2003. Cancerous stem cells can arise from pediatric brain tumors. Proc Natl Acad Sci U S A 100, no. 25: 15178-83.
Hooper, J. E. and M. P. Scott. 2005. Communicating with hedgehogs. Nat Rev Mol Cell Biol 6, no. 4: 306-17.

105
Huang, S., J. He, X. Zhang, Y. Bian, L. Yang, G. Xie, K. Zhang, W. Tang, A. A. Stelter, Q. Wang, H. Zhang, and J. Xie. 2006. Activation of the hedgehog pathway in human hepatocellular carcinomas. Carcinogenesis 27, no. 7: 1334-40.
Hurlin, P. J. 2005. N-myc functions in transcription and development. Birth Defects Res C Embryo Today 75, no. 4: 340-52.
Jain, M., C. Arvanitis, K. Chu, W. Dewey, E. Leonhardt, M. Trinh, C. D. Sundberg, J. M. Bishop, and D. W. Felsher. 2002. Sustained loss of a neoplastic phenotype by brief inactivation of myc. Science 297, no. 5578: 102-4.
Jass, J. R. and I. C. Talbot. 2001. Molecular and cellular biology of pre-malignancy in the gastrointestinal tract. Best Pract Res Clin Gastroenterol 15, no. 2: 175-89.
Jochum, W., E. Passegue, and E. F. Wagner. 2001. Ap-1 in mouse development and tumorigenesis. Oncogene 20, no. 19: 2401-12.
Johnson, R. L., A. L. Rothman, J. Xie, L. V. Goodrich, J. W. Bare, J. M. Bonifas, A. G. Quinn, R. M. Myers, D. R. Cox, E. H. Epstein, Jr., and M. P. Scott. 1996. Human homolog of patched, a candidate gene for the basal cell nevus syndrome. Science 272, no. 5268: 1668-71.
Kappler, R., R. Bauer, J. Calzada-Wack, M. Rosemann, B. Hemmerlein, and H. Hahn. 2004. Profiling the molecular difference between patched- and p53-dependent rhabdomyosarcoma. Oncogene 23, no. 54: 8785-95.
Karhadkar, S. S., G. S. Bova, N. Abdallah, S. Dhara, D. Gardner, A. Maitra, J. T. Isaacs, D. M. Berman, and P. A. Beachy. 2004. Hedgehog signalling in prostate regeneration, neoplasia and metastasis. Nature 431, no. 7009: 707-12.
Kenney, A. M., M. D. Cole, and D. H. Rowitch. 2003. Nmyc upregulation by sonic hedgehog signaling promotes proliferation in developing cerebellar granule neuron precursors. Development 130, no. 1: 15-28.
Kenney, A. M. and D. H. Rowitch. 2000. Sonic hedgehog promotes g(1) cyclin expression and sustained cell cycle progression in mammalian neuronal precursors. Mol Cell Biol 20, no. 23: 9055-67.

106
Kenney, A. M., H. R. Widlund, and D. H. Rowitch. 2004. Hedgehog and pi-3 kinase signaling converge on nmyc1 to promote cell cycle progression in cerebellar neuronal precursors. Development 131, no. 1: 217-28.
Kerjan, G., J. Dolan, C. Haumaitre, S. Schneider-Maunoury, H. Fujisawa, K. J. Mitchell, and A. Chedotal. 2005. The transmembrane semaphorin sema6a controls cerebellar granule cell migration. Nature Neuroscience 8, no. 11: 1516-24.
Kim, J. B., H. Zaehres, G. Wu, L. Gentile, K. Ko, V. Sebastiano, M. J. Arauzo-Bravo, D. Ruau, D. W. Han, M. Zenke, and H. R. Scholer. 2008. Pluripotent stem cells induced from adult neural stem cells by reprogramming with two factors. Nature 454, no. 7204: 646-50.
Kim, J. Y., A. L. Nelson, S. A. Algon, O. Graves, L. M. Sturla, L. C. Goumnerova, D. H. Rowitch, R. A. Segal, and S. L. Pomeroy. 2003. Medulloblastoma tumorigenesis diverges from cerebellar granule cell differentiation in patched heterozygous mice. Dev Biol 263, no. 1: 50-66.
Kim, M. J., R. Bhatia-Gaur, W. A. Banach-Petrosky, N. Desai, Y. Wang, S. W. Hayward, G. R. Cunha, R. D. Cardiff, M. M. Shen, and C. Abate-Shen. 2002. Nkx3.1 mutant mice recapitulate early stages of prostate carcinogenesis. Cancer Res 62, no. 11: 2999-3004.
Klein, C., S. J. Butt, R. P. Machold, J. E. Johnson, and G. Fishell. 2005. Cerebellum- and forebrain-derived stem cells possess intrinsic regional character. Development.
Knoepfler, P. S., P. F. Cheng, and R. N. Eisenman. 2002. N-myc is essential during neurogenesis for the rapid expansion of progenitor cell populations and the inhibition of neuronal differentiation. Genes Dev 16, no. 20: 2699-712.
Krauss, S., J. P. Concordet, and P. W. Ingham. 1993. A functionally conserved homolog of the drosophila segment polarity gene hh is expressed in tissues with polarizing activity in zebrafish embryos. Cell 75, no. 7: 1431-44.
Kubo, M., M. Nakamura, A. Tasaki, N. Yamanaka, H. Nakashima, M. Nomura, S. Kuroki, and M. Katano. 2004. Hedgehog signaling pathway is a new therapeutic target for patients with breast cancer. Cancer Res 64, no. 17: 6071-4.

107
Kuroda, K. O., M. J. Meaney, N. Uetani, and T. Kato. 2008. Neurobehavioral basis of the impaired nurturing in mice lacking the immediate early gene fosb. Brain Res 1211: 57-71.
Lee, A., J. D. Kessler, T. A. Read, C. Kaiser, D. Corbeil, W. B. Huttner, J. E. Johnson, and R. J. Wechsler-Reya. 2005. Isolation of neural stem cells from the postnatal cerebellum. Nat Neurosci 8, no. 6: 723-9.
Lee, Y. and P. J. McKinnon. 2002. DNA ligase iv suppresses medulloblastoma formation. Cancer Res 62, no. 22: 6395-9.
Lee, Y., H. L. Miller, P. Jensen, R. Hernan, M. Connelly, C. Wetmore, F. Zindy, M. F. Roussel, T. Curran, R. J. Gilbertson, and P. J. McKinnon. 2003. A molecular fingerprint for medulloblastoma. Cancer Res 63, no. 17: 5428-37.
Leighton, P. A., K. J. Mitchell, L. V. Goodrich, X. Lu, K. Pinson, P. Scherz, W. C. Skarnes, and M. Tessier-Lavigne. 2001. Defining brain wiring patterns and mechanisms through gene trapping in mice. Nature 410, no. 6825: 174-9.
Levine, J. S. and D. J. Ahnen. 2006. Clinical practice. Adenomatous polyps of the colon. N Engl J Med 355, no. 24: 2551-7.
Li, L., M. C. Connelly, C. Wetmore, T. Curran, and J. I. Morgan. 2003. Mouse embryos cloned from brain tumors. Cancer Res 63, no. 11: 2733-6.
Li, Y., J. McClintick, L. Zhong, H. J. Edenberg, M. C. Yoder, and R. J. Chan. 2005. Murine embryonic stem cell differentiation is promoted by socs-3 and inhibited by the zinc finger transcription factor klf4. Blood 105, no. 2: 635-7.
Lidwell, K. and R. Griffiths. 2000. Possible role for the fosb/jund ap-1 transcription factor complex in glutamate-mediated excitotoxicity in cultured cerebellar granule cells. J Neurosci Res 62, no. 3: 427-39.
Lin, Y., L. Chen, C. Lin, Y. Luo, R. Y. Tsai, and F. Wang. 2009. Neuron-derived fgf9 is essential for scaffold formation of bergmann radial fibers and migration of granule neurons in the cerebellum. Dev Biol.

108
Lo, K. C., M. R. Rossi, C. G. Eberhart, and J. K. Cowell. 2007. Genome wide copy number abnormalities in pediatric medulloblastomas as assessed by array comparative genome hybridization. Brain Pathol 17, no. 3: 282-96.
Louis, D. N., H. Ohgaki, O. D. Wiestler, W. K. Cavenee, P. C. Burger, A. Jouvet, B. W. Scheithauer, and P. Kleihues. 2007. The 2007 who classification of tumours of the central nervous system. Acta Neuropathol 114, no. 2: 97-109.
Lowe, S. W., E. Cepero, and G. Evan. 2004. Intrinsic tumour suppression. Nature 432, no. 7015: 307-15.
Lumpkin, E. A., T. Collisson, P. Parab, A. Omer-Abdalla, H. Haeberle, P. Chen, A. Doetzlhofer, P. White, A. Groves, N. Segil, and J. E. Johnson. 2003. Math1-driven gfp expression in the developing nervous system of transgenic mice. Gene Expr Patterns 3, no. 4: 389-95.
Ma, X., T. Sheng, Y. Zhang, X. Zhang, J. He, S. Huang, K. Chen, J. Sultz, P. A. Adegboyega, H. Zhang, and J. Xie. 2006. Hedgehog signaling is activated in subsets of esophageal cancers. Int J Cancer 118, no. 1: 139-48.
Machold, R. and G. Fishell. 2005. Math1 is expressed in temporally discrete pools of cerebellar rhombic-lip neural progenitors. Neuron 48, no. 1: 17-24.
Maglione, J. E., D. Moghanaki, L. J. Young, C. K. Manner, L. G. Ellies, S. O. Joseph, B. Nicholson, R. D. Cardiff, and C. L. MacLeod. 2001. Transgenic polyoma middle-t mice model premalignant mammary disease. Cancer Res 61, no. 22: 8298-305.
Mao, X., Y. Fujiwara, A. Chapdelaine, H. Yang, and S. H. Orkin. 2001. Activation of egfp expression by cre-mediated excision in a new rosa26 reporter mouse strain. Blood 97, no. 1: 324-6.
Martins, C. P., L. Brown-Swigart, and G. I. Evan. 2006. Modeling the therapeutic efficacy of p53 restoration in tumors. Cell 127, no. 7: 1323-34.
McCall, T. D., C. A. Pedone, and D. W. Fults. 2007. Apoptosis suppression by somatic cell transfer of bcl-2 promotes sonic hedgehog-dependent medulloblastoma formation in mice. Cancer Research 67, no. 11: 5179-85.

109
McManamy, C. S., J. M. Lamont, R. E. Taylor, M. Cole, A. D. Pearson, S. C. Clifford, and D. W. Ellison. 2003. Morphophenotypic variation predicts clinical behavior in childhood non-desmoplastic medulloblastomas. J Neuropathol Exp Neurol 62, no. 6: 627-32.
Messer, A. and K. Hatch. 1984. Persistence of cerebellar thymidine kinase in staggerer and hypothyroid mutants. J Neurogenet 1, no. 3: 239-48.
Milde-Langosch, K. 2005. The fos family of transcription factors and their role in tumourigenesis. Eur J Cancer 41, no. 16: 2449-61.
Miyazawa, K., T. Himi, V. Garcia, H. Yamagishi, S. Sato, and Y. Ishizaki. 2000. A role for p27/kip1 in the control of cerebellar granule cell precursor proliferation. J Neurosci 20, no. 15: 5756-63.
Mokbel, K. and B. Cutuli. 2006. Heterogeneity of ductal carcinoma in situ and its effects on management. Lancet Oncol 7, no. 9: 756-65.
Montironi, R., R. Mazzucchelli, A. Lopez-Beltran, L. Cheng, and M. Scarpelli. 2007. Mechanisms of disease: High-grade prostatic intraepithelial neoplasia and other proposed preneoplastic lesions in the prostate. Nat Clin Pract Urol 4, no. 6: 321-32.
Moody, S. E., C. J. Sarkisian, K. T. Hahn, E. J. Gunther, S. Pickup, K. D. Dugan, N. Innocent, R. D. Cardiff, M. D. Schnall, and L. A. Chodosh. 2002. Conditional activation of neu in the mammary epithelium of transgenic mice results in reversible pulmonary metastasis. Cancer Cell 2, no. 6: 451-61.
Murphy, D. J., M. R. Junttila, L. Pouyet, A. Karnezis, K. Shchors, D. A. Bui, L. Brown-Swigart, L. Johnson, and G. I. Evan. 2008. Distinct thresholds govern myc's biological output in vivo. Cancer Cell 14, no. 6: 447-57.
Myatt, S. S. and E. W. Lam. 2007. The emerging roles of forkhead box (fox) proteins in cancer. Nat Rev Cancer 7, no. 11: 847-59.

110
Nakagawa, M., M. Koyanagi, K. Tanabe, K. Takahashi, T. Ichisaka, T. Aoi, K. Okita, Y. Mochiduki, N. Takizawa, and S. Yamanaka. 2008. Generation of induced pluripotent stem cells without myc from mouse and human fibroblasts. Nat Biotechnol 26, no. 1: 101-6.
Nakamura, M., T. Matsuo, J. Stauffer, L. Neckers, and C. J. Thiele. 2003. Retinoic acid decreases targeting of p27 for degradation via an n-myc-dependent decrease in p27 phosphorylation and an n-myc-independent decrease in skp2. Cell Death Differ 10, no. 2: 230-9.
Nicot, A., V. Lelievre, J. Tam, J. A. Waschek, and E. DiCicco-Bloom. 2002. Pituitary adenylate cyclase-activating polypeptide and sonic hedgehog interact to control cerebellar granule precursor cell proliferation. J Neurosci 22, no. 21: 9244-54.
Nusslein-Volhard, C. and E. Wieschaus. 1980. Mutations affecting segment number and polarity in drosophila. Nature 287, no. 5785: 795-801.
Okita, K., T. Ichisaka, and S. Yamanaka. 2007. Generation of germline-competent induced pluripotent stem cells. Nature 448, no. 7151: 313-7.
Oliver, T. G., L. L. Grasfeder, A. L. Carroll, C. Kaiser, C. L. Gillingham, S. M. Lin, R. Wickramasinghe, M. P. Scott, and R. J. Wechsler-Reya. 2003. Transcriptional profiling of the sonic hedgehog response: A critical role for n-myc in proliferation of neuronal precursors. Proc Natl Acad Sci U S A 100, no. 12: 7331-6.
Oliver, T. G., T. A. Read, J. D. Kessler, A. Mehmeti, J. F. Wells, T. T. Huynh, S. M. Lin, and R. J. Wechsler-Reya. 2005. Loss of patched and disruption of granule cell development in a pre-neoplastic stage of medulloblastoma. Development 132, no. 10: 2425-39.
Ormestad, M., J. Astorga, H. Landgren, T. Wang, B. R. Johansson, N. Miura, and P. Carlsson. 2006. Foxf1 and foxf2 control murine gut development by limiting mesenchymal wnt signaling and promoting extracellular matrix production. Development 133, no. 5: 833-43.
Packer, R. J. 2008. Childhood brain tumors: Accomplishments and ongoing challenges. J Child Neurol 23, no. 10: 1122-7.

111
Pandya, A. Y., L. I. Talley, A. R. Frost, T. J. Fitzgerald, V. Trivedi, M. Chakravarthy, D. C. Chhieng, W. E. Grizzle, J. A. Engler, H. Krontiras, K. I. Bland, A. F. LoBuglio, S. M. Lobo-Ruppert, and J. M. Ruppert. 2004. Nuclear localization of klf4 is associated with an aggressive phenotype in early-stage breast cancer. Clin Cancer Res 10, no. 8: 2709-19.
Pazzaglia, S., M. Tanori, M. Mancuso, M. Gessi, E. Pasquali, S. Leonardi, M. A. Oliva, S. Rebessi, V. Di Majo, V. Covelli, F. Giangaspero, and A. Saran. 2006. Two-hit model for progression of medulloblastoma preneoplasia in patched heterozygous mice. Oncogene.
Pietsch, T., A. Waha, A. Koch, J. Kraus, S. Albrecht, J. Tonn, N. Sorensen, F. Berthold, B. Henk, N. Schmandt, H. K. Wolf, A. von Deimling, B. Wainwright, G. Chenevix-Trench, O. D. Wiestler, and C. Wicking. 1997. Medulloblastomas of the desmoplastic variant carry mutations of the human homologue of drosophila patched. Cancer Res 57, no. 11: 2085-8.
Pogoriler, J., K. Millen, M. Utset, and W. Du. 2006. Loss of cyclin d1 impairs cerebellar development and suppresses medulloblastoma formation. Development 133, no. 19: 3929-37.
Pomeroy, S. L., P. Tamayo, M. Gaasenbeek, L. M. Sturla, M. Angelo, M. E. McLaughlin, J. Y. Kim, L. C. Goumnerova, P. M. Black, C. Lau, J. C. Allen, D. Zagzag, J. M. Olson, T. Curran, C. Wetmore, J. A. Biegel, T. Poggio, S. Mukherjee, R. Rifkin, A. Califano, G. Stolovitzky, D. N. Louis, J. P. Mesirov, E. S. Lander, and T. R. Golub. 2002. Prediction of central nervous system embryonal tumour outcome based on gene expression. Nature 415, no. 6870: 436-42.
Pons, S., J. L. Trejo, J. R. Martinez-Morales, and E. Marti. 2001. Vitronectin regulates sonic hedgehog activity during cerebellum development through creb phosphorylation. Development 128, no. 9: 1481-92.
Porter, J. A., K. E. Young, and P. A. Beachy. 1996. Cholesterol modification of hedgehog signaling proteins in animal development. Science 274, no. 5285: 255-9.

112
Prasad, N. B., A. V. Biankin, N. Fukushima, A. Maitra, S. Dhara, A. G. Elkahloun, R. H. Hruban, M. Goggins, and S. D. Leach. 2005. Gene expression profiles in pancreatic intraepithelial neoplasia reflect the effects of hedgehog signaling on pancreatic ductal epithelial cells. Cancer Res 65, no. 5: 1619-26.
Raffel, C., R. B. Jenkins, L. Frederick, D. Hebrink, B. Alderete, D. W. Fults, and C. D. James. 1997. Sporadic medulloblastomas contain ptch mutations. Cancer Res 57, no. 5: 842-5.
Read, T. A., M. P. Fogarty, S. L. Markant, R. E. McLendon, Z. Wei, D. W. Ellison, P. G. Febbo, and R. J. Wechsler-Reya. 2009. Identification of cd15 as a marker for tumor-propagating cells in a mouse model of medulloblastoma. Cancer Cell 15, no. 2: 135-47.
Riddle, R. D., R. L. Johnson, E. Laufer, and C. Tabin. 1993. Sonic hedgehog mediates the polarizing activity of the zpa. Cell 75, no. 7: 1401-16.
Rios, I., R. Alvarez-Rodriguez, E. Marti, and S. Pons. 2004. Bmp2 antagonizes sonic hedgehog-mediated proliferation of cerebellar granule neurones through smad5 signalling. Development 131, no. 13: 3159-68.
Romer, J. and T. Curran. 2005. Targeting medulloblastoma: Small-molecule inhibitors of the sonic hedgehog pathway as potential cancer therapeutics. Cancer Res 65, no. 12: 4975-8.
Rossi, A., V. Caracciolo, G. Russo, K. Reiss, and A. Giordano. 2008. Medulloblastoma: From molecular pathology to therapy. Clin Cancer Res 14, no. 4: 971-6.
Sanchez, P. and A. Ruiz i Altaba. 2005. In vivo inhibition of endogenous brain tumors through systemic interference of hedgehog signaling in mice. Mech Dev 122, no. 2: 223-30.
Sasai, K., J. T. Romer, Y. Lee, D. Finkelstein, C. Fuller, P. J. McKinnon, and T. Curran. 2006. Shh pathway activity is down-regulated in cultured medulloblastoma cells: Implications for preclinical studies. Cancer Res 66, no. 8: 4215-22.

113
Schuermann, M., K. Jooss, and R. Muller. 1991. Fosb is a transforming gene encoding a transcriptional activator. Oncogene 6, no. 4: 567-76.
Shakhova, O., C. Leung, E. van Montfort, A. Berns, and S. Marino. 2006. Lack of rb and p53 delays cerebellar development and predisposes to large cell anaplastic medulloblastoma through amplification of n-myc and ptch2. Cancer Res 66, no. 10: 5190-200.
Sharma, S. V. and J. Settleman. 2007. Oncogene addiction: Setting the stage for molecularly targeted cancer therapy. Genes Dev 21, no. 24: 3214-31.
Singh, M. and A. Maitra. 2007. Precursor lesions of pancreatic cancer: Molecular pathology and clinical implications. Pancreatology 7, no. 1: 9-19.
Singh, S. K., C. Hawkins, I. D. Clarke, J. A. Squire, J. Bayani, T. Hide, R. M. Henkelman, M. D. Cusimano, and P. B. Dirks. 2004. Identification of human brain tumour initiating cells. Nature 432, no. 7015: 396-401.
Sjostrom, S. K., G. Finn, W. C. Hahn, D. H. Rowitch, and A. M. Kenney. 2005. The cdk1 complex plays a prime role in regulating n-myc phosphorylation and turnover in neural precursors. Dev Cell 9, no. 3: 327-38.
Srinivas, S., T. Watanabe, C. S. Lin, C. M. William, Y. Tanabe, T. M. Jessell, and F. Costantini. 2001. Cre reporter strains produced by targeted insertion of eyfp and ecfp into the rosa26 locus. BMC Dev Biol 1: 4.
Taipale, J., J. K. Chen, M. K. Cooper, B. Wang, R. K. Mann, L. Milenkovic, M. P. Scott, and P. A. Beachy. 2000. Effects of oncogenic mutations in smoothened and patched can be reversed by cyclopamine. Nature 406, no. 6799: 1005-9.
Takahashi, K. and S. Yamanaka. 2006. Induction of pluripotent stem cells from mouse embryonic and adult fibroblast cultures by defined factors. Cell 126, no. 4: 663-76.
Taupin, P. 2007. Brdu immunohistochemistry for studying adult neurogenesis: Paradigms, pitfalls, limitations, and validation. Brain Res Rev 53, no. 1: 198-214.

114
Thayer, S. P., M. P. di Magliano, P. W. Heiser, C. M. Nielsen, D. J. Roberts, G. Y. Lauwers, Y. P. Qi, S. Gysin, C. Fernandez-del Castillo, V. Yajnik, B. Antoniu, M. McMahon, A. L. Warshaw, and M. Hebrok. 2003. Hedgehog is an early and late mediator of pancreatic cancer tumorigenesis. Nature 425, no. 6960: 851-6.
Thomas, W. D., J. Chen, Y. R. Gao, B. Cheung, J. Koach, E. Sekyere, M. D. Norris, M. Haber, T. Ellis, B. Wainwright, and G. M. Marshall. 2009. Patched1 deletion increases n-myc protein stability as a mechanism of medulloblastoma initiation and progression. Oncogene.
Thompson, M. C., C. Fuller, T. L. Hogg, J. Dalton, D. Finkelstein, C. C. Lau, M. Chintagumpala, A. Adesina, D. M. Ashley, S. J. Kellie, M. D. Taylor, T. Curran, A. Gajjar, and R. J. Gilbertson. 2006. Genomics identifies medulloblastoma subgroups that are enriched for specific genetic alterations. J Clin Oncol 24, no. 12: 1924-31.
Tran, P. T., A. C. Fan, P. K. Bendapudi, S. Koh, K. Komatsubara, J. Chen, G. Horng, D. I. Bellovin, S. Giuriato, C. S. Wang, J. A. Whitsett, and D. W. Felsher. 2008. Combined inactivation of myc and k-ras oncogenes reverses tumorigenesis in lung adenocarcinomas and lymphomas. PLoS ONE 3, no. 5: e2125.
Uziel, T., F. Zindy, S. Xie, Y. Lee, A. Forget, S. Magdaleno, J. E. Rehg, C. Calabrese, D. Solecki, C. G. Eberhart, S. E. Sherr, S. Plimmer, S. C. Clifford, M. E. Hatten, P. J. McKinnon, R. J. Gilbertson, T. Curran, C. J. Sherr, and M. F. Roussel. 2005. The tumor suppressors ink4c and p53 collaborate independently with patched to suppress medulloblastoma formation. Genes Dev 19, no. 22: 2656-67.
Wallace, V. A. 1999. Purkinje-cell-derived sonic hedgehog regulates granule neuron precursor cell proliferation in the developing mouse cerebellum. Curr Biol 9, no. 8: 445-8.
Wang, T., T. Tamakoshi, T. Uezato, F. Shu, N. Kanzaki-Kato, Y. Fu, H. Koseki, N. Yoshida, T. Sugiyama, and N. Miura. 2003. Forkhead transcription factor foxf2 (lun)-deficient mice exhibit abnormal development of secondary palate. Dev Biol 259, no. 1: 83-94.

115
Wechsler-Reya, R. J. and M. P. Scott. 1999. Control of neuronal precursor proliferation in the cerebellum by sonic hedgehog [see comments]. Neuron 22, no. 1: 103-14.
Wechsler-Reya, R. and M. P. Scott. 2001. The developmental biology of brain tumors. Annu Rev Neurosci 24: 385-428.
Weinstein, I. B. and A. Joe. 2008. Oncogene addiction. Cancer Res 68, no. 9: 3077-80; discussion 3080.
Weiss, W. A., K. Aldape, G. Mohapatra, B. G. Feuerstein, and J. M. Bishop. 1997. Targeted expression of mycn causes neuroblastoma in transgenic mice. Embo J 16, no. 11: 2985-95.
Wendling, D. S., C. Luck, D. von Schweinitz, and R. Kappler. 2008. Characteristic overexpression of the forkhead box transcription factor foxf1 in patched-associated tumors. Int J Mol Med 22, no. 6: 787-92.
Wetmore, C., D. E. Eberhart, and T. Curran. 2000. The normal patched allele is expressed in medulloblastomas from mice with heterozygous germ-line mutation of patched. Cancer Res 60, no. 8: 2239-46.
Wetmore, C., D. E. Eberhart, and T. Curran. 2001. Loss of p53 but not arf accelerates medulloblastoma in mice heterozygous for patched. Cancer Res 61, no. 2: 513-6.
Wiencken-Barger, A. E., B. Djukic, K. B. Casper, and K. D. McCarthy. 2007. A role for connexin43 during neurodevelopment. Glia 55, no. 7: 675-86.
Xie, J. 2008. Hedgehog signaling pathway: Development of antagonists for cancer therapy. Curr Oncol Rep 10, no. 2: 107-13.
Yan, C. T., D. Kaushal, M. Murphy, Y. Zhang, A. Datta, C. Chen, B. Monroe, G. Mostoslavsky, K. Coakley, Y. Gao, K. D. Mills, A. P. Fazeli, S. Tepsuporn, G. Hall, R. Mulligan, E. Fox, R. Bronson, U. De Girolami, C. Lee, and F. W. Alt. 2006. Xrcc4 suppresses medulloblastomas with recurrent translocations in p53-deficient mice. Proc Natl Acad Sci U S A 103, no. 19: 7378-83.

116
Yang, Z. J., T. Ellis, S. L. Markant, T. A. Read, J. D. Kessler, M. Bourboulas, U. Schuller, R. Machold, G. Fishell, D. H. Rowitch, B. J. Wainwright, and R. J. Wechsler-Reya. 2008. Medulloblastoma can be initiated by deletion of patched in lineage-restricted progenitors or stem cells. Cancer Cell 14, no. 2: 135-45.
Zhao, H., O. Ayrault, F. Zindy, J. H. Kim, and M. F. Roussel. 2008. Post-transcriptional down-regulation of atoh1/math1 by bone morphogenic proteins suppresses medulloblastoma development. Genes Dev 22, no. 6: 722-7.
Zindy, F., P. S. Knoepfler, S. Xie, C. J. Sherr, R. N. Eisenman, and M. F. Roussel. 2006. N-myc and the cyclin-dependent kinase inhibitors p18ink4c and p27kip1 coordinately regulate cerebellar development. Proc Natl Acad Sci U S A 103, no. 31: 11579-83.
Zindy, F., T. Uziel, O. Ayrault, C. Calabrese, M. Valentine, J. E. Rehg, R. J. Gilbertson, C. J. Sherr, and M. F. Roussel. 2007. Genetic alterations in mouse medulloblastomas and generation of tumors de novo from primary cerebellar granule neuron precursors. Cancer Res 67, no. 6: 2676-84.

117
Biography
Jessica D. Kessler April 13, 1981 Richmond, VA
EDUCATION Duke University Durham, NC May 2009 Ph.D., Molecular Cancer Biology University of Virginia Charlottesville, VA May 2003 B.S., Biology AWARDS AND HONORS National Cancer Center Pre-Doctoral Fellowship 2005-2007 Outstanding poster award 2005
Duke Pharmacology and Cancer Biology Department PUBLICATIONS Kessler JD, Hasegawa H, Brun SN, Emmenegger, BA, Yang ZJ, Dutton JW, Wang F,
Wechsler-Reya RJ (2009) N-myc alters the fate of pre-neoplastic cells in a mouse model of medulloblastoma. Genes Dev. 23(2):157-70.
Yang ZJ, Ellis T, Markant SL, Read TA, Kessler JD, Bourboulas M, Schüller U, Machold R, Fishell G, Rowitch DH, Wainwright BJ, Wechsler-Reya RJ. (2008) Medulloblastoma can be initiated by deletion of patched in lineage-restricted progenitors or stem cells. Cancer Cell. 14(2): 135-45.
Fogarty, MP, Kessler, JD, Wechsler-Reya, RJ (2005) Morphing into cancer: The role of developmental signaling pathways in brain tumor formation. J. Neurobiol. 64(4): 458-75.
Lee, A, Kessler, JD, Kaiser, C, Corbeil, D, Huttner, WB, Johnson, JE and Wechsler-Reya, RJ (2005) Isolation of neural stem cells from the postnatal cerebellum. Nat Neurosci. 8(6):723-9.
Oliver, TG, Read, TA, Kessler, JD, Mehmeti, A., Wells, JF, Huynh, TT, Lin, SM and Wechsler-Reya, RJ. (2005) Loss of patched and disruption of granule cell development in a pre-neoplastic stage of medulloblastoma. Development. 132(10): 2425-39.
Abdelall MM, Tholpady SS, Kessler JD, Morgan RF, Ogle RC. (2004) “BMP-9 Transduced Prefabricated Muscular Flaps for Treatment of Bony Defects”. J Craniofac Surg. 15(5): 736-41.
Kessler JD and Ritter JK. (1999) “Induction of Human Detoxifying Enzymes in Primary Hepatocytes by Vegetable Extracts”. Harvard Journal of Undergraduate Sciences. 5(3):36-43.