Department of Metallurgy - spiral.imperial.ac.uk
180
PHYSICAL CHEMISTRY OF MELTS CONTAINING COPPER, LEAD AND ARSENIC by Anthony Richard Aldhous B.Sc A thesis submitted for the degree of Doctor of Philosophy of the University of London and for the Diploma of Membership of the Imperial College. Department of Metallurgy Imperial College London July 1982
Transcript of Department of Metallurgy - spiral.imperial.ac.uk

PHYSICAL CHEMISTRY OF MELTS CONTAINING
COPPER, LEAD AND ARSENIC by
Anthony Richard Aldhous B.Sc
A thesis submitted for the degree of Doctor of Philosophy of the University of London and for
the Diploma of Membership of the Imperial College.
Department of Metallurgy Imperial College London
July 1982

ABSTRACT
The activity of arsenic in copper arsenic and lead copper arsenic alloys is investigated by the transpiration technique. This method is selected because of the high vapour pressure of arsenic and the relatively low vapour pressures of copper and lead. The arsenic activity is varied by altering the temperature of arsenic in an argon stream, which then equilibrates with the metal droplets.
The activity of arsenic is measured in copper arsenic alloys in the range from 900 to 1114 °C. Pure copper droplets are equilibrated with the arsenic laden argon. In the lead copper arsenic system the arsenic activity is set and high arsenic master alloys come to equilibrium by arsenic evaporation, Iso-activity lines are plotted cn ternary phase diagrams.
Arsenic forms a number of molecules in the vapour phase. It evaporates predominantly as As. molecules at temperatures up to » 4 500 °C but dissociates into As^, As^, and As^ as the vapour is heated at the same total pressure. The equilibrium constants for each of the vapour phase reactions are calculated and the standard states and experimental vapour pressures are found by a computer programme.
The activity of copper in copper arsenic alloys is calculated from the arsenic activity data. Integral and partial molar free energies of solution are derived.
The results are compared with earlier investigations after all of the data are converted to a liquid arsenic standard state.

There is close agreement with activity data from earlier investigations.
The results from the research are discussed with reference to the smelting of complex non-ferrous charges. The position of the tie-lines across the miscibility gap in the lead copper arsenic system is explained.

CONTENTS
CHAPTER 1 - INTRODUCTION 1 1.1 Smelting of Complex Non-Ferrous Materials 2 1.1.1 The Imperial Smelting Furnace 8 1.2 Vapour Pressure of Arsenic 10 1.2.1 Determinations of the Vapour Pressure of
Arsenic 12 1.3 The Copper Arsenic System 21 1.3.1 Activity Determinations 21 1.4 The Lead Arsenic System 31 1.5 The Lead-Copper-Arsenic System 34
CHAPTER .2 - EXPERIMENTAL WORK 48 2.1 Activity and Vapour Pressure Measurement
Techniques 49 2.1.1 The Knudsen Effusion Techniques 50 2.1.2 The Langmuir Method 52
2.1.3 The Isopiestic Method 52 2.1.4 The Transpiration Technique 53 2.1.4.1 Saturation and Diffusion of the Vapour 55 2.2 Apparatus 59 2.3 Experimental Technique 63
2.4 Activity Measurement in the Lead-Copper-Arsenic System 71
2.5 Knudsen Cell Mass Spectrometry 78 2.6 Chemical Analysis 81
CHAPTER 3 - RESULTS 82 3.1 The Composition of Arsenic Vapour 83

3.2 The Copper Arsenic System 101 3.2.1 Partial Molar Free Energy of Arsenic in
Copper 101 3.2.2 Integral Free Energy of Solution 101
3.3 The Lead-Copper-Arseriic System 116 3.4 Mass Spectrometry 126
CHAPTER 4 - DISCUSSION 127
4.1 Experimental Technique 128 4.2 The Copper Arsenic System 131 4.2.1 Variation of Activity Coefficient with
Composition 131 4.2.2 The Activity of Copper in Copper-Arsenic
Alloys 135 4.3 The Lead-Copper-Arsenic System 153
APPENDIX 1 161 APPENDIX 2 165 APPENDIX 3 167
REFERENCES 172
ACKNOWLEDGEMENTS 175

1
CHAPTER 1 INTRODUCTION

2
1.1 Smelting of Complex Non-Ferrous Materials
Complex smelting is a traditional process for the treatment of materials which may contain lead, copper, nickel, zinc, iron, sulphur various other semi-metallic elements and some precious metals. The process is traditionally carried out in several stages; sinter-roasting, smelting, converting and refining.
Lead is a major component in every charge and all of the elements are soluble in it at 1250 °C, a typical blast furnace smelting temperature. The solubility of copper and some of the other important metals falls as the temperature decreases. This creates the conditions in which several phases can form.
Davey (1) reported thermodynamic data for many of the binary and ternary systems related to the drossing of lead. Many of the systems are also the constituents of phases encountered in complex smelting. In an idealised complex smelting charge the only elements present would be lead, copper, sulphur and arsenic.
The solubility of copper in lead falls on cooling so that by 600 °C only around 1% by weight of copper is still in solution. The solubility of sulphur also .falls and the similar free energies of formation of the sulphides leads to the formation of of a mixed PbS-Cu S phase, a matte. The Pb-As system forms near to ideal solutions but the copper which separates from the lead contains arsenic at a far lower activity. The copper-arsenic phase which forms separately from the matte is called speiss. The three phases come to equilibrium with each other and are mutually insoluble.

3
The Fb-Cu-As-S system has been investigated experimentally by Matyar (2).
Phase relationships are important because once these are understood the quantities and qualities of the phases which are produced can be predicted and the process optimised. The importance of these relationships was recognised when the possibility of charging copper in the Imperial Smelting Furnace was investigated (3)* Several campaigns were run,with copper, around Europe (4).
The materials for charging in complex smelting are of varying composition and texture. These may vary from complex sulphide concentrates to slimes as well as recycled batteries and scrap assemblies such as electronic circuit boards. These materials may also contain cadmium, tin, cobalt and other values
(5).
One site which was developed for the treatment of complex materials is Metallurgie Hoboken (6). The plant is so diverse that almost any material may be processed. The steps in the processing are described below.
Sinter-Roasting The sinter-roasting has two purposes; 1) To desulphurise sulphide or sulphate materials 2) To agglomerate the materials for smelting
During the sintering the temperature must be carefully controlled to ensure that the high lead concentrates do not melt and that the rate of sulphur elimination is not too high for efficient gas cleaninr'.

4
Lead/Copper Blast Furnace Smelting
The Hoboken smelter is charged by means of buckets contain-
ing 1.5 tonnes of material. The smelter has a throughput of
1100 to 1200 tonnes of lead-copper concentrates per day. Typical
ranges of charge materials are;
Sinter 1 5 - 6 0 $
Return Converter Slag 15 - 20$
Lead Drosses 1 0 - 1 5 $
Various Scrap 5 - 10%
Return Smelter Slag 8 - 10%
Low Grade Matte 2 - 5%
The coke consumption varies from 10 to 14% of the total charge.
Four phases are generally produced, these are:-
1) Slag
2) Matte 5 - 15% of charge
5) Speiss 5 - 10% of charge
4) lead Bullion 15 - 25% of charge.
Zinc is collected from the fume and can be processed separately.
Although computer programmes may be produced to optimise the
distribution and recovery of the elements in the charge, much of
the information is empirical and there are many areas associated
with smelting for which there are few thermodynamic data avail-
able. As would be expected, varying the charge alters the
relative amounts of the phases which are produced, the compo-
sitions of which are related to one another by various equil-
ibrium relationships.
The Slag
The slag concentrates the elements with the highest affinity

5
for oxygen. Its main components are SiO^, CaO, AI^O^, ZnO and
FeO. Typically seventy per cent of the iron charged is
tapped as slag, the lead content of which is one or two per
cent. Tin and cobalt tend to be divided between the slag and
the reduced phases. Elements with a lower affinity for
oxygen such as copper and lead are concentrated mainly in the
reduced phases.
The Matte
The matte or sulphide rich phase consists of four main
constituents Cu^S, PbS, FeS and ZnS. The composition of the
matte is determined by the way in which the sulphur combines
with the metals, thus depending upon the stability of the
sulphides and the activities of the metals and of sulphur in
the molten phases. In complex metallurgy the matte usually
comes to equilibrium with the bullion phase. The bullion is
really a solution of speiss and lead bullion at this stage,
but their separation will not occur until the temperature
falls to around 1050°C. This will happen after the products
have left the blast furnace, tapping usually taking place at
about 1125°C.
The mattes which are produced may be represented on a
CUgS, PbS, (Fe+Zn)S ternary diagram (Fig 1). Regions are
indicated representing the predominant compositions for
various types of smelting. In the centre of the diagram
are mattes produced in the smelting of lead, with the lead
content of the slag being one or two per cent. At the
extreme left is the region of cure lead smelting, such as

6
FeS *ZnS
C u
charges
Mattes produced by smelting complex sulphides (weight %)
Figure 1

7
the primary smelling of galena concentrates with a very low
copper content. The activity of copper gradually increases
across the diagram as the amount of copper charged increases,
until the composition of black copper is reached with only
small amounts of lead present. Towards the top of the diagram
are the mattes produced with strongly reducing smelting, with
slags containing less than 0*8 per cent lead. At the bottom
of the diagram are mattes which result from the re-melting of
drosses produced during the liquation and sulphur drossing of
lead. No reduction is applied during this process, so when a
slag is produced it has a high lead content.
The Speiss
In complex metallurgy the speiss covers a large range of
compositions. It is generally an arsenide rich phase, but
most of the bismuth, antimony, and tin will be found here too.
Charges in complex metallurgy are typified by a copper content
of between 10 and 30?. in the lead, for a copper rich phase
to form its activity would have to approach unity. If there
are sufficient impurities present, the copper may combine
with the metalloids to produce an alloy where it would be
diluted to such an extent that its activity could be lowered
to 0*1 to 0«% This constitutes the primary mechanism by
which speiss is formed. This same mechanism is applicable
to iron. If the reduction is severe the iron activity may
rise to 0»2 and in these cases the iron may alloy to produce
a phase in which its activity is in the range 0*1 to 0*2.
In the Imperial Smelting Process where the iron activity

8
may rise to 0*5, this tendency to produce a ferrous speiss
is even more pronounced and this phase will have a strongly
metallic nature.
If nickel or cobalt are present in the charge, they
too will tend to enter the speiss. One of the main charac-
teristics of these products is that they are generally
insoluble in the liquid state in mattes and lead bullion.
The speisses, however, can be contaminated with both
metallic lead and matte and may contain up to 25 per
cent of each.
An area of great interest is the distribution of the i
impurities As, Sb and Sn among the phases produced. The
speiss will separate from the bullion to a greater extent
as the temperature falls until 600°C which is the typical
temperature for the solidification of speiss.
The Dust
The liquid phases which separate after tapping from the
metal pool may approach equilibrium, owing to their intimate
contact. Gaseous products are not generally in equilibrium
with the charge, so it is usually difficult to predict these.
The main components of the dust are elements which are vapour-
ised in the hot region of the shaft and escape in suspension
with the exhaust gases. Three main components are zinc, lead
and lead sulphide.
1.1.1 The Imperial Smelting Furnace
The Imperial Smelting Process was developed initially

9
as a zinc smelting process, this was soon adapted to combined lead-zinc smelting, particularly as the two tend to occur together in ores. In 1959 experiments were started on the use of copper-bearing sinter and, after successful trials were carried out on the experimental blast furnace, several campaigns were run on various Imperial Smelting Furnaces (7, 9). The trials covered a wide range of compositions and data were collected for cooper lead ratios up to 0*2 by weight. The operators noted that the only removal of arsenic from the system was in the speiss phase, however because of the low arsenic content, very little speiss was produced. Most interest was centered upon the recovery of, and the effect of the presence of, copper. It was observed that the presence of copper reduced the rate of sulphide accretion and also reduced the rate of volatilisation of arsenic which had previously been carried to the zinc condenser. The copper ultimately formed a speiss and matte and these produced a dross as the lead bullion was cooled. This was a result of the difference in composition between the bullions produced by lead refiners and those from the high copper trials. Most lead smelters yield bullion which contains sufficient arsenic and sulphur to combine with all of the copper. Normal copper Crossing techniques were applied. As was noted earlier the volatalisation of arsenic was reduced by the addition of copper and it was thought that the vapour pressure of arsenic was related to its pressure over a lead-copper-arsenic alloy.

1.2 Vapour Pressure Of Arsenic
The vapour pressure of arsenic has been investigated by several techniques. It has been known for a long time that arsenic sublimes at ambient pressure 'and the invest-igations may be divided into two categories. Firstly, experiments to discover the vapour pressure and molecular composition of the gas produced when the solid evaporates, and secondly, investigations into the high pressure equilibrium between liquid and vapour and the determination of the triple point. Techniques for vapour pressure measurements have included quartz spiral manometers, Knudsen Cell(with mass-spectrometer), weight change methods and high pressure Bourdon Guag.es.
Apparatus for Vapour Pressure Measurement The earliest work of any significance was carried out
with a silica spiral manometer. The main component of the apparatus is a hollow silica spiral which is connected to a supply of the vapour being studied. As the pressure increases the tendency is for the spiral to unwind. As only a small strain can be tolerated, the spiral is surrounded by a second silica vessel in which the pressure may be varied and measured. As the pressure in the outer vessel is increased the spiral will tend to return to its original position. In this way the apparatus can be used as a null-point detector. To increase the sensitivity of the apparatus a mirror may be fixed to the quartz spiral so that the mirror rotates around its axis and by directing a light beam on to the mirror the null-noint m3y be more precisely fjund.
11
A similar apparatus is the silica spoon guage manometer, this is based on the same principle but the spiral is replaced by a hollow, dished, silica spoon, from the end of which a fibre is drawn to act as a pointer. This may be used as a null-point detector in the same way as the silica spiral.
The Knudsen Cell is an evaporation cell which is operated in a vacuum. A small hollow inert cell is constructed and into this the material to be evaporated is placed. The lid is then fixed onto the cell, the only exit from the cell is then a minute orifice made in the side of the cell. The cell is then inserted into the evacuated apparatus and heated. The material starts to evaporate. The exit of the vapour from the cell is controlled by the orifice. For correct operation the vapour in the cell should be at equilibrium, so the rate of effusion from the cell should be the same as the rate of evaporation from the sample. Originally the cells were made to direct the vapour onto a cold surface where the vapour was conden-sed and deposited. The deposit was then weighed and chemic-ally analysed and the weight loss from the cell measured. From this data the vapour pressure of the sample could be calculated.
More recently the Knudsen Cell has been used with a mass-spectrometer such that the molecular species could be determined directly.
In order to find out rnore about the evaporation mechanism, single crystals were suspended in vacuo and the vapour analysed in a mass-spectrometer.

Investigations, into the triple-point of arsenic and,the
liquid-vapour equilibrium have been .carried out with high
pressure Bourdon Gauges
1.2.1 Determinations of the Vapour Pressure of Arsenic
The earli.est results of any significance were produced
by Preuner and Brockmuller(lO). A quartz spiral manometer .
was used to study the equilibrium of A s ^ , As2(g) ^ ^ A84(g)
which were believed to be the only vapour species. The
proportions of the various molecular species were changed by
heating the quartz spiral guage and keeping it at a different
temperature from the vapour source. They were thus able to
study the dissociation of As^ at higher temperatures. It
was shown that arsenic evaporates predominantly as As^
molecules at temperatures up to 800°C. The equilibria which
were considered were; 2
K S 2
AS4(g) = 2A82(g) > K1 = P As,
P A S „ 4
and As 2 ( g ) = 2As ( g ) ; = p 2A s
PAS2
Their reported values were K^ = 22• 5 and = 3*15 at
: (1000°C) which indicates
dissociated to a large extent.
1273K (1000°C) which indicates that the As^ molecules had
Horiba (11) carried out the nert investigation again with

a silica spiral manometer but this time with the aim of deter-mining the triple point of arsenic. A heavier gauge of quartz was used because of the high pressures involved. The arsenic used in this study was re-sublimed to increase the purity. The results which were published seemed quite acceptable with a clear discontinuity in the pressure at 822°G and at a total pressure of 36*5 atmospheres. It was also noted that the system took some time to reach its equilibrium vapour pressure.
Brewer and Kane (12) used a Knudsen cell to investigate the evaporation of arsenic. They also noted that the arsenic evaporated relatively slowly and accounted for this by refer-ence to the crystal lattice of arsenic which, they argued, had relatively few sites to provide As^ molecules. This means that for a Knudsen cell to operate under equilibrium conditions the cell orifice should be smaller than the equilibrium vapour pressure would suggest. To increase the rate of evaporation the arsenic was dissolved in thallium which catalyses the evaporation of arsenic. This gave a thirty-fold increase in the observed vapour pressure seen outside the cell. The effusate was shown to be predominantly arsenic by mass-spec trometry.
Goldfinger and Jeunehomme (13) carried out a mass-, spec-trometry study of InAs and identified all of the ionic
+ + species from As to As^ inclusive. They believed that the species evaporating into the vapour were predominantly As^ and
+ + As0 whereas the As, and As. were thought to be due to frag-mentation of the parent molecules by electron impact. A value

for the free energy of dissociation of As^^, to 2 As^gj
was calculated to be 67*3 kcal/mol. at 298 K.
Nesmeyanov (14) reviewed the available data on arsenic and also carried out some experimental determinations of the equilibrium vapour pressure over solid arsenic. The Knudsen effusion technique was used over the range 117 to 300°C. An elaborate preparation technique was used in which As O
76 was irradiated to produce the isotope As, the oxide was then hydrogen reduced. At the end of the experiment the condensate was dissolved and the arsenic precipitated as magnesium ammonium arsenate. The radioactivity of this was then measured against standards produced by the same technique. This investigation yielded rather lower vapour pressures than expected, due again to non-equilibrium conditions within the cell, because of the relatively slow evaporation rate of arsenic.
Arthur (15) carried out a mass-spectrometric study of + + + + GaAs and found As and As^ as well as As and As the latter two being supposed to be fragments caused by the isolation process, as they were always a constant multiple of the parent molecule intensity. In the course of each experiment he noted a gradual build-up of arsenic vapour within the chamber of the mass-spectrometer. To minimise this he inserted a massive cooled copper shutter between the Knudsen cell and the mass-spectometer. The immediate effect of this was to raise the As : As ratio from around unity to one hundred and fifty at 1100 K (1373°C). He argued that

other experiments were incorrect as they allowed As molecules to recombine to As^ as the vapour cooled whilst in and approa-ching the ionisation chamber.
Herrick and Feber (16) carried out an investigation into the evaporation of arsenic by free evaporation and effusion of high purity arsenic. The main impurity in the arsenic with which they were supplied was oxygen, so their purification was aimed at reducing this substantially. The arsenic powder was deoxidised with zirconium and the arsenic was distilled from the products, it was then repeatedly sublimed and distilled in order to minimise the other impurities. Some larger grained arsenic was also used and this was a higher purity than the powder. The free evaporation experiments were less informative than the effusion technique. A variety of torsion effusion cells were used with different orifice sizes, and the results were given in the form of standard thermodynamic functions in the range 298 to 1090 K for solid arsenic, and in the range 298 to 1300 K for As^ vapour.
Hudson (17) worked on electron impact on the molecules in arsenic and antimony vapour. The experiments were carried out on a Knudsen cell, mass-spectrometer combination, however it was modified in order that the energy of the impinging electr-rons could be closely controlled. By this means the dissoc-iation energies for the various molecular species were found by measuring the exact point of the discontinuity in the ionisation efficiency curves. Only small amounts of oxide were observed and these were quickly removed from the system.

In order to minimise the build-up of arsenic vapour within the apparatus, two steps were taken;
1) A pump was located directly opposite to the flow of vapour from the cell.
2) A cold trap was held at liquid nitrogen temperature in order to condense the vapour. Data was produced for the dissociation energies for various reactions and also the equilibrium vapour pressure of each of the molecular species. This technique was not subject to the problem of recombination of the molecules which Arthur had considered to be a major deficiency in other studies with Knudsen cells.
High temperature data, above the sublimation point, is important because it will be used for determination of standard states in later experimental work. Experiments were carried out by Baker (18) who determined the triple point of arsenic and also the equilibrium vapour pressure over liquid arsenic at temperatures in excess of 816°C. The experiments were carried out in a high pressure apparatus, with the pressure being measured at temperatures from 816 to 1050°C. When values of lg P (atm.) are plotted against (1/T) K the results give a very good straight line in the region 816 to 1050°C for the liquid-vapour equilibrium. A best linear fit for the data is represented by;
lg1Q P (atm.) = - 2405/T + 3-759 This meant that liquid arsenic could be used as the standard state for these studies of activity, whereas earlier studies

had used extrapolated solid-vapour equilibrium data and a
hypothetical standard state.
Rau (19) also measured the vapour pressure above
arsenic. A study was made of the saturated vapour pressure
over liquid arsenic, and also gas density measurements
were made by measuring the pressure exerted by a known
amount of arsenic in a predetermined volume. The van der
Waals constants for As^^j and As^^j were calculated.
Baker and Rau are in general agreement about the
saturated vapour pressure in the region of the triple point,
however as the temperature increases the pressure measured
by Rau tends to be lower than that measured by Baker. The
data of Baker is preferred because of the better linear fit
of the data in the form log1QP against (1/T) K (Fig 2). It
is possible to obtain a curve similar to that found by Rau,
particularly where a complex vapour is formed, the decrease
in pressure being explained by the tendency for the vapour
to form larger molecules as the temperature increases.
However in this study it will be shown that 99*7% of the
pressure is due to As^ molecules at 1100°C, so the devia-
tion from linearity can not be explained by this phenomenon.
A complete survey of the vapour pressure data for
arsenic was carried out by Hultgren et al (20) and since
no data was produced subsequently, this was used for the
analysis of the vapour. Hultgren selected the best data for
the reaction As, i As., N in the form of AGm for temper-(s) 4 4(g) I atures from 300 to 1200 K. This data was used to produce

f Log P/atm
Baker N \
1/T x 10 K
7-0 8-0 90 Figure 2 The vapour pressure above liquid arsenic after Rau and Baker

a least squares fit, so that continuous function of temper-ature was found. The data from which the relative amounts of each molecular species were calculated was also based on the assessment of Hultgren et al. which agreed very closely with the dissociation energies which were found by Hudson in his investigation.
The vapour pressures of other elements which were used in the research were not as critical as that of arsenic. The data was taken from Hultgren et al (20), the vapour pressure data for lead and copper is given in table 1 •

20
Lead
Copper
Tenroerature Temperature Vapour Pressure /K A /atm 500 227 2*2 x 10"15
6 0 0 • 6 3 2 7 - 6 5 - 3 X 1 0 " 1 2
700 427 1-11 x 10"9
800 527 6-08 x 10~8
900 627 1-35 x 10~6
1000 727 1-61 x 10"5
1100 927 6-36 x 10~4
1300 1027 2* 60 x 10~5
1000 727 1-7 x 10"11
1100 827 6-4 x 10~10
1200 927 1-3 x 10"8
1300 1027 1-68 x 10~7
1400 1127 1-43 x 10"6
1300 1227 8-60 x 10~6
Vapour Pressure of Lead and Copper Table 1

1.3 The Copper-Arsenic System
The phase diagram for copper-arsenic has been estab-
lished by a number of workers with only small discrepancies
between investigations (21, 22, 23). The phase diagram used
for reference in this investigation was itself a compilation
based on these (24) (Fig 3). Pure copper melts at 1083°C
and addition of arsenic lowers the liquidus steeply to a
eutectic at = 0-816 and 958 K. The liquidus rises to a
maximum at the composition Cu_As at 1100 K, at higher arsenic
contents the liquidus again falls. The high arsenic region
of the diagram is incomplete because arsenic exerts high
vapour pressures above these melts which makes them diffi-
cult to study.
1.3.1 Activity Determinations
The activity of arsenic in liquid copper has been
investigated by two techniques; the transpiration technique
and measurement of E.M.F. in a differential concentration
cell. Jones and Philipp (25) working with copper droplets
at 1100°C, equilibrated them with arsenic vapour in an
inert gas steam. The arsenic -vapour was produced by passing
the argon carrier gas over solid arsenic which was held at
a temperature between 270° and 390°. In order to demonstrate
that equilibrium was achieved, alloys were made from copper
and arsenic such that the droplets contained both more and
less than the final amounts of arsenic. It was shown that
these alloys reached the same composition on rising and
falling arsenic contents. Fxperiments were carried out

ARSENIC-COPPER SYSTEM
Figure 3

over a range from five to seventy hours. The analysis of the
samples was carried out by weight change and by chemical
analysis. As the two techniques agreed, within experimental
error, the former was adopted as standard. The activity of
arsenic was given as = 'but total pressure was
used instead of monotomic parial pressures. They noted that
the arsenic evaporated as As^ and that it would dissociate
at 1100°C, but to an unknown extent. (Figure 4)
Azakami and Yazawa (26) used an electrochemical method
to measure the E.M.F. of a concentration cell,
C u ^ = Cu (in alloy).
The alloys were made with a mole fraction of arsenic up to
0»305. A NaCl - KC1 salt bridge containing CuCl2 was used
to minimise the junction potentials. The E.M.F. measure-
ments of the cell yielded the activity of the copper in
the alloy and hence values for V^ . In order to calculate
the activity of the arsenic it was necessary to integrate
by means of the Gibbs-Duhem equation. The values for ^
were only obtained over a small range of compositions, so
it was not possible to integrate directly without suppl-
ementary data. The activity of arsenic had to be found
at some composition by another technique. They selected the
transpiration technique at 1000°C and produced a Cu-As alloy
with N, = 0 2 7 by eouilibration of copper with a stream of A S
argon which had passed over heated solid arsenic.
By consideration of the equilibrium for the dissociation
of A s w % to As,./ \ t.h v were able to calculate a value of 4 ( G ) 2 1 ER ;

24
Original data from Jones and Philipp
- 4 ' 0 - R
-50
-60
-7-0
-80
10 9 *As
1 0 0-9 0-8 0-7 0-6 0-5
N Cu
The activity coefficient of arsenic in copper at 1373 K
Figure 4

25
P. at 1000 °C. As. 4 In transpiration experiments, the vapour pressure of
component i, P^ is determined by,
P. = n. x P L _ I n. + n
I G where P is the total pressure, and n. and n are the number l g
of moles of compound i and the carrier gas respectively. Now
re-nalculating as if the vapour were composed of oniy the
monomer, m, of the evaporating element, P = PA + 2Pa + 4Pa x P m As As0 As. 2 4
PA + 2P. + 4 P. + P As As2 As^ g
They then considered the equilibrium between the various
vapour species ;
2 As As_ , K1 = P, / P2 g 2 g' ASg As
4 As As. ,K2 = P. / pf + g 4 g As^ As so tnat,
P = P, +2 CK1.P 2 + 4.K2.pf x P ^ m As As As
P. +2.K1.P2 + 4.K2.P, + P As As As g
As P = P. + PA + P. + P. + P As As0 As, As. g 2 3 4
Rearranging (1) leads to,
(4.P - L P ).K2.P, + (2.P - P ).K1.P2 - P.P., - P.P = 0 m As PI AS As m
so bv substituting the value of p- found exoerimentaily the M
values of P , P, , and PA were calculated. In the original As A s ' As. 2 4 report of the work ar: error was made in these calculations
which .led to -n undulv low value for a. . The results are shown As on flvnire' 5.

8 \-
6 -
4 -
0 10 0-8 06
N 2 Cu
Activity coefficient of arsenic in copper as determined by
Azakami and Yaza.va, Figure 5

27
The only other investigation was carried out by Bode,
Pawlek, and Gerlach (27) . They used an apparatus in which
an inert gas was passed over a copper - arsenic alloy. The
amount of arsenic removed from the alloy was measured by
weight change. The vapour pressures of arsenic which they
reported were very low, so that the total vapour pressure of
arsenic over the alloy was of the same order of magnitude as
the vapour pressure of copper. This makes it difficult to
attribute the weight change to the evaporation of arsenic only.
The reported values for the activity coefficient of arsenic
relative to a solid arsenic standard state had ranged from -7 -Z
5 "x 10 to 1.45 x 10 which are extremely low and divergent
values. Recent analysis of these investigations has indicated
that higher values for should have been obtained. Lynch
(28) used data which was not available to Jones and Philipp,
and also identified the numerical error in the vapour composi-
tion calculation carried out by Aza.ka.mi and Yazawa. As noted earlier Jones and Philipp determined the activity
of arsenic in copper by transpiration-with the activity of
arsenic being given by a, = P. / . Lynch was able to ° As As As
calculate the relative abur.dancies of the various vapour-
components, and was hence a.nle to recalculate the arsenic
activity as ;
= P, / P? = (pA / pA ^ = (pA / p? and As As As As» A s ' As, As, 2 2 y i
siirp la.r'Lv for As.. The value of P° was used for the standard 4 A S 4
state as this is the nredominant species when arsenic evaporates
and there was least uncertainty about the amount of As^
present at 1100 °C. In the recalculation a hypothetical
solid arsenic standard state was used as the author was
unaware of the data of Baker(18) and Rau(l9) who had both
measured the total pressure of the vapour above solid and
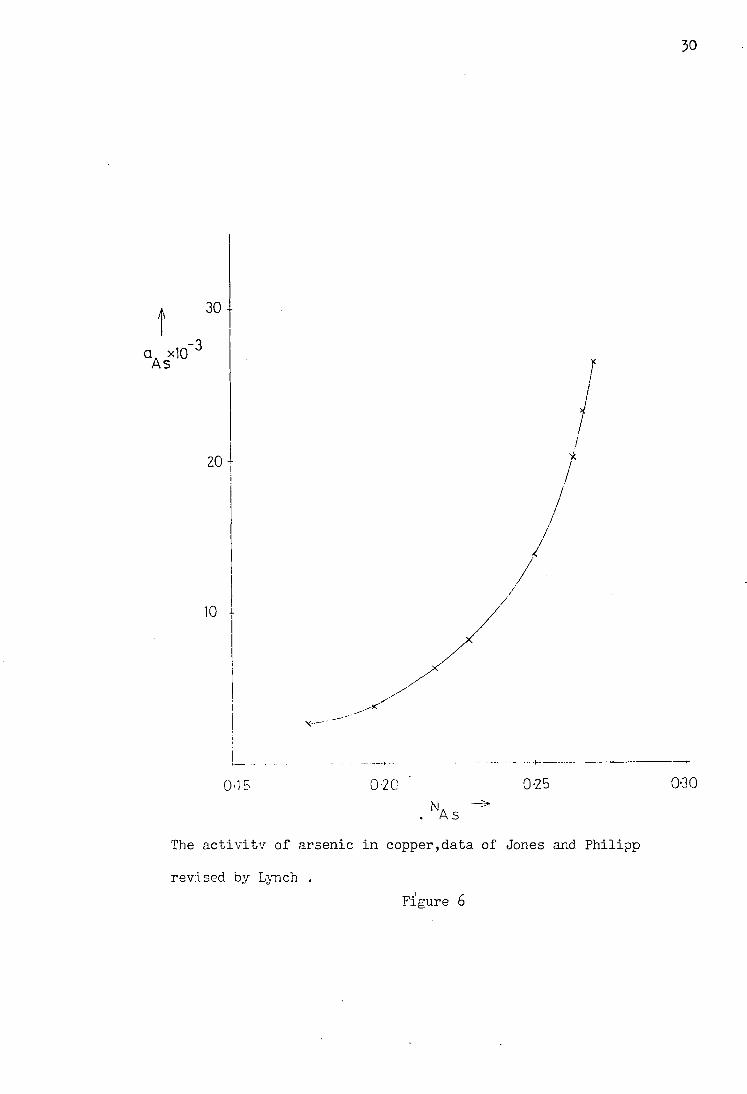
liquid arsenic. The revised results are given in table 2 and
figure 6.
The data of Azakami and Yazawa was also re-assessed by
Lynch, again using a solid arsenic standard state. This
revision gave the measured point at 0*27 as 2 o a. = x 10- and {iL = 0*1976, and hence a value for VA as as as
of around 3*6 at 1273 K.

29
T/K Na As ^As. 4 aAs to
543 0-174 6-01 X 10-8 2-64 X 10" -3 1-52 X 10-2
553 0-197 2-39 X 10-7 3-73 X 10" -3 1-89 X ID"2
573 0-217 2-01 X 10-6 6-35 X 10' -3 2-93 X 10-2
584 0-228 5.4O X 10-6 8-13 X 10" -3 3-57 X 10 "
609 0-250 4-36 X 10"? 1-37 X 10" -2 5-48 X 10-2
634 0-265 2-02 X 10~4 2-01 X 10" -2 7-64 X 10-2
644 ^•267 3-58 X 10"4 2-32 X 10" -2 8-69 X 10-2
654 0-270 6-01 X 10"4 2-64 X 10" -2 9-78 X -2
10
Data for Cu-As by Jones and Philipp at 110Q°C
Revised by Lynch (solid arsenic standard state)
Table 2
50
A 30 I
aA xlO As -3
20 t
1 0 + /
0 - 1 5 0-20 0-25
. N A S ^
0-30
The activity of arsenic in copper,data of Jones and Philipp
revised by Lynch . Figure 6

1.4 The Lead Arsenic System
The lead arsenic system is one of the constituent binary
systems which make up the lead copper arsenic ternary system,
which was studied after the copper arsenic system. The data on
the Pb-As system were taken from Hansen (29), the system is a
simple eutectic, with the eutectic point at 288 °C and at an
arsenic mole fraction of 0*074 ,(figure 7). The high arsenic
end of the phase diagram is not complete because of the high
vapour pressure of arsenic. The activity data for this system
are taken from the work of Predel and Fmam (30) the data are
reproduced in figure 8. In the range of most interest, the
region from to 0*1, a slight deviation from raoultian
behaviour is observed. An arsenic activity of 0*1 corresponds
to a mole fraction of 0*1 at 640 °C. The activities were
determined by equilibrating lead- arsenic alloys with bismuth-
arsenic alloys at the same temperature.

32
N — As
The lead arsenic phase diagram
Figure 7

The activity of arsenic in lead at 64O °C
Figure 8

54
1.5 The Lead - Copper - Arsenic System
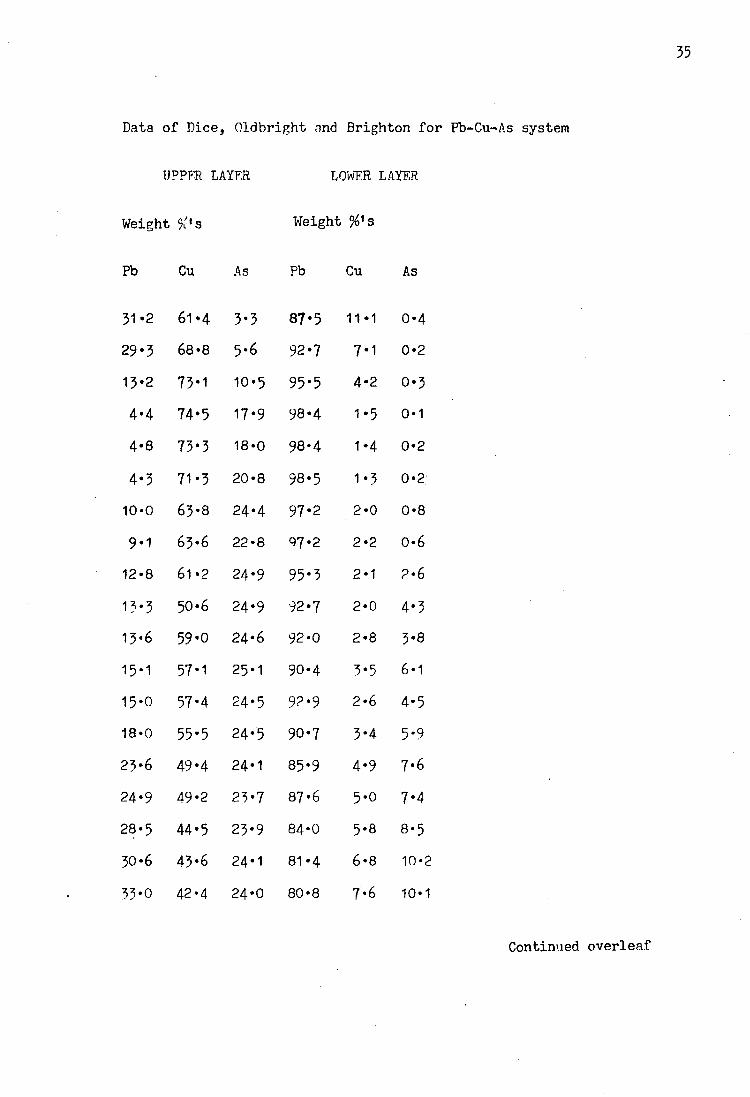
The first extensive survey of the Pb - Cu - As phase diagram
was carried out by Dice, Oldbright and Brighton (31) who were
investigating drossing techniques in lead smelters. Experiments
were carried out on a total of twenty nine alloys, ten of which
were outside the miscibility gap, which extends from the lead -
copper binary towards the arsenic - rich region. The alloys
were heated and melted to produce a single phase, they were
then slowly cooled. Observations were made as the alloys were
cooled, and the temperatures noted at which the various phases
appeared and also when the solidification of the alloy was
completed. The final compositions of the alloys were found by
chemical analysis, the results are given in table 3* In order
to compare all investigations on the same basis, the compo-
sitions have been converted to mole fractions. The position of
the miscibility gap in weight per cent and the misc-
ibility gap in terms of mole fraction are shown in the figures
8 and 9 respectively.
Kleinheisterkamp (32) investigated the formation of speiss
phases including the Pb - Cu - As system, however his results
were not tabulated; the position of the miscibility gap was
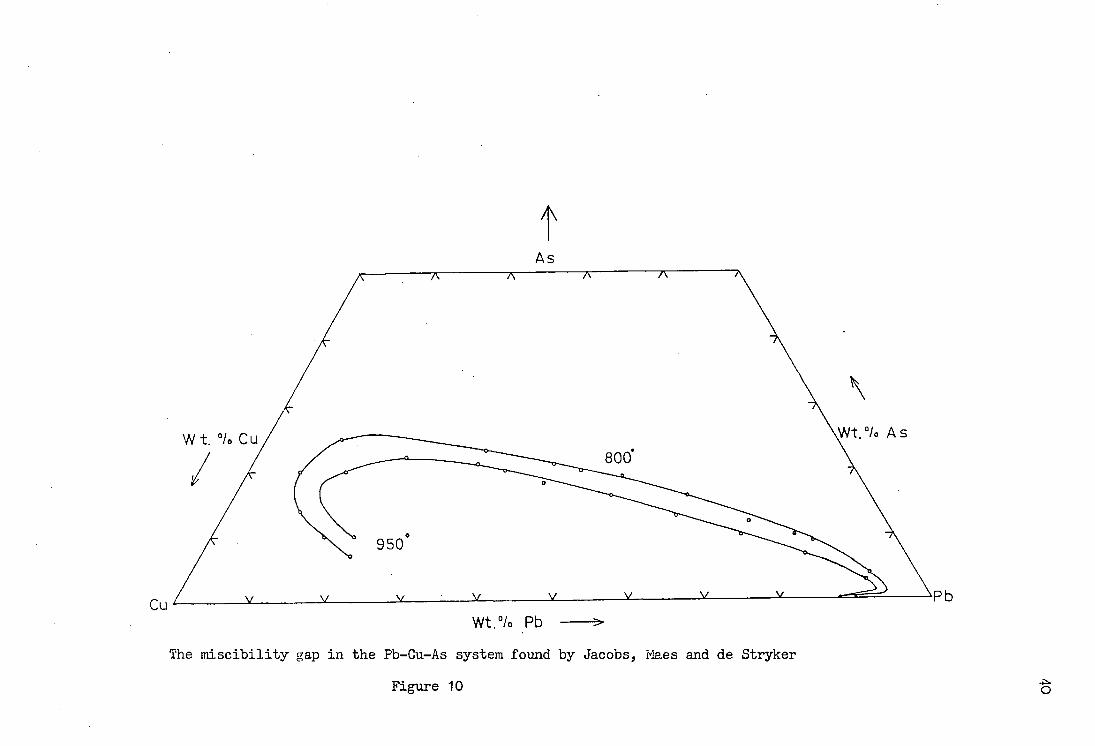
represented on a ternary phase diagram. Jacobs, Maes and de
Stryker (35) studied the Pb - Cu - As system and also the Fe -
Pb - Cu - As system so that the effect of iron on the system
could be determined. Alloys of known starting composition
were melted and homogenised in a crucible covered by molten
salts to protect the melt from oxidation. A silica tube with
35
Data of Dice, Oldbright and Brighton for Fb-Cu-As system
UPPFR LAYER LOWER LAYER
Weight Weight s
Pb Cu As Pb Cu As
31-2 61*4 3*3 87*5 11 1 0*4 29-3 68*8 5*6 92*7 7 1 0*2 13*2 73-1 10*5 95*5 4 2 0*3 4-4 74*5 17*9 98«4 1 5 0-1 4*8 73*3 18*0 98-4 1 4 0-2 4*3 71*3 20*8 98-5 1 3 0-2 10*0 63*8 24*4 97*2 2 0 0*8 9*1 63*6 22*8 07*2 2 2 0*6 12-8 61 *2 24*9 95*3 2 1 2*6 13*3 50-6 24*9 92*7 2 0 4*3 13*6 59*0 24*6 92*0 2 8 3*8 15*1 57*1 25-1 90-4 3 5 6*1 15*0 57*4 24*5 92*9 2 6 4*5 18-0 55*5 24*5 90-7 3 4 5*9 23*6 49*4 24*1 85*9 4 9 7*6 24-9 49-2 23*7 87*6 5 0 7*4 28*5 44-5 23*9 84*0 5 8 8*5 30-6 43*6 24*1 81*4 6 8 10*2 33*0 42-4 24*0 80*8 7 6 10-1
Contimied overleaf

56
Data of Dice, Oldbright m d Brighton for Pb-Cu-As system
UPPER LAYER LOWER LAYER
Mole fractions Mole fractions
Pb Cu As Pb Cu As
0 130 0*832 3*8 x 10~2 0*701 2 90 8 9 X 10"5
0 108 0*835 5*8 x 10~2 0*796 0 199 4 8 x ID"5
4 7 x 10⁻² 0*850 0*103 0*868 0 125 7 5 x 10⁻⁵
1 5 x 10"2 0*819 0*167 0*950 4 7 x 10⁻² 2 7 x 10"5
1 6 x 10"2 0*814 0*169 0*951 4 4 x 10⁻² 5 3 x 10~5
1 5 x 10⁻² 0*790 0*195 0*954 4 1 X 10⁻² 5 4 x -3 10 J
5 5 x 10⁻² 0*729 0*236 0*918 6 2 x 10⁻² 2 1 X 10⁻²
5 5 x 10⁻² 0*742 0*225 0*917 6 8 x 10⁻² 1 6 x 10⁻²
4 6 x 10"2 0*710 0*245 0*872 6 3 x 10"2 6 6 x 10⁻²
4 8 x -2 10 0*703 0*249 0*810 8 6 x 10⁻² 0 104 5 0 x 1 0 - 2 0*702 0*248 0*824 8 2 x 10⁻² 9 4 x 10⁻²
5 6 x 10"2 0*688 0*256 0*762 9 6 x 10⁻² 0 142 5 6 x 10⁻² 0*694 0*251 0*816 7 5 x 10⁻² 0 109 6 8 x 10"2 0*679 0*254 0*768 9 4 x 10⁻² 0 138 9 4 x 10⁻² 0*641 0*265 0*699 n 130 0 171 9 9 x -2
10 0*640 0*261 0*704 0 131 0 165
0 119 0*606 0*276 0*664 0 150 0 186 0 128 0*594 0*278 0*618 0 168 0 214 0 139 0*582 0*279 0*605 0 186 0 209
Chemical Analyses of Alloys within the Miscibility Gap
Table 3

37

Mi scibiiity Gap in
A " / / \ Cu
N Pb
Data from Dice, Oldbright and Brighton converted to mole fractions
F i g u r e 1934
Pb
CO

a nozzle was inserted into the melt such that half of the melt
was above the nozzle. The other end of the silica tube was
connected, by means of a T-junction to a rubber bulb, the other
junction being connected to a water-filled manometer. The alloy
was then cooled. As the alloy reached the boundary of the misc-
ibility gap it separated into two layers, one lead-rich and one
copper-rich. This separation caused the density of the melt
above the nozzle to decrease and so the pressure required to
produce a bubble from the nozzle also decreased. By plotting
pressure against temperature^ the temperature at which the alloy
formed two layers was found.
Experiments were carried out on three composition lines
across the Pb - Cu - As ternary these were, Pb - (Cu + 20% As),
Pb - (Cu + 14% As) and Pb - (Cu + 26% As). The two layers
which were formed in each case were also chemically analysed.
From this data they were able to locate the miscibility gap
in the range from 800°C to 1065°C at which temperature it
is closed up completely. The data for 800°C and 950°C together
with a conversion to mole fractions are given in tables 4 and 5,
the position of the miscibility gap is given in terms of weight
per cent and mole fraction in figures 10 and 11 respectively.
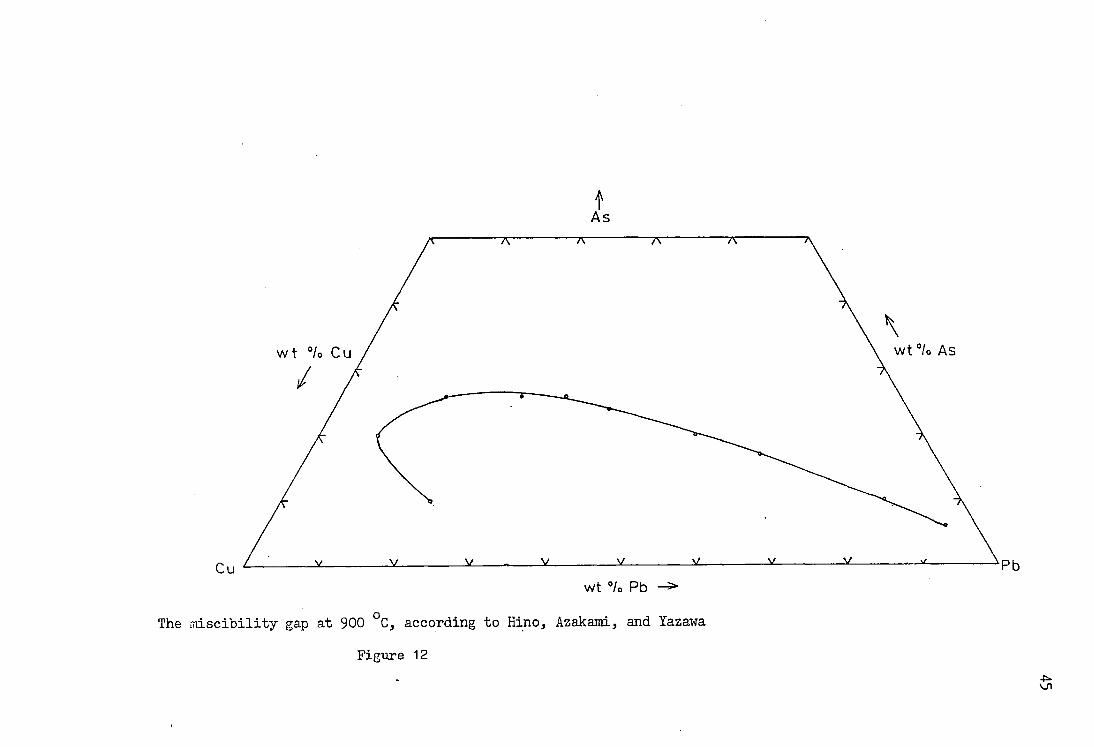
Tn complex smelting the silver tends to separate between the
lead bullion and the speiss phases. Hino, Azakami and Yazawa
(34) studied the effect of silver on the Pb - Cu - As and the
Fe - Pb - As systems, and its distribution between the two
phases which were produced within the miscibility gap. Up to
three weight per cent silver was added to the bullion, and
the two phases were analysed after they had come to
As
The miscibility gap in the Pb-Cu-As system found by Jacobs, Maes and de Stryker
F i g u r e 10

4 \
The ternary miscibility gap as measured by Jacobs, Maes and de Stryker; in mole fractions
Figu re 11

Pb - Cu - As Misclbility Gap at 800L'C
Weight per cent
Pb Cu As
35 65 0
15 75 10
77 13 10
7 73 20
44 36 20
88 12 0
10 76 14
10 65 25
20 73 7
30 47 23
40 39 21
50 31 19
60 24 16
80 11 9
70 18 12
90 6 4
Table 4 •
Mole F r a c t i o n
Pb Cu As
0-142 0-858 0
0-052 0-852 0-096
0-524 0-288 0-188
0-023 0-793 0-184
0-205 0-542 0-255
0-692 0-508 0
0-034 0-856 0-150
0-054 0-728 0-257
0-072 0-858 0-070
0-121 0«621 0-258
0-178 O.565 0-258
0-245 0-497 0-258
0-529 0-429 0-242
0 • 568 0-255 0-177
0-452 0-565 0-205
0-746 0-162 0-092

Pb - Cu - As Miscibility Gap at 950°C
Weight per cent
Pb Cu As
35 65 0
19 71 10
70 20 10
13 67 20
34 46 20
88 12 0
20 58 22
30 49 21
40 42 18
50 34 16
60 27 13
80 13 7
90 7 3
Mole F r a c t i o n
Pb Cu As
0-142 0-858 0
0-068 0-832 0-099
0-423 0-401 0- 170
0-045 0-762 0- 193
0-142 0-627 0-231
0-692 0-308 0
0-074 0-701 0-225
0-121. 0-645 0-2^4
0-176 0-604 0- 219
0-244 0-541 0-216
0-326 0-479 0- 195
0-564 0-299 0- 137
0-743 0-189 0-068
Table 5

equilibrium. It was found that K. (wt.% Ag: wt.% Ag in bullion)
was 1•16 at 900°C* The presence of silver did not alter the
position of the Pb - Cu - As miscibility gap. The reported
position of the Pb - Cu - As miscibility gap differed from
other investigations. The results of the determination of
the position of the miscibility gap at 900°C without silver
are given in table 6, together with conversions to mole
fractions. The position of the miscibility gap is shown at
900°C for both weight per cent and mole fractions in figures
12 and 13 respectively.
f As
The rriiscibility gap at 900 °C, according to Hino, Azakami, and Yazawa
Figure 12
VN

t As
The rniscibility gap at 9 0 0 ° c according to Hino, Azakarni and Yazawa,
in terms of mole fraction
Figu re 13

Pb - Cu - As Miscibility Gap at ?00°C
Weight per cent
Pb Cu As
50 30 20
80 10 10
60 23 17
36 40 24
24 50 26
14 60 26
20 70 10
8 72 20
90 4 6
35 65 0
88 12 0
30 44 26
Mole F r a c t i o n
Pb Cu As
0-246 0-482 0-272
0-574 0-187 0-238
0-350 0-412 0-258
o-i6o 0-565 0-275
0-093 0-630 0-278
0-497 0-695 0-255
0-072 0-827 0-100
0-027 0-788 0-185
0-752 0-109 0-139
0-142 0-858 0
0-692 0-308 0
0-122 0-585 0-293
Table 6

CHAPTER 2
EXPERIMENTAL WORK

2.1 Activity and Vapour Pressure Measurement Techniques
Due to the very close relationship between activity and
vapour pressure of components, several techniques have been
developed to measure the vapour pressures of alloys at elevated
temperatures as a means of determining activities. Techniques
for activity determination by equilibration of condensed phases
and electromotive force measurement have also been used. The
principal activity and vapour pressure techniques will be
outlined (35,36,37).
The dewpoint method is used to measure the vapour pressure
of a volatile component of an alloy. The alloy is treated
inside an evacuated tube. When the tube is at the required
uniform temperature, the remote end of the tube is cooled,
whilst the alloy is held at a constant temperature. At some
temperature the vapour will start to condense, so the vapour
pressure of the pure component at the lower temperature is
equal to the vapour pressure over the alloy. This technique
can only be used when the vapour pressure of one component is
very different from that of the other.
The boiling point method is.based on the principle that a
liquid boils when its vapour pressure is equal to the external
pressure. Fxperimentally the pressure may be kept constant
and the temperature varied or vice versa. The boiling point
is marked by a well defined arrest temperature. It is also
possible to use weight change for finding the boiling point
as there is a sudden decrease in the weight of a substance
as it reaches its boiling point. The nroblem with this tyoe

of determination is that the discontinuity in the weight versus
temperature curve is sometimes not sharply defined. Direct
pressure measurement is only possible when the substance is
relatively volatile.
Electromotive force measurement is usually carried out in
differential concentration cells. A pure component is held in
one h-lf of the cell, and the alloy containing that component
is held in theother half at the same temperature. The two
halves of the cell are connected by a salt bridge along which
ions may travel. The electrons must then travel along an ext-
ernal conductor. When the resistance of the conductor is very
high, a value for the F..M.F. can be found and this is related
to the free energy change by the relationship,
AG 0 = - z.F.F0 where ?, is the number of electrons transferred
in the electrode reactions and F is Faradays constant. A G 9 is
also given as AG° = - R.T.ln a,. __ ^ so that the activity e (in alloy)
of the component in the alloy may be calculated.
The equilibration of condensed systems works on exactly
the same principle as the equilibration of a condensed phase
with a vapour phase, that is, at equilibrium the activity of
each component is the same in each phase. This approach is
generally adopted in consideration of equilibrium in metal/
slag or metal/matte/slag systems, where the phases are mutually
insoluble.
2.1.1 The Knudsen Fffusion Technique
The Knudsen Effusion Technique for measuring small vapour
51
pressures is important for the determination of thermodynamic
properties of vapours and condensed phases in equilibrium. In
its simplest form the sample is held in a small isothermal cell
and the vapour with which it is in equilibrium is allowed to
flow through a small thin-edged orifice into a vacuum.
Measurement of weight loss in a known period of time at a known
constant temperature and a knowledge of the relative proportions
of the molecular species in the vapour allow the partial
pressures to be calculated. Alternatively the effusate may be
condensed and weighed and, if necessary, analysed.
The molecular weight of the species effusing from the cell
must be known, and if more than one species is produced the
molecular weight of each must be known. The most powerful method
of determining the vapour species is the- mass spectrometer.
This combination allows each vapour species to be studied indiv-
idually so long as the partial pressures do not differ by several
orders of magnitude. The system must be calibrated to determine
the sensitivity for each species. The fragmentation of larger
molecules into smaller ions in the ion source is also a problem.
Direct mass-spectrometric study of the activities of alloys
involves the use of twin cells. Partial pressures of a
component in solution can be compared with the vapour pressure
of the component in the standard state, and the ratios of the
corresponding ion peaks are equal to the activities. Problems
involve the correct alignment of the molecular beam and the ion
source, and ensuring that both cells are at the same temperature.
Belton and Kruehan (38) transformed the Gibbs-Duhem equation

52
so that it could be integrated to derive activities in an alloy
with two components with approximately equal velocities from
measurements of the ratio of ion currents, thus overcoming
problems caused by changes in the sensitivity of the mass-spec-
trometer. Corresponding equations were also derived for ternary
systems and for ternary systems with one non-volatile component.
Equations were also derived which could be applied to complex
vapours where various ions are formed, the ratios of the peak
heights of the largest ion and of the second component were always
measured, thus eliminating errors arising from the fragmentation
of the complex vapour species (39*40). The limiting factors for
this technique are the vapour pressure range which is compatible
with equilibrium operation of the Knudsen cell and the sensitivity
of the mass-spectrometer.
2.1.2 The Langmuir Method
This is another technique for the measurement of vapour
pressure within a vacuum. The sample is suspended freely so that
there is no impediment to evaporation. The mass which evaporates
is often less than that in the equivalent Knudsen method, this is
because the equilibrium vapour pressure may not be reached during
a Langmuir experiment. The fraction of the mass which evaporates
compared to that found in the Knudsen experiment is called the
vapourisation coefficient.
2.1.3 The J.sopiestic Method
The technique is very similar to the dew-point method, as
applied to a binary system the vapour pressures of the two
1949
components should differ by at least three orders of magnitude.
The reaction tube is evacuated and the non-volatile component
is held at one end of the apparatus at a known temperature.
At the other extreme of the reaction tube, the volatile
component is held at a known lower temperature. The volatile
component then evaporates and travels along the tube and comes
to equilibrium in the alloy. From the vapour pressure data of
the volatile component the activity in the alloy in the
standard state is readily calculated. In order to apply this
technique to complex vapour systems, thermodynamic data,
relating the composition changes in the vapour as it is
heated , must be available. There is also the possibility of
thermal segregation of the different molecules. The amount
of information yielded by a single experiment may be greatly
increased by putting a series of samples along the temperature
gradient. Care has to be taken to ensure that the samples are
kept close to equilibrium during quenching. 0
2.1.4 The Transpiration Technique
The transpiration method may be used in two modes these
are;
1) Removal of vapour from a liquid alloy at a known
temperature in an inert gas stream, with the vapour being cond-
ensed and weighed.
2) The volatile component of an alloy is equilibrated
at a low temperature with an inert gas stream, the alloy
picks up the volatile component from the vapour and comes to
equilibrium over a period of time.

54
There is clearly a major difference between the two modes as
method 1 may not yield equilibrium data as after some time the
volatile component will be substantially removed from the alloy.
Method 2 should reach equilibrium assuming the loss of the inert
component of the alloy into the gas stream is small. If the
carrier gas and the vapour are assumed to be ideal gases, the
total pressure of the system is proportional to the number of
molecules present, and the individual partial pressures are
proportional to the number of molecules n, of each species. Thus
for an inert gas i, and vapour v, the partial pressure of v is
given by;
p = p = n = volume of v *v *v v P x x n P + p. n + n. volume of v + volume of i ^total v l
Some of the important measurements in the two cases are
different, these are;
Method 1 Method 2
Volume or flow rate of carrier gas Temperature of volatile element
Weight change of droplet Final composition of alloy
'Weight of deposited vapour Approximate flow rate
It is notable that the exact flow rate is not critical in
method 2 once the approximate flow rate for saturation of the
vapour has been found, whereas it it critical in method 1.
Problems with Entrainment Techniques
The main problems are:
1 ) Maintaining vapour saturation
2) Vapour diffusion
5) Measuring and maintaining the temperature(s)

55
4) Finding the molecular composition with complex vapours
5) Fnsuring the alloy is at equilibrium (method 2).
2.1.4.1 Saturation and Diffusion of the Vapour
At saturation the theoretical vapour pressure will be observed,
so where the inert gas is being passed over a volatile component,
whose vapour pressure is known, it is possible to find experiment-
ally the range of flow rates which are compatible with saturation.
Where the vapour pressure data is not available it is still
possible to identify the flow rates which are suitable; at satur-
ation there is a range of flow rates where the observed vapour
pressure remains constant. By plotting apparent vapour pressure
against flow rate, a plateau is observed which typically extends
over a threefold range of flow rates. At low flow rates the effects
of diffusion become important and the apparent vapour pressure
rises; with high flow rates the carrier gas is not saturated so
the apparent vapour pressure falls (Figure 14).
In most apparatus the vapour that enters the carrier gas in
the sample region is most commonly removed by condensation or by •
being taken into solution beyond the end of a capilliary which
eliminates back-diffusion.
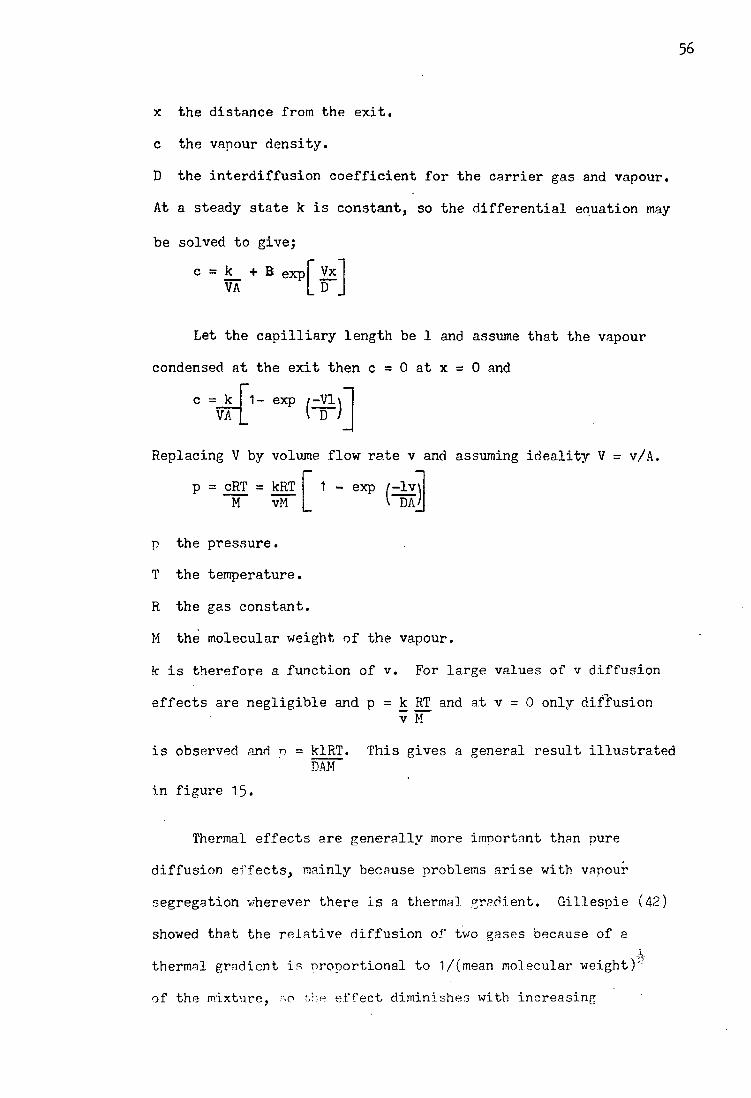
Merten (41) showed that under these conditions the flow, along
an isothermal capilliary may be written as the sum of two terms,
the bulk flow and the diffusion term, such that.
k the mass per unit time passing a point in the tube.
V the linear velocity of the gas.
56
x the distance from the exit,
c the vapour density.
D the interdiffusion coefficient for the carrier gas and vapour.
At a steady state k is constant, so the differential equation may
be solved to give;
c = k_ + B exp VA
Vx D
Let the capilliary length be 1 and assume that the vapour
condensed at the exit then c = 0 at x = 0 and
1- exp /-Vl\ I D /
c =_k_ VA
Replacing V by volume flow rate v and assuming ideality V = v/A,
1 - exp /—lv\ V T)AJ
p = cRT = kRT M vM
p the pressure.
T the temperature.
R the gas constant.
M the molecular weight of the vapour.
k is therefore a function of v. For large values of v diffusion
effects are negligible and p = k RT and at v = 0 only diffusion v M
is observed and o = klRT. This gives a general result illustrated DAM
in figure 15.
Thermal effects are generally more important than pure
diffusion effects, mainly because problems arise with vapour
segregation 'wherever there is a thermal gradient. Gillespie (42)
showed that the relative diffusion of two gases because of a x
thermal gradient is oroportional to 1/(mean molecular weight)':
of the mixture, so r,he effect diminishes with increasing

57
/ N
APPARENT VAPOUR
PRESSURE
FLOW RATE
Variation of apparent vapour pressure with flow rate,
in a transpiration apparatus
Figure 14
r'igure 15

58
molecular weight. The general result he produced for a mixture
of two gases is;
d ln x^ = jCl-mgV^nhX^ for gas number 2 and similarly for gas
d ln T
1 to produce,
d ln (x^/x^) = m^ - m^ where nu is the square root of the
d ^ 2^>m x molecular weight of component i, i i
and x^ is the mole fraction of component i. The other general
conclusion is that increasing the temperature gradient increases
the degree of thermal segregation. Gillespie suggested that the
use of a low molecular weight carrier gas would lead to the
reduction of the thermal segregation, by reducing the molecular
weight of the mixture.
The transpiation technique was selected for the research into
arsenic containing alloys because of its relative simplicity, its
suitability for measuring activities in liquids, and the expected
range of useable vapour pressures. The variables are easily
controlled with gas flow rates, temperatures and weight changes
all measureable with a high degree of precision.
2.2 Apparatus
The apparatus consisted of a furnace, an alumina tube
assembly which was inserted into the furnace and a gas train
leading into and out of the alumina tubes. The furnace consisted
of three wire-wound elements which were independently controlled.
The furnace assembly is shown in figure 16.
The furnace elements were wired in series, the lowest
temnerature region was where the arsenic was evaporated into the
gas stream, the second region was at an intermediate temperature.
The third winding was used to achieve temperatures of between
800° and 1114°C, where the copper or copper-lead-arsenic alloys
were equilibrated with the arsenic-laden argon stream. The low
temperature region was controlled by a Eurotherm temperature
controller which was connected to a Pt/Pt 13% Rh thermocouple.
A second thermocouple was used at the low temperature end to
measure the temperature in the vicinity of the arsenic. This
was cromel-alumel, which was selected because it had a higher
output, mV/°C, than most others in the range 200° to 450°C, so
that the temperature of the arsenic source could be accurately
determined. The thermocouple was sheathed in silica as arsenic
vapour reacted with the material of thermocouple.
The second zone was kept at a constant temperature in
excess oi 65CTC in order that the arsenic vapour would be heated
as it travelled towards the hot zone, and also so that no arsenic
would condense(Arsenic sublimes at 603°C at 1 atm). The hot zone
was controlled by a separate Eurotherm controller which was
connected to a Ht/Pt 1Y Rh thermocouple. This thermocouple was

argon in
Apparatus for Transpiration Experiments
Figure 16
ON O

61
also used to monitor the hot zone temperature.
Two concentric alumina tubes were inserted into the furnace;
the outer one about 90 cm long, the other one 1 m long. The outer
tube had one closed end, this had an outside diameter of 50 mm
and the inner tube a diameter of 15 mm. These two tubes were
held concentrically by a large brass joint which was held together
by a screw thread, and was made gas tight by "0" ring seals. The
wires from the cromel-alumel thermocouple had to be brought out
from inside the gas-tight apparatus, this was done by leading
the wires down, through the brass joint and out through holes
made in the P.V.C. tubing, the holes were then sealed. Drilled
graphite plugs were inserted into the inner alumina tube to
reduce the cross-sectional area and increase the gas velocity
along the tube and hence reduce the effects of thermal segre-
gation.
The boat containing the alloy was high grade alumina (Purox,
Morganite Refractories Ltd.), this was connected by alumina
cement to a length of thermocouple sheathing which was fixed into
the small brass joint on the inner alumina tube. The smaller
brass joint was also sealed with 0 rings. The permanent
coupling between the brass joint and the boat ensured that the
boat was placed accurately in the centre of the hot zone each
time.
Argon was used as the carrier gas and was supplied by B.O.C.,
99 *999c/ purity with specified maximum levels of impurity, nitrogen
15 p.p.m., oxygen 4 p.p.m., hydrogen 1 p.p.m., hydrocarbons
1 p.p.m. with total impurities less than 20 p.n.m. Tn order to

62
ensure that the impurities, particularly oxygen and water were
kept to a minimum the argon was purified before entering the
furnace. The argon was first passed through a furnace containing
titanium granules and then through a U-tube containing phosphorous
pentoxide. The gas leaving the apparatus carried with it the
surplus arsenic vapour, for this reason the gas was cleaned
before passing into a fume extractor.
The exhaust gases were first passed through a particle filter
and then passed through a water cooled cold finger and then
bubbled through a dreschel flask containing nitric acid, a second
dreschel flask was added to ensure that there was no possibility
of a blow-back of acid into the furnace assembly. The argon flow
rate was regulated by a pressure reduction head and a pair of gas
taps in series. The flow rate was monitored continuously by a
Meterate flow meter RS1 (Scientific Supplies Ltd) which was cali-
brated by means of a "soap-bubble" meter. The entire furnace
assembly and the two gas trains were contained entirely within
a Perspex fume cupboard which was connected to an external fume
extractor. In this way the pressure within the cupboard was kept
to below the ambient pressure, so there was little possibility
of arsenic vapour escaping into the laboratory if some unforeseen
incident had occureri in the course of the experiments.

63
2.3 Experimental Technique
Calibration of Apparatus
Temperature control and measurement are very important in
thermodynamic studies, particularly in transpiration studies where
the activity of the volatile species is determined by its vapour
pressure and hence its temperature. The hot zone temperature
was set by inserting a Pt/Pt 13?' Rh into the inner alumina tube so
that it was in the centre of the hot zone. The temperature
control on the "Eurotherm" was adjusted until the desired
temperature was measured in the hot zone. This temperature was
then monitored over 30 minutes and found to be constant - 2°C.
The use of a cromel-alumel thermocouple at the "cold" end in the
vicinity of the arsenic meant that its temperature could be
monitored very accurately; the thermocouple has a very high output
in the range 200° to 450°C. The temperature of the cold zone was
found to be constant - 2°C over 30 minutes although over a longer
period there was a slight tendency for the temperature to fall,
for a given Eurotherm setting.
Equilibration
There are two stages in this transpiration technique, and
there ere two equilibria to be considered. Firstly the argon
had to be saturated by passing it over heated solid arsenic,
and the droplet of alloy then had to be equilibrated with this
vapour.
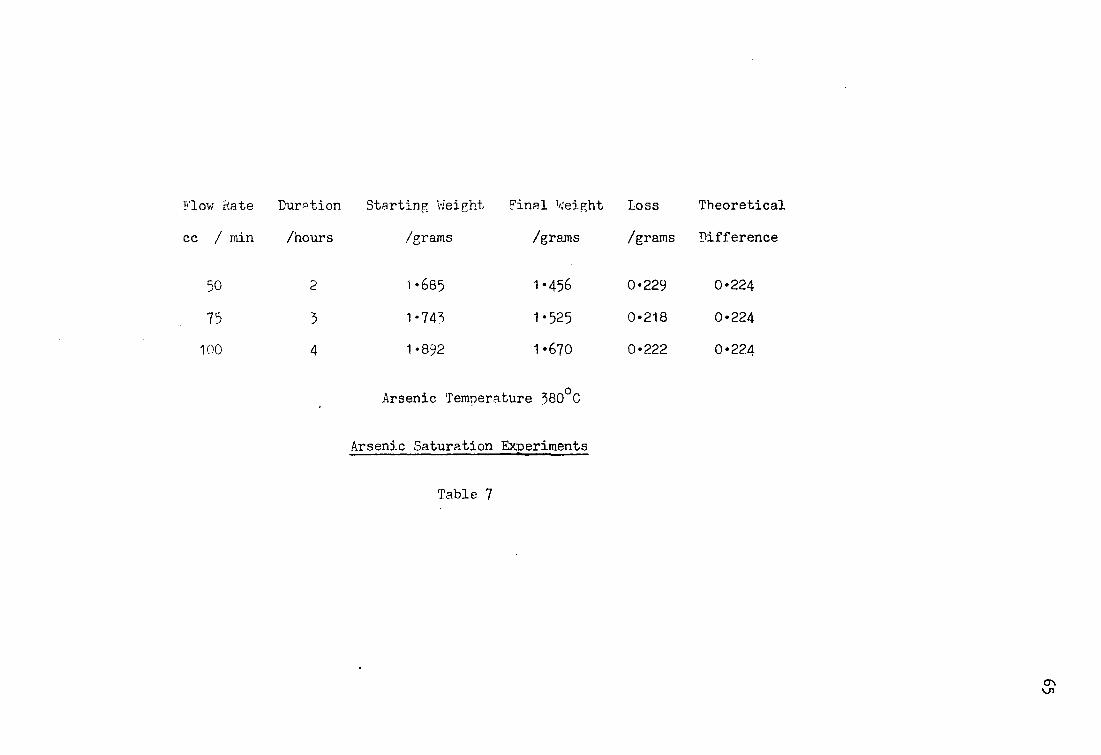
Arsenic Saturation
The argon had to be saturated with arsenic vapour in order
that the activity of the arsenic could be calculated. In order

64
to find the conditions for saturation a series of experiments
were conducted in which the loss in weight of arsenic into a
known gas volume was measured. All of the experiments were
conducted with the same volume of argon, and necessarily differing
experimental times. The arsenic was weighed and then inserted
into the apparatus. Once the arsenic had reached 380°C, a known
volume of argon was passed over it. After a suitable time
interval, the gas flow was stopped and the arsenic cooled. It
was not possible to measure directly the amount of arsenic which
was condensed as the arsenic was condensed and collected at
several points in the exhaust gas train. It was noted earlier
that arsenic evaporates predominantly as As^ molecules at
temperatures below 800°C, this assumption was used to calculate
the apparent vapour pressure of arsenic. The arsenic which
was left at the end of the experiment was weighed. Three flow
rates were used to determine the location of the plateau in the
flow rate - vapour pressure relationship, these were 50, 75, and
100 cc per minute. From the results it was apparent that all of
these flow rates were compatible with saturation of the vapour
(Table 7). The flow rate of 75 cc per minute was used as standard
for all experiments. Although there are differences between the
theoretical weight losses and the actual weight losses, these are
not significant. The results also confirmed that the thermocouples
were accurately calibrated.
Activity Measurement in the Copper-Arsenic System
As similar transpiration experiments had been carried out on
the copper-arsenic system (25), there was some indication of the
range of -ctivities which could be measured, and the range of
Flow Rate Duration Starting Weight Final Weight
cc / min /hours /grams /grams
50 2 1-685 1-456
75 3 1-743 1-525
100 4 1-892 1 -670
Arsenic Temperature 380°C
Arsenic Saturation Experiments
Table 7
Loss Theoretical
/grams Difference
0-229 0-224
0-218 0-224
0-222 0 - 2 2 4

66
arsenic vapour pressure which could be used. Before any
experiment was started, any arsenic which had been evaporated
was replaced to ensure that there was sufficient arsenic to
saturate the argon with arsenic vapour for the duration of the
experiment. The inner alumina tube was then inserted into the
outer alumina tube, the two tubes were then joined by the large
brass connector. There were several turns of copper tubing
around the brass joint and water was run through this in order
to cool the brass and the 0 ring. The water was turned on as
soon as the two tubes were put into the furnace. This cooling
was kept on for the duration of the experiment and was only
turned off when the furnace had cooled down.
VJhen the gas train was connected the argon was turned on and
the oxygen flushed from the apparatus, the flow was turned down to
75 cc per minute. The furnace containing the titanium granules
was then turned on to ensure that the argon entering the furnace
from the gas train had an extremely low oxygen content. The three
main furnace windings were then turned on, these tyoically took
forty-five minutes to come to temperature. During the heating
of the furnace, argon was flowing over the solid arsenic. This
meant that any residual oxide on the arsenic was removed before
the copper was introduced into the furnace. The copper was cut
from a rod and was cleaned in nitric acid, washed and dried with
acetone and then weighed. In early experiments two drorlets
were used, but it was found that they would tend to run together,
usually on ouenching, before they could be weighed at the end of
the experiment. The time between the preparation of the copper

and its use in the experiment was as short as possible, typically
less than five minutes. In order to insert the copper into the
furnace it was necessary to remove the end brass joint and pull
the alumina boat out. The copper was placed in the boat when it
had cooled, the boat was then slowly pushed into the furnace.
The argon flow rate was increased during this procedure to
minimise the amount of oxygen being introduced into the furnace.
The brass joint was then tightened and. made gas tight by an 0
ring seal, this meant that all of the exhaust gases were directed
through the gas train, and that the boat was placed accurately
in the centre of the hot zone. The gas flow was then readjusted
to 75 cc per minute. The temperature of the hot and cold zones
was noted when the experiment was started and at intervals
throughout the experiment. The gas flow rate was also checked
regularly, although this was not critical. At the end of the
experiment the droplets were cooled and weighed. Two methods
of cooling were tried in order to minimise the loss of arsenic
at the end of the experiment, these were cooling within the
apparatus and water quenching.
In order to minimise the loss of arsenic, the time from
removal from the arsenic rich gas stream to quenching the
droplet bad to be as short as possible. This was done by
unscrewing the end brass joint, the boat was then pulled from the
furnace and inverted directiy above a beaker of distilled water.
It was thought that this technique may not have been suitable for
high arsenic contents, so the alternative, cooling within the
apparatus was tried. Usina this technique the boat was only
remover4 from the hot zon^ so i 1, was still In the gas stream. It
68
was hoppd that i.t would cool without any change in composition.
However as the boat cooled the droplet apparently rejected
arsenic which gave some fuming at the open end of the alumina
tube. This technique was therefore not used.
In general the quenching technique was very successful, and
it worked quite satisfactorily for arsenic contents in copper in
excess of thirty atomic per cent, due mainly to the extremely
low activity of arsenic in copper. A few of the droplets
shattered on quenching but in these cases there were sufficient
fragments to carry out a chemical analysis. The alloy was washed
and dried with acetone, it was then weighed. The weight change
was attributed solely to the pick up of arsenic by the droplet
as an insignificant amount of copper would evaporate into the
gas stream. By this means it was possible to obtain approximate
compositions of the alloys before the chemical analyses were
carried out.
Equilibration of the Copper-Arsenic Alloy
The equilibration of the arsenic with the argon was discussed
earlier, the second main step in this technique was to ensure
that the copper-arsenic alloy had come to equilibrium with the
arsenic laden vapour. For all experiments high purity copper
(99.999/) was used as the starting material with a sample weigh-
ing from 0 * 1 5 to 0 * 3 grains. It was approximately calculated
how much arsenic the copper would have to pick up in order to
achieve equilibrium. It was found that the droplet would pick
up about, half of the mass of arsenic which reached it so it was
normal practise to vanourise an amount of arsenic, similar to

69
the original weight of the cooper, as a minimum. The rate of
transfer of arsenic to the alloy is roverned by the rate of
evaporation of arsenic, so to decrease the time of some of the
experiments, the arsenic was heated to over 400°C. When an
excess of arsenic had been transfered to the alloy, the
temperature of the arsenic source was reduced, and the alloy again
allowed to come to equilibrium by loss of arsenic into the gas
stream. This was found to be a very useful approach for experi-
ments where the alloy was being brought to equilibrium with argon
saturated with arsenic at below 350°C, where the transportation
times and rising As content would have been excessive. This
technique was also useful in confirming that equilibrium had
been reached, as the final composition could be approached from
alloys containing both an excess and deficit of arsenic from the
eauilibrium value.
Variation of Hot Zone Temperature
The first series of experiments were carried out with the
alloy held at 1114°C, so there was no need to take any precaution
to ensure that the alloy was liquid as the exneriment was carried
out entirely above the liauidus temperature. Subsequent
experiments were conducted at 1000 and 900°C which is below the
melting point of pure copper, so that a slightly differnt tech-
niaue was used. The copper was introduced into the furnace at
1100°C and in a stream of arsenic laden vapour. The presence of
arsenic lowered the liquidus temperature, so that after the
copper had absorbed the arsenic the hot zone temperature could
be lowered to 1000 or 900°C whilst maintaining a liquid copper
phase. The arsenic temperature was then lowered to its final

temperature allowing the droplet to rome to equilibrium before
being quenched.

71
2.4 Activity Measurement in the Lead-Copper-Arsenic System
The governing factor in transpiration experiments is the
vapour pressure of the components, in an ideal study there should
be one volatile component and the others should be relatively
inert. In the apparatus which was used for this study, equilibrium
was reached between the arsenic vapour and the copper-arsenic alloy,
later the same apparatus was used to investigate the equilibrium
lead-copper-arsenic compositions for two arsenic activities (0*1
and 0*05) relative to liquid arsenic. In order to work as close
to equilibrium conditions as possible the vapour pressure of the
lead had to be minimised; the temperature of the lead had therefore
to be kept as low as possible. To produce an iso-activity line in
the Cu-Pb-As ternary system various lead-copper ratios were needed,
and to minimise the length of the experiments, high arsenic, lead-
copper alloys were used. To find the maximum temperature, the
vapour pressures of the arsenic and lead were compared for various
experimental conditions.
The arsenic activity was always set prior to the introduction
of the lead-copper-arsenic alloys into the hot zone. In each case
the standard state was liquid arsenic at the temperature of the
alloy. The arsenic activity was set by fixing the temperature of
the arsenic. The calculation of the temperature of the arsenic
wss carried out as follows. In this example the required activity
is a As =0-05 800°C
atm
So a = 0-05 = (P /32-90) s
72
^2-90 x (0-05)4 = P A g 4
-4 2-056 x 10 atm = P A g
4
The computer program (appendix 2 ) was then used to find the
vapour pressure of arsenic which was required to produce this
vapour pressure of As^ at 800°C, and hence the temperature at
which the arsenic source had to be held. /The results for the other
required vapour pressures and temperatures are given in table 8.
It will be noted that at 800°C arsenic is not liquid at any
pressure so a supercooled liquid arsenic standard state is used.
The ratio of arsenic (As^) vapour pressure to lead vapour pressure
at 800° and 900°C are given in table 9, together with the relative
mass transport ratio for the two metals,(the ratio of the rate of
transport of arsenic in grams to the rate at which lead would be
removed, from the pure element, for each activity and temperature
combination). For this reason high arsenic alloys were used,
because the arsenic was removed much more quickly than it was
delivered, leading to short equilibration times so that the Cu/Pb
ratio changed as little as possible. The data for the vapour
pressure of Pb were taken from Hultgren (20).
The whole composition range of Pb-Cu ratios was covered, the
starting compositions are given in table 10 and are plotted on
figure 17, together with the constant Pb:Cu ratio lines along
which arsenic losses would change the compositions. The alloys
were prepared by Metallurgie Hoboken-Overpelt.
Fouilibration
The apparatus was exactly the same as that used for the

Figure 1969
Start Compositions in
Pb-Cu-As System
\ \ l *
\ \ \ R Q

.^rsenic Hot Zone
Activity Temo/ C
0-05
0 - 1 0
0 - 0 5
0 - 1 0
800
800
900 900
Required arsenic pressure
/atn As,,
2-06 x 10~4
5 - 2 9 Y 1 0 " '
5-19 x i0~4
5-1'1 x 10
Total
Pressure of arsenic
evaporating/atm
2-15 x 10
5-59 x 10"
3-26 x 10
-4
-A
5-25 x 10 - Z
Relationship between Arsenic Activity and Temperature
Table 8
Arsenic
Temp/°C
540
405
349
4 1 7

Lead Temperature Arsenic P. : Pp, Relative mass 4
/°C Activity transfer ratio
800 0.1 46.3 67.0 800 0.05 3.45 4.99 900 0.1 12.2 17.6
900 0.05 0.76 1.10
Variation of ratio of vapour pressures of lead and
arsenic with temperature and arsenic activity
Table 9

Mole Fractions
Pb Cu As Alloy Number
0-1408 0-5305 0-3286 1 0-1248 0-5409 0-3347 2 0-2031 0-4857 0-3112 3 0-279? 0-4093 0-311? 4 0-3879 0-3065 0-3056 5 0-4587 0-2605 0-2808 6 0-4962 0-2103 0-2935 7 0-5641 0-1444 0-2914 8 0-6612 0-0724 0-2665 9
Alloy Starting Compositions
Table 10

77
activity determinations in the copper-arsenic system. The entire
apparatus was heated to operating temperature before the introduc-
tion of any alloy, the arsenic temperature was also set for the
required arsenic activity. The alloy sample was then introduced
into the hot zone in the alumina boat, it was then left for ten
minutes and then removed and water quenched. The initial,
experiments to find the equilibrium times were carried out, at
800°C and an arsenic activity of 0*1, on alloy number 4. It was
found that no significant change in composition occured with
experimental times from five to nineteen minutes; a standard
equilibration time of ten minutes was adopted for all subsequent
experiments. The droplets were weighed immediately before and
after the experiment, after washing and drying in acetone.

78
2.5 Knudsen Cell Mass Spectrometry
A Bendix time-of-flight mass-spectrometer (Model 12) fitted
with a molybdenum wound furnace was used in an attempt to analyse
the effusing vapour from a silica or Graphite Knudsen cell.
Cell Preparation
Silica tube (8 mm o.d.) was sealed at its base by heating in
the flame of a natural gas/oxygen burner. At a distance of about
3 cm from this end a neck was formed by heating the silica and
pulling. The neck was not sealed and the sample was later inserted
through it. A minute hole was then machined into the silica
approximately one centimetre from the neck. The sample was then
inserted into the cell, a typical weight for the sample was 0*2
gram. The cell was then inserted into a cork, which was drilled
such that the base of the cell protruded from the bottom. The
open neck of the cell was clear of the top of the cork. The
cork was then put into a shallow water bath so that the silica
surrounding the sample was water-cooled. The top of the cell
was then sealed with a burner. Finally the machined hole was
contracted by heating, to such an extent that it was just visible
with an eyeglass. The completed cell was then placed into a steel
capsule and the orifice in the Knudsen cell aligned so that the
effusate would emerge through a relatively large port in the steel
cell. The assembly was then lowered into the furnace.
A second type of cell was used for higher temperatures, this
was machined from graphite and the Knudsen orifice was drilled
into the side of it. The base of the cell was threaded and
79
unscrewed to expose a hole into which a 4 mm diameter alumina
crucible, containing the sample, was placed. The base was then
replaced. The sample was then ready for insertion into the furnace.
Operation of the Mass Spectrometer
The mass-spectrometer differentiated between different masses
of ions by measuring the time of travel for ions after an acceler-
ating potential was applied. Doubly charged ions would experience
twice the acceleration, and would appear to have half of their
mass, but none were found in this investigation. The mass numbers
were related to the reading on a vernier dial which had to be
calibrated. There were several species within the mass-spectrometer,
despite the vacuum, which were used to calibrate the apparatus. The
standards used were CO and lb, at mass number 18, mercury from the
diffusion pump and vacuum oil mass number 186, from these the
vernier was calibrated in the range mass number 18 to 250 from
these it was possible to extrapolate to mass numbers up to 350.
The furnace was then turned on and the sample was heated to
the required temperature. When the sample was up to temperature
the effusing beam was directed into the ionising electron stream.
The mass-spectrometer could scan in a selectable range so that it
passed through the desired mass number. The peak height was
proportional to the ion current generated. The peaks were not
perfect lines at one mass number because the accelerating
potential, despite being pulsed, had a slight rise and decay time.
To verify that the correct peak was being examined the Knudsen
cell was rotated so that the effusing beam did not enter the
spectrometer, the peak height then fell, it was also useful to find

the amount o' background at that mass number. Scanning through
a range of mass numbers gave an impression of the general
background.

81
2.6 Chemical Analysis
The copper-arsenic alloys were analysed after weighing at the
end of the transpiration experiments. The technique used gave an
analysis for arsenic, the balance was assessed as copper and on
this basis the final composition was determined . The alloy
was dissolved in equal measures of concentrated nitric and
sulphuric acid with a small amount of distilled water. The solution
was then heated to near dryness, such that all of the nitric acid
decomposed. The residue was then dissolved in distilled water.
Fifty millimetres of concentrated hydrochloric acid were added,
together with five to seven grams of hydrogen bromide and one to
two grams of hydrazine sulphate. The arsenic was all then in the
form of AsCl^ which was then distilled in an all glass apparatus.
The outlet for the distillate was below the level of the distilled
water in a collection beaker. Only the fraction distilled at over
80°C was collected. The distillate was titrated with potassium
bromate in the presence of excess acid, or with iodine in potassium
iodide after neutralisation of the distillate. The results of the
chemical analyses agreed, within experimental error, with the weight
change analyses, so only in selected cases were chemical analyses
carried out.
The lead-copper-arsenic alloys were analysed for all three
elements by the analytical, laboratories of Metallurgie Hoboker-
Overpelt.

CHAPTER 3
RESULTS

1979
3.1 The Composition of Arsenic Vapour
Arsenic evaporates as As^ molecules at temperatures below
800°C; this happens when arsenic is evaporated into the argon
gas stream within the transpiration apparatus. As the vapour
is heated the molecules will dissociate but the total pressure-
within the apparatus must remain at one atmosphere. In order
to find the activity of arsenic relative to the pure liquid it
is necessary to calculate the extent of As^ dissociation. The
As^ dissociates to give As^, As^ and As^ molecules. The
equilibria for these reactions may be represented by;
As4(g) a As5(g) ' K3 = 'As 4 / 3 ( 1 )
A 54(g) = 2 A 52(g) > K 2 = PAs ' ™
PAs 4
A54(g) = 4 As(g) ' K1=Pa s 4 0 )
pAs, 4
K^, Kg and K^ have unique values at any temperature so the
extent of dissociation may be determined.
Let P ^ be the vapour pressure of As^ on evaporation, then
if it were to dissociate completely to As^ the pressures
generated would be 2 x and similarly for the other two
reactions, such that;
P4e = P4t ' * P3t + i P2t + « P1t (4)
where P ^ represents the vanour pressure of As^ at a higher

84
temperature, t, and similarly for the other molecules.
From (1) P = (K5 P^)'* (5)
From (2) P g t - (Kg P 4 t)~ (6)
From (3) P n = P ^ ) * (7)
Substitution of (5), (6) and (7) into (4) gives,
P4e = P4t + * < K3 P4t ) f + + * ( K1 V " '
Fquation (8) was solved by computer for each experimental
vapour pressure and equilibrium constant combination (Appendix 1).
The values for the equilibrium constants K^, K^ and K^ were
calculated from the data of Hultgren et al (17). The data only
covers the range 298 to 900 K so some extrapolation of the data
was necessary. This was done by computing the best straight line
through the data nut into the form, lg-jQ P^s end 1/T (K) for n
integral values of n from 1 to 4. The best straight lines can
be represented by the following;
l g i o As1 = -1-560 x 104 (1/T) + 6-9158 (9)
l g i o ASp " = -1-0950 x 104 (1/T) + 7*8179 (10)
l g10 As, 3 = -1-2980 x 104 (1/T) + 9-4567 (11)
l g10 = -7-0000 x 104 (1/T) + 7-9944 (12)
All pressures are given in atmospheres.
The temperatures of interest are 1073, 1173, 1273, 1373 and
1387 K. Values for the pressures of the individual species and
the values of the equilibrium are given in tables 11 and 12
respectively.
The total observed vapour pressure over liquid arsenic is
given by Baker (15) as lg 1 Q P = - 2405 + 3*759 (atm). A value

T/C PAs 1 PAs 2
PAs, ? A s 4
800 2.383 x 10⁻⁸ 4.100 x 10"5 2.290 x 10"3 29.56
900 4.136 x 10"7 3.040 x 10~2 2.461 x 10~2 106.36
1000 4.580 x 10⁻⁶ 0.1652 0.1821 313.0
1100 3.579 x 10"5 0.6961 1.007 787.1
1114 ON
Oo X 10~5 0.8374 1.248 885.7
Equilibrium vapour pressures of arsenic molecules above solid arsenic
All pressures in atmospheres
Table 11

T/C
800
900
1000
1100
1114
1.091 x 10 -32
2.750 x 10 - 2 8
1.411 x 10 -24
2.084 x 10 - 2 1
5.315 x 10 - 2 1
5.687 x 10 7
8.689 x 10"6
8.719 x 10"5
6.156 x 1 0 " 4
7.918 x 10"4
1.021 x 10 5
6.729 x 10~5
3.298 x 10
1.282 x 10 -3
1.517 x 10 -3
Values for the equilibrium constants of arsenic vapour at various temperatures
Table 12

87
for P° in the standard state is found by substituting the value
produced by Baker into equation (8). The results of this are
given in table 13. A programme (Appendix 1) was used to calcu-
late the pressures of each of the vapour species at 1073, 1173,
1273 and 1373 K ( 800, 900, 1000, 1100 and 1114°C) for an
arsenic source temperature in the range 500 to 750 K (tables 14
to 17). The results are shown in figures 18 to 21. The effect
<ar increasing the hot zone temperature for a given source
temperature may also be demonstrated, and the results are shown
in figures 22 to 25.
The vapour pressure of As^ generated when solid arsenic
evaporates is clearly important, the data, of Hultgren et al(l7)
was used to compute a continuous function of pressure against
temperature. This is given as;
RT In P = -1-75181 x 10""7 T3 + 1-51724 T2 -1-17379 x 10 T +
; 4 ^ 9-83726 x 10
Using this equation, values for P (atm) in the range 473 to A S Z
873 K (200 to 600 C)
were calculated at one degree intervals
using a programme written for use on the college computer (Appendix
2), "he programme was also used to calculate the length of time,
for p given flow rate, for 1 gram of arsenic to be transported.

T ' K P A S 4 1 0 ^ P A S 4 P A S 5 1 0 ^ P A S 3 P A S 2 1 0 ^ P A S 2 P A S 1 L 0 ^ P A S L
500 1.5 X 10~7 -6.82 1.4 X 10"9 -8.85 2.9 x 10~7 -6.54 2.0 x 10" 1 0 -9.70
550 7.0 x 10~6 -5.15 2.5 x 10"8 -7.60 2.0 x 10~6 -5.70 5-3 x 10" 1 0 -9.28
600 9.6 x 10~5 -4.02 1.8x10~7 -6.74 7-4 x 10~6 -5.13 1.0 x 10~9 -9.00
650 9.9 x 10"4 -3.00 1.0 x10" 6 -6.00 2.4 x 10"5 -4.62 1.8 x 10"9 -8.74
700 7.0 x 10~5 -2.15 4.3 x 10~6 -5.37 6.3 x 10~5 -4.20 2.9 x 10~9 -8.54
750 4.0 x 10~2 -1.40 1.6 x 10"5 -4.80 1.5 x 10"4 -3.82 4.6 x 10~9 -8.34
The vapour pressure 0f arsenic molecules at 800 °C resulting from varying source temperature
Table 14
00 00

T / R P A S , P o ® P A s . P A s , ^ A s , P A s , l o S P A s ? P A S l ^ A s , 4 4 3 3 2 2 1 1
500 3 . 3 x 1 0 " 8 -7.48 1.8 x 1 C f 9 - 8 . 7 4 5 . 3 x 10" 7 -6.28 1.7 x 10" 9 -8.77
550 4 . 7 x 10"6 -5.33 7 . 5 x 10""8 -7.12 6 . 4 x 1 ( T 6 - 5.19 6.0 x 10" 9 -8.22
600 8 . 6 x 1 0 " 5 - 4 . 0 7 6 . 6 x 10~"7 - 6 . 1 8 2 . 7 x 1 0 " 5 - 4 . 5 7 1 . 2 x 1 0 - 8 -7.92
650 9.5 x 10~ 4 -3.02 4.0 x 10" 6 -5.40 9.1 x 10""5 -4.04 2.3 x 10" 8 - 7 . 6 4
700 6.9 x 10~ 5 -2.16 1.7 x id" 5 -4.77 2.4 x 10" 4 -3.62 8.7 x 10" 8 -7.43
750 4.0 x 10" 2 -1.40 6.6 x 10" 5 -4.18 5.9 x 10" 4 -3.23 5.7 x 10" 8 -7.24
The vapour p r e s s u r e of a r s e n i c molecules a t 900 -C r e s u l t i n g from v a r y i n g source temperature
Table 15
co vo

T / K P A S 4 l0^a34 P A S J L ° G P a 3 3 P a 3 2 L ° G P a 3 2 P A S I L ° G P A S I
500 3.9 x 10"9 -8.41 1.2 x 10"9 -8.92 5.9 x 10"7 -6.23 8.6 x 10"9 -8.07
550 1 .7 x 10"6 -5.77 1.2 x 10" 7 -6.92 1.2 x 10~ 5 -4.92 4.0 x 10~ 8 -7.40
600 6.2 x 10~5 -4.21 1.7 x 1 0 " 6 -5-77 7-3 x 10" 5 -4.14 9,7 x 10" 8 -7.01
650 8.5 x 10"4 -3.07 1.2 x 10~"5 -4.92 2.7 x 10" 4 -3.57 1.9 x 10"7 -6.72
700 6.6 x 10"3 -2.18 5.7 x 10" 5 -4.24 7.6 x 10~ 4 -3.12 3.1 x 10" 7
-1 p 1 y m""4 £ft 1 ft ir _o na a a ^ Ar\"l
-6.51
750 3 . 9 x 1 0 - 1 . 4 1 2 . 1 x 10 H - 3 . 6 8 1 . 8 x 1 0 " ; - 2 . 7 4 4 . 8 x 1 0 " ' - 6 . 3 2
The vapour pressure of arsenic molecules at 1000 °C resulting from varying source temperature
Table 16
vo o

T / K t s . l o g P A s , PAs l 0 g P A S , PAs„ l o g P A s 2 PAs. l o g P A S . 4 4 3 3 2 2 1 I
500 5.5 x 10" 1 0 -9.26 7.7 x 1CT 1 0 -9.11 5.8 x 10" 7 - 6 . 2 4 3.3 x 10~8 - 7 . 4 8
550 3 . 7 x 10"7 -6.43 1.0 x 1 0 " 7 -7.00 1.5 x 10"5 -4.82 1.7 x 10~7 -6.77
600 3.0 x 10~5 -4.52 2.7 x 10~6 -5.57 1.4 x 10" 4 -3.85 5.0 x 10"7 -6.30
650 6 . 6 x 10~ 4 -3.18 2.8 x 10~5 -4.55 6 . 4 x 10" 4 -3.19 1.1 x 10~6 -5.96
700 5.9 x 10~"5 -2.23 1.4 x 10" 4 -3.85 1.9 x 10" 5 -2.72 1.9 x 10"6 -5.72
750 3.7 x 10"2 -1.43 5.7 x 10" 4 -3.24 4.8 x 10"3 -2.32 3.0 x 1Cf6 -5.52
The vapour pressure of arsenic molecules at 1100 °C resulting from varying source temperature
Table 17
vo

Total Temp Pressure P A s
4 /C /atm /atm
800* 32.95 52.90
900 51.15 51.11
1000 74.09 74.00
1114 105.9 105.6
Values for total pressure and P°g 4
for a liquid arsenic standard state
Table 13
Undercooled arsenic standard state

93
The change in partial pressure of the arsenic molecules with
changing source temperature at a constant hot zone temperature
tog P
Figure 37

94
log P
/atm
The change in partial pressure of the arsenic molecules with
changing source temperature at a constant hot zone temperature
Figure 30

95
The change in partial pressure of the arsenic molecules with
changing source temperature at a constant hot zone temperature
Figure 37

96
The change in partial pressure _of the arsenic molecules with
changing source temperature at a constant hot zone temperature
T/K
Figure 37

600 Source Temperature
The partial pressure of As^ molecules with increasing
source and hot zone temperatures
Figure 22

The partial pressure of As2 molecules with increasing
source and hot zone temperatures
Figure 22

- 3 99
Log,. P 10 As
-4
-5
- 6
- 7
- 8
- 9 500
i lOO
•1000
900'
3 0 0
The partial pressure of As, molecules with
increasing source and hot zone temperatures
600 Source Temperature
700 T/K
Figure 24
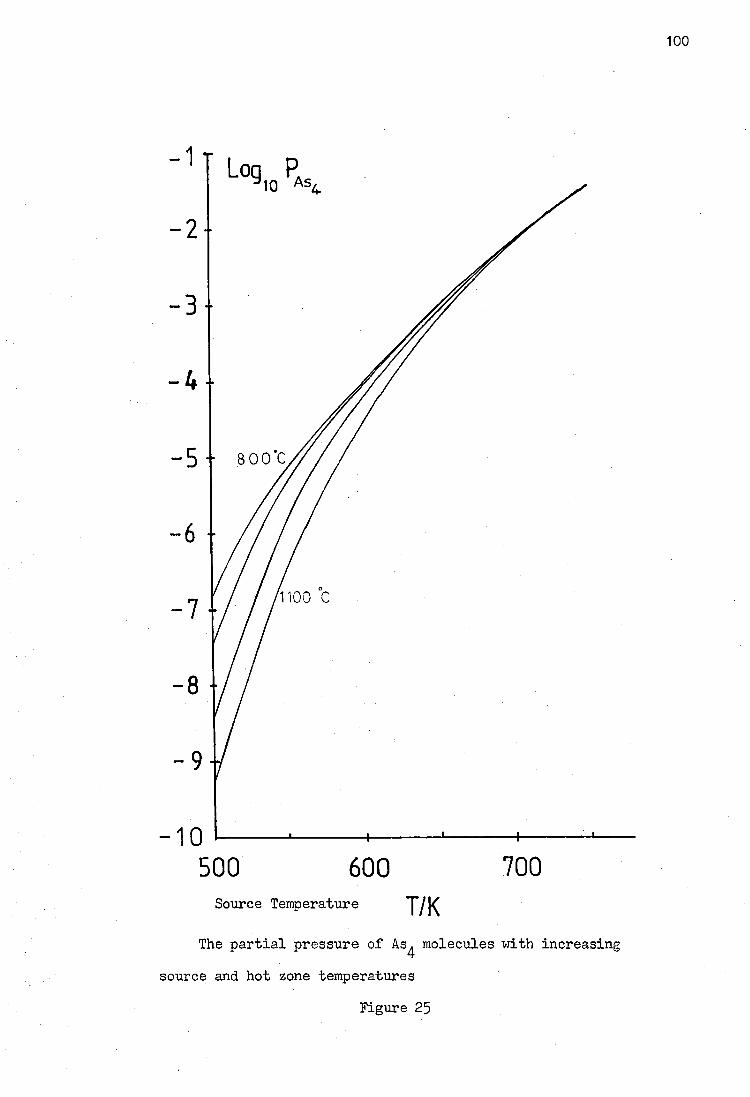
100
-1 T
- 2 -
- 3 -
Log. P a „
500 600 700 Source Temperature T / K
The partial pressure of As^ molecules with increasing
source and hot zone temperatures
Figure 37

101
3.2 The Conper-Arsenic System
Transpiration experiments were carried out on the copper-
arsenic system in the range 900°C to 1114°C. The results of.
these experiments are given in tables 18, 19 and 20. The results
are calculated on the basis of a liquid arsenic standard state,
A S4(g) v a p o u r s P e c £ e s being considered, such that
aAs = R- - R I . PAs. 4
PAs. 4
In the tables Pg represents the vapour pressure of A s ^ j on
evaporation, and P,p the pressure of As^j ^ this generates at the
droplet temperature. The results are also plotted as a A g against
N A s on figures 26, 27 and 28.
3.2.1 Partial Molar Free Energy of Arsenic in Copper
The integral free energy of formation of a solution AG^ from
components A and B may be represented by the sum of two terms
such that AGo = n. G. + n n where G. and G n are the partial I A ii d d A y molar free energies of A and B respectively. is related to
the activity of component A in the solution by the relationship
AGa = RT ln aA = 19 * 14T log.^a. . Partial molar free energies A e A ^10 As
of arsenic have been calculated for each of the experimental
temperatures and the results are given in tables 21, 22 and 23.
3.2.2 Integral Free Energy of Formation of Solution
The integral free energy of formation o.f solution may be
calculated from partial molar functions by means of the Puhem-
Margules equation (43),

T / K T / ° C N A S P E PT aAs
/atm /atm /atm
609 336 0.277 1.763 X 1 0 - 4 1.560 x 10"4 4.18 X 1 0 - 2
588 315 0.256 6.324 X 10" 5 6.117 x 10" 5 3.31 X ID"2
579 506 0.251 3.962 X 10~5 3.429 x 10"5 2.86 X 1 0 - 2
571 298 0.242 2.580 X 10⁻⁵ 1.918 x 10"5 2.48 X 1 0 - 2
559 286 0.227 1.392 X 10~5 9.324 x 10" 6 2.07 X 1 0 - 2
545 272 0.210 5.848 X 10⁻⁶ 3.128 x 10"° 1.57 X 10"2
Results of Transpiration Experiments at 900°C
Table 18
O ro

a x 10 - 2
As
9 0 0 C
0 - 2
N As
The activity of arsenic at 900 C
Figure 26

r/K T/°C N A S P,,
i\ P T aAs
/atm /atm /atm
541 268 0.160 4.60 x 10~6 5.06 x 10"7 9.10 X 10⁻⁵
565 292 0.194 1.86 x 10"5 5.78 x 10"6 1.67 X 1 0 - 2
581 308 0.223 4.40 x 10"5 2.05 x 10~5 2.29 X 1 0 - 2
582 309 0.217 4 . 6 4 x 10"5 2.20 x 10⁻⁵ 2.34 X 1 0 - 2
609 336 0.248 1.78 x 10"4 1.22 x 10⁻⁴ 3.58 X 1 0 - 2
655 382 0.288 1.35 x 10⁻⁵ 1.17 x 10⁻⁵ 6.31 X 1 0 - 2
687 414 0.312 4 . 6 6 x 10⁻⁵ 4.20 x 10"5 8.68 X 1 0 - 2
Results of Transpiration Experiments at 1000°C
Table 19
O

A A S X L O r2
8 I
7 +
5 +
3 4-
2 I
1 +
1000 c
0 0-1 0-2
N As
The activity of arsenic in copper at 1000 Figure 27

T/K T/°C N, As P E PT aAs
/atm /atm /atm
695 420 0.285 5.796 X 10" -3 4.724 X 10~4 8.72 X 10⁻²
649 376 0.247 1.053 X 10" •3 6.658 X 10~4 5.01 X ID"2
650 377 0.250 1.098 X 10" •3 7.002 X 10"4 5.07 X ID"2
618 345 0.221 2.713 X 10" •4 1.143 X 10~4 3.22 X 10⁻²
591 318 0.195 7.367 X 10" •5 1.593 X 10⁻⁵ 1.97 X ID"2
568 295 0.162 2.190 X 10" •5 1.938 X 1 0 - 6 1.16 X ID"2
563 290 0.136 1.659 X 10" •5 6.635 X 10~' 8.90 X 10~5
Results of Transpiration Experiments at 1114°C
Table 20

a, x10"2 As
1114° C
0 0-1 0-2 0-3
N As
The activity of arsenic in copper at 1114 C
Figure 22
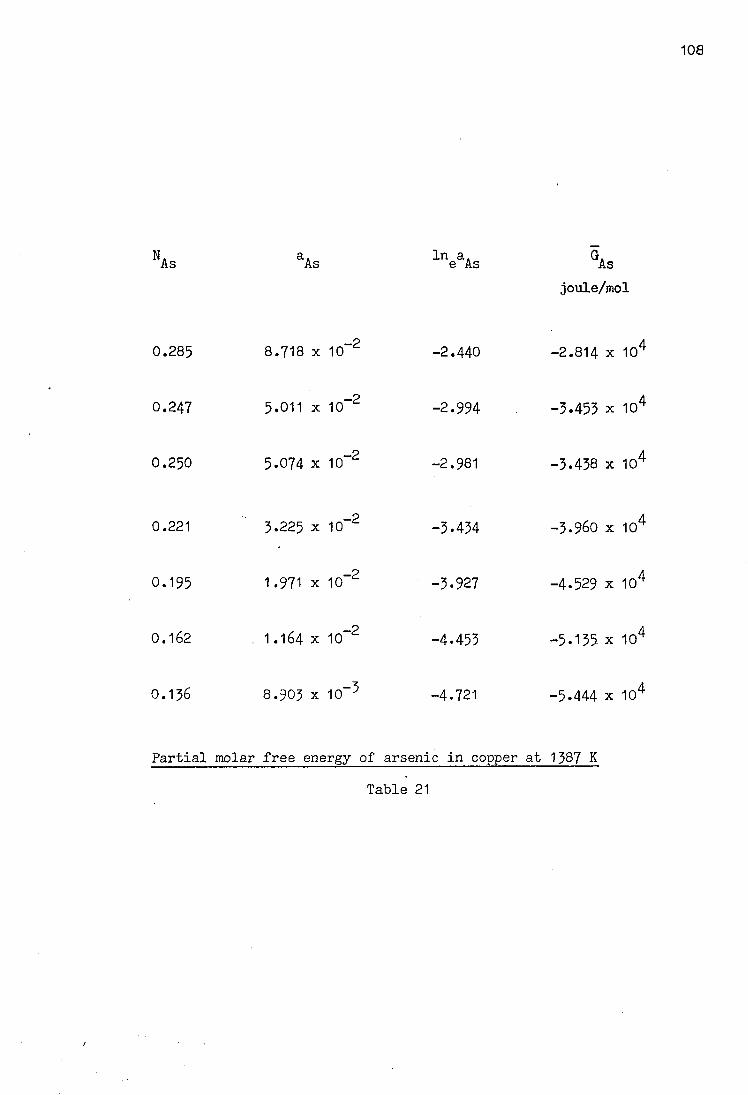
N, aA ln aA GA As As e As As joule/mol
0.285 8.718 x 10 2 -2.440 -2.814 x 10'
0.247 5.011 x 10~ 2 -2.994 -3.453 x 10'
0.250 5.074 x 10 2 -2.981 -3.438 x 10'
0.221 ' 3.225 x 10 2 -3.434 -3.960 x 10'
0.195 1 .971 x 10 2 -3.927 -4.529 x 10'
0.162 . 1 .164 x 10 2 -4.453 -5.135- x 10'
O . 1 3 6 8.903 x 10~ 5 -4.721 -5.444 x 10z
Partial molar free energy of arsenic in copper at 1387 K
Table 21

N As As L N A A O e As °As joule/mol
0.160 9.10 x 10 -3 -4.699 -4.974 x 10'
0.194 1 . 6 7 x 1 0 - 2 -4.092 -4.331 x 10
0.217 2.34 x 10 - 2 -3.755 -3.974 x 10'
0.223 2.29 x 10 - 2 -3.777 -3.997 x 10
0.248 3.58 x 10 - 2 -3.330 -3.524 x 10
0.288 6.31 x 10 - 2 -2.763 -2.924 x 10'
0.312 8.68 x 10 - 2 -2.444 -2.587 x 10
Partial molar free energy of arsenic in copper at 1273 K
Table 22

^As aAs ^neaAs GAs joule/mol
0.277 4.180 x 10"2 -3.175 -3.10 x 10⁴
0.256 3.308 x 10~"2 -3.409 -3.32 x 10⁴
0.251 2.862 x 10"2 -3.553 -3.47 x 10⁴
0.242 2.475 x 10*~2 -3.699 -3.61 x 10⁴
0.227 2.067 x 10"2 -3.879 -3.78 x 10⁴
0.210 1.573 x 10~2 -4.152 -4.05 x 10⁴
Partial molar free energy of arsenic in copper at 1173 K
Table 23

111
A G F = N B AG dn
*\ A which may be applied directly to the results
n B for the copper-arsenic system at 1387 K. This integration was
carried out graphically as the relationship between AG A g and n A g
was not known in analytic form. Extrapolation of the data for 2 activity coefficient, gave a value of approximately 2*2 x 10
o
for the activity coefficient at infinite dilution. This is
approximately constant for small amounts of arsenic therefore a
value for A G A g way be calculated for a small value, so that for
" A s = 0 ' 0 1 >
-4 a. = 2*2 x 10 + and As ln a. = -8*422 e As AG A g = -9*712 x 104 joule / mol
A G A g = -9*909 x 104 joule / mol ~ 2 n n Cu
Similar calculations were carried out for all of the
experimental compositions and the results are given in table 24.
In order to evaluate the integral,AG A was plotted against n A g
2 ~ nn Cu
in figure 29, and the areas under the curve were measured.
Having measured these areas it was necessary to multiply the
values by n p to give values for the integral free energy of L-U
solution. The results are given in table 25, and are shown on
figure 30. The activity measurements did not cover a sufficiently
large range for integral free energies of solution to be calculated
with accuracv for the other experimental tenroeratures.

112
2 N N N , , , „ wAs Cu Cu As " As' Cu 2
A G A S joule joule/molf
0.285 0.715 0.5122 -2.183 x 10⁴ -5.493 x 10⁴
0.247 0.753 0.5670 -3.452 x 10⁴ -6.088 x 10⁴
0.250 0.750 0.5627 -3-438 x 104 -6.527 x 10⁴
0.221 0.779 0.6067 -3.960 x 10⁴ -6.527 x 10⁴
0.195 0.805 .0.6480 -4.528 x 10⁴ -6.988 x 10⁴
0.162 0.838 0.7022 -5 .135 x 104 - 7 . 313 x 104
0.136 0.864 0.7465 -5.444 x 10⁴ -7.293 x 10z
Evaluation of A G ^ / N 2 ^ at 1387 K
Table 24

N A N - Area ^ G . As Cu ^ f 2 joule/mol joule/mol
0.10 0.90 -8725 -7850
0.15 0.85 -13225 -11240
0.20 0.80 -16800 -13440
0.25 0.75 -20075 -15060
0.30 0.70 -22630 -15840
Calculation of the integral free energy of solution
for copper arsenic at 1387 K
Table 25

AGAs x TO4 cal/mol
N R Cu
1114 C
/ /
+ +/
/ / /
/ +
/ /
,• +
114
r / /
O 0-1 0-2 C-3 As
Figure 30

115
— , 1 I 0-1 0-2 0-3
N
A s
Free energy of solution of arsonic in cooper at 1114 °C
Figure 30

116
3.3 The Lead-Copper-Arsenic System
The results of the experiments on the lead-copper-arsenic
system are given in tables 26, 27, 28 and 29. The results are
expressed as final mole fractions determined by weight change
and by chemical analysis where appropriate. A programme was
written to determine the change in composition based on the weight
change of a specified alloy (Appendix 3). The results were
output in two Lines, the first assuming that all of the weight
loss was due to • rsenic loss, the second on the assumption that
the lead was acting ideally in solution in the alloy, and that
it was saturating the argon passing over it. The chemical
analyses showed extremely good agreement at 1073 K with the
weight change analyses, this was probably due to the low vapour
pressure of the lead at this temperature. The computed final
compositions were often very similar for both assumptions
detailed abo^e at 1073 K.
The results at 1173 K are based on several chemical analyses
which were carried out, with particular emphasis on the analysis
of the alloys number 7* 8 and 9 which had the highest lead contents
and hence were subject to larger lend losses.
The computer programme to calculate the final composition
was also used, and very close agreement was found between the
chemical analyses and the assumption of lead saturation. The
results of the chemical analyses where they were oarried out,
ere given in the tables. The constant activity lines are plotted
on ternary phase diagrams, figures 31 > 32 * 33 and 34 . The
activity o"»" arsenic in the binary Pb-As system is taken from the

Alloy
number
Mole Percentages
Pb Cu As
Duration
mins
1 14.7 55.3 30.0
1 14.8 55.8 29.4
2 12.9 55.7 31.4
2 12.9 56.1 31.0
3 ' 23.0 48.6 28.3
4 29.2 42.7 28.1
4 29.2 42.8 28.1
5 40.7 32.1 27.2
6 47.7 27.1 25.3
6 47.7 27.1 25.2
7 54.5 23.1 22.5
7 53.9 22.8 23.3
7 53.7 22.8 23.5
8 63.6 16.3 20.1
8 63.9 16.3 19.8
9 76.2 8.3 15.4
10
15
10
15
10
19
5
15
10
12
11
12
11
13
10
15
Final alloy compositions at 800 °C with
arsenic activity set at 0.1
Table 26
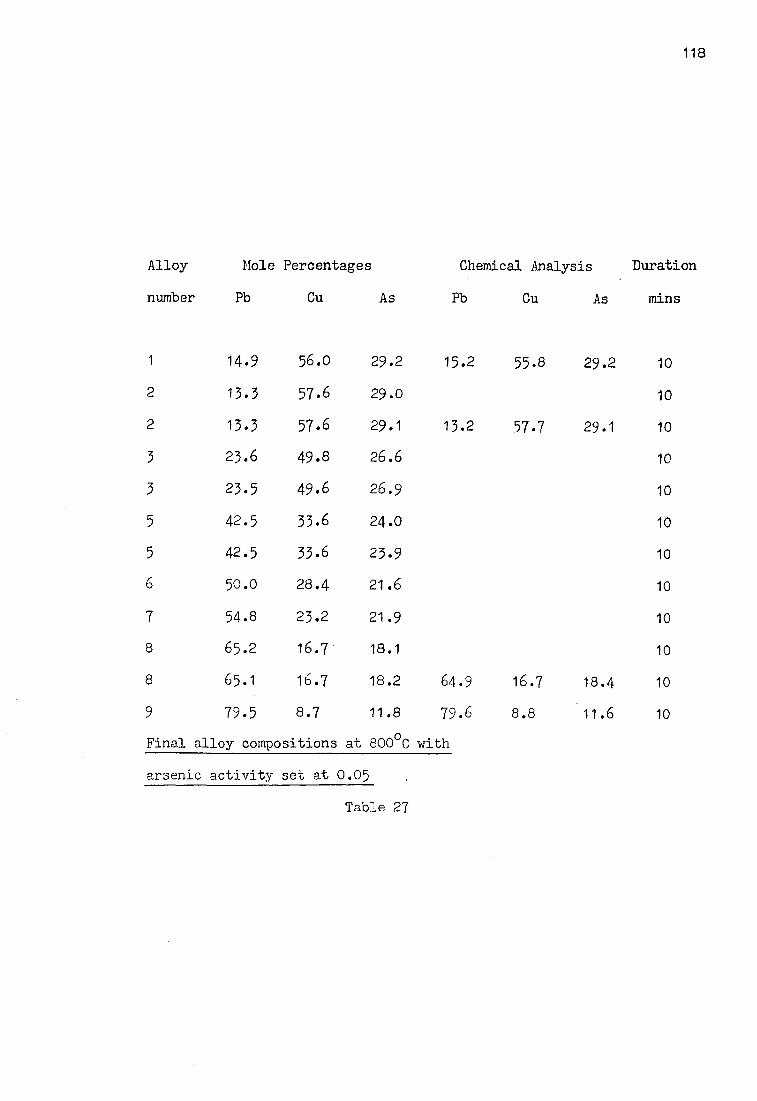
118
Alloy Mole Percentages Chemical Analysis Duration
number Pb Cu As Pb Cu As mini
1 14.9 56.0 29.2 15.2 55.8 29.2 10
2 13.3 57.6 29.0 10
2 13.3 57.6 29.1 13.2 57.7 29.1 10
3 23.6 49.8 26.6 10
3 23.5 49.6 26.9 10
5 42.5 33.6 24.0 10
5 42.5 33.6 23.9 10
6 50.0 28.4 21.6 10
7 54.8 23.2 2 1 . 9 10
8 65.2 16.7 18.1 10
8 65.1 16.7 18.2 64.9 16.7 18.4 10
9 79.5 8.7 11.8 79.6 8.8 11.6 10
Final a .lloy compositions at 800°C with
arsenic activity set at 0.05
Table 27

119
Alloy Mole percetages Chemical Analysis Duration
number Pb Cu As Pb Cu As mins
13.2 57.3 29.5 10
23.6 49.7 26.7 10
42.0 33.2 24.i 10
49.5 28.1 22.4 10
55.7 23.6 20.7 10
55.3 23.4 21 .2 55.5 23.6 21 .3 10
65.2 16.7 18.1 65.2 16.4 18.4 10
77.8 8.5 13.7 77.6 8.5 13.5 10
Final alloy compositions at 900 C with
arsenic activity set at 0.1
Table 28
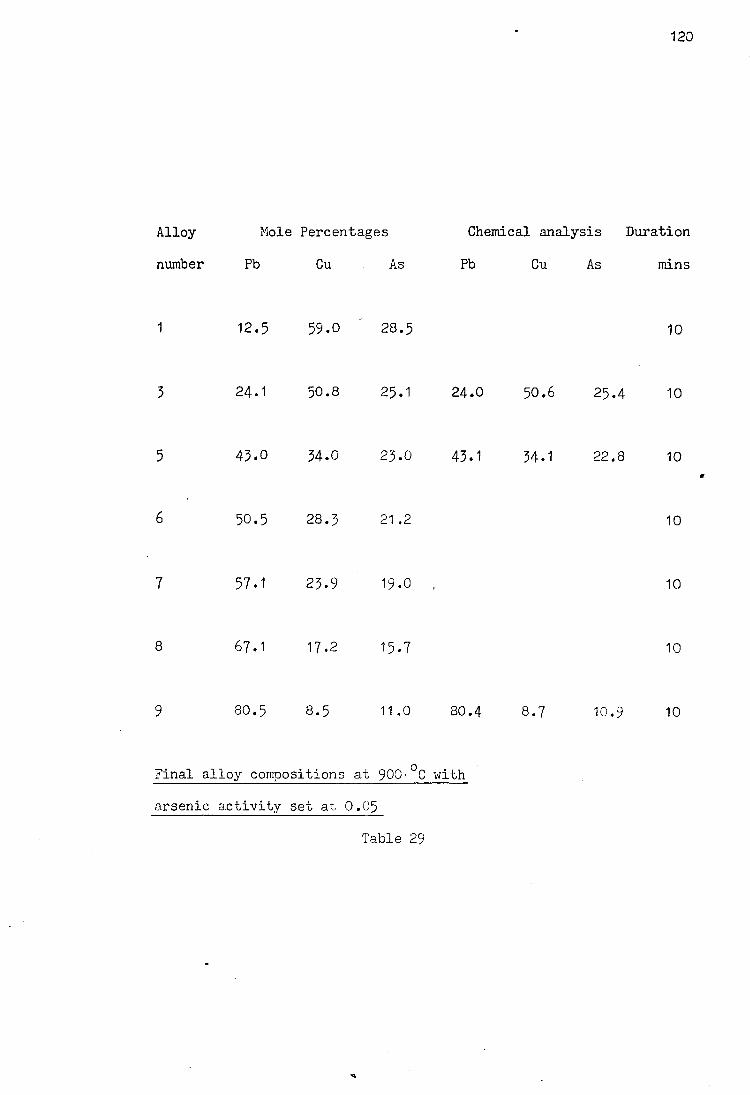
120
Alloy Mole Percentages Chemical analysis Duration
number Pb Cu As Pb Cu As mins
12.5 59.0 28.5 10
24.1 50.8 25.1 24.0 50.6 25.4 10
43.0 34.0 23.0 43.1 34.1 22.8 10
50.5 28.3 21.2 10
57.1 23.9 19.0 10
67.1 17.2 15.7 10
80.5 8.5 11.0 80.4 8.7 10.9 10
Final alloy compositions at 900- C with
arsenic activity set at 0.05
Table 29
"V

t A s
The isoactivity line, a A g = 0.1 at 800 °C in the Pb-Cu-As system
Figure 31

f A s
The isoactivity line, a A g = 0 . 0 5 at 800 ° c in the Pb-Cu-As system
Figure 32

f As
The isoactivity line, a A s = 0.1 at 900 °C in the Pb-Cu-As system
Figure 33

f As
The isoactivity line, = 0.05 at 900 °C in the Pb-Cu-As system
Figure 34

125
investigation of Predel and Emam (30). No activity measurements
were carried out on the lead-arsenic binary system in this study.
Two lead-copper-arsenic alloys were prepared which had very high
copper to lead ratios, however, there was insufficient arsenic
dissolved in these alloys for equilibration to take place by
evaporation of arsenic into the gas stream. If the equilibration
had taken place it would have meant waiting for the alloy to pick
up arsenic from the vapour. This would have lead to long
experimental times and large lead losses.

126
3.4 Mass Spectrometry
The mass-specrometer was used to analyse the vapour from
three Knudsen cells, these contained pure arsenic, copper with
0*2$> by weight of arsenic and pure copper. The pure arsenic was
heated to a relatively low temperature, before the As^+ peak
was identified, around 330°C. The mass number vernier scale had
already been calibrated, using internal standards, so the other •F + + peaks As^ , As^ and As^ were easily identified. The peak
heights diminished when the molecular beam was rotated away from
the ionising source, however the background was gradually rising.
The copper-arsenic sample was heated to 1100°C but the Cu +
peak was not observed. It was thought that the vernier scale
could have been incorrectly calibrated. A pure copper sample was
next used, to ensure the maximum amount of effusate from the
graphite cell which was for high temperatures. The copper was
placed into the alumina crucible within the graphite cell. The
whole assembly was then put into the spectrometer. The cell was
then heated to 1600°C. The copper peak was not observed, nor did
any of the neighbouring peaks diminish when the cell was rotated.
The cell orifice was not blocked. It appears that the vapour
pressure of copper was too low to be detected, so the sensitivity
of the mass-spectrometer was below its optimum. As the copper
peak could not be observed no further experiments were carried out
on the mass-spectrometer.

CHAPTER 4
DISCUSSION

128
4.1 Experimental Technique
The transpiration technique is an extremely useful experi-
mental method for equilibrating a condensed phase with vapour
phase. There were two unusual complications in this work, the
fact that arsenic forms a complex vapour and the fact that lead
exerts a considerable pressure above its melting point.
The copper-arsenic system had been studied before this work was
started (18), however the previous study was of limited scope,
since one temperature only was used. The workers did not recognise
the seriousness of the problems of working with a complex vapour,
although they noted that the As^ molecules would dissociate but
to an unknown extent. Data on the thermodynamic properties of
arsenic were used to calculate the composition of arsenic vapour
in the present work, and to calculate the activities of As^ relative
to a liquid arsenic standard state. A solid state had been used
in all previous investigations.
A volatile component in the liquid phase was clearly going to
be a problem and this inevitably led to compromises in operating
temperatures for the study on the Pb-Cu-As system. Fortunately it
was found that the arsenic in -the alloy came to equilibrium with
the vapour phase very quickly. The lead losses did not become
significant, so the system was operating near equilibrium.
The technique used with this apparatus was generally successful,
one problem was designing an apparatus which would satisfy the
laboratory authorities that the equipment was safe. The apparatus
which finally used was located in an enclosure protected

129
against accidental ingress of water. The furnace used to heat the
arsenic had a low thermal capacity and could easily be removed
from the apparatus. This meant that the arsenic could be cooled
very quickly if the need arose. The cabinet containing the
furnace arrangement was operated at a slight negative pressure
and there was an extremely strong draught when one of the access
doors were opened.
The apparatus proved reliable and equilibrium of the droplet
with the vapour was rapidly attained, as was shown by some prelim-
inary experiments. The main problem was removing the droplet from
the system without losing any of the arsenic. This problem was fin-
ally overcome by removing the droplet in one swift operation and
quenching it in distilled water.
The problem of monitoring the approach to equilibrium can be
overcome by carrying out the experiments on a microbalance, the
boat with the alloy in is put on the balance and then the weight
change throughout the experiment is measured. This technique is
particularly useful as there can be no doubt about the equilibrium
arsenic concentration. The main problem is designing the remainder
of the apparatus around the microbalance. The gas flow has to be
deflected so that it has no effect on the balance. Time and
resources did not allow this technique to be explored.
The mass spectrometer was used to detect the vaoour species
from samples containing arsenic. The problem was the wide difference
of vapour pressures between copper and arsenic. The technique
had been used to great effect in the past, but in this instance
the alloys were not suitable. The mass spectrometer may have

130
been useful at very low arsenic concentrations, but to calculate
the activity of arsenic, the data would have to be an extension
of the activity-concentration data from the transpiration
experiments.

131
4.2 The Copper-Arsenic System
To compare the current work with earlier investigations, it
is necessary to convert all of the activity data to a common
standard state. With the data which is available regarding the
vapour composition of arsenic, it is possible to recalculate the
arsenic activities frora..the data of Jones and Philipp (25). It
is also possible to convert from the hypothetical solid arsenic
standard state to a liquid arsenic standard state. The data of
Jones and Philipp as revised by Lynch (28) are converted to a
liquid arsenic standard state and are given in table 30. The
resulting data are plotted in figure 35 • It is then possible to
compare directly the two series of data. The two graphs are
given together in figure 36 . The present work is the upper curve
representing experiments carried out at 1387 K (1114°C). Clearly
for a given arsenic activity, Jones and Philipp introduced more
arsenic into the alloy. The difference between the two lines de-
creases as the activity increases, no explanation of these
discrepancies has been found. In view of the experimental tech-
nique of Jones and Philipp it was expected that they would have
found a lower arsenic concentration at each arsenic activity.
Their experimental technique involved slowly cooling the droplets
in a stream of arsenic laden argon. This approach led to a
considerable loss of arsenic in earlier experiments carried out
in the present investigation.
4.2.1 Variation of Activity Coefficient with Composition
It is possible to analyse the activity data from binary
alloys 'n several different ways. One of the most common tech-

T/K NAs PAs4 aAs 4 aAs 4s M s
5 4 3 0.174 6 . 0 1 x 1 0 " 8 2.64 x 10~5 0.682 4.93 x 10"3 2.84 x 10""2 - 1 . 5 5
553 0.197 2.39 x 10""7 3.73 x 10"5 0.645 6.97 x 10~3 3-54 x 10" 2 - 1 . 4 6
573 0.217 2.01 x 10"6 6.35 x 10~5 0.613 1.19 x 1 0 " 2 5.47 x 10"2 -1.26
584 0.228 5 . 4 0 x 10"^ 8 . 1 3 X 10""5 0 . 5 9 6 1 . 5 2 X 1 0 " 2 6.66 x 10"2 -1.18
609 0.250 4.36 x 1 0 " 5 1.37 x 10"2 0.563 2.56 x 1 0 " 2 1.02 x 1 0 " 1 -0.99
634 0.263 2.02 x 10"4 2.01 x 10"2 0.543 3-76 x 10~*2 1 . 4 3 x 10"1 - 0 . 8 5
644 0.267 3-58 x 10"4 2.32 x 10~2 0.537 4.33 x 10"2 1.62 x 10~1 -0.79
654 0.270 6.01 x 10~4 2.64 x 10*"2 0.533 4.93 x 10"2 1.83 x 10"1 -0.74
Data from Lynch Data revised to liquid standard state
Data of Jones and Philipp revised to a liquid arsenic standard state
Table 30

133
dA x102 As
0 0-15
1100 C
0-2 0 0-25 0-30 N A S
The activity data of Jones and Philipp converted to a
liquid arsenic standard state
Figure 35

9n Arsenic Activity
dAs*io"2
154
8 4
7 1 3 8 7 K /
This investigation
4 - I
3 4
1 -
1 3 7 3 K
Data of Jones and Philipp
0 I 0-125 0-150
N As
0-200 0-250 0-300
Comparison of the results of this investigation with those
of Jones and Philipp; relative to a liquid arsenic standard state
Figure 56

I 155
niques is to plot activity aguiusb mole fraction. In some
instances, the variation in activity is very large and the log P
of the activity coefficient is plotted against (1 - mole fraction),
A regular solution yields a straight line of constant slope. Two
more general results of such plots are; two linear portions or a
linear portion and a curved portion. Where there is a linear
relationship it is easier to describe the activity as a function
of composition. The calculation of log ^ A s and (1 - a r e
given in tables 31, 32 and 3 3 for each of the experimental
temperatures and the results are shown on figures 57, 58 and 59 ,
Each of the graphs is linear over a range and here the equation
of the best straight line has been calculated.
At 900°C, in the range N A g = 0-210 to 0-280, l o^10 ^As = - 2 , 9 9 2 ^ C u + ° ' 7 4 5 9
At 1000°C, in the range = 0-160 to 0-310,
l o S l 0 y A s = - 2 ' 9 7 5 N 2 C u + 0-8555
At 1114°C, in the range NAs = 0-195 to 0-285
L O S L 0 V = ~ 3 . 5 5 7 ^ + 1 . 1 6 7 '
The revised data of Jones and Philipp were also treated this
way and the results are shown in figure 40, No linear fit was
found to be suitable over a reasonable range.
4.2,2 The Activity of Copper in Copper-Arsenic Alloys
The activity of the second component in a binary system may
be determined from the activity of the other by application of
the Gibbs - Duhem equation, which was given as;
^ d In a^ + N 2 d. ln a 2 = 0 (1)

N A S 4 aAs ^As l 0 ^ A s
0.277 0.5230 4.180 x 10""2 0.1510 -0.821
0.256 0.5441 3.308 x 10~ 2 0.1294 -0.888
0.251 0.5661 2.862 x 10" 2 0.1140 -0.943
0.241 0.5764 2.475 x 10~2 0.1023 -0.990
0.227 0.5980 2.067 x 10" 2 0.0912 - 1 . 0 4 0
0.210 0.6246 1.573 x 10"2 0.0750 -1.125
Calculation of arsenic activity coefficient at 1173 K
Table 31

137
- 0 - 8
-0-94
-1-04-
-1-1
-1-2
Lg Y y10 As
-I 1-
0-64 0-62 0-60 0-58 0-56 0-54 0-52
N Cu Variation of activity coefficient with composition
Figure 37

138
N. N 2 aA VA logV. As Cu As As & As
0.160 0.7059 9.10 x 10~5 5.69 x 10~2 -1.245
0.194 0.6501 1.67 x 10"2 8 . 6 3 x 10"2 -1.064
0.223 0.6033 2.29 x 10"2 0.1027 -0.988
0.217 0.6134 2.34 x 10"2 0.1077 -0.968
0.248 0.5661 3.58 x 10~2 0.1446 -0.840
0.288 0.5075 6.31 x 10~2 0.2207 -0.658
0.312 0.4740 8.68 x 10~2 0.2787 -0.555
Calculation of arsenic activity coefficient at 1273 K
Table 32

1000 c t
f / /
- F
% /
/
1-C 0-9 0-8 o r 0-5 0-5
N R Cu Variation of activity coefficient with composition
Figure 58

140
N A S N C U aAs l 0 ^ A s 2
aAs
v - 2 0.285 0.5122 8.72 x 10 0.2870 -0.5422
0.247 0.5670 5-01 x 10""2 0.2029 -0.6928
0.250 0.5627 5.07 x 10~2 0.2030 -0.6926
0.221 0.6067 3.22 x 10""2 0.1459 -0.8360
0.195 0.6480 1.97 x 10"2 0.1011 -0.9954
0.162 0.7022 1.16 x 10"2 7.185 x 10"2 -1.144
0.136 0.7465 8.90 x 10"2 6.547 x 10""2 -1.190
Calculation of arsenic activity coefficient at 1387 K
Table 33 / I / Y V

141
Lg V 10 As 1114- C
- 0 - 5
-0-7
-0-9
- M
1-3
-1-5 1 0 0-9
V 0 - 8 0-7 0 6 0-5
N Cu
Variation of activity coefficient with composition
I Figure 39

I G y I<> As
- V O H
Revised data of Jones and Philipp
Figure 40

143
which leads to;
In a1
and similarly
I n K , = -
rN = N / v riN1 W1 N 2 d In a 2 (2)
~ N1 N 2 d In 2 (3)
Unfortunately this integration would involve the evaluation of
the area under a curve which extends to infinity. To improve
the accuracy it is possible to use a function, such that
(X = In Y± (4)
(1 - N.)2
2 2 For a two component system (1 - N^) = N 2 so
/>( = In 1 and o^ = in 2 (5) P 2
V N 1
By combination of the equations (3) and (5) Darken and Gurry (44)
arrived at;
In 1 <Z \ <Z \
K 1
= "" ° 2 N 1 N 2 " P 1 " N L ^ D N 1 ( 6 )
V = 1
The activity data from the transpiration experiments can
now be used to calculate the activity of copper by substitution
of the data for arsenic as component 2 into equation (6). The
(/function was calculated for arsenic at each experimental
temperature, and then the values of D(were plotted against N ^
in order that the area bounded by the curve could be measured.
The results are given in tables 34, 35 and 36 and figures 41 ,
42 and 43. Application of equation (6) to the copper-arsenic
system gives;
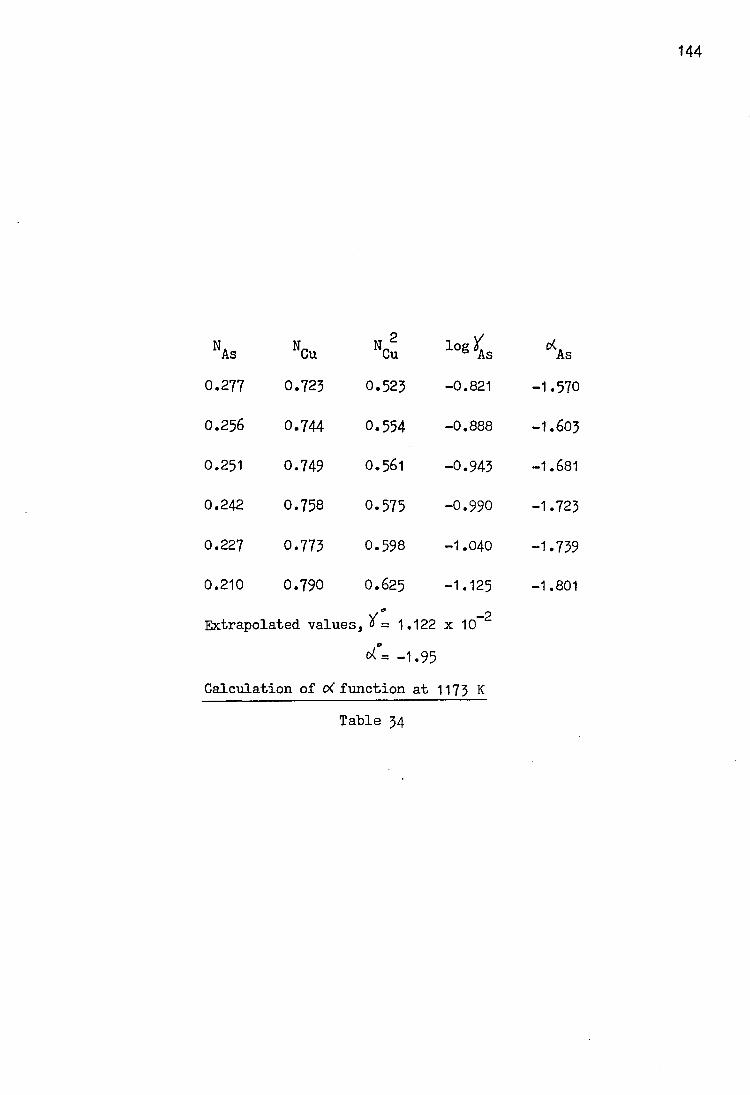
144
N A N P N 2 logi( ciK As Cu Cu 6 As As
0.277 0.723 0.523 -0.821 -1.570
0.256 0.744 0.554 -0.888 -1.603
0.251 0.749 0.561 -0.943 -1.681
0.242 0.758 0.575 -0.990 -1.723
0.227 0.773 0.598 -1.040 -1.739
0.210 0.790 0.625 -1.125 -1.801 Y ° - 2 Extrapolated values, 0 = 1.122 x 10
oU -1.95 Calculation of oC function at 1173 K
Table 34

145
N A N P N 2 log £ <* As Cu Cu & As As
0.160 O.84O 0.706 - 1 . 2 4 5 - 1 . 7 6 4
0.194 0.806 O.65O -1.064 -1.637
0.223 0.777 0.603 -0.988 -1.638
0.217 0.783 0.613 -0.968 -1.578
0.248 0.752 O . 5 6 6 -0.840 -1.484
0.288 0.712 0.508 -0.658 -1.297 0.312 0.689 0.474 -0.555 -1.171
Extrapolated values, X = 1.58 x 10~
<X°= - 1 . 8 0
Calculation of (X function at 1273 K
Table 35
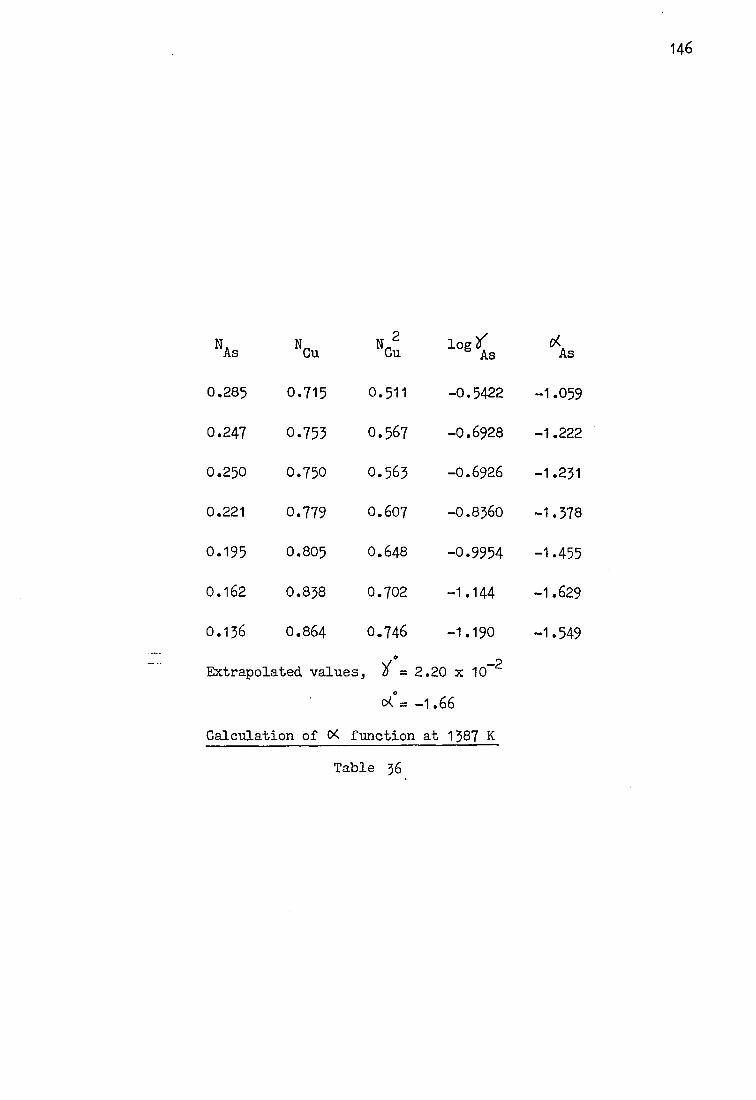
146
N a N N 2 log*' As Cu Cu & As As
0.285 0.715 0.511 -0.5422 -1.059
0.247 0.753 0.567 -0.6928 -1.222
0 . 2 5 0 0.750 O . 5 6 5 - 0 . 6 9 2 6 -1.231
0.221 0.779 0.607 -0.8360 -1.378
0.195 0.805 0.648 -0.9954 -1.455
0.162 0.838 0.702 -1.144 -1.629
0.136 O.864 0.746 -1.190 -1.549
Extrapolated values, )! = 2.20 x 10~2
= - 1 . 6 6
Calculation of <X function at 1387 K
Table 3 6
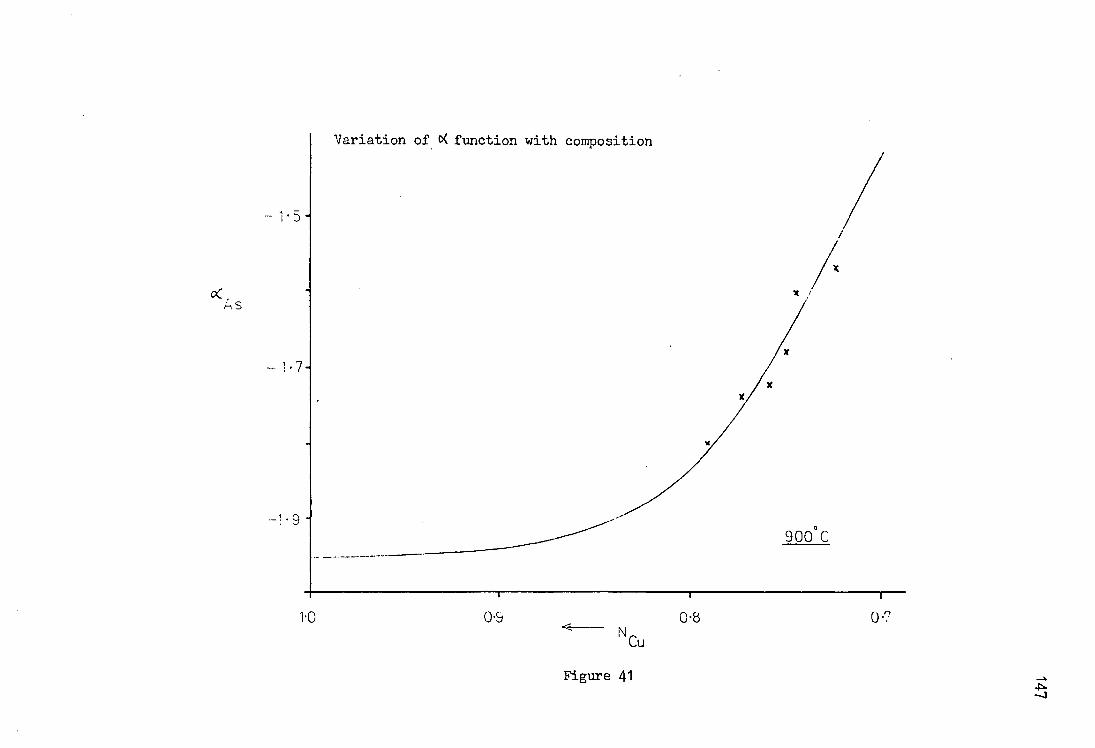
Variation of d( function with composition
- 1 - 5 H
H S
-1-7-1
1-0 0-9
Figure 41
900 C
0-8
—J

Figure 42 OO

Variation of d function with composition
1-3 r
1 - 5 !-
1 :7 L
1 - 0 0 - 9 N
C U
Figure 43
1114 °C
0-8 0 - 7

150
1 0 B „ X . = " * N.. * "fNCu = V 0fAs d N J
N„ = N, 10 Cu Cu As As | As As
N„ = 1 Cu Calculated values of 311(1 h e nce a C u are given in table
37. The activity of copper in solution in copper-arsenic alloys
with N A s up to 0*30 at 1114°C is shown in figure 44.
The results for the activity of copper can be compared with
the measurements of Azakami and Yazawa (26), they used an
electrochemical technique to measure the activity of copper at
1273 K. They found that the activity coefficient could be
represented by log = -5.285 N^ 2 + 0.0853 (N A g> 0.025). The
The activities of copper calculated from this investigation are
slightly higher at each composition, for example at N^ = 0.8,
a^ is 0.65 compared to 0.60 reported by Azakami and Yazawa.
The corresponding arsenic activities are similarly higher with
= 1.6 x 10~2 compared with = 4.0 x 10~~5 in the earlier
investigation, both relative to a liquid arsenic standard state.

T/ °C N As Nn xN. Cu As As Value of integral
- 2 1114 °C 0.95 7.8708 x 10~2 -8.285 x
1114 °C 0.90 0.14805 -0.1655 1114 °C 0.80 0.2320 -0.32175 1114 °C 0.70 0.1995 -0.4550 1000 ° c 0.95 8.5358 x 10~2 -8.985 x 1000 ° c 0.90 0.1611 -0.17962 1000 ° c 0.80 • 0.2728 -0.3630 1000 ° c 0.70 0.25725 -0.5060 900 °C 0.95' 9.253 x 10"5 -9.740 X 900 ° c 0.90 0.1746 -0.19471 900 °C 0.80 0.2936 -0.3850 900 ° c 0.70 0.2982 -0.5490
, - 2
. - 2
Calculation of copper activity in copper - arsenic alloys
Table 37
log10*Cu YCu aCu
•4.143 x 10~"3 0.9905 0.9410 •1.745 x 10"2 0.9606 0.8646 •8.975 x 10"2 0.8132 0.6506 •0.2455 0.5682 0.3977 4.4925 x 10⁻⁵ 0.9897 0.9402 •1.852 x 10"2 0.9583 0.8625 •9.02 x 10""2 0 .8124 0.6499 •0.2486 0.5641 0.3949 •4.87 x 10"3 0.9888 0.9394 •2.011 x 10"2 0.9548 0.8593 •9.140 x 10"2 0.8102 0.6482 •0.2508 0.5613 0.3929

The a c t i v i t y of copper i n c o p p e r - a r s e n i c a l l o y s a t 1 1 1 4
Figure 44

155
4.3 The Lead-Copper-Arsenic System
The activity measurements in the. lead-copper-arsenic system cannot be compared with any other investigation. The results are interesting because of the large amounts of arsenic in the alloys for a set arsenic activity even when the proportion of lead is high. It was possible that at 900°C the experiments may have become more liable to problems due to the high vapour pressure of lead. In some instances the vapour pressure of lead was comparable to that of the arsenic in the incoming argon. It appears that rather than the rate of arsenic arrival being a major factor, the rate of arsenic evaporation from the alloy became predominant. There are two observations to support this view, firstly the very short equilibration time, and secondly the very fast rate at which the arsenic activity rises as its mole fraction is increased. This means that the vapour pressure of arsenic above the alloys, in this range is relatively high. As the vapour pressure of arsenic was so much higher than lead, for most of the experimental time the mode of operation was similar to a transpiration experiment where arsenic loss from a lead-copper-arsenic alloy in a pure gas stream is found. These experiments were carried out close to equilibrium. The variation of the isoactivity curves with temperature may be seen by comparing the 0*1 activity contour at 800°C with that at 900°C(Figure 45). The upper curve represents the results at 800°C, increasing the temperature tends to decrease the mole fraction of arsenic at each Pb/Cu ratio, at a constant arsenic activity which was the expected result. The effect of temperature is greatest in the region where the Pb/Cu ratio is around unity. The same effect may be seen by comparing the 0*05 arsenic activity contours at 800 and 900°C (Figure 46). The

1
D O

t As
0-05 As Activity at 800 and 900° C
F i g u r e 46

156
upper line represents the results at 800°C. The amount of diver-gence between the lines is smaller than for the 0-1 activity lines.
As was noted earlier there is a miscibility gap in the Pb-Cu-As system up to a temperature of around 1065°C. None of the droplets showed any signs of having separated into two phases, to any serious extent, so that it is considered likely that all of the experiments were conducted outside the miscibility gap. When samples were accidentally produced within the miscibility gap, the fact was easily detected by the appearance of the sample.
The position of the miscibility gaps quoted from earlier investigations may be compared with the position of the isoacv tivity lines. The initial comparisons are between the 0-1 arsenic activity contour at 800°C and the reported miscibility gaps from three previous investigations. The first figure (Figure 47) shows the miscibility gap at 900°C as determined by Hino, Azakami and Yazawa (34). The activity line rises through the miscibility gap at the high lead end and then runs parallel to its edge. The second figure shows the same activity contour and the miscibility gap found by Dice, Oldbright and Brighton (31) at 700°C (Figure 48 )# The edge of the miscibility gap moves up to run parallel to the activity contour, from the lead rich end, they cross for a short distance before diverging. Increasing the temperature would have caused the miscibility gap to recede, and its edge would probably have run parallel to the activity curve. The third figure shows the data of Jacobs, Maes, and de Stryker (33) also at 800°C. This time the two sets of data are close at the high lead side of the diagram, and the general trend is for the two sets of data to converge in the copper rich region, (Figure 49).

f As
Comparison of the position of the 0-1 arsenic activity line at 800 °C and the miscibility gap found by Hino, Azakami and lazawa at 900 °C
Figure 47

f As
N —> Pb Comparison of the position of the 0«1 arsenic activity line at 800 °C and the
miscibility gap found by Dice, Oldbright and Brighton
F i g u r e 46

t As
N Pb
Comparison of the 0.1 arsenic activity line at 800 C with the miscibility gap found by Jacobs, Maes and de Stryker at 800 °C
Figure 49

160
4.4 Practical Results and Implications
As a result of this work, the cooling of metal tapped from a complex smelter is better understood. If a purely Pb-Cu-As bullion is tapped, it is unlikely to contain a mole fraction of arsenic greater than 0.05. Whatever the Pb:Cu ratio the arsenic activity is very low. The metal is tapped at around 1150 °C, above the temperature at which the miscibility gap exists. As the metal cools it enters the miscibility gap and separates into two phases one copper-rich with the majority of the arsenic, the other a lead-rich phase. The composition of the two equilibrium phases • changes as the temperature falls and the position of the miscibility gap alters.
The activity of arsenic will be the same in each of the phases if they are at equilibrium, so the general position of the tie-lines can be predicted. The activity of arsenic is far lower in copper than in the corresponding lead alloy, so if the metal were to separate into two binary, lead-arsenic and copper-arsenic, phases then the tie-lines would cross the miscibility gap radiating out from the lead rich corner across towards the copper-arsenic side of the phase diagram. The presence of lead in the copper-rich phase and vice versa tends to cause the tie-lines to become more parallel to the lead-copper side of the ternary phase diagram.
The very low activity of arsenic in copper leads to the formation of the speiss phase, and as the lead-rich phase cools the copper comes out of solution and the products are a low arsenic lead bullion phase and the copper arsenide with some entrained lead.

161
Appendix 1
A programme was written in the "FORTRAN" programming language for use on the time-shared facility of the college computer (Cyber 174)• The programme calculated the extent of dissociation of As^ molecules on being heated from evaporation temperature to the furnace hot zone temperature. The required data for the execution of the programme were the source vapour pressure of arsenic and the hot zone temperature. The programme works by converging on the correct value and the programme terminates when consecutive values are equal. The values produced by each iterative step are printed, an example of the execution of the programme and a listing of it are given overleaf.
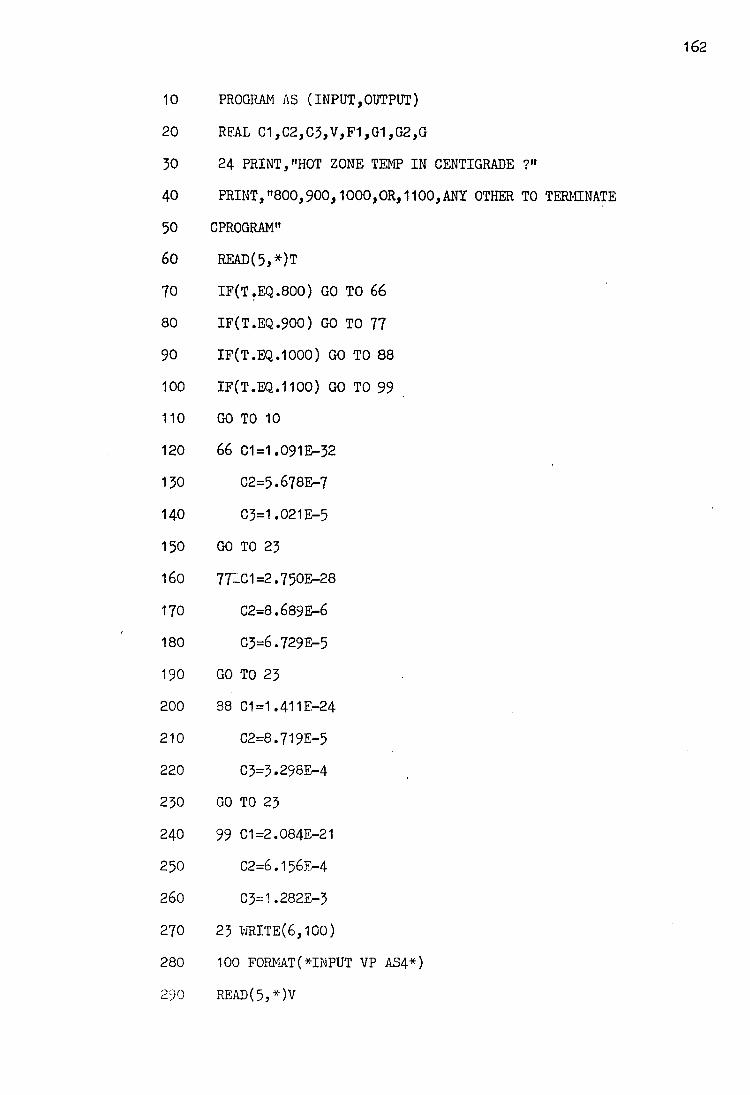
10
20
50 40 50 60
70 80
90 1 0 0
110
1 2 0
130 140 150 1 6 0
170 1 8 0
1 9 0
200 210 220 230
240
250
260
270
280
290
PROGRAM AS (INPUT,OUTPUT) REAL C1,C2,C3,V,F1,G1,G2,G 24 PRINT, "HOT ZONE TEMP IN CENTIGRADE ?" PRINT, "800,900,1000,OR, 1100,ANY OTHER TO TERMINATE CPROGRAM" READ(5,*)T IF(T.EQ.800) GO TO 66 IF(T.EQ.900) GO TO 77 IF(T.EQ.IOOO) GO TO 88 IF(T.EQ.HOO) GO TO 99 GO TO 10 66 C1=1.091E-32
C2=5.678E-7 C3=1.021E-5
GO TO 23 77CC1=2.750E-28
C2=8.689E-6 C3=6.729E-5
GO TO 23 88 C1=1.411E-24
C2=8.719E-5 C3=3.298E-4
GO TO 23 99 C1=2.084E-21
C2=6.156E-4
C3=1.282E-3 23 ¥RITE(6,100) 100 FORMAT(*INPUT VP AS4*) READ(5, *)V

2059
500 PRINT, "AS4 AS5 AS2 AS »
510 X=1E-12
520 DO 500 1=1,20
330 F1=X+0.75*((X*C5)**0.75)+0.5*((X*C2)**0.5)
340 F2=0.25*((X*C1 )**0.25)-V
350 F=F1+F2
560 G1=1 +0.5625*C5*( (X*C5)**(-0.25) )+C2*0.25*(X*C2 )**(-0.5)
370 G2=0.0625*01*((X*C1)**(-0.75))
580 G=G1 +G2
390 A=X
400 X=X-F/G
410 IF(A.EQ.X) GO TO 82
420 Y=(C1*X)**0.25
430 Z=(C2*X)**0.5
440 T=(C5*X)**0.75
450 VJRITE(6,53)X,Y,Z,T
460 55 FORMAT (1X,E12.6,4X,E12.6,4X,E12.6,4X,E12.6)
470 500 CONTINUE
480 82 PRINT, "INPUT 1 IF NEXT- READING AT SAME TEMP"
490 READ(5,*) K
500 IF(K.EQ.1) GO TO 25
510 GO TO 24
520 10 STOP
530 END
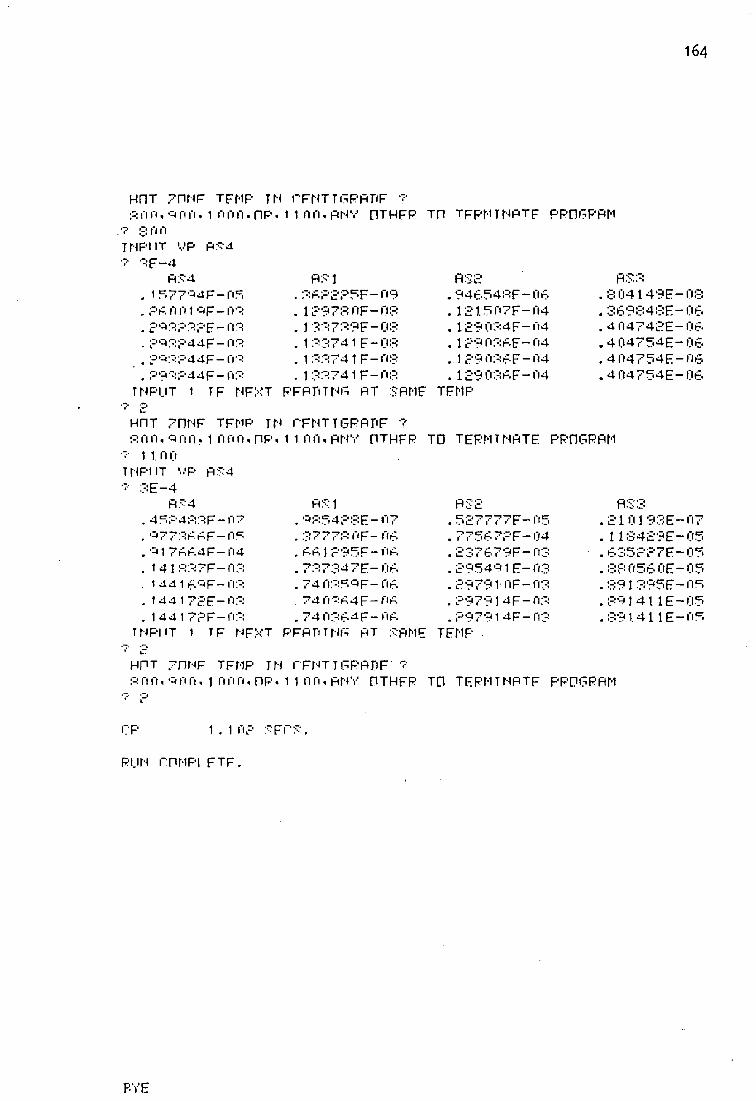
164
HnT 7PNF TFMP TN rFNTTFPFmF ? s n n, 'H n n, 1 rin n . np • 11 n n, rnv dthfp tp tfpm tnptf ppcifprm
V- son TNPIIT VP RR4 •:•• R F - 4
R : " " 4 . 1 S 7 7 Q 4 F - I " I F . . P A I'I 0 1 R F - 0 3 . P R R P R P E - 0 3 . F Q : - : P 4 4 F - N " : . P ' Z , P P 4 4 F - L T " : , ; - ' 9 ~ : ; - 4 4 F — O R INPUT 1 TF NFXT PFPT"iTNR RT SPME TFMP
R:"' 1 RS? PR 3 Ap 2PP F-H9 . 94F,fi4RF— AR .8 04149E-08
. 1 ?9 7 R I*I F-0? . 121.P07F-04 .3A9848E-OA
. 1 739F-08 .129034F-04 . 4I-I4742E-OA
. 1 741E-OR . 1 ?9 03 AF-04 .4 04754E-OA
. 1 74 1 F-O.R .1P903AF-04 .4 04754F-OA
. 1 741F-OR .129ORAF-04 .4 04754E-OA
HnT 7PNF TFMP TN I'FNTTGRPPF ? Rfi0, Rfifi, 1 finfi,PR,11 nn, RNV riTHFP TO TERMT NRTE • 11. o o
PRHGRRM TNPIIT v p V 3 E - 4
R S 4
R.--4 PR 1 RS? RS3 . 4PP4RRF— 07 . '3RP4P8F- 07 . f<c7777F-o5 .210193E-07 .R773AAF-OF .3777ROF-OA .775A7PF-04 .118429F-OP . '1 7AA4F-04 .AA1P95F-OA .237A79F—OR .A35PP7F-OP .141R37F-03 .737347E-OA .295491E-03 .83058OF-OP .1X41FQF-03 . 74 ORP' F— OA .P9791 OF-OR .891395F-OP .14417?F-u3 . 74 03A4F-OA .P97914F-03 ..99J41 1E-np . 14417?F — OR .74 0RA4F—OA .P97914F-03 .891411E-OP TNPIIT 1 TF NF T pfrotnf rt srme TFMP •
c. HPT 7PNF TFMP TN CFNT TPPHTIF 7 R fl fl * I'l fl, 1 I'l 0 I'l, PP. 11 no,rnv dthfp TCI tfpmtnrtf pppg PRM
CP 1.1i*i? SFCS.
PUN rPMPI FTF.
PYE

165
Appendix 1
A computer programme was written in the "FORTRAN" programming language for use on the college computer (Cyber 174) time-shared facility. The programme used the derived analytical function of AGevap for 4As^?=iAs4£gj against temperature in K. The vapour pressure of arsenic was calculated at one degree intervals in the range from 473 to 683 K. The time to transport 1 gramme of arsenic at various gas flow rates was also calculated by varying the value of GASF in the programme.
The programme is given overleaf.

166
10 PROGRAM VA?OUR(INPUT,OUTPUT,TAPE 5=INPUT,TAPE 6=0UTPUT) 20 GASF =75 30 FLOW = GASF/22400 40 DO 1 N=473,683 50 T=N 60 Y1=-1.75181E-7*((T)**3) 70 12=1.517244E-3* ((T)**2) 80 Y3=-1.173787E1*T 90 Y4=9.23726E3 100 Y=Y1+Y2-+Y3+Y4 110 P=EXP(-Y/(1.9872 *T)) 120 p=p**4
130 VAPN=P*FLOW/(1 -P) 140 GSAS=VAPN*74•92*4 150 T1=1/GSAS 160 N1=N-273 170 VJRITE(6,20) N,N1,P,T1 180 20 F0RMAT(1X,I3,10X,I3,10X,E12.6,10X,E12.6) 190 1 CONTINUE 200 STOP 210 END

167
Appendix 1
A programme was written in "FORTRAN" for use on the time-shared facilty of the college computer (Cyber 174). The programme was used to calculate the final composition of alloys of lead, copper and arsenic which had equilibrated with the vapour phase. The data required for the execution of the programme are; 1) Start weight of the droplet 2) Final weight of the droplet 3) Alloy number 4) Vapour pressure of lead at the hot zone temperature 5) Duration of the experiment
The output from the programme are; 1) The final composition of the alloy assuming no lead loss 2) The final composition of the alloy assuming that the lead in the
alloy forms a Raoultian solution
The data on the alloys is stored in a..file called "datal". This data is loaded by using a short procedure file which then executes the programme. The procedure file, the data file and the programme are given overleaf, together with an example of the output from the execution of the programme. The. first line of output is the calculated composition assuming that there is no lead loss.

The procedure file is executed by typing "-alloy" The input data are preceded by "?" A typical run follows ;
-alloy INPUT START WEIGHT IN GRAMMES ? .3544 INPUT ALLOY NUMBER ? 5 INPUT FINAL WEIGHT IN GRAMMES ? .3480 MAX.LEAD LOSS IS 8.09741E-4
GIVEN BELOW ARE MOLE FRACTIONS OF EACH IN FINAL DROPLET MOLES AS MOLES CU MOLES PB .284431 .315844 .399725 .285065 .312313 .402622
INPUT START WEIGHT IN GRAMMES ? 1
.101 CP SECONDS EXECUTION TIME /

:" ETFL»500 oo RFT/CHRNRF MNF5. T =f'HRNFF. fc". F:=F'PnR 1 i"FT* PR TR 1
PRPR1 ^DRTpr:, PFROV.
F'FRTIV.
•0. 3886 . 3347 . 3 1 1 £ .31 12
. pp. 06 p 9 pe,
. 8 ' 6 J 4
. P4-4.F
. 5 3 1 * 1 5
. 5 4 I " I Q
. 48:57
. 4 O*5:?
. 3065 - 86 05 . 81 03 . 1 444 . 0784 . 1 4 06: . 1 846 . 88 01 .8786 . 38:76 . 458:7 . 4 6 6 8 . 5641 . 6 6 1 8

10 PROGRAM CHANGE (INPUT, OUTPUT, DATA1, TAPE7=DATA1) 20 DIMENSION A(9),P(9),WA(9),WP(9),WC(9) 30 REAL LOSS,MA,MC,MP 40 READ (7,*)A 50 READ (7,*)C 60 READ (7,*)P 70 20 PRINT, "INPUT START WEIGHT IN GRAMMES" 80 READ (5,*)X 90 IF(X.GT.0.95) GO TO 50 100 PRINT,"INPUT ALLOY NUMBER" 110 READ(5,*)I 120 PRINT"INPUT TIME IN MINUTES" 130 READ (5,*)N 140 Z=A(I)*74.92 150 V=P(I)*207.2 160 F=C(I)*63.5 170 T=Z+V+F 180 WA(I)=Z/T*X 190 VJP(I)=V/T*X 200 WC(I)=F/T*X 210 G=WA(I) 220 PRINT, "INPUT FINAL WEIGHT IN GRA14MES" 230 READ(5,*)Y 240 IOSS=X-Y 250 ALE=G-L0SS 260 WTP=WP(I) 270 PLOSS=P(I)*N*4.175E~4 280 PRINT,"MAX.LEAD LOSS IS"

2 9 0 WRITE(6,*)PLOSS 300 WTC=WC(I) 310 WTA=ALE 320 MP=WTP/207.2
330 MC=WTC/63.5 340 MA=WTA/74.92 350 T=MA+MC+MP 360 MA=MA/T 370 MP=MP/T 380 MC=MC/T 390 /HRINT, "GIVEN BELOW ARE MOLE FRACTIONS OF EACH IN 400 CFINAL DROPLET" 410 PRINT, " MOLES AS MOLES CU MOLES PB" 420 WRITE(6,*)MA,MC,MP 430 WTC=WC(I) 440 WTP=WP (I) -PLOSS 450 WTA=WA(I)-L0SS+PL0SS 460 MP=WTP/207.2 470 MC=WTC/63.5 480 MA=WTA/74 • 92 490 T=MA+MC+MP 500 MA=MA/T 510 MC=MC/T 520 MP=MP/T
530 WRITE(6,*)MA,MC,MP 540 WRITE(6,33) 550 33 FORMAT(///) 560 GO TO 20 570 50 STOP 580 END

1
2
5
4 5
6
7
8
9 10
11 12
15
14
15 16
172
REFERENCES
T.R.A.Davey, Bull.Inst.Min.Met., 72, part 678, 1963, 553-620. A.G.Matyas, Trans.1 .M.M., 8 6 c , 1977, 190-194. S.E.Woods and D.A.Temple, Trans.I.M.M., 74C, 1965, 297-518. J.L.Bryson and P.M.J.Gray, Trans.I.M.M., 77C, 1968, 72-84. J.L.Leroy, P.J.Lenoir and L.E.Escoyez, A.I.M.E. World Symposium on Mining and Metallurgy of Lead & Zinc, Volume 2 Ed. C.Cotterill and J.Cigan, New York, A.I.M.E. 1970, 824-852. L.Fontainas, M.Cousement and R.Maes, Some Metallurgical Principles in the Smelting of Complex Materials, Complex Metallurgy '78, London, I.M.M., 1978, 15-23. D .A .Temple and G.O.John, Can. Min .Met. Bull., February 1971, 58-66. J.B.See, N.I.M. Report 1888, 1977. R.C.Crease and G.W.Healy, Can.Met.Qu., 14, 1975, 175-181. G.Preuner and I.Brockmuller, Z.Phys.Chem., 8H, 1912, 29-70. S.Horiba, Z.Phys.Chem., J06, 1923, 295-502. L.Brewer and J.Kane, J.Phys.Chem., 59, 1955, 105-109. P.Goldfinger and M.JeuneKomme, Adv.Mass Spec., J_, 1959, 554-546. A.Nesmeyanov, Vapour Pressure of the Elements, Elsevier, London, 1965. J.Arthur, J.Phys.Chem.Solids, 28, 1 9 6 7 , 2257-2267. C.Herrick and R.Feber, J.Phys.Chem., 72, 1968, 1102-1110.

17 18
19 20
21
22
2 3
24
25 26
27 28 29
30 31
32 33
34
2069
J.Hudson, Ph.D Thesis, Pennsylvannia State University, 1969.
E.H.Baker, Trans.1 .M.M., 80C, 1971, 93-98. H.Rau, J.Chem.Thermodynamics, 7, 1975, 27-32. Hultgren and others, Selected Values for the Thermodynamic Properties of the Elements, American Society for Metals, 1973. W.Hume-Rothery' and J.Burris, Phil.Mag., 2, 1957, 1177-96. R.Heyding and G.Despaut, Can.J.Chem., 38, 1960, 2477-81. R.Juza, K.von Benda, Z.Anorg.Allgem.Chem., 357, 1968, 238-246.
nd M.Hansen, Constitution of Binary Alloys, 2 Edition, New York, McGraw-Hill. D.Jones and D.Philipp, Trans.I.M.M., 88C, March 1979, 7-10. T.Azakami and A.Yazawa, Nippon Kogyo Kaishi, 85, 1969, 97-102. J.Bode, J.Gerlach,F.Pawlek, Erzmetall., 24, 1971, 480-485. D.Lynch, Met.Trans., 11B, December 1980, 623-629.
st M.Hansen, Constitution of Binary Alloys, 1 Edition, New York, McGraw-Hill. B.Predel and A.Emam, Z.fur Metallkunde, 64, 1973, 647-652 C.Dice, G.Oldbright and T.Brighton, Trans.T.M.S.-A.I.M.E., 121, 1936, 1.27-159 H.Kleinheisterkamp, Erzmetall., 1948, 65-72. J.Jacobs,R.Maes and R. de Stryker, Trans.T.M.S.-A.I.M.E., 239, 1967, 1166-1171. M.Hino, T.Azakami and A.Yazawa, The Liquid Miscibility Gap and. the distribution of Silver between Speiss and Metallic Lead in the Pb-Fe-As and Pb-Cu-As Ternary Systems, presented

174
th at 16 CIM Annual Conference, Vancouver, 1977.
35 R.A.Rapp , Physicochemical Measurements in Metals Research, New York, 1970.
36 Ed. O.Kubaschewski, Metallurgical Chemistry, H.M.S.O. 37 O.Kubaschewski, C.Alcock, E.Evans, Metallurgical
Thermochemistry, Pergammon Press, 19&7-38 G.Belton and R.Fruehan, J.Phys.Chem., 71, 1967,1403-1409. 39 G.Beiton and R.Fruehan, Met.Trans., 2,1971, 291-296. 40 R.Fruehan, Met.Trans., 2, 1971, 1213-1218. 41 U.Merten, J.Phys.Chem., 63, 1959, 443-445. 42 L.Gillespie, J.Chem.Phys., 7, 1939, 530-535. 43 F.D.Richardson, Physical Chemistry of Melts In Metallurgy,
Academic Press, London. 44 L.Darken and R.Gurry, Physical Chemistry of Metals, New
York, McGraw-Hill, 1953.

175
Acknowledgements
The author wishes to thank many past and present members of the Department of Metallurgy and Materials Science for many helpful discussions and suggestions in the course of this research. He is particularly grateful to Professor J.H.E.Jeffes for super-vision, encouragement and understanding throughout the course of the work.
He is also indebted to Metallurgie Hoboken-Overpelt for their assistance in preparing the lead copper arsenic alloys and in carrying out chemical analyses.
Finally the author would like to acknowledge the financial support he received from the Science and Engineering Research Council.