
DEPARTMENT OF MECHANICAL ENGINEERING ADANA, 2010
91
ÇUKUROVA UNIVERSITY INSTITUTE OF NATURAL AND APPLIED SCIENCES M.Sc. THESIS Eser Can KARA HEAT AND MASS TRANSFER ANALYSIS OF A COUNTER FLOW COOLING TOWER UNDER VARIOUS AIR AND WATER FLOW ARRANGEMENTS DEPARTMENT OF MECHANICAL ENGINEERING ADANA, 2010
Transcript of DEPARTMENT OF MECHANICAL ENGINEERING ADANA, 2010

ÇUKUROVA UNIVERSITY
INSTITUTE OF NATURAL AND APPLIED SCIENCES
M.Sc. THESIS
Eser Can KARA
HEAT AND MASS TRANSFER ANALYSIS OF A COUNTER FLOW
COOLING TOWER UNDER VARIOUS AIR AND WATER FLOW
ARRANGEMENTS
DEPARTMENT OF MECHANICAL ENGINEERING
ADANA, 2010

ÇUKUROVA UNIVERSITY
INSTITUTE OF NATURAL AND APPLIED SCIENCES
HEAT AND MASS TRANSFER ANALYSIS OF A COUNTER FLOW
COOLING TOWER UNDER VARIOUS AIR AND WATER FLOW
ARRANGEMENTS
Eser Can KARA
M.Sc. THESIS
DEPARTMENT OF MECHANICAL ENGINEERING
We certified that the thesis titled above was reviewed and approved for the award of the
Master of Science by the board of jury on 04/02/2010.
Signature: Signature: Signature:
Prof. Dr. Tuncay YILMAZ Prof. Dr. Kadir AYDIN Prof.Dr.Tuğrul OĞULATA
Supervisor Member Member
This M.Sc. Thesis is performed in Department of Mechanical Engineering of Natural and
Applied Sciences of Çukurova University.
Registration Number:
Prof. Dr. Ġlhami YEĞĠNGĠL
Director
The Institute of Natural and Applied Sciences
Not: The usage of the presented specific declarations, tables, figures, and photographs either in this thesis or in any other
reference without citiation is subject to „‟Law of Arts and Intellectual Products‟‟ numbered 5846 of Turkish Republic.

I
ABSTRACT
M.Sc. THESIS
HEAT AND MASS TRANSFER ANALYSIS OF A COUNTER FLOW
COOLING TOWER UNDER VARIOUS AIR AND WATER FLOW
ARRANGEMENTS
Eser Can KARA
DEPARTMENT OF MECHANICAL ENGINEERING
INSTITUTE OF NATURAL AND APPLIED SCIENCES
UNIVERSITY OF ÇUKUROVA
Supervisor: Prof. Dr. Tuncay YILMAZ
Year: 2010, Pages: 79
Jury: Prof. Dr. Tuncay YILMAZ
Prof. Dr. Kadir AYDIN
Prof. Dr. Tuğrul OĞULATA
In this study the thermal performances of a forced draft counter flow wet
cooling tower is experimentally investigated. Air and water are used as working
fluids and the experimental runs are carried out by the air and water mass flow rate
ranging between 0.017 and 0.064 kg/s, and between 0.03 and 0.05 kg/s, respectively.
The inlet air wet bulb temperature at 23 °C, and water inlet temperatures are between
38 and 47 °C. The factors effecting cooling tower performance such as water inlet
and outlet temperatures, air and water mass flow rates, heat load, and effectiveness of
the cooling tower are investigated. The effect of the different air and water mass flow
rates on water inlet and outlet temperatures are discussed. The effect of air mass flow
rate on approach and range of the cooling tower, for different water mass flow rates
are investigated. The variation of air mass flow rate on pressure drop for different
water mass flow rates is presented. Other cooling tower parameters are Merkel
number (Me) and number of transfer unit (NTU) to analyze the cooling tower
performance. The number of transfer units (NTU) and Merkel number show the heat
transfer capability of the cooling tower. Cooling tower effectiveness (ε) relation with
Merkel number for different air and water mass flow rates are calculated and all the
results are presented in the form of graphs. The results show that cooling tower
performance increases with an increase in air mass flow rate.
Keywords: Counter flow cooling tower, heat transfer analysis, different air and
water mass flow rate, different water inlet temperature

II
ÖZ
YÜKSEK LİSANS TEZİ
KARŞI AKIŞLI BİR SOĞUTMA KULESİNİN FARKLI HAVA VE SU AKIŞ
DÜZENLEMELERİNDE ISI VE KÜTLE TRANSFERİ ANALİZİ
Eser Can KARA
ÇUKUROVA ÜNĠVERSĠTESĠ
FEN BĠLĠMLERĠ ENSTĠTÜSÜ
MAKĠNE MÜHENDĠSLĠĞĠ ANABĠLĠM DALI
DanıĢman : Prof. Dr. Tuncay YILMAZ
Yıl : 2010, Sayfa: 79
Jüri : Prof. Dr. Tuncay YILMAZ
Prof. Dr. Kadir AYDIN
Prof. Dr. Tuğrul OĞULATA
Bu çalıĢmada zorlanmıĢ karĢı akıĢlı bir soğutma kulesinin ısıl performansı
deneysel olarak araĢtırılmıĢtır. Hava ve su çalıĢma akıĢkanları olarak kullanılmıĢ ve
deneyler sırasıyla hava ve su kütlesel debisi 0.017 ve 0.064 kg/s, ve 0.03 ve 0.05 kg/s
arasında olacak Ģekilde yapılmıĢtır. Hava giriĢ yaĢ termometre sıcaklığı 23 °C ve su
giriĢ sıcaklığı 38 °C ile 47 °C arasındadır. Soğutma kulesi performansını etkileyen
faktörler olarak su giriĢ ve çıkıĢ sıcaklığı, hava ve su kütlesel debisi, ısı yükü ve
soğutma kulesinin etkinliği incelenmiĢtir. Farklı hava ve su kütlesel debilerinin, su
giriĢ ve çıkıĢ sıcaklıkları üzerindeki etkisi araĢtırılmıĢtır. Hava ve su kütlesel
debilerinin soğutma kulesi yaklaĢımı ve su sıcaklık farkı üzerindeki etkisi farklı su
kütlesel debileri için araĢtırılmıĢtır. Basınç kaybının hava debisi ile değiĢimi farklı su
kütlesel debileri için incelenmiĢtir. Soğutma kulesi performansını analiz etmek için
diğer soğutma kulesi parametreleri Merkel sayısı (Me) ve transfer birim sayısı (NTU)
„dur. Transfer birim sayısı (NTU) ve Merkel sayısı, soğutma kulesinin ısı transfer
yeteneğini belirlerler. Soğutma kulesi etkinliği ile Merkel sayısı iliĢkisi farklı hava ve
su kütlesel debileri için hesaplanmıĢ ve tüm sonuçlar grafik Ģeklinde gösterilmiĢtir.
Sonuçlar, soğutma kulesi performansının hava kütlesel debisi arttıkça arttığını
göstermiĢtir.
Anahtar Kelimeler: KarĢı akıĢlı soğutma kulesi, ısı transferi analizi, farklı hava
ve su kütlesel debisi, farklı su giriĢ sıcaklığı

III
ACKNOWLEDGEMENT
I am truly grateful to my research supervisor, Prof. Dr. Tuncay YILMAZ, for
his invaluable guidance support throughout the preparation of this thesis.
I would like to thank all my research assistant friends at our Mechanical
Engineering Department for their continuous support and motivation.
Last but not least, my special thanks to my family and wife ġenelmas, for
their continuous moral support, motivation, encouragement and patience throughout
my scientific efforts.

IV
TABLE OF CONTENTS PAGE
ABSTRACT .................................................................................................................. I
ÖZ ............................................................................................................................... II
ACKNOWLEDGEMENT ......................................................................................... III
TABLE OF CONTENTS ........................................................................................... IV
LIST OF TABLES ..................................................................................................... VI
LIST OF FIGURES .................................................................................................. VII
NOMENCLATURE ................................................................................................... IX
1. INTRODUCTION ................................................................................................... 1
1.1. Types of Cooling Towers ................................................................................. 5
1.1.1. Dry Cooling Towers ............................................................................... 5
1.1.2. Wet Cooling Towers .............................................................................. 6
1.1.3. Open-circuit Towers ............................................................................... 6
1.1.4. Closed-circuit Towers ............................................................................ 8
1.1.5. Mechanical Draft Towers ..................................................................... 10
1.2. Mechanical Draft Cooling Tower Components ............................................. 14
1.2.1. Packing ................................................................................................. 15
1.3. Factors Affecting Cooling Tower Performance ............................................. 20
1.3.1. Wet bulb Temperature .......................................................................... 21
1.3.2. Heat Load ............................................................................................. 22
1.3.3. Range and Approach ............................................................................ 22
2. LITERATURE SURVEY ...................................................................................... 24
3. MATERIAL and METHOD .................................................................................. 35
3.1. Material .......................................................................................................... 35
3.1.1. Experimental Procedure and Data Collection ...................................... 40
3.2. Method ............................................................................................................ 41
3.2.1. Enthalpy Difference Method ................................................................ 44
3.2.2. Psychometric Analysis ......................................................................... 47
3.2.3. Thermodynamic Analysis .................................................................... 48
4. RESULTS and DISCUSSIONS ............................................................................. 53

V
4.1. Pressure Drop Across Packing ....................................................................... 53
4.2. Approach and Water Temperature ................................................................. 56
4.3. Cooling Water Range ..................................................................................... 60
4.4. Cooling Tower Effectiveness and Merkel Number ....................................... 62
5. CONCLUSIONS and RECOMMENDATIONS ................................................... 68
REFERENCES ........................................................................................................... 71
CURRICULUM VITAE ............................................................................................ 77
APPENDIX ................................................................................................................ 78

VI
LIST OF TABLES PAGE
Table 3.1. Packing data used in the experiments ....................................................... 38
Table 4.1. Summary of the experiment data with different air mass
flow rates at constant heat load.................................................................. 54
VII
LIST OF FIGURES PAGE
Figure 1.1. Evaporation in the cooling tower ............................................................... 3
Figure 1.2. Open-circuit (direct contact) cooling tower ............................................... 7
Figure 1.3. Direct contact evaporative cooling tower .................................................. 8
Figure 1.4. Closed-circuit (indirect contact) cooling tower ......................................... 9
Figure 1.5. Indirect contact evaporative cooling tower.............................................. 10
Figure 1.6. Schematic of a counter-flow and cross-flow forced draft towers ............ 12
Figure 1.7. Schematic of a counter flow and cross flow induced draft towers .......... 13
Figure 1.8. Tower with radial fan............................................................................... 15
Figure 1.9. Wood splash type fill ............................................................................... 17
Figure 1.10. Plastic splash type fill ............................................................................ 17
Figure 1.11. Film type fill .......................................................................................... 18
Figure 1.12. Some examples of filling shapes ........................................................... 19
Figure 1.13. Flat and triangular splash fill ................................................................. 20
Figure 1.14. Wet bulb temperature measurement ...................................................... 21
Figure 1.15. Schematic view of cooling range, approach and heat load .................... 22
Figure 3.1. A schematic diagram of the counter flow cooling tower ......................... 35
Figure 3.2. Schematic of the experimental apparatus ................................................ 36
Figure 3.3. Photograph of the experimental apparatus .............................................. 37
Figure 3.4. Variable area flow meter (rotameter) ...................................................... 39
Figure 3.5. Heat and mass transfer relations between water,
interfacial film, and air ............................................................................ 43
Figure 3.6. A chart for the mean enthalpy differences ............................................... 45
Figure 3.7. Schematic representation of the air and water streams
entering and leaving the cooling tower ................................................... 46
Figure 3.8. Heat and mass transfer process in the cooling tower ............................... 48
Figure 3.9. Schematic of the cooling tower control volume
for mass and energy balance ................................................................... 49
Figure 4.1. Variation of pressure drop across packing with different
air velocities ............................................................................................ 55
VIII
Figure 4.2. Variation of wet bulb approach with air mass flow rate
for different water mass flow rates .......................................................... 57
Figure 4.3. Variation of water inlet temperature with air mass flow rate
for different water mass flow rates .......................................................... 58
Figure 4.4. Variation of water outlet temperature with air mass flow rate
for different water mass flow rates .......................................................... 58
Figure 4.5. Variation of water inlet temperature with water to air mass flow rate
ratio for different air mass flow rates ...................................................... 59
Figure 4.6. Variation of water outlet temperature with water to air mass flow
rate ratio for different air mass flow rates ............................................... 60
Figure 4.7. Variation of cooling water range with air mass flow rate
for different water mass flow rates .......................................................... 61
Figure 4.8. Variation of cooling water range with water to air mass flow rate
ratio for different air mass flow rates ...................................................... 62
Figure 4.9. Variation of cooling tower effectiveness with air mass flow rate
for different water mass flow rates .......................................................... 63
Figure 4.10. Variation of cooling tower effectiveness with water to air mass
flow rate for different air mass flow rates ............................................. 64
Figure 4.11. Variation of Merkel number with air mass flow rate flow rate
for different water mass flow rates ....................................................... 65
Figure 4.12. Variation of Merkel number with water to air mass flow rate ratio
for different air mass flow rates ............................................................ 66
Figure 4.13. Variation of cooling tower effectiveness with Merkel number
for different water mass flow rates ....................................................... 67
Figure 4.14. Variation of cooling tower effectiveness with water inlet
temperature for different water mass flow rates ................................... 67

IX
NOMENCLATURE
a : Area of transfer surface per unit volume (m2/m
3)
𝛼𝑎 : Thermal diffusivity (m2/s)
Av : Surface area of the droplets per unit volume of the tower (m2/m
3)
𝑐𝑝𝑎 : Specific heat of moist air (J/gr 0C)
𝑐𝑝𝑤 : Specific heat of water (J/gr 0C)
𝐷𝑎 : Mass diffusivity (m2/s)
ha : Enthalpy of air-water vapor mixture at wet bulb temperature (kj/kg)
: Enthalpy of the bulk air (kj/kg)
ℎ′ : Enthalpy of the bulk water (kj/kg)
ℎ′′ : Enthalpy of the interfacial film (kj/kg)
ℎ𝑎 ,𝑖 : Enthalpy of air at inlet (kj/kg)
ℎ𝑎 ,𝑜 : Enthalpy of air at outlet (kj/kg)
ℎ𝑎 ,𝑤𝑖 : Enthalpy of air at water inlet temperature (kj/kg)
ℎ𝑎 ,𝑤𝑜 : Enthalpy of air at water outlet temperature (kj/kg)
K : Average mass transfer coefficient (kgm2/s)
Le : Lewis number
𝑀𝑒 : Merkel number
m a : Air mass flow rate (kg/s)
m w : Water flow rate (kg/s)
m w m a : Water to air mass flow rate ratio
NTU : Number of transfer unit
𝑄 : Heat transfer rate (kW)
𝑄 𝑚𝑎𝑥 : The maximum possible heat transfer rate (kW)
R : Cooling water range (0C)
𝑇 : Temperature of the bulk air (0C)
𝑇′ : Temperature of the bulk water (0C)
𝑇′′ : Temperature of the interfacial film (0C)
𝑇𝑑𝑏 ,𝑖 : Inlet air dry bulb temperature (0C)

X
𝑇𝑑𝑏 ,𝑜 : Outlet air dry bulb temperature (0C)
𝑇𝑤 ,𝑖 : Inlet water temperature (0C)
𝑇𝑤 ,𝑜 : Outlet water temperature (0C)
𝑇𝑤𝑏 ,𝑖 : Inlet air wet bulb temperature (0C)
𝑇𝑤𝑏 ,𝑜 : Outlet air wet bulb temperature (0C)
V : Effective volume of the tower (m3)
𝑣aB : The specific volume of the water-air mixture leaving the tower
𝑊 : Pump work (kW)
𝑥 : Absolute humidity of bulk air (kgwv/kgda)
𝑥′ : Absolute humidity of the bulk water (kgwv/kgda)
𝑥′′ : Absolute humidity of the interfacial film (kgwv/kgda)
∆ℎ𝑎 : Air enthalpy difference (kj/kg)
∆ℎ𝑚 : Logarithmic mean enthalpy (kj/kg)
∆𝑃 : Pressure drop across packing (mm-H2O)
∆𝑃′ : Orifice differential pressure (mm-H2O)
ε : Effectiveness
Subscripts
a : Moist air
da : Dry air
db : Dry bulb
i : Inlet
o : Outlet
v : Vapor
w : Water
wb : Wet bulb
wv : Water vapor

1. INTRODUCTION Eser Can KARA
1
1. INTRODUCTION
Cooling towers are heat exchangers which are used to dissipate large heat
loads to the atmosphere. It is an equipment used to reduce the temperature of a water
stream by extracting heat from water and emitting it to the atmosphere. They are
used in a variety such as power generation and refrigeration. Cooling towers are
designed for industrial plants for various purposes and sizes to provide cool water.
Typically, a condenser of a power plant and or of heating ventilation, and air
conditioning (HVAC) system is cooled by water.
Cooling towers are used to remove heat from an industrial process called as
industrial process cooling towers (IPCT). These types of cooling towers used in
many parts of the industry such as natural gas processing plants, petro-chemical
plants, petrol refineries, power plants, steel industry, drug industry, plastic injection
machines and food industry.
There are several types of cooling towers. Wet cooling towers can work as
natural or mechanical draft. Mechanical draft towers can be either forced or induced
draft. Air and water flow can be countercurrent, crosscurrent or both. Therefore,
some types of cooling towers are presented in details.
Mechanical draft cooling towers are predominant types of cooling towers and
built in many places in the world. Therefore, the performance characteristic of a
forced draft cooling tower is the subject of this thesis.
Cooling towers are based on a principle where energy is removed from hot
water in direct contact with cool and dry air. Most plants use indirect contact cooling,
whereas some plants use direct contact cooling.
Hot process fluids pass through heat exchangers and condensers without any
contact with the process materials, which allow heat to be transferred from the
process fluids to the cooling water. Direct (open-circuit) and indirect contact (closed-
circuit) towers are explained in this manner.
The main parts of a forced draft cooling tower consist of the structural and the
mechanical components. Tower framework, cold water basin, water distribution
1. INTRODUCTION Eser Can KARA
2
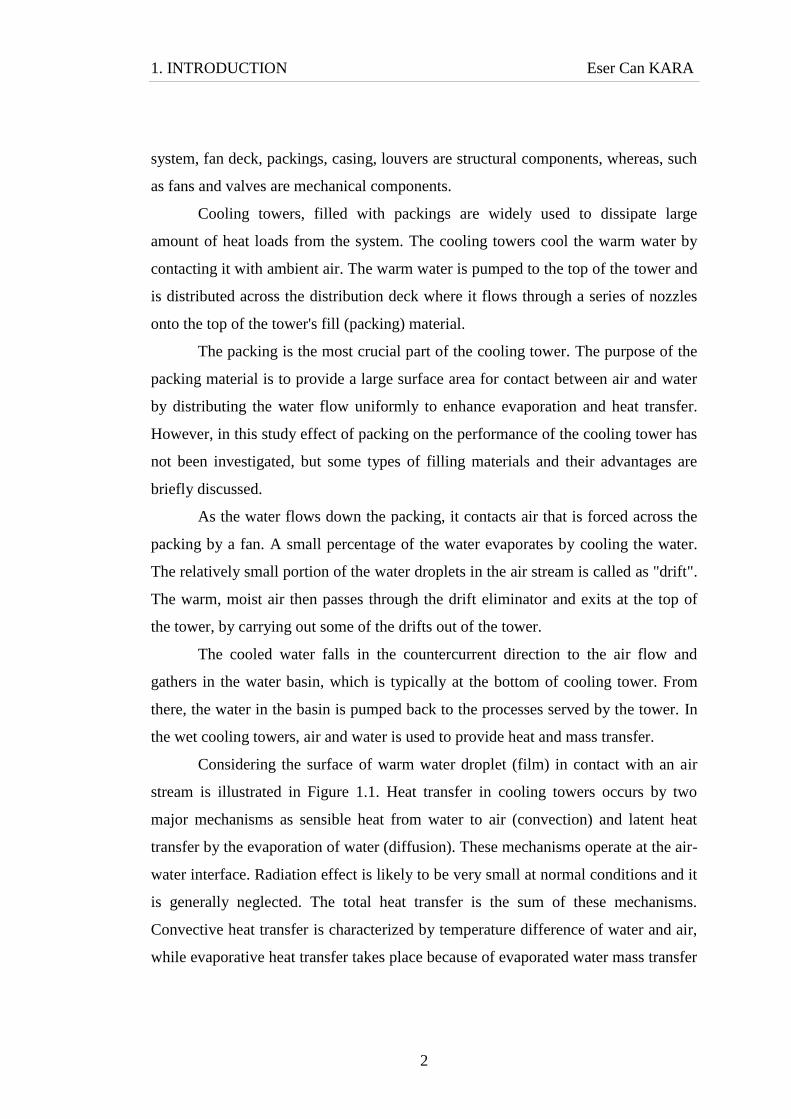
system, fan deck, packings, casing, louvers are structural components, whereas, such
as fans and valves are mechanical components.
Cooling towers, filled with packings are widely used to dissipate large
amount of heat loads from the system. The cooling towers cool the warm water by
contacting it with ambient air. The warm water is pumped to the top of the tower and
is distributed across the distribution deck where it flows through a series of nozzles
onto the top of the tower's fill (packing) material.
The packing is the most crucial part of the cooling tower. The purpose of the
packing material is to provide a large surface area for contact between air and water
by distributing the water flow uniformly to enhance evaporation and heat transfer.
However, in this study effect of packing on the performance of the cooling tower has
not been investigated, but some types of filling materials and their advantages are
briefly discussed.
As the water flows down the packing, it contacts air that is forced across the
packing by a fan. A small percentage of the water evaporates by cooling the water.
The relatively small portion of the water droplets in the air stream is called as "drift".
The warm, moist air then passes through the drift eliminator and exits at the top of
the tower, by carrying out some of the drifts out of the tower.
The cooled water falls in the countercurrent direction to the air flow and
gathers in the water basin, which is typically at the bottom of cooling tower. From
there, the water in the basin is pumped back to the processes served by the tower. In
the wet cooling towers, air and water is used to provide heat and mass transfer.
Considering the surface of warm water droplet (film) in contact with an air
stream is illustrated in Figure 1.1. Heat transfer in cooling towers occurs by two
major mechanisms as sensible heat from water to air (convection) and latent heat
transfer by the evaporation of water (diffusion). These mechanisms operate at the air-
water interface. Radiation effect is likely to be very small at normal conditions and it
is generally neglected. The total heat transfer is the sum of these mechanisms.
Convective heat transfer is characterized by temperature difference of water and air,
while evaporative heat transfer takes place because of evaporated water mass transfer

1. INTRODUCTION Eser Can KARA
3
into humid air (Stefanović et al., 2001). Therefore, sensible and latent heat
mechanisms are explained in the psychometric chart.
Evaporation is the most important effect on cooling tower analysis. As water
molecules diffuse from the hot surface to the surrounding air where cooling takes
place, these molecules are then replaced by other water molecules from the liquid as
shown in Figure 1.1.
Figure 1.1. Evaporation in the cooling tower
Warm water is pumped from the load tank through the control valve and
water flow meter to the column cap. After its temperature is measured, the water is
uniformly distributed over the top packing deck and, as it spreads over the plates, a
large thin film of water is exposed to the air stream. During its downward flow
through the packing, the water is cooled, largely by the evaporation of a small
portion of the water. The cooled water falls from the lowest packing deck into the
basin, where its temperature is again measured and then passes into the load tank
where it is reheated before recirculation.
Air from the ambient enters the fan at a rate that is controlled by adjusting the
position of the intake damper. The fan discharges air into the distribution chamber
and the air pass wet and dry bulb thermocouples before entering the packed column.
As the air flow through the packing, its moisture content is increased while the water
is cooled through evaporation. While leaving the top of the column the air passes

1. INTRODUCTION Eser Can KARA
4
through a droplet arrester, which catches most of the escaping droplets and returns
them to the packing. The air is then discharged to the atmosphere by passing through
the wet and dry bulb thermocouples. The air flow rate is determined by measuring
the pressure drop across the orifice at the outlet of the tower.
The performance of a cooling tower is measured by how close it brings the
cold water temperature to the wet bulb temperature of the surrounding air.
Theoretically, the lowest possible temperature of the water stream leaving the tower
is the ambient wet bulb temperature. The lower the wet bulb temperature, the colder
the tower can make the water. However, in practice, the water outlet temperature is
about 4–6 0C above the ambient wet bulb temperature (Hosez et al., 2007).
In addition, the thermal performance of a cooling tower depends on the
packing arrangements as well as the circulating water and air flow rates. NTU
represents the number of tower units required for a given water flow rate and set of
temperature conditions. During operation there is some loss of water due to
evaporation. First of all, water vapor passes through the cooling tower and is
discharged into the atmosphere (evaporation loss). Another source of water loss is
due to entrained water droplets that escape from the tower with the exhaust air (drift
loss).
Make-up refers to the water flow rate required to replace the circulating water
that is lost by evaporation and drift loss. Since air flow promotes evaporation in the
tower, an increase in air through constitutes another expedient way to increase the
cooling capacity. In fact; the thermal performance of the cooling tower is even more
complex, and influenced by climatic fluctuations such as wet bulb temperature or
humidity throughout the year. So, the actual temperature of the cooled water will
change in accordance to these inevitable conditions and it affects the overall system.
The objective of this experimental study is to investigate the performance of
the cooling tower at different air and water mass flow rates under different heating
conditions. Therefore, in this study, forced draft counter flow bench type cooling
tower experimental apparatus is used. To investigate this, water inlet-outlet
temperatures and air inlet-outlet dry and wet bulb temperatures, air and water mass
flow rates are measured and calculations are carried out by using the measured data.

1. INTRODUCTION Eser Can KARA
5
1.1. Types of Cooling Towers
Primary classification of cooling towers is dry towers and wet towers. In this
study; dry cooling towers (HVAC and CCT) and wet cooling towers are briefly
explained, whereas mechanical draft towers explained in detail. Sub classifications
can include the draft type and the location of the draft, the type of heat transfer
system, direction of air movement (countercurrent or cocurrent).
1.1.1. Dry Cooling Towers
Dry cooling towers operate by a heat transfer surface which separate working
fluid from ambient air. This is accomplished by convection heat transfer from the
working fluid. Therefore, in dry cooling towers heat dissipate to the atmosphere
without the evaporative loss of water. The cooling takes place through air-cooled
heat exchangers similar to radiators. Unlike wet cooling, dry cooling is capable of
only smaller temperature variations and it is around 10 0C.
There are two types of dry cooling as direct and indirect. In both systems, the
flow rate of air required to achieve the same cooling capacity have to be greater than
in a wet cooling tower, and so as to the tower will have to be much larger and
expensive. Therefore, the dry cooling towers initial and operational costs are higher
than wet cooling towers. Some of the advantageous of dry cooling towers is its
healthier operational conditions.
In dry cooling towers, the water loss is negligible as the water remains in a
closed loop. Therefore, in this type of systems make-up water need is very little and
thus water treatment costs will be less. This system can be used where water is
scarce. In addition to this, tower operating conditions depend on ambient air dry-bulb
temperature. Some parameters such as wind speed and the arrangement of the heat
exchanger bundles affect the performance of the tower.
The effect of winds at different speeds and the effect of windbreak walls on
the thermal performance of the natural draft dry cooling towers are given by Al-
Waked and Behnia (2005).
1. INTRODUCTION Eser Can KARA
6
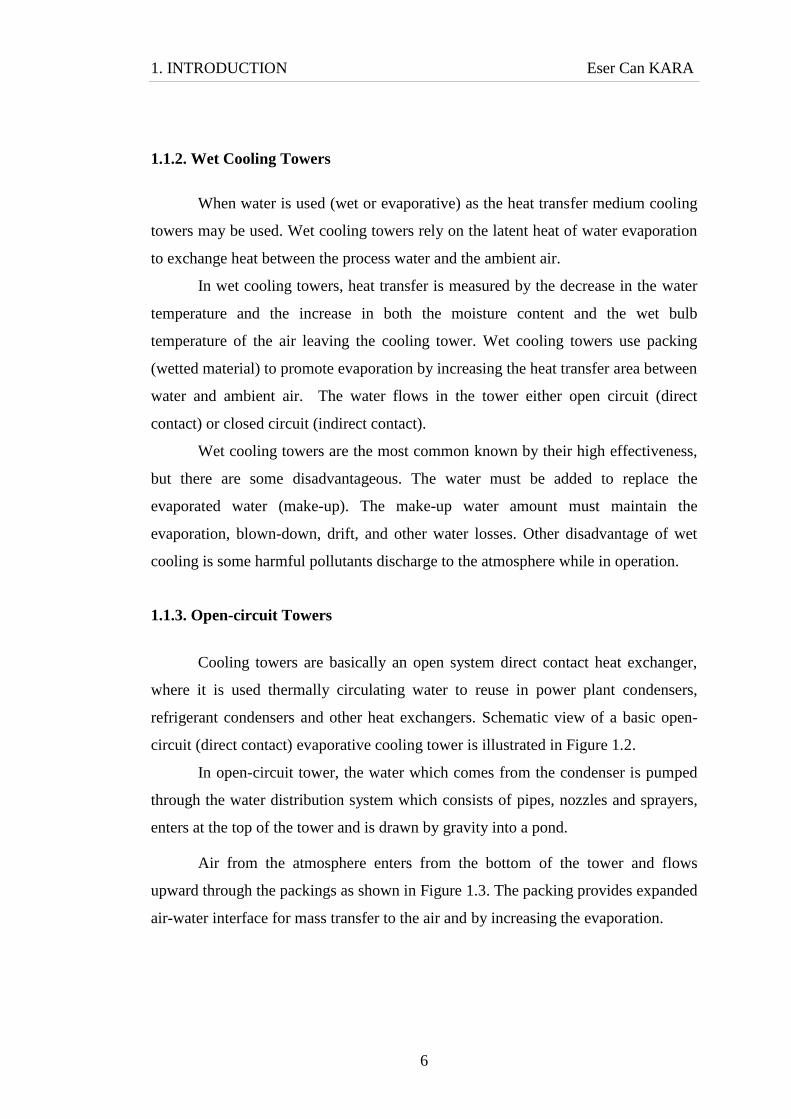
1.1.2. Wet Cooling Towers
When water is used (wet or evaporative) as the heat transfer medium cooling
towers may be used. Wet cooling towers rely on the latent heat of water evaporation
to exchange heat between the process water and the ambient air.
In wet cooling towers, heat transfer is measured by the decrease in the water
temperature and the increase in both the moisture content and the wet bulb
temperature of the air leaving the cooling tower. Wet cooling towers use packing
(wetted material) to promote evaporation by increasing the heat transfer area between
water and ambient air. The water flows in the tower either open circuit (direct
contact) or closed circuit (indirect contact).
Wet cooling towers are the most common known by their high effectiveness,
but there are some disadvantageous. The water must be added to replace the
evaporated water (make-up). The make-up water amount must maintain the
evaporation, blown-down, drift, and other water losses. Other disadvantage of wet
cooling is some harmful pollutants discharge to the atmosphere while in operation.
1.1.3. Open-circuit Towers
Cooling towers are basically an open system direct contact heat exchanger,
where it is used thermally circulating water to reuse in power plant condensers,
refrigerant condensers and other heat exchangers. Schematic view of a basic open-
circuit (direct contact) evaporative cooling tower is illustrated in Figure 1.2.
In open-circuit tower, the water which comes from the condenser is pumped
through the water distribution system which consists of pipes, nozzles and sprayers,
enters at the top of the tower and is drawn by gravity into a pond.
Air from the atmosphere enters from the bottom of the tower and flows
upward through the packings as shown in Figure 1.3. The packing provides expanded
air-water interface for mass transfer to the air and by increasing the evaporation.

1. INTRODUCTION Eser Can KARA
7
The heated moist air leaves the fill and discharged to the atmosphere. The
water is collected at the bottom of the tower, gathered in the pond and then
recirculated to remove heat from the condenser.
The water is cooled as it flows through the packing by gravity while in direct
contact with air that passes over it. The cooled water is then collected in a cold water
basin below the packing from which it is pumped back through the process (for
example condensation process) to absorb heat.
Figure 1.2. Open-circuit (direct contact) cooling tower
1. Water inlet 5. Pond
2. Water outlet 6. Condenser
3. Air inlet 7. Pump
4. Air outlet 8. Packings

1. INTRODUCTION Eser Can KARA
8
Figure 1.3. Direct contact evaporative cooling tower
1. Water inlet 5. Droplet arrester
2. Water outlet 6. Water distribution system
3. Air inlet 7. Packings
4. Air outlet
1.1.4. Closed-circuit Towers
Schematic view of a closed-circuit (indirect contact) tower is illustrated in
Figure 1.4. Operation of the closed-circuit tower is therefore very similar to the open-
circuit tower with one exception. Therefore unlike the open-circuit cooling tower, the
closed-circuit tower has two separate fluid circuits.

1. INTRODUCTION Eser Can KARA
9
Figure 1.4. Closed-circuit (indirect contact) cooling tower
1. Water inlet 5.Cooling fluid
2. Water outlet 6. Pump
3. Air inlet 7. Fill
4. Air outlet
In this type of towers, the process fluid being cooled is situated in a closed
circuit and is not directly exposed to the surrounding air or the circulated external
water.
The other circuit is an external circuit in which water is circulated on the
outside of the first cooling fluid circuit which is connected to the process for the hot
fluid being cooled. As shown in the Figure 1.5. air is drawn through the circulating
water flowing over the outside of the hot tubes and provide evaporative cooling of
water.
Cooling tower with the internal fluid circuit is advantageous when the fluid
inside the tubes is used to cool fluids other than water and to prevent contamination
of the cooling circuit from impurities. Process water is isolated from the
contaminants situated in the tower, external water loop keep the process water clean
and easily maintain. In addition to this, closed-circuit systems minimize
contamination and maintenance of heat exchangers, chiller condensers and other

1. INTRODUCTION Eser Can KARA
10
equipments. Closed circuit fluids coolers are similar to evaporative condensers and
increasingly used on heat pump systems and screw compressors.
Figure 1.5. Indirect contact evaporative cooling tower
1. Air inlet 5. Droplet arrester
2. Heat and moist air outlet 6. Internal fluid circuit
3. Water inlet 7. Water distribution system
4. Water outlet
1.1.5. Mechanical Draft Towers
The primary function of the cooling tower is to reject heat to the atmosphere.
This is accomplished by the evaporation process which takes place when water and
air are in direct contact in the cooling tower. When the maximum water surface area
1. INTRODUCTION Eser Can KARA
11
is exposed to the maximum air flow in the cooling tower by the help of packings, this
evaporation becomes most efficient in the cooling process.
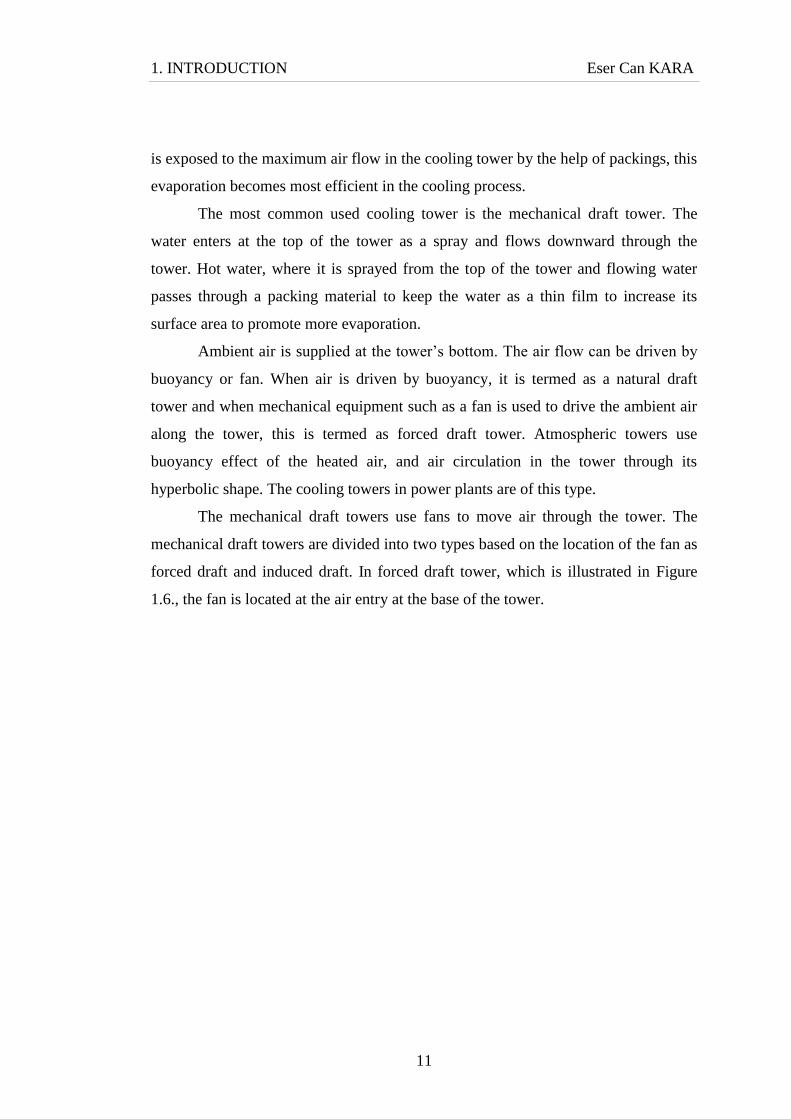
The most common used cooling tower is the mechanical draft tower. The
water enters at the top of the tower as a spray and flows downward through the
tower. Hot water, where it is sprayed from the top of the tower and flowing water
passes through a packing material to keep the water as a thin film to increase its
surface area to promote more evaporation.
Ambient air is supplied at the tower‟s bottom. The air flow can be driven by
buoyancy or fan. When air is driven by buoyancy, it is termed as a natural draft
tower and when mechanical equipment such as a fan is used to drive the ambient air
along the tower, this is termed as forced draft tower. Atmospheric towers use
buoyancy effect of the heated air, and air circulation in the tower through its
hyperbolic shape. The cooling towers in power plants are of this type.
The mechanical draft towers use fans to move air through the tower. The
mechanical draft towers are divided into two types based on the location of the fan as
forced draft and induced draft. In forced draft tower, which is illustrated in Figure
1.6., the fan is located at the air entry at the base of the tower.

1. INTRODUCTION Eser Can KARA
12
a) Counter flow
b) Cross flow
Figure 1.6. Schematic of a counter-flow and cross-flow forced draft towers
1. Water inlet 5. Water spray nozzles
2. Water outlet 6. Drift eliminator
3. Air inlet 7. Fan
4. Air outlet 8. Packing
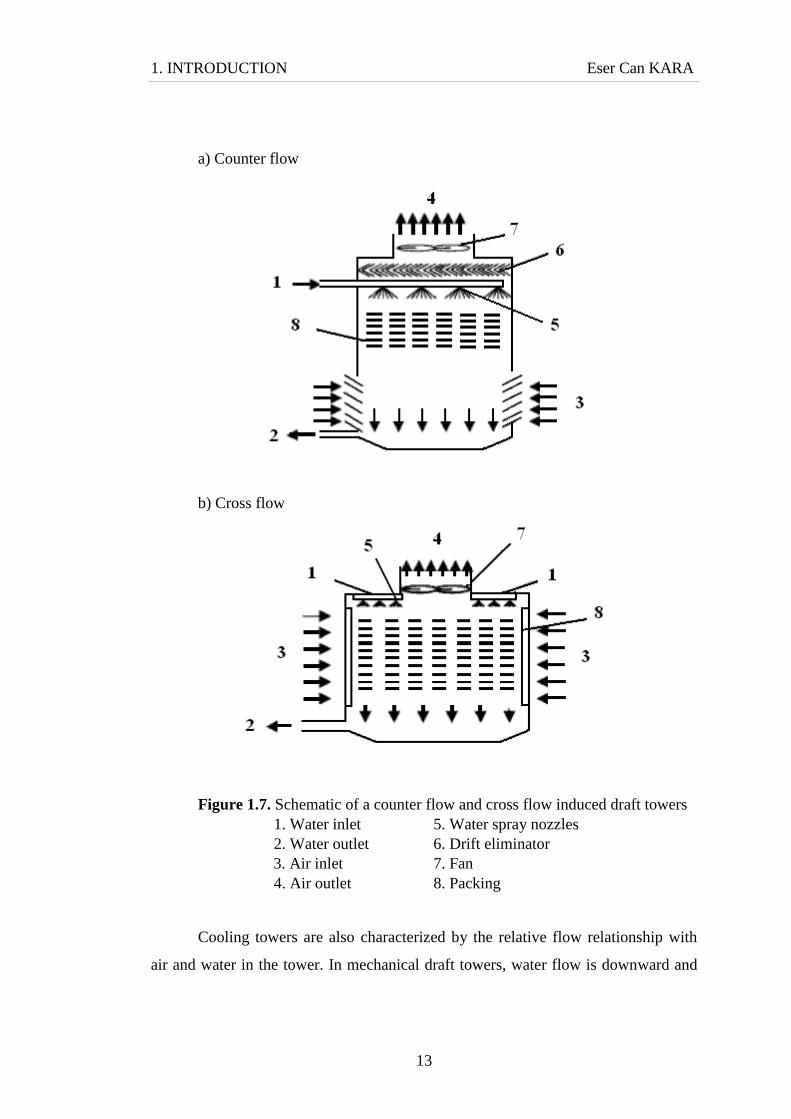
In induced draft tower, which is illustrated in Figure 1.7., the fan is located at
the air exit at the top of the tower. A centrifugal or axial fan can be used depending
on the pressure needs.
1. INTRODUCTION Eser Can KARA
13
a) Counter flow
b) Cross flow
Figure 1.7. Schematic of a counter flow and cross flow induced draft towers
1. Water inlet 5. Water spray nozzles
2. Water outlet 6. Drift eliminator
3. Air inlet 7. Fan
4. Air outlet 8. Packing
Cooling towers are also characterized by the relative flow relationship with
air and water in the tower. In mechanical draft towers, water flow is downward and

1. INTRODUCTION Eser Can KARA
14
air flow is either upward (counter flow) or horizontal (cross flow) or both. Air may
enter one side or two sides of the tower according to cooling tower design.
In a counter flow cooling tower, air moves upward vertically through the fill
opposite to the downward motion of the water. There are some advantageous and
disadvantageous of this type of towers. Counter flow arrangements occupy less floor
space than cross flow towers but are taller for a given capacity, so they require higher
pump heads. In addition to this, the resistance to upward air flow against the falling
water results in higher static pressure loss. However, increased tower height
accommodates longer range and closer wet bulb approach. Therefore, counter flow
arrangements show better tower performance, since the driest air contacts the coldest
water.
In a cross flow cooling tower, air moves horizontally through the fill as water
moves downward. Cross flow towers have greater air intake area, which means that
they have low pressure drop and lower fan power requirement.
The forced draft towers are design for high air entrance velocities and low
exit velocities. Therefore, they are considered to have less performance stability than
the induced draft because forced draft towers are extremely sensitive to recirculation
of the water. The induced draft produces more uniform airflow, which enhances its
effectiveness over the forced draft and reduces the possibility of exhaust air
recirculation.
1.2. Mechanical Draft Cooling Tower Components
The schematic arrangement of a forced draft cooling tower is illustrated in
Figure 1.8., which mainly consist of tower frame (casing or shell), water distribution
system, droplet arrester, packing and fan. Tower frame carry the other main items.
Drift eliminator is positioned at the outlet air side and prevents water droplets from
escaping the tower. Water distribution provides uniform water distribution along the
packing. The main aim of the packing is to maximize contact surface between the
water and the air to promote evaporation and heat transfer. Therefore, the most
important component of the cooling tower is packing and it is explained in detailed.

1. INTRODUCTION Eser Can KARA
15
Figure 1.8. Tower with radial fan
1. Tower frame 4. Droplet arrester
2. Water distribution system 5. Fan
3. Packing
1.2.1. Packing
The cooling tower packing fill is the most critical component in the operation
of the cooling tower. The function of the tower fill is to provide a maximum contact
surface between the water and the air to promote evaporation and heat transfer.
Cooling tower fill accelerates the transfer of heat from circulating water by
maximizing the contact area between water and air. The convenient fill provide
uniform water-air distribution, low resistance to air flow and maximize the heat and
mass transfer rate along the tower. Therefore, the ideal fill has to be some features as
to be highly resistant to deterioration, and able to maintain efficient heat transfer
capabilities for long time.
Cooling tower fills first were made of corrugated asbestos sheets or other
materials before the advent of plastics. These materials are used infrequently today
1. INTRODUCTION Eser Can KARA
16
because of environmental restrictions and cancer risks of asbestos cement. Today
polyvinyl chloride (PVC) material is widely used, which has advantages over wood
materials.
In the cooling tower operation for the maximum heat transfer and minimum
pressure drop, we need to choose the most convenient fill material. In most modern
HVAC systems, heat transfer takes place on film-type packing surfaces which induce
the falling water to form a thin film. PVC provides excellent manufacturability, has
ability of resistant to corrosion, and has excellent material properties over a wide
range of chemical environments. Therefore, for most applications, even involving
very corrosive water, PVC is the fill material of choice.
Packings can mainly be classified as splash and film type. Packings have a
direct effect on the performance of the cooling towers. The earliest fills was simple
such as wood splash bars. As the water flows through the splash fills in the tower,
water breaks into small droplets. Therefore, these droplets provide heat exchange
area between air and water. However, this type of fills does not provide maximum
surface area due to surface tension and perfect sphere shapes of droplets. Today‟s
splash fills are primarily various shapes of extruded PVC.
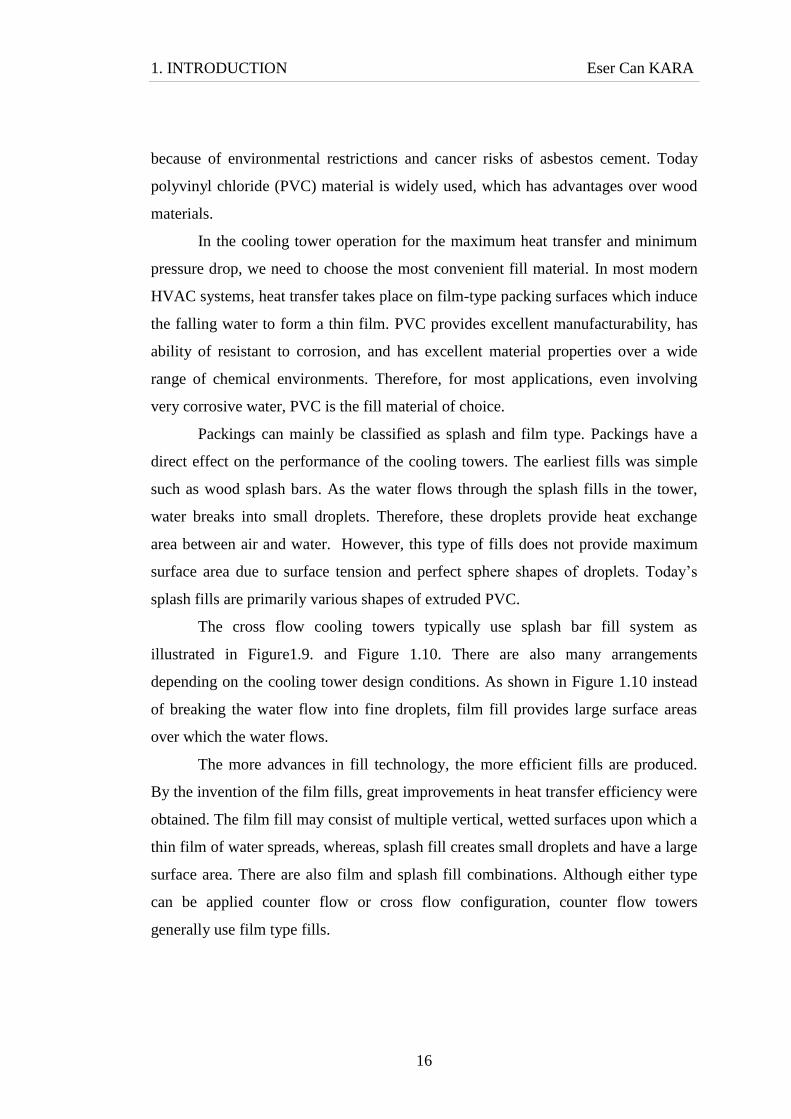
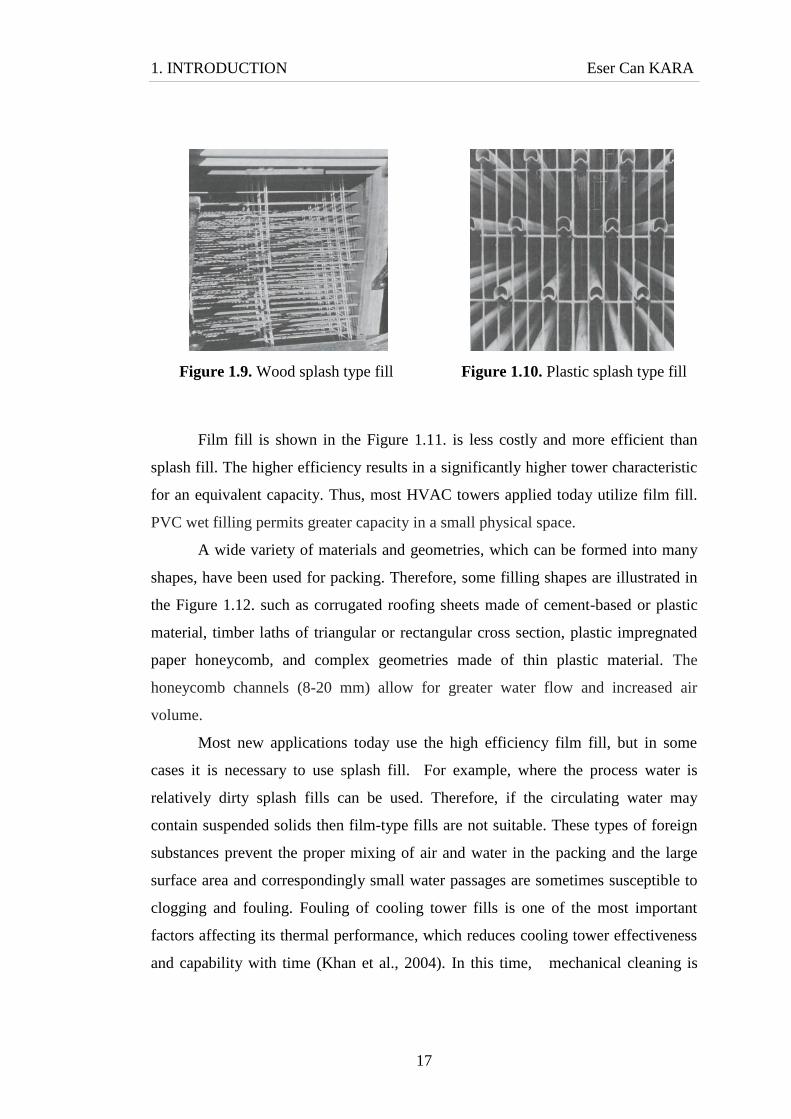
The cross flow cooling towers typically use splash bar fill system as
illustrated in Figure1.9. and Figure 1.10. There are also many arrangements
depending on the cooling tower design conditions. As shown in Figure 1.10 instead
of breaking the water flow into fine droplets, film fill provides large surface areas
over which the water flows.
The more advances in fill technology, the more efficient fills are produced.
By the invention of the film fills, great improvements in heat transfer efficiency were
obtained. The film fill may consist of multiple vertical, wetted surfaces upon which a
thin film of water spreads, whereas, splash fill creates small droplets and have a large
surface area. There are also film and splash fill combinations. Although either type
can be applied counter flow or cross flow configuration, counter flow towers
generally use film type fills.
1. INTRODUCTION Eser Can KARA
17
Figure 1.9. Wood splash type fill Figure 1.10. Plastic splash type fill
Film fill is shown in the Figure 1.11. is less costly and more efficient than
splash fill. The higher efficiency results in a significantly higher tower characteristic
for an equivalent capacity. Thus, most HVAC towers applied today utilize film fill.
PVC wet filling permits greater capacity in a small physical space.
A wide variety of materials and geometries, which can be formed into many
shapes, have been used for packing. Therefore, some filling shapes are illustrated in
the Figure 1.12. such as corrugated roofing sheets made of cement-based or plastic
material, timber laths of triangular or rectangular cross section, plastic impregnated
paper honeycomb, and complex geometries made of thin plastic material. The
honeycomb channels (8-20 mm) allow for greater water flow and increased air
volume.
Most new applications today use the high efficiency film fill, but in some
cases it is necessary to use splash fill. For example, where the process water is
relatively dirty splash fills can be used. Therefore, if the circulating water may
contain suspended solids then film-type fills are not suitable. These types of foreign
substances prevent the proper mixing of air and water in the packing and the large
surface area and correspondingly small water passages are sometimes susceptible to
clogging and fouling. Fouling of cooling tower fills is one of the most important
factors affecting its thermal performance, which reduces cooling tower effectiveness
and capability with time (Khan et al., 2004). In this time, mechanical cleaning is

1. INTRODUCTION Eser Can KARA
18
necessary, but it cannot be done unless the fill is removed from the tower and
disassembled and it is an expensive and time consuming job.
Figure 1.11. Film type fill
To provide acceptable service on this undesirable situation splash bar fill is
used. These splash bars may be produced from wood, PVC, polypropylene or ABS
(acrylonitrile-butadiene-styrene).
Film fill with its the large areas and the slower falling speeds than splash fill
the water forms a thin sheet or film as it flows across the fill surfaces, creating large
air-water contact area and efficient evaporation heat transfer.

1. INTRODUCTION Eser Can KARA
19
a) Honeycomb 8 mm b) Honeycomb 20 mm c) Vertical corrugated
(smooth plates)
d) Vertical corrugated plates e) Mixed corrugated plates
with distance 32mm
f) Mixed fluted plates g) Mixed fluted plates
with corrugated pattern
Figure 1.12. Some examples of filling shapes

1. INTRODUCTION Eser Can KARA
20
The most commonly used film fill sheet material is rigid PVC, which is
durable and provides a long service life, is excellent for wetting (allow surfaces to be
covered completely by water). These types of film fill configurations have low
resistance to air flow and thus, the air pressure drop through the tower is low. Fill are
designed either flat or triangular shape to reduce the airflow pressure drop as shown
in Figure 1.13.
a) Flat splash fill b) Triangular splash fill
Figure 1.13. Flat and triangular splash fill
1.3. Factors Affecting Cooling Tower Performance
There are many factors affecting the cooling tower performance. Major
factors affecting the cooling tower performance are air flow rate, water flow rate,
cooling load, entering air conditions, water temperature and tower characteristics
(dimensions, components and materials). This factors whose effects are predominant
such as wet bulb temperature, heat load, range, and approach terms are discussed in
this section.

1. INTRODUCTION Eser Can KARA
21
1.3.1. Wet bulb Temperature
The temperature of the air is measured by the thermometer when it is covered
by wet wick is called as wet bulb temperature (WBT) as shown in Figure 1.14. When
the air comes in contact with the wet wick it absorbs some moisture and gives up
some heat. As air passes over the wet wick, the water in the wick evaporates. If the
air is very humid (moist), only a small amount of moisture will evaporate from the
wick. A non-wetted thermometer measurement gives us a dry bulb temperature
(DBT) reading. A comparison of wet and dry bulb readings allows the air properties
to be determined from a psychometric chart and the air properties table.
Figure 1.14. Wet bulb temperature measurement
It is not possible or practical to design a cooling tower that can provide
cooling water equal to or lower than the prevailing wet bulb temperature of the air.
Each tower system specifically sized for each geographic area‟s prevailing summer
wet bulb temperature. Therefore, WBT is the lowest temperature that water will
reach by evaporative cooling. It is a critical parameter for sizing, and measuring the
performance of evaporative cooling tower systems. Cooling towers are specified and
designed to achieve an "approach to wet-bulb" of a certain number of degrees while
circulating a specified amount of cooling water.

1. INTRODUCTION Eser Can KARA
22
1.3.2. Heat Load
When selecting the cooling tower, one must determine the design heat
rejection load along with the design WBT for the geographical area and desired
range. The heat load is the amount of heat to be removed from the circulating water
within the tower. It is equal to water circulation rate times the cooling range as
shown the area in Figure 1.15. The size and cost of a cooling tower is proportional to
the heat load. If heat load is low, the cooling tower will probably be small otherwise
oversized more costly equipment will result.
Figure 1.15. Schematic view of cooling range, approach and heat load
1.3.3. Range and Approach
Cooling tower designers have generally used two temperature differences to
characterize the cooling tower operation. These are cooling range and approach as
shown in Figure 1.15. The range is the difference between water inlet and outlet
temperatures. Accordingly, the range is determined by heat load and water flow rate,
not by the size or capability of the tower.

1. INTRODUCTION Eser Can KARA
23
The approach is defined as the difference between the outlet water
temperature and wet-bulb temperature of the entering air to the cooling tower. In
other words, approach is basically defined as how closely the leaving cold water
temperature approaches the entering air wet bulb temperature.
Approach is the most important parameter of the cooling tower performance.
It dictates the theoretical limit of the leaving water temperature through the tower
and no matter the size of the cooling tower, range or heat load.
The approach is a function of a cooling tower capacity. Therefore; a large
cooling tower will produce a closer approach for a given heat load, flow rate, and
entering air condition. However, the closer the approach to the wet-bulb temperature,
the more expensive the cooling tower due to increased size.

2. LITERATURE SURVEY Eser Can KARA
24
2. LITERATURE SURVEY
Theoretical analysis of cooling towers has a long history and there are so
many investigations and studies on cooling towers. However, in this study, literature
research mainly focuses on the thermal performance, tower characteristic, water to
air flow ratio, effectiveness (ε), number of transfer units (NTU), heat and mass
transfer analysis particularly for the counter flow cooling towers.
Basically, cooling tower models can be classified into two groups: steady-
state models and dynamic models. Many of the available studies have considered the
steady-state thermal performance of the cooling tower whereas other studies have
predicted the transient properties of the cooling towers.
Walker et al. (1923), as the first to propose a basic theory of cooling tower
operation. They used the ambient air humidity sole driving force for the cooling
process in cooling towers. However, the most widely used theory for cooling tower
calculation is developed by Merkel (1925). It is important to say that Merkel‟s theory
in cooling tower design and rating is presented and discussed in detail throughout
most unit operations and process heat transfer textbooks.
London et al. (1940), used the enthalpy of the humid air-water vapor mixture
as the actual driving force. In addition to this they recognized for the first time that
water evaporation must be taken into consideration for the true heat balance.
Simpson and Sherwood (1946), studied on a mechanical draft cooling tower to
evaluate the performance of the tower.
Kelly and Swenson (1956), studied on a cooling tower to evaluate the
pressure drop and heat transfer mechanism of the cooling tower and correlated the
characteristic of the cooling tower with a water-air mass flow ratio and mentioned
that ingredients of the tower characteristic are water-air mass flow ratio, packing
material height and water temperature.
Baker and Shryock (1961), tried to minimize the error due to the assumption
of Merkel theory and they gave a detailed explanation for the Merkel‟s method.
Nahavandi et al. (1975), showed that ignoring the evaporation losses
introduces an error in the Merkel‟s results. Whillier (1976), developed a simple

2. LITERATURE SURVEY Eser Can KARA
25
method to predict the performance of cooling towers. He introduced a new method
called the tower capacity factor as a basis for correlation of test data and for
prediction of performance.
Sutherland (1983), performed an analysis of a cooling tower that did not
utilize the assumptions of Merkel. He found that counter-flow cooling towers could
be undersized between 5 to 15% through the use of the Merkel method if “true” mass
transfer coefficients are used and that the underestimation of tower volume provided
by the approximate analysis increases with increasing value of mass flow rate ratio.
He also studied the effect of variation of atmospheric pressure on cooling towers to a
certain extent and showed that the NTU increase with increasing pressure.
Baker (1984), showed that the effect of water evaporation is relatively small
and varies with the operating conditions of the cooling tower. Webb (1984),
performed a unified theoretical treatment for thermal analysis of cooling towers,
evaporative condensers and evaporative fluid coolers. In these papers specific
calculation procedures are defined for sizing and rating each type of evaporative heat
exchanger.
Braun et al. (1989), presented simple method for modeling the performance
of cooling towers and cooling coils. They developed an air saturation specific heat,
effectiveness relationships through this method. According to this study, the
advantages of this approach are its simplicity, accuracy, and consistency with the
methods for analyzing sensible heat exchangers.
Shelton and Weber (1991), investigated the effect of low water and air flow
rates and used models based on manufacturer‟s performance data.
El-Dessouky (1993), studied the thermal and hydraulic performances of a
three-phase fluidized bed cooling tower and developed a correlation between the
tower characteristics, hot water inlet temperature and water/air mass flux ratio.
Bernier (1994), studied on the basic heat and mass transfer processes
occurring around a droplet in transient cooling. He analyzed a counter flow cooling
tower and showed the influences of fill height and water-air flow ratio on the tower
performance.
2. LITERATURE SURVEY Eser Can KARA
26
Kintner and Emery (1995), analyzed the selection of the cooling tower range
and approach and presented some practical guidelines for sizing cooling towers.
According to his study, the cooling tower must not only provide the required cooling,
but also must return the cold water at temperatures consistent with the requirements
of the entire system.
Maiya (1995), presented a modified counter flow cooling towers to pre-cool
the air at the tower inlet, either by the water after the cooling load, or the tower exit
air. He modeled the cooling tower and investigated the thermal performances and
compared results with the conventional counter flow cooling tower. He presented his
results in terms of NTU, a dimensionless number for a cooling tower indicating its
size. He showed that the modified cooling towers are found to be better than the
conventional one in lowering the tower approaches below about 2°C. Their study
showed that these modified cooling towers seem to be advantageous when operating
at low approaches, small ranges and large wet-bulb depressions, thus making them
quite useful in evaporative air cooling applications.
El-Dessouky et al. (1996), evaluated the thermal and hydraulic performance
of a modified two-stage evaporative cooler. They considered the variables which are
the mode of operation, packing thickness, mass flow rate of the water, and the mass
flux of water flowing over the packing media. They presented the effectiveness of
the system increased with the increase of the mass flow rate of water, decreasing the
mass flux of water flowing to the packing, and with the increase of the packing
thickness. They investigated the pressure drop across various packing types. They
found that air side pressure drop per unit length in the direction of air flow was
nearly constant when the structured packing was used. The air pressure drop was
lowest for the setup with the structured packing.
Mohiuddin and Kant (1996), described the detailed methodology for the
thermal design of wet, counter flow and cross flow types of mechanical and natural
draught cooling towers.
El-Dessouky et al. (1997), described a theoretical investigation for the steady-
state counter flow wet cooling tower with modified definitions for both the NTU and
the tower thermal effectiveness. They the modified NTU is dependent on both air

2. LITERATURE SURVEY Eser Can KARA
27
and water heat capacity. They defined the effectiveness by the water cooling range
and the approach to equilibrium. They developed a new expression relating the tower
effectiveness to the modified NTU and the capacity rate ratio. According to their
model, the resistance to heat transfer in the water film, the non unity of the Lewis
number, and the curvature of the saturated air enthalpy curve are considered. They
demonstrated a procedure for implementing the model in designing or rating cooling
towers through illustrative examples. They compared the model with other methods
such as logarithmic mean enthalpy difference (LMED) and conventional
effectiveness-NTU.
Bedekar et al. (1998), studied experimentally the performance of a counter
flow forced draft tower using a film type packing. Their results were presented in
terms of tower characteristics, water-outlet temperature, water to air flow rate ratio
(m w m a ) and efficiency. They concluded that tower performance decreases with an
increase in the m w m a ratio.
Al-Nimr (1998), studied the dynamic thermal behavior of counter flow
cooling towers that contain packing material and predicted closed form solutions for
the transient and steady performance of a counter flow cooling tower. He took into
account both the sensible and latent heat cooling effects on the cooling tower
performance.
Soylemez (1999), presented a method to estimate the size and performance of
counter flow forced draft towers. He used the experimental results to validate the
predicted formulation.
Halasz (1999), analyzed the adiabatic evaporation processes in cooling towers
in a new way. He proposed a mathematical model for evaporative cooling devices
applied to cooling towers. According to this model, the efficiency of a cooling tower
can be expressed as a function of only two variables and plotted in a single diagram
for each type of cooling tower. He gives an analytic solution for counter flow and
parallel flow towers there is an analytic solution of the set of differential equations;
cross flow towers require a numerical solution. He concluded that the resulting rating
procedure of the overall performance of a cooling tower is simple and consists of the
adjustment of the assumed straight air saturation line to the real air saturation data.
2. LITERATURE SURVEY Eser Can KARA
28
According to his results, it is found to be good for the usual operating conditions,
failing only when the water cooling range is very large.
Castro et al. (2000), developed an optimization model that considers thermal
and hydraulic interactions for a cooling water system, which is a closed loop
consisting of a cooling tower unit, circulation pump, blower and heat exchanger-pipe
network. Model constraints include relations including tower performance, air flow
rate requirement, make-up flow rate, circulating pump performance, heat load in
each cooler, pressure drop constraints and climatic conditions. He took into account
some variables, which are air flow rate, forced water withdrawal upstream the tower,
and valve adjustment in each branch. He showed that the most important variable on
cooling tower performance is not the air temperature itself, but its humidity.
Jorge and Armando (2000), tested a new closed wet cooling tower for use in
chilled ceilings in buildings. They obtained experimental correlations for mass and
heat transfer coefficients. According to their study, if the correlations are used,
existing thermal models for this type of cooling tower can be predicted well thermal
performance.
Goshayshi and Missenden (2000), experimentally studied the effect of form
with corrugated PVC packing in various arrangements on mass transfer and pressure
drop characteristic in a forced draft counter flow cooling tower. They found that
overall mass transfer coefficients and pressure drops of ribbed corrugated packings
increase considerably compared with smooth packing and are affected by spacing of
the packing and the distance between the ribs.
Khan et al. (2001), presented a detailed model of counter flow wet cooling
towers. They compared the model with other commonly described models by
obtaining the values NTU and tower effectiveness (ε). They showed that if the
resistance to heat transfer in the water film and non-unity of Lewis number is
considered in the calculations appreciable difference can be seen in NTU and ε
values. They examined the effect of air-water interface temperature. They explained
a procedure for the use of the model in designing and rating analyses of cooling
towers through example problems. They explained the limiting performance of the
cooling towers; that means effectiveness equal to one, is explained in terms of air-

2. LITERATURE SURVEY Eser Can KARA
29
approach temperature. They also obtained the maximum possible mass flow rate
ratio of water to air from the model for different operating conditions.
Makkinejad (2001), presented a mathematical solution based on linearized
relationships by taking into account the main influencing parameters, especially the
liquid to air ratio, not only between the equilibrium humidity ratio of air and the
water surface temperature but also between the bulk air humidity ratio and the same
water surface temperature.
Milosavljevic and Heikkila (2001), derived a mathematical model for a
counter flow wet cooling tower based on a one-dimensional heat and mass balance
equations. They analyzed the cooling tower performance with different filling
materials. They also, investigated the performance of other cooling tower elements,
such as droplet separators and water spray nozzles.
Jose (2002), defined the thermo-fluid dynamic efficiency that can be used to
compare and select a fill material for a particular application. Thermo-fluid dynamic
efficiency means the maximum heat transfer in the cooling tower with the minimum
pressure drop. To show this, he evaluated the heat transfer related to the pressure
drop in isolated fills with different types of water cooling towers. He showed thermo-
fluid dynamic efficiency values obtained with available experimental results acquired
from commercial fills, concluded that this efficiency is not a function of the height of
the fill.
Sultan et al. (2002), investigated the independent variables controlling the
performance of a specific counter current packed tower for regeneration of liquid
desiccant. They plotted the experimental results to illustrate the effect of air and
liquid parameters on the output variables.
Khan et al. (2003), used a detailed model to investigate the performance
characteristics of counter flow wet cooling towers. According to this model, the
thermal performance of the cooling towers is explained with different air and water
temperatures. In this study, the variation of air and water temperatures along the
height of the tower is explained on psychometric charts. In addition to this, they
showed that the evaporation is the predominant mode of heat transfer.

2. LITERATURE SURVEY Eser Can KARA
30
Fisenko et al. (2004), developed a new mathematical model for performance
evaluation of a mechanical draft cooling tower and described heat and mass transfer
processes and the dynamics of fall of droplets. They determined the dependence of
the thermal efficiency of a mechanical draft cooling tower on the ratio between the
mass flow rates of water and air.
Soylemez (2004), presented a thermo-hydraulic performance optimization
analysis and estimated a simple algebraic formula for the optimum performance
point of counter flow forced draft cooling towers. He used the effectiveness-NTU
method in his study, together with the derivation of psychometric properties of moist
air based on a numerical approximation method for thermal performance analysis.
Kairouani et al. (2004), presented a mathematical model for the numerical
prediction of the thermal performance of cross flow cooling towers. Their model is
based on the heat and mass transfer equations. The leading parameters are the Lewis
number Le, the number of transfer units NTU, the percentage of water evaporation,
the water losses and the tower efficiency. These towers are employed to decrease the
temperature of geothermal water from 65 0C to 34
0C using a cross flow air. In order
to adopt the mathematical model, they collected several experimental data on site.
The total water and air mass flow rate value were 900 kg/s and 1840 kg/s
respectively. Their model has been used to predict the performance of cooling towers
in terms of the meteorological conditions prevailing in the South of Tunisia. They
determined an optimal water loss quantity. On an annual basis, the actual water
losses by evaporation represented 4% of the total water flow rate which correspond
to 106 m
3 /year.
Kloppers and Kröger (2005a), studied a detailed derivation of the heat and
mass transfer equations of evaporative cooling in wet cooling towers. They presented
these equations of the ε-NTU method applied to wet cooling towers. They gave a
more detailed representation of the Merkel number. They described the differences in
the heat and mass transfer analyses and solution techniques of the Merkel and Poppe
methods with the aid of enthalpy diagrams and psychometric charts.
Kloppers and Kröger (2005b), published a summary of some of the methods
that attempt to evaluate wet cooling towers performance. They compared cooling

2. LITERATURE SURVEY Eser Can KARA
31
tower performance obtained by Merkel, Poppe and ε-NTU methods. They
investigated the effects of the temperature inversion profile on the performance of
cooling towers.
Kloppers and Kröger (2005c), investigated the effect of the Lewis factor, or
Lewis relation, on the performance prediction of natural draft and mechanical draft
wet-cooling towers. The Lewis factor relates the relative rates of heat and mass
transfer in wet-cooling towers. In this study, the history and development of the
Lewis factor and its application in wet-cooling tower heat and mass transfer analyses
are discussed.
Kaiser et al. (2005), developed a numerical model for studying the
evaporative cooling processes that take place in a new type of cooling tower.
According to this study, in contrast to conventional cooling towers, they used a new
device called Hydrosolar Roof which presents lower droplet fall and uses renewable
energy instead of fans to generate the air mass flow within the tower. The main
results of this study showed the strong influence of the average water drop size on
efficiency of the system and revealed the effect of other variables like wet bulb
temperature, water mass flow to air mass flow ratio and temperature gap between
water inlet temperature and wet bulb temperature.
Elsarrag (2006), developed a model to predict the outlet conditions of a
cooling tower. He made some predictions by theoretical modeling which requires
heat and mass transfer correlations for the size of the packing material and outlet
conditions. He studied to evaluate the heat and mass transfer coefficients. He
developed a mass transfer coefficient correlation, and defined new variables.
According to his study, this correlation can predict the mass transfer coefficient
within an error of ±10%. He concluded with his study that the result of the models
showed good predictions of the outlet water and air temperature conditions within an
error of ±5%.
Papaefthimiou et al. (2006), developed an analytical model to describe
thermodynamically the water evaporation process inside a counter flow wet cooling
tower, where the air stream is in direct contact with the falling water, based on the
implementation of the energy and mass balance between air and water stream. They

2. LITERATURE SURVEY Eser Can KARA
32
described the rate of change of air temperature, humidity ratio, and water
temperature and evaporated water mass along tower height. According to their result,
the thermal performance of the cooling tower is sensitive to the degree of saturation
of inlet air. They showed that the cooling capacity of the cooling tower increases
with decreasing inlet air wet bulb temperature whereas the overall water temperature
fall is curtailed with increasing water to air mass ratio.
Jin et al. (2007), proposed a simplified mechanical cooling tower model for
control and optimization of HVAC systems. They developed the model on the basis
of Merkel‟s theory and ε-NTU method by energy balance and heat, mass transfer
analysis. To identify and validate the proposed model they used real operating data
from a HVAC system of a commercial hotel.
Muangnoi et al. (2007), have used the exergy analysis to investigate the
performance characteristics of counter flow wet cooling tower. They developed a
mathematical model based on heat and mass transfer principle. They validated the
model by experimental data analysis.
Lemouari et al. (2007), presented an experimental investigation of the thermal
performances of a forced draft counter flow wet cooling tower filled with an VGA
(Vertical Grid Apparatus) type packing. They studied the effects of the air and water
flow rates on the cooling water range as well as the tower characteristic, for different
inlet water temperatures.
Nunez et al. (2007), investigated temperature disturbances in a cooling
system in various ways, namely: changes in the wet bulb temperature, changes in the
heat load and by the deterioration of the coolers performance due to fouling. The
response of cooling systems to temperature disturbances is shown to be a function of
the overall system thermal effectiveness.
Gharagheizi et al. (2007), studied tower characteristics (KaV/L) with an
experimental and a comparative terms of water to air flow ratio (m w m a ). They
presented efficiency for two film type packings for a wide range of (m w m a ) ratio
from 0.2 to 4. They used VCP (vertical corrugated packing) and HCP (horizontal
corrugated packing) type packing in this study. They obtained from the results that
the performance of the cooling tower is affected by the type and arrangement of the

2. LITERATURE SURVEY Eser Can KARA
33
packings. Also, the tower performance showed a decrease with an increase in the
(m w m a ) ratio as is also observed in other types of cooling towers. The results
showed the tower with VCP has higher efficiency than the one with HCP.
Ataei et al. (2008), investigated the performance of a wet cooling tower for
different air and water temperatures and studied the influence of the environmental
conditions on the thermal efficiency of the cooling tower.
Muangnoi et al. (2008), analyzed the influence of the ambient temperature
and humidity on the performance of counter flow wet cooling towers. They
investigated the cooling tower performance with various inlet air conditions, relative
humidity and dry bulb temperature, while the water side condition is kept constant.
Sarker et al. (2008a), experimentally studied on the hybrid closed circuit
cooling tower (HCCCT) having a rated capacity of 136 kW. They investigated
cooling capacity and pressure drop with respect to variable air inlet velocities, wet-
bulb temperatures, cooling water inlet temperatures and air to cooling water volume
flow rate ratio (𝑚 𝑎 𝑚 𝑤 ). According to their study, performance characteristics from
the experimental study were found to conform well to the rated ones and the results
are supposed to serve as basic design parameter for the HCCCT.
Cortinovis et al. (2009), presented an approach for the systemic performance
analysis of a cooling water system. They combined the experimental design with
mathematical modeling. They carried out an experimental investigation to
characterize the mass transfer in the packing of the cooling tower as a function of the
liquid and gas flow rates.
Cortinovis et al. (2009), in the study of a systemic approach for optimal
cooling tower operation, developed an integrated model for the minimization of the
operating costs of a cooling water system that accounts for a cooling tower.
Lemouari et al. (2009), studied an experimental analysis of simultaneous heat
and mass transfer phenomena between water and air by direct contact in a packed
cooling tower. They investigated the effect of the air and water flow rates on the heat
and mass transfer coefficient as well as the evaporation rate of water into the air
stream, for different inlet water temperatures.

2. LITERATURE SURVEY Eser Can KARA
34
Lucas et al. (2009), studied the thermal performance of a forced draft counter-
flow wet cooling tower fitted with different drift eliminators for a wide range of air
and water mass flow rates. They employed the experimental set-up to obtain
correlations of the tower characteristic, which defines the cooling tower‟s thermal
performance. They predicted the outlet water temperature by these correlations and
compared with the experimentally registered values obtaining a maximum difference
of ±3%.
Marmouch et al. (2009), investigated experimentally the thermal performance
of a forced cooling tower used in a solar desalination system based on
humidification–dehumidification of air. They used a counter flow wet cooling tower
filled with film packing materials. They obtained the measured variables for wide
ranges of mass flow rates of air and water as well as for several inlet water
temperatures. Finally, they evaluate the tower characteristic and efficiency in terms
of water to air mass flow rate ratio.
Marques et al. (2009), presented open and closed-loop analysis of a counter
flow wet cooling tower with a shell and tube heat exchanger. They estimated the
water loss through evaporation and the energy consumption in the cooling tower
(pump and fans) in order to analyze its eco-efficiency. They presented, highlighting
the behavior of interactions between process outputs, such as the efficiency and
outlet air temperature, and the main input variables (water and air flows).
There are many studies on the cooling towers to investigate the cooling tower
performance. However, many of these studies are carried out in the theoretical
studies and these studies must be validated by experimental studies. The main
objective of this study is to experimentally investigate the performance of a forced
draft counter flow cooling tower with different air and water flow rates as well as,
with different water and air temperatures.

3. MATERIAL and METHOD Eser Can KARA
35
3. MATERIAL AND METHOD
3.1. Material
The experimental study is carried out at Çukurova University in Mechanical
Engineering laboratory in Adana. In this experiment counter flow forced draft
cooling tower is used. The schematic diagram of the counter flow cooling tower
main components and counter flow principle are illustrated in Figure 3.1.
As shown in Figure 3.1., the cooling tower is working in counter flow of air
and water. The air flows upwards while the water flows downwards on the packing
plates. The water is pumped from the water tank at the bottom of the tower and
enters the tower at the top while air flow enters the cooling tower from the bottom
forced by a fan.
Figure 3.1. A schematic diagram of the counter flow cooling tower
The experimental apparatus used in this study is illustrated Figure 3.2. and the
photograph of the apparatus is shown in Figure 3.3. In this study, counter flow forced
draft bench type P.A Hilton H891 type experimental machine is used which is

3. MATERIAL and METHOD Eser Can KARA
36
illustrated in Figure 3.3. It is a small-scale water cooling tower that includes all the
components of full-scale cooling tower.
Figure 3.2. Schematic of the experimental apparatus
1. Air inlet dry bulb thermocouple 20. Manometer
2. Air inlet wet bulb thermocouple 21. Orifice
3. Air outlet dry bulb thermocouple differential
4. Air outlet wet bulb thermocouple pressure
5. Water inlet thermocouple 22. Pressure drop
6. Water outlet thermocouple across packing
7. Fan 23. Water
8. Damper distribution
9. Air distribution chamber 24. Droplet
10. Water basin arrester
11. Load tank 25. Orifice
12. Make-up tan 26. Packing
13. Heaters (0.5-1.0 kW capacity) 27. Ice bath
14. Thermostat system 28. Data logger
15. Float valve 29. Computer
16. Pump
17. Recirculation
18. Flow meter control valve
19. Flow meter (rotameter)

3. MATERIAL and METHOD Eser Can KARA
37
Figure 3.3. Photograph of the experimental apparatus
The cooling tower experimental apparatus shown in Figure 3.3., mainly
consists of base unit, packed column and column cap. All components mounted on a
robust base with integral instrument panel. The base unit components include, air
distribution chamber, a load tank with a 3 liter water capacity, a make-up tank with
gauge mark and float operated control valve, 0.5 kW and 1.0 kW capacity electric
heaters, a centrifugal fan with intake damper, a bronze and stainless steel pump, a
water collecting basin and an electrical control panel.
The dimensions of the packed column are 150 x 150 x 600 mm, fabricated
from clear PVC, includes pressure tapping points, and contains packing with eight
decks (which consist of ten plates per deck) of inclined, wettable, laminated plastic
plates. The packing data used in the experiments are listed in Table 3.1. The column
cap includes 80 mm diameter sharp edged orifice and pressure tapping, a droplet
arrester, a water distributor.
In this experiment, instrumentations include thermocouples with type-K to
measure the temperatures in six point, inclined tube manometer with a range of 0 to
40 mm-H2O, variable area flow meter with a range of 0 to 50 gram meter per second
(GMPS).

3. MATERIAL and METHOD Eser Can KARA
38
Table 3.1. Packing data used in the experiments
Parameters Dimensions
Height, m 0.48
Width, m 0.15
Length, m 0.15
Number of decks 8
Number of plates per deck 10
Total surface area of packing, m2 1.19
The data acquisition system (data logger and computer), and ice bath
container as shown in Figure 3.2. added to this apparatus. An ice bath container is
prepared, which consist of a mixture of melting ice and water forms to bring the
reference junctions of the thermocouples to 0 0C.
In this study, the inlet and outlet air (dry and wet bulb) and water
temperatures are measured. Thermocouples with the uncertainty of ±0.5 0C are
employed to measure the dry and wet bulb temperatures at the base (1 and 2) and at
the top of the column (3 and 4), and the water inlet and outlet temperatures (5 and 6)
respectively as shown in Figure 3.2.
The start-up procedure of the experimental apparatus is briefly given in
Appendix. The experimental procedure is as follows. The water in the load tank is
heated before its entering the cooling tower. The close loop of hot water consists of
two electric heaters which are 0.5 kW and 1.0 kW capacity controlled by adjusting
the voltage. Therefore, the system may accordingly be run at power input rates of 0.5
– 1.0 and 1.5 kW. Subsequently, after the temperature of the water is adjusted to
achieve the desired level, the temperature of the water is measured (5) prior to
injection at the top of the tower. The heated water is pumped to the top of the tower
at a rate that may be controlled using a needle valve mounted at the base of the mass
flow rate measuring flow meter (rotameter). The pump‟s power consumption is
approximately 0.1 kW and one can assume that all this pump work is consumed by
the water.
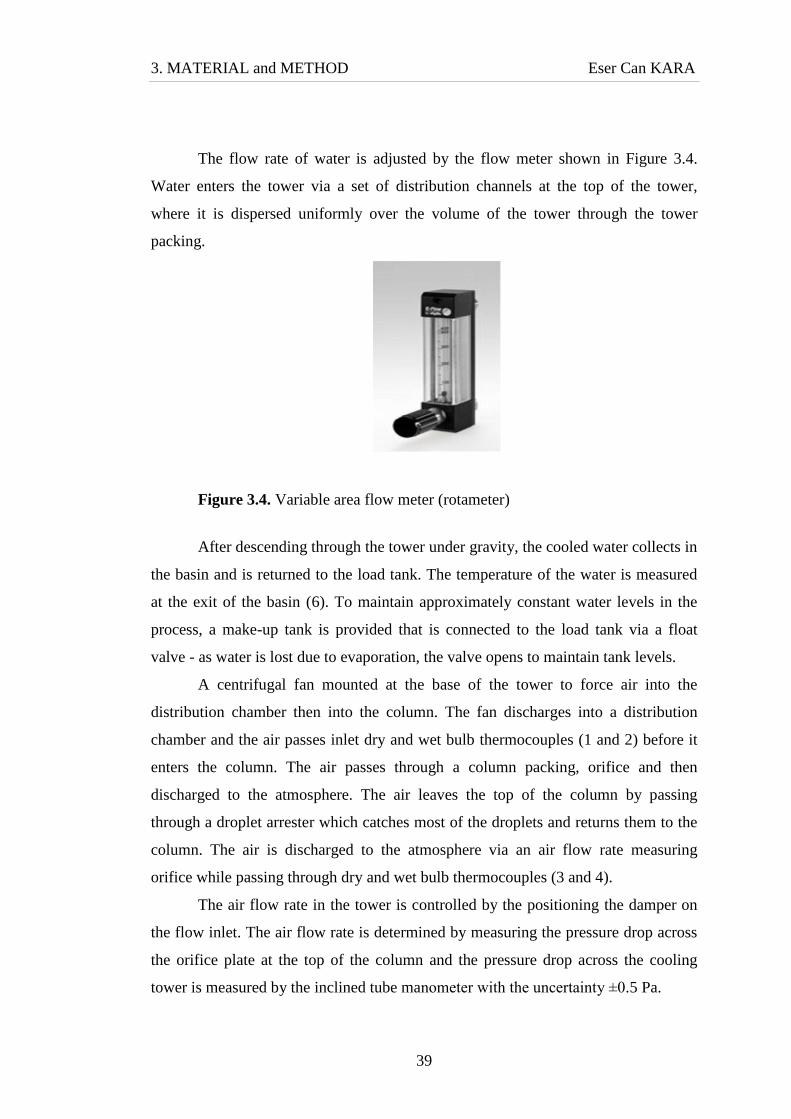
3. MATERIAL and METHOD Eser Can KARA
39
The flow rate of water is adjusted by the flow meter shown in Figure 3.4.
Water enters the tower via a set of distribution channels at the top of the tower,
where it is dispersed uniformly over the volume of the tower through the tower
packing.
Figure 3.4. Variable area flow meter (rotameter)
After descending through the tower under gravity, the cooled water collects in
the basin and is returned to the load tank. The temperature of the water is measured
at the exit of the basin (6). To maintain approximately constant water levels in the
process, a make-up tank is provided that is connected to the load tank via a float
valve - as water is lost due to evaporation, the valve opens to maintain tank levels.
A centrifugal fan mounted at the base of the tower to force air into the
distribution chamber then into the column. The fan discharges into a distribution
chamber and the air passes inlet dry and wet bulb thermocouples (1 and 2) before it
enters the column. The air passes through a column packing, orifice and then
discharged to the atmosphere. The air leaves the top of the column by passing
through a droplet arrester which catches most of the droplets and returns them to the
column. The air is discharged to the atmosphere via an air flow rate measuring
orifice while passing through dry and wet bulb thermocouples (3 and 4).
The air flow rate in the tower is controlled by the positioning the damper on
the flow inlet. The air flow rate is determined by measuring the pressure drop across
the orifice plate at the top of the column and the pressure drop across the cooling
tower is measured by the inclined tube manometer with the uncertainty ±0.5 Pa.

3. MATERIAL and METHOD Eser Can KARA
40
3.1.1. Experimental Procedure and Data Collection
The objective of this experimental study is to investigate the performance of
the tower at varying air and water flow rates under varying heating conditions. In
order to complete the required calculations, the following data are collected at steady
state:
The inlet air dry and wet-bulb temperatures (1 and 2)
The outlet air dry and wet-bulb temperatures (3 and 4)
The inlet and outlet water temperatures (5 and 6)
The air flow rate, as quantified by the inclined manometer head measurement
The water mass flow rate by a variable area flow meter
The pressure drop across the packing
The principal of the achievement of steady state is the inlet and outlet water
temperatures; when these temperatures are varying by 0.1˚C or less during a given
time interval, steady state has been achieved. After the steady state is established, the
air and water flows are set at the desired level and all quantities are recorded. The
heaters switched on to the adjusted settings and all quantities are recorded on regular
intervals. This process repeated by adjusting the water and air flow rates. The water
level in the make-up tank is observed throughout all the experiments and if the water
level fallen too low in the load tank, and water added carefully to the make-up tank.
All data are recorded with a data recorder and then computer processed by
using a program to convert the mV temperature recordings to centigrade SI-units to
display operating state parameters (thermocouple measurements). After that,
Microsoft EXCEL program is used to monitor the data recordings.

3. MATERIAL and METHOD Eser Can KARA
41
3.2. Method
The first practical theory of cooling tower operation was developed by
Merkel (1925) who combined the equations for heat and water vapor transfer. Merkel
developed a cooling tower theory for the mass and sensible heat transfer between the
air and water in a counter flow cooling tower. This is a simple and approximate
method that can be easily maintained by numerical calculation and graphical
technique. The method has been used in various fields, such as all evaporative heat
exchangers, evaporative condensers, fluid coolers, air washers and humidifiers.
A simplified Merkel theory has been used for the analysis of cooling tower,
but Merkel‟s model is not accurate enough and not suitable for real applications. A
number of assumptions and approximations were used to simplify the development
of the final equation (Baker and Shryock, 1961).
The basic approximations in Merkel‟s theory are:
The Lewis number, which is connects heat and mass transfer for humid air
is considered constant and equal to unity. Lewis number defined as:
𝐿𝑒 =𝑎𝑎
𝐷𝑎 (3.1)
Where, 𝑎𝑎 and 𝐷𝑎 are thermal diffusivity and mass diffusivity of moist air.
This assumption has a small influence but affects results at low ambient
temperatures (Kloppers and Kröger, 2005a). On the other hand, according to
Kloppers and Kröger (2005c), if the same definition or value of the Lewis factor is
employed in the subsequent cooling tower performance analysis, the water outlet
temperature will be accurately predicted.
The resistance for heat and mass transfer in the liquid film is negligible.
The mass flow rate of water per unit of cross sectional area of the tower is
constant; it means there is no loss of water due to evaporation.

3. MATERIAL and METHOD Eser Can KARA
42
The specific heat of the air-stream mixture at constant pressure is the same
as that of the dry air.
Merkel (1925) demonstrated that the total heat transfer is directly
proportional to the difference between the enthalpy of saturated air at the water
temperature and the enthalpy of air at the point of contact with water. He showed that
total heat or enthalpy difference as a driving force allow for both sensible and latent
heats. The analysis under these approximations combines the sensible and latent heat
transfer into an over-all process based on enthalpy potential as driving force (Baker
and Shyrock, 1961).
When heat is added to a substance then there is usually an increase in
temperature and hence the internal energy and the enthalpy will increase. This is
referred to as sensible heat. However when heat is added to a substance sometimes a
change of state will occur (melting or boiling) rather than a change of temperature.
This is known as latent heat.
In the cooling tower heat is transferred as sensible heat due to the
temperature difference between liquid and gas phases and as the latent heat of the
water as it evaporates. Mass (water vapor) is transferred due to the difference
between the vapor pressure at the air-liquid interface and the partial pressure of water
vapor in the bulk of the air.
The theory considers the flow of mass (latent heat) and energy (sensible heat)
from the bulk water to an interfacial film, and then from the interfacial film to the
surrounding air flow as shown in Figure 3.5. The heat flow crosses these two
boundaries, each offering resistance resulting in gradients in temperature, enthalpy,
and humidity. As shown in the Figure 3.5. T, 𝑇′′, and 𝑇 are temperatures, ℎ′, ℎ′′, and
ℎ are enthalpies, 𝑥′, 𝑥′′, and 𝑥 are absolute humidities of the bulk water, interfacial
film and bulk air respectively.
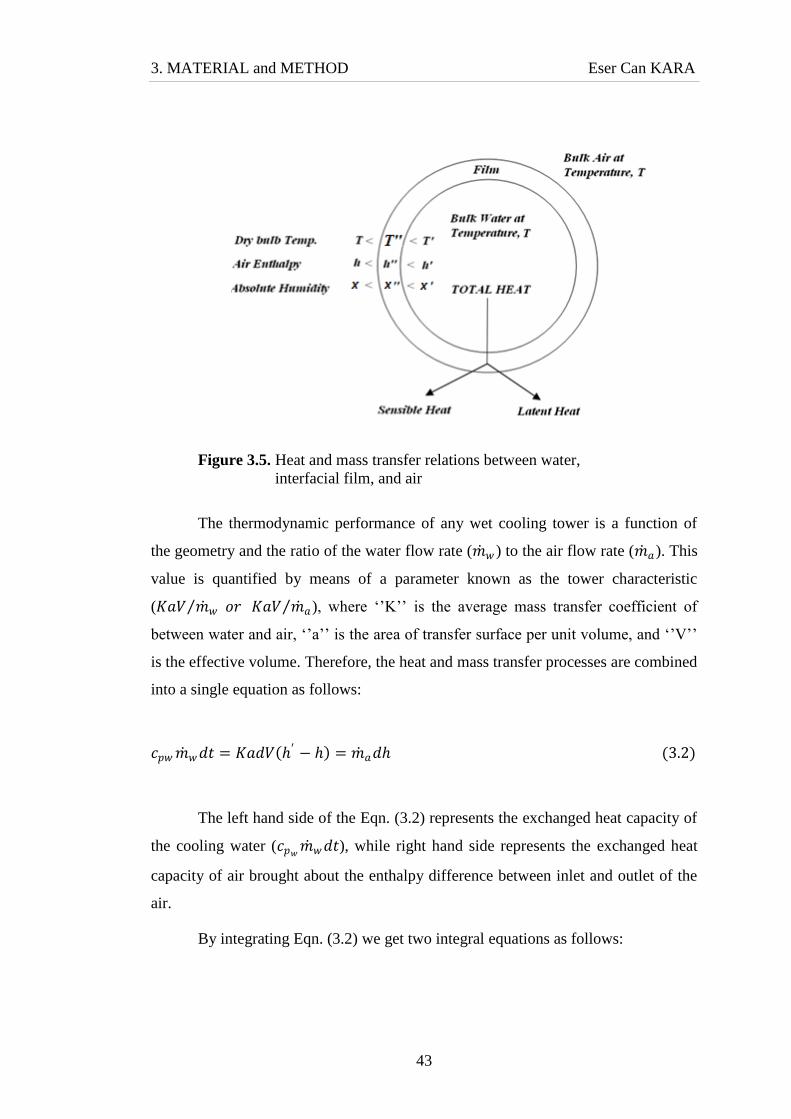
3. MATERIAL and METHOD Eser Can KARA
43
Figure 3.5. Heat and mass transfer relations between water,
interfacial film, and air
The thermodynamic performance of any wet cooling tower is a function of
the geometry and the ratio of the water flow rate (𝑚 𝑤 ) to the air flow rate (𝑚 𝑎 ). This
value is quantified by means of a parameter known as the tower characteristic
(𝐾𝑎𝑉 𝑚 𝑤 𝑜𝑟 𝐾𝑎𝑉 𝑚 𝑎 ), where „‟K‟‟ is the average mass transfer coefficient of
between water and air, „‟a‟‟ is the area of transfer surface per unit volume, and „‟V‟‟
is the effective volume. Therefore, the heat and mass transfer processes are combined
into a single equation as follows:
𝑐𝑝𝑤𝑚 𝑤𝑑𝑡 = 𝐾𝑎𝑑𝑉 ℎ′ − ℎ = 𝑚 𝑎𝑑ℎ (3.2)
The left hand side of the Eqn. (3.2) represents the exchanged heat capacity of
the cooling water (𝑐𝑝𝑤𝑚 𝑤𝑑𝑡), while right hand side represents the exchanged heat
capacity of air brought about the enthalpy difference between inlet and outlet of the
air.
By integrating Eqn. (3.2) we get two integral equations as follows:
3. MATERIAL and METHOD Eser Can KARA
44
𝐾𝑎𝑉
𝑚 𝑤= 𝑐𝑝𝑤
𝑑𝑡
ℎ′ − ℎ
𝑡2
𝑡1
(3.3)
𝐾𝑎𝑉
𝑚 𝑎=
𝑑ℎ
ℎ′ − ℎ
ℎ2
ℎ1
(3.4)
The integral Eqn. (3.3) and (3.4) are defined as number of transfer units
(NTU), which is required to cool the water from its inlet temperature to its exit
temperature. While deriving these integrals Eqn. (3.3) and (3.4), as we can see
clearly that resistance to heat and mass transfer from bulk water to interface, which
are illustrated in Figure 3.5., and water loss due to the evaporation, are neglected.
One numerical solution to the integral expression in Eqn. (3.3) is given by:
𝐾𝑎𝑉
𝑚 𝑤=
𝑐𝑝𝑤 (𝑡2 − 𝑡1)
∆ℎ𝑚 (3.5)
Where ∆ℎ𝑚 is the logarithmic mean enthalpy and generally know as mean
driving force. The enthalpy difference method is given to calculate the mean driving
force (∆ℎ𝑚).
3.2.1. Enthalpy Difference Method
The counter flow cooling tower operating lines and moist air enthalpy plotted
to water enthalpy is illustrated in Figure 3.6. Since it is difficult to know exactly
the air humidity at tower outlet, due to changes along the section, an
alternative method (enthalpy difference) is used.
In the cooling tower there is a thin film of saturated air at water temperature
(𝑇𝑤 ). This air has an enthalpy (ℎ𝑎 ,𝑤 ) which is greater than that of the ambient air

3. MATERIAL and METHOD Eser Can KARA
45
(ℎ𝑎 ). Therefore, for any given value of water temperature, there exists an enthalpy
difference (∆ℎ) between the enthalpy of the film and enthalpy of the ambient air.
Figure 3.6. A chart for the mean enthalpy differences
Enthalpy differences ∆ℎ1 and ∆ℎ2 are shown in the Figure 3.6. and calculated
from Eqn. (3.6) and (3.7) respectively:
∆ℎ1 = ℎ𝑎 ,𝑤𝑖 − ℎ𝑎 ,𝑜 (3.6)
∆ℎ2 = ℎ𝑎 ,𝑤𝑜 − ℎ𝑎 ,𝑖 (3.7)
Where, ℎ𝑎 ,𝑖 and ℎ𝑎 ,𝑜 are the enthalpies of the air at the inlet and at the outlet,
and ℎ𝑎 ,𝑤𝑖 and ℎ𝑎 ,𝑤𝑜 are the enthalpies of the air at the water inlet (𝑇𝑤 ,𝑖) and at the
water outlet temperature (𝑇𝑤 ,𝑜 ) respectively as shown in Figure 3.7.
The mean value of enthalpy difference is called as mean driving force (∆ℎ𝑚 ).
By calculating the enthalpy differences ∆ℎ1 and ∆ℎ2 above, we can calculate the
mean enthalpy difference (∆ℎ𝑚 ) from Eqn. (3.8):

3. MATERIAL and METHOD Eser Can KARA
46
∆ℎ𝑚 =∆ℎ1 − ∆ℎ2
𝑙𝑛∆ℎ1
∆ℎ2
(3.8)
The air enthalpy difference is calculated from Eqn. (3.9):
∆ℎ𝑎 = ℎ𝑎 ,𝑜 − ℎ𝑎 ,𝑖 (3.9)
Merkel number (𝑀𝑒), which is another cooling tower characteristic parameter
is calculated from Eqn. (3.10):
𝑀𝑒 =∆ℎ𝑎
∆ℎ𝑚 (3.10)
Figure 3.7. Schematic representation of the air and water streams
entering and leaving the cooling tower

3. MATERIAL and METHOD Eser Can KARA
47
The selection of an appropriate cooling tower depends on many factors, such
as capacity, availability, cost and effectiveness. The effectiveness of a cooling tower
is defined as the ratio of the heat transfer rate to the theoretical maximum heat
transfer rate and calculated from Eqn. (3.11):
𝜀 =𝑄
𝑄 𝑚𝑎𝑥
(3.11)
Heat transfer rate (𝑄 ) is calculated from Eqn. (3.12):
𝑄 = 𝑚 𝑎 ℎ𝑎 ,𝑜 − ℎ𝑎 ,𝑖 (3.12)
The maximum possible heat transfer rate (𝑄 𝑚𝑎𝑥 ), occurs if the air leaves the
cooling tower completely saturated at the temperature of the incoming water.
Therefore, 𝑄 𝑚𝑎𝑥 is calculated from Eqn. (3.13) as follows:
𝑄 𝑚𝑎𝑥 = 𝑚 𝑎 ℎ𝑎 ,𝑤𝑖 − ℎ𝑎 ,𝑖 (3.13)
By replacing the values of 𝑄 and 𝑄 𝑚𝑎𝑥 as introduced in Eqn. (3.12) and
(3.13) respectively, we can calculate the 𝜀 values of the cooling tower for different
operating conditions as follows:
𝜀 =ℎ𝑎 ,𝑜 − ℎ𝑎 ,𝑖
ℎ𝑎 ,𝑤𝑖 − ℎ𝑎 ,𝑖 (3.14)
3.2.2. Psychometric Analysis
The mass transfer distribution to the total cooling is illustrated in the
simplified psychometric chart in Figure 3.8. Total cooling is the sum of latent heat
transfer caused by the evaporation of water and the sensible heat transfer. Points A
and D illustrate the conditions of the air entering the cooling tower. After the air
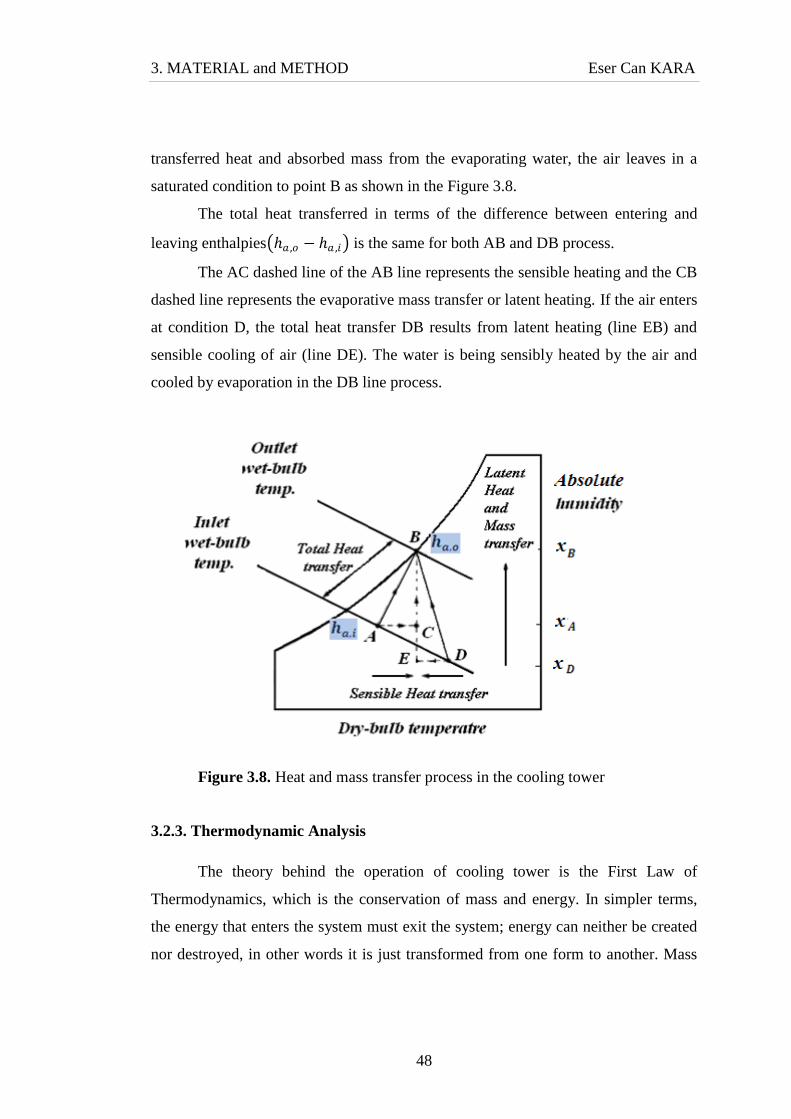
3. MATERIAL and METHOD Eser Can KARA
48
transferred heat and absorbed mass from the evaporating water, the air leaves in a
saturated condition to point B as shown in the Figure 3.8.
The total heat transferred in terms of the difference between entering and
leaving enthalpies ℎ𝑎 ,𝑜 − ℎ𝑎 ,𝑖 is the same for both AB and DB process.
The AC dashed line of the AB line represents the sensible heating and the CB
dashed line represents the evaporative mass transfer or latent heating. If the air enters
at condition D, the total heat transfer DB results from latent heating (line EB) and
sensible cooling of air (line DE). The water is being sensibly heated by the air and
cooled by evaporation in the DB line process.
Figure 3.8. Heat and mass transfer process in the cooling tower
3.2.3. Thermodynamic Analysis
The theory behind the operation of cooling tower is the First Law of
Thermodynamics, which is the conservation of mass and energy. In simpler terms,
the energy that enters the system must exit the system; energy can neither be created
nor destroyed, in other words it is just transformed from one form to another. Mass

3. MATERIAL and METHOD Eser Can KARA
49
and energy balance equations are derived by using the control volume (chain line)
shown in the Figure 3.9.
Heat is transferred at the load tank, the process load and possibly a small
quantity to surroundings. Work is transferred at the pump. Low humidity air enters
the tower at 𝐴, whereas high humidity air leaves the tower at 𝐵 and make-up water
enters the tower at 𝐸. The rate at which the water leaves the make-up tank is assumed
approximately equal to the rate of evaporation of the water in the tower.
Figure 3.9. Schematic of the cooling tower control volume
for mass and energy balance
By conservation of mass, under steady state conditions, the mass flow rate of
dry air and of H2O (as liquid or vapor) must be the same at inlet and outlet to any
system. Therefore, under steady-state conditions, from the mass conservation of air
and water we get:
3. MATERIAL and METHOD Eser Can KARA
50
Mass Balance:
𝑚 𝑎 𝐴 = 𝑚 𝑎 𝐵 = 𝑚 𝑎 (3.15)
and,
𝑚 𝑣 𝐵 = 𝑚 𝑣 𝐴 = 𝑚 𝑤 𝐸 (3.16)
Where subscripts a, v, and w are denote, respectively, air, vapor, and water.
The mass flow rate of dry air 𝑚𝑎 through the cooling tower is a constant,
whereas the mass flow rate of moist air increases due to the evaporation of some of
the water. The ratio of steam to air (x) is known for the initial and final state points
on the psychometric charts. The mass conservation can be rewritten in terms of the
absolute humidity as:
𝑥𝐵−𝑥𝐴 =𝑚 𝑤 ,𝐸
𝑚 𝑎 (3.17)
Thermodynamics also dictate that the heat removed from the water must be
equal to the heat absorbed by the surrounding air.
Using the first law of thermodynamics to write the energy balance we get:
Energy Balance:
𝑄 − 𝑊 = 𝐻 𝑂𝑢𝑡𝑙𝑒𝑡 − 𝐻 𝐼𝑛𝑙𝑒𝑡 (3.18)
𝑄 − 𝑊 = ℎ𝑎 + 𝑥ℎ𝑣 𝐵 − ℎ𝑎 + 𝑥ℎ𝑣 𝐴 − 𝑚 𝑤ℎ𝑤 ,𝐸 (3.19)

3. MATERIAL and METHOD Eser Can KARA
51
If the enthalpy of the air includes the enthalpy of the steam associated with it,
and this quantity can be express per unit mass of dry air, then the Eqn. (3.19) may be
rewritten as:
𝑄 − 𝑊 = 𝑚 𝑎 ℎ𝐵 − ℎ𝐴 − 𝑚 𝑤ℎ𝑤 ,𝐸 (3.20)
The term in (𝑚 𝑤ℎ𝑤 ,𝐸 ) in the Eqn. (3.20) is usually small when compared to
the other terms and is often neglected.
To calculate the mass flow rate of air by measuring the pressure difference
following definitions are given. The values of specific volume on a psychometric
chart are for 1 kg of dry air the stated total pressure. However, associated with 1 kg
of dry air is 𝑥 kg of water vapor, giving a total mass of (1 + 𝑥) kg. Thus, the specific
volume of the air and stream mixture is 𝑣𝑎 (1 + 𝑥 ).
The air mass flow rate through the orifice is given by:
m = 0.0137 ∆P′
𝑣B (3.21)
Where 𝑣B is the true specific volume.
Thus,
The mass flow rate of dry air = (1 1 + 𝑥 ) *Mass flow rate of air and stream mixture
m a = (1 1 + xB ) ∗ 0.0137 ∆P′(1 + xB)
𝑣aB (3.22)
The pressure difference (∆P′) is measured by the inclined manometer and the
air mass flow rate is obtained from the formula:
3. MATERIAL and METHOD Eser Can KARA
52
m a = 0.0137 ∆P′
𝑣aB(1 + xB ) (3.23)
Where „‟∆𝑃′‟‟ is the pressure difference between the atmosphere and the air
stream; „‟𝑣aB‟‟ is the specific volume of the water-air mixture leaving the top of the
cooling tower.

4. RESULTS and DISCUSSIONS Eser Can KARA
53
4. RESULTS AND DISCUSSIONS
In this study the influence of different parameters such as water flow rate
(m w ), air flow rate (m a), heat load (𝑄 ), inlet water temperature (𝑇𝑤 ,𝑖), and inlet wet
bulb temperature (𝑇𝑤𝑏 ,𝑖) on the cooling tower performance are studied
experimentally.
To investigate the performance of the cooling tower, different combined
parameters such as approach of the cooling tower, range (𝑅) of the cooling tower,
heat load and the ratio of the water mass flow rate, to air mass flow rate.
In the cooling tower performance analysis, approach and range terms are used
very often. The difference between outlet water and surrounding air inlet wet bulb
temperature is called "approach" of the cooling tower. Another performance
parameter is the difference between the temperature of the hot water entering the
cooling tower and the temperature of the colder water leaving the tower, usually
referred to as "range" of the cooling tower. Therefore, the performance of a cooling
tower depends on the range of cooling tower and the approach of the cooling tower
and the ratio of water mass flow rate to the air mass flow rate (m w m a ).
4.1. Pressure Drop Across Packing
The pressure drop across packing (∆𝑃) through a forced draft cooling tower
depends on the geometry of the packing as well as the water and air flow rates along
the tower. Therefore, if the velocity of air flow is decreased in the cooling tower, the
air side pressure tends to drop. These areas where the pressure losses of air occur in
the forced draft cooling tower, are; at air inlet (entrance losses), in the fill passages,
pressure losses due to water distribution system and pressure losses across the fan
rotor.
To study the effect of air mass flow rate on pressure drop across packing
(∆𝑃), observations are used in Table 4.1. The variation of ∆𝑃 with respect to air
velocities (0.65 – 2.45 m/s) for different water mass flow rates (0.03 – 0.05 kg/s) are
shown in the Figure 4.1.

4. RESULTS and DISCUSSIONS Eser Can KARA
54
Table 4.1. Summary of the experiment data with different air mass
flow rates at constant heat load
Goshayshi and Missenden (2000), investigated the pressure drop with respect
to water mass flux for two types of packing, smooth and ribbed, both of PVC.
According to their study, pressure drop across the packing (∆𝑃) increases with
increasing water mass flow rate at constant air mass flow rate. This relation also can
be seen clearly in this study as air mass flow rates constant, pressure drop increases
with increasing water mass flow rates as shown in Figure 4.1. For example, for air
velocity constant at 2.45 m/s, water mass flow rates are 0.03 – 0.04 – 0.05 kg/s and
pressure drops are measures as 4.8 – 7.4 – 12.1 mm-H2O respectively. The higher the
water mass flow rate, the higher the pressure drop as illustrated in Figure 4.1. In
addition to this, if water mass flow rate increases, pressure drop increases but at
𝑇𝑎 ,𝑖 ,𝑑𝑏
(0C)
𝑇𝑎 ,𝑖 ,𝑤𝑏
(0C)
𝑇𝑎 ,𝑜 ,𝑑𝑏
(0C)
𝑇𝑎 ,𝑜 ,𝑤𝑏
(0C)
𝑇𝑤 ,𝑖
(0C)
𝑇𝑤 ,𝑜
(0C)
∆𝑃′
(mm-H2O)
∆𝑃
(mm-H2O)
Case 1 𝑚 𝑤 = 0.03 𝑘𝑔 𝑠 , 𝑄 = 1.6 𝑘𝑊
25.7 23.3 38.7 38.6 41.0 27.3 19 4.8
26.4 23.2 39.9 39.8 43.3 30.0 10.5 2.8
27.5 23.4 41.2 41.0 48.0 37.5 5 1.5
29.3 23.5 44.4 44.3 56.1 46.8 1.5 0.3
Case 2 𝑚 𝑤 = 0.04 𝑘𝑔 𝑠 , 𝑄 = 1.6 𝑘𝑊
26.4 22.8 34.5 34.4 37.5 26.2 19 7.4
27.2 22.9 35.8 35.6 39.3 28.4 10.5 4.1
27.9 23.1 37.2 37.0 44.4 35.0 5 2.5
29.2 23.3 38.6 38.4 50.0 42.6 1.5 0.5
Case 3 𝑚 𝑤 = 0.05 𝑘𝑔 𝑠 , 𝑄 = 1.6 𝑘𝑊
25.4 22.7 30.0 29.9 33.2 25.8 19 12.1
26.5 23.1 30.9 30.7 35.0 27.9 10.5 7.9
27.2 22.9 32.5 32.3 39.4 32.7 5 4.7
28.6 23.0 34.7 34.5 45.6 39.0 1.5 2.4

4. RESULTS and DISCUSSIONS Eser Can KARA
55
higher water mass flow rates, increasing rate of pressure drop tends to increase
rapidly due to friction factor along the tower packing.
Figure 4.1. Variation of pressure drop across packing with different
air velocities
Milosavljevic and Heikkila (2001) experimentally studied the forced draft
counter flow cooling tower in order to analyze the performance of different cooling
tower filling materials. Mass flow rates of air and water varied from 2 to 6 kg/m2s
and 1.9 to 7 kg/m2s, respectively in their study. The objective of their study is to
obtain a filling material that enables a compact cooling tower design with a low
space requirement and fan power consumption. Thus, they investigated the air side
pressure loss for the different filling materials when the air flow rates constant (3.5
kg/ m2s) with different water mass flow rates (2 to 6 kg/m
2s). They found that plates
with corrugated pattern type fill give the best combination of heat transfer and
pressure losses.
Sarker et al. (2008a), and (2008b), studied the effect of air velocity on the
pressure drop. They investigated several cases of pressure drop with respect to
0
2
4
6
8
10
12
14
16
0.0 0.5 1.0 1.5 2.0 2.5 3.0
Pre
ssu
re d
rop
,∆P
(mm
-H2O
)
Air Velocity, (m/s)
0.03
0.04
0.05
Twb,i = 23 0CQ = 1.6 kW
mw (kg/s)
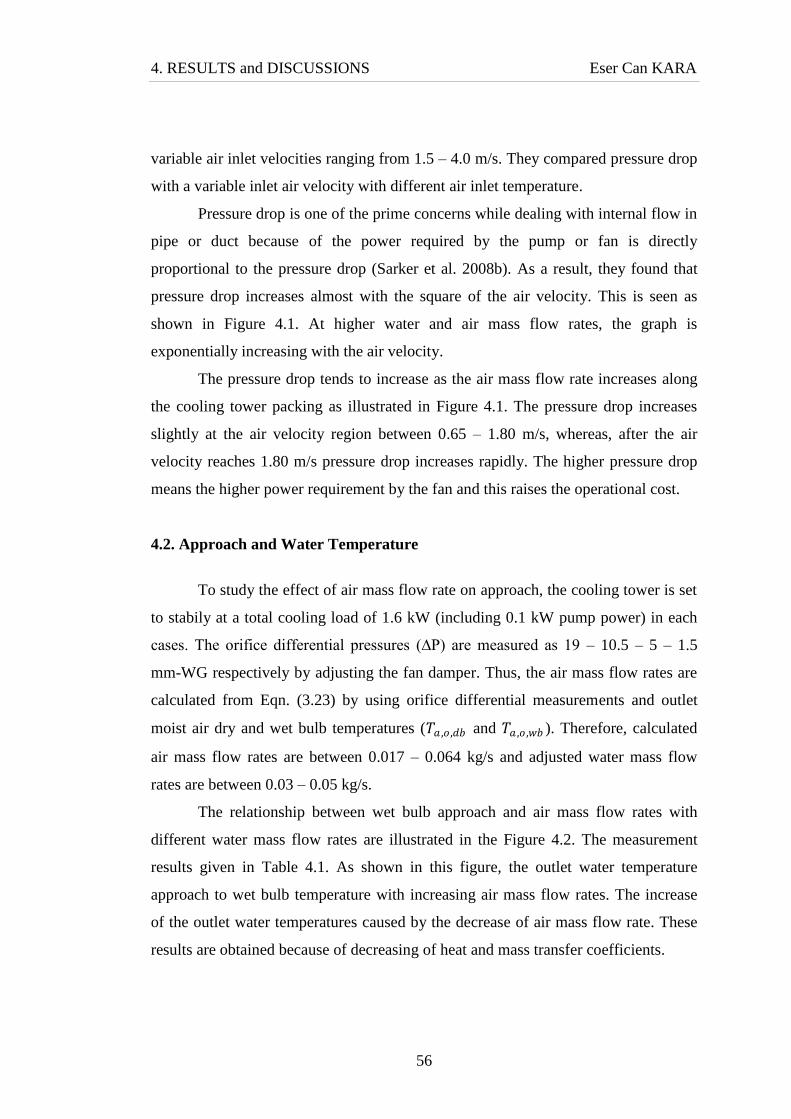
4. RESULTS and DISCUSSIONS Eser Can KARA
56
variable air inlet velocities ranging from 1.5 – 4.0 m/s. They compared pressure drop
with a variable inlet air velocity with different air inlet temperature.
Pressure drop is one of the prime concerns while dealing with internal flow in
pipe or duct because of the power required by the pump or fan is directly
proportional to the pressure drop (Sarker et al. 2008b). As a result, they found that
pressure drop increases almost with the square of the air velocity. This is seen as
shown in Figure 4.1. At higher water and air mass flow rates, the graph is
exponentially increasing with the air velocity.
The pressure drop tends to increase as the air mass flow rate increases along
the cooling tower packing as illustrated in Figure 4.1. The pressure drop increases
slightly at the air velocity region between 0.65 – 1.80 m/s, whereas, after the air
velocity reaches 1.80 m/s pressure drop increases rapidly. The higher pressure drop
means the higher power requirement by the fan and this raises the operational cost.
4.2. Approach and Water Temperature
To study the effect of air mass flow rate on approach, the cooling tower is set
to stabily at a total cooling load of 1.6 kW (including 0.1 kW pump power) in each
cases. The orifice differential pressures (∆P) are measured as 19 – 10.5 – 5 – 1.5
mm-WG respectively by adjusting the fan damper. Thus, the air mass flow rates are
calculated from Eqn. (3.23) by using orifice differential measurements and outlet
moist air dry and wet bulb temperatures (𝑇𝑎 ,𝑜 ,𝑑𝑏 and 𝑇𝑎 ,𝑜 ,𝑤𝑏 ). Therefore, calculated
air mass flow rates are between 0.017 – 0.064 kg/s and adjusted water mass flow
rates are between 0.03 – 0.05 kg/s.
The relationship between wet bulb approach and air mass flow rates with
different water mass flow rates are illustrated in the Figure 4.2. The measurement
results given in Table 4.1. As shown in this figure, the outlet water temperature
approach to wet bulb temperature with increasing air mass flow rates. The increase
of the outlet water temperatures caused by the decrease of air mass flow rate. These
results are obtained because of decreasing of heat and mass transfer coefficients.

4. RESULTS and DISCUSSIONS Eser Can KARA
57
Figure 4.2. Variation of wet bulb approach with air mass flow rate
for different water mass flow rates
Variation of water inlet and outlet temperature with air mass flow rate for
different values of water mass flow rate is shown in Figure 4.3 and Figure 4.4.
respectively. As shown in the Figure 4.3. for each values of air mass flow rates, as
water mass flow rate increases the inlet water temperature decreases. For instance, as
air mass flow rate of 0.064 kg/s and water mass flow rate of 0.03 kg/s, 0.04 kg/s and
0.05 kg/s, the water inlet temperature is measured as 41 0C , 37.5
0C and 33.2
0C
respectively. As shown in Figure 4.4. for each values of air mass flow rate, the outlet
water temperature decreases as air mass flow rate increases. For instance, as air mass
flow rate of 0.064 kg/s and water mass flow rate of 0.03 kg/s, 0.04 kg/s and 0.05
kg/s, the water outlet temperature is measured as 27.3 0C , 26.2
0C and 25.8
0C
respectively.
0
5
10
15
20
25
30
0.01 0.02 0.03 0.04 0.05 0.06 0.07
Ap
pro
ach
, (0 C
)
Air mass flow rate, ma ,(kg/s)
0.03
0.04
0.05
Twb,i = 23 0CQ = 1.6 kW
mw (kg/s)

4. RESULTS and DISCUSSIONS Eser Can KARA
58
Figure 4.3. Variation of water inlet temperature with air mass flow rate
for different water mass flow rates
Figure 4.4. Variation of water outlet temperature with air mass flow rate
for different water mass flow rates
10
20
30
40
50
60
0.00 0.01 0.02 0.03 0.04 0.05 0.06 0.07
Inle
t w
ater
tem
per
atu
re, T
w,i
, (0 C
)
Air mass flow rate, ma ,(kg/s)
0.03
0.04
0.05
mw (kg/s)
Twb,i = 23 0CQ = 1.6 kW
10
20
30
40
50
60
0.00 0.01 0.02 0.03 0.04 0.05 0.06 0.07
Ou
tlet
wat
er t
emp
erat
ure
, Tw
,o, (
0C
)
Air mass flow rate, ma ,(kg/s)
0.03
0.04
0.05
mw (kg/s)
Twb,i = 23 0CQ = 1.6 kW

4. RESULTS and DISCUSSIONS Eser Can KARA
59
Variation of water inlet and outlet temperature with water to air mass flow
rate ratio (m w m a ) for different values of air mass flow rate is shown in Figure 4.5
and Figure 4.6. respectively.
As shown in Figure 4.5. and Figure 4.6. the rate of increase in water
temperature is quite small at low water to air mass flow rate ratios. For the best
performance, water should be cooled to the entering air wet bulb temperature. In
theory, this is possible when the packing heights approaching to infinity.
Figure 4.5. Variation of water inlet temperature with water to air mass flow
rate ratio for different air mass flow rates
0
10
20
30
40
50
60
70
0.0 0.5 1.0 1.5 2.0 2.5 3.0 3.5
Inle
t w
ater
tem
per
atu
re, T
w,i
, (0C
)
Water to air mass flow rate ratio, mw/ma,
0.064
0.047
0.032
0.017
ma (kg/s)
Twb,i = 23 0CQ = 1.6 kW
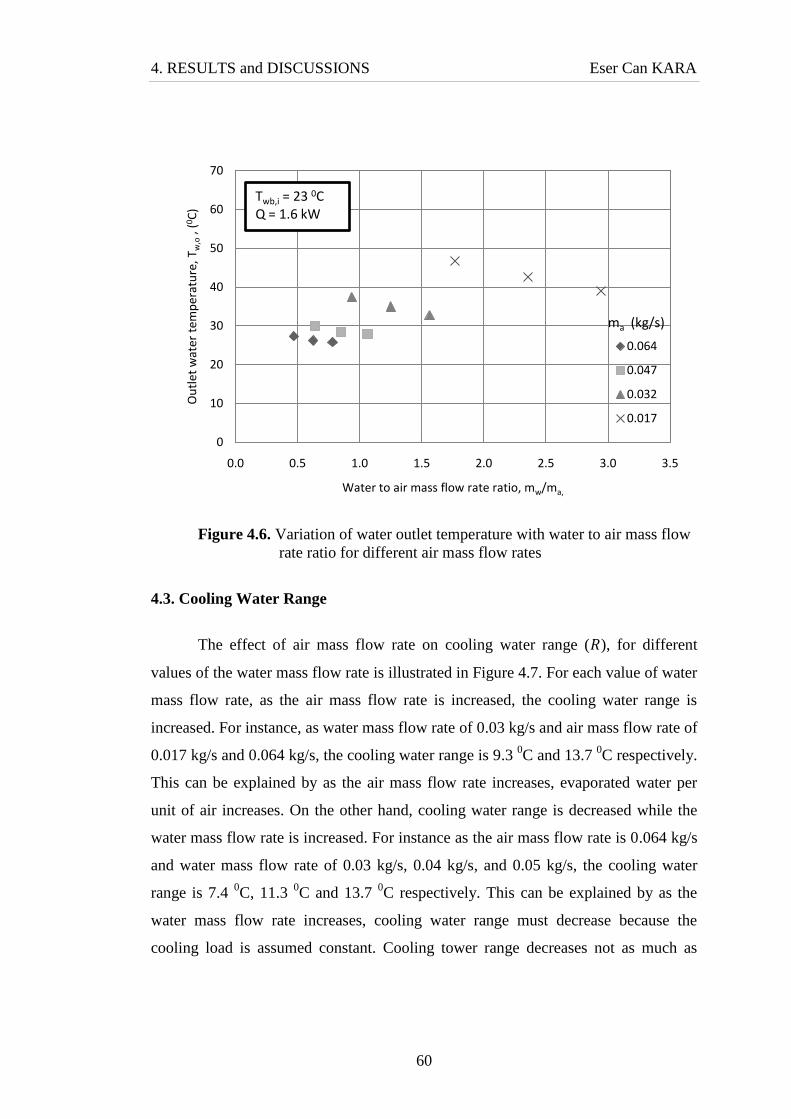
4. RESULTS and DISCUSSIONS Eser Can KARA
60
Figure 4.6. Variation of water outlet temperature with water to air mass flow
rate ratio for different air mass flow rates
4.3. Cooling Water Range
The effect of air mass flow rate on cooling water range (𝑅), for different
values of the water mass flow rate is illustrated in Figure 4.7. For each value of water
mass flow rate, as the air mass flow rate is increased, the cooling water range is
increased. For instance, as water mass flow rate of 0.03 kg/s and air mass flow rate of
0.017 kg/s and 0.064 kg/s, the cooling water range is 9.3 0C and 13.7
0C respectively.
This can be explained by as the air mass flow rate increases, evaporated water per
unit of air increases. On the other hand, cooling water range is decreased while the
water mass flow rate is increased. For instance as the air mass flow rate is 0.064 kg/s
and water mass flow rate of 0.03 kg/s, 0.04 kg/s, and 0.05 kg/s, the cooling water
range is 7.4 0C, 11.3
0C and 13.7
0C respectively. This can be explained by as the
water mass flow rate increases, cooling water range must decrease because the
cooling load is assumed constant. Cooling tower range decreases not as much as
0
10
20
30
40
50
60
70
0.0 0.5 1.0 1.5 2.0 2.5 3.0 3.5
Ou
tlet
wat
er t
emp
erat
ure
, Tw
,o, (
0 C)
Water to air mass flow rate ratio, mw/ma,
0.064
0.047
0.032
0.017
ma (kg/s)
Twb,i = 23 0CQ = 1.6 kW

4. RESULTS and DISCUSSIONS Eser Can KARA
61
water mass flow rate increases, because by increasing water mass flow rate, heat and
mass transfer coefficients are increasing.
Figure 4.7. Variation of cooling water range with air mass flow rate
for different water mass flow rates
The variation of cooling water range (𝑅) with water to air mass flow rate ratio
(m w m a ), for different values of air mass flow rate is illustrated in Figure 4.8. As
shown in Figure 4.8. At the lowest values of m w m a the best cooling water range is
achieved. When the water mass flow rate increases (m w m a increases) cooling water
range decreases. This decrease is seen clearly at the lowest value of air mass flow
rate, which means at the highest m w m a ratio as shown in Figure 4.8. Therefore, the
mass flow rate of air and water has a direct effect on cooling water range.
0
5
10
15
20
25
30
0.00 0.01 0.02 0.03 0.04 0.05 0.06 0.07
Co
olin
g w
ater
ran
ge, R
(0C
)
Air mass flow rate, ma, (kg/s)
0.03
0.04
0.05
mw (kg/s) Twb,i = 23 0CQ = 1.6 kW

4. RESULTS and DISCUSSIONS Eser Can KARA
62
Figure 4.8. Variation of cooling water range with water to air mass flow rate
ratio for different air mass flow rates
4.4. Cooling Tower Effectiveness and Merkel Number
The influence of air and water mass flow rate on cooling tower effectiveness
is analyzed. The cooling tower effectiveness (ε) is defined as the ratio of the actual
energy transfer to the maximum possible energy transfer. Therefore, the tower
effectiveness is determined from Eq. (3.11.). Variation of the cooling tower
effectiveness with the air mass flow rate for different values of water mass flow rate
is illustrated in the Figure 4.9.
The cooling tower effectiveness increases with the increase in air mass flow
rate and decreases with the increase in water flow rate. Therefore, the best cooling
tower effectiveness is achieved at the highest mass flow rate of air and at the lowest
mass flow rate of water. Therefore, as the water to air mass flow rate ratio (m w m a )
is decreased, the cooling tower effectiveness is increased. For instance, as water mass
flow rate of 0.03 kg/s and air mass flow rate of 0.064 kg/s, which means m w m a
ratio of 0.47, the effectiveness is calculated as 0.811. Whereas, as the water mass
0
5
10
15
20
25
30
0.0 0.5 1.0 1.5 2.0 2.5 3.0 3.5
Co
olin
g w
ater
ran
ge, R
(0 C
)
Water to air mass flow rate ratio, mw/ma,
0.064
0.047
0.032
0.017
ma (kg/s)Twb,i = 23 0CQ = 1.6 kW
4. RESULTS and DISCUSSIONS Eser Can KARA
63
flow rate is constant and the air mass flow rate is decreased to 0.017 kg/s, which
means m w m a ratio of 1.76, the effectiveness is calculated as 0.447. This means for
each value of water mass flow rate, as m w m a ratio decreases, effectiveness
increases. Therefore, at constant mass flow rate of water, the mass flow rate of air is
very important factor which affects the cooling tower effectiveness. On the other
hand, for constant air mass flow rate of 0.064 kg/s and water mass flow rate of 0.03
kg/s, 0.04 kg/s and 0.05 kg/s, cooling tower effectiveness is calculated as 0.811 –
0.730 and 0.620 respectively. At this time, at constant mass flow rate of air, the mass
flow rate of water is very important factor which affects the cooling tower
effectiveness.
Figure 4.9. Variation of cooling tower effectiveness with air mass flow rate
for different water mass flow rates
The variation of cooling tower effectiveness with water to air mass flow rate
ratio for different values of air mass flow rate is illustrated in Figure 4.10. As shown
in Figure 4.10. as the m w m a ratio value increases, cooling tower effectiveness
decreases. At the lowest values of m w m a ratio the best cooling tower effectiveness
is achieved.
0
0.2
0.4
0.6
0.8
1
0.01 0.02 0.03 0.04 0.05 0.06 0.07
Effe
ctiv
enes
s, ε
Air mass flow rate, ma ,(kg/s)
0,03
0,04
0,05
mw (kg/s)
Twb,i = 23 0CQ = 1.6 kW

4. RESULTS and DISCUSSIONS Eser Can KARA
64
Figure 4.10. Variation of cooling tower effectiveness with water to air mass
flow rate for different air mass flow rates
Other cooling tower parameters are Merkel number (Me) and number of
transfer unit (NTU) to analyze the cooling tower performance. The number of
transfer units (NTU) and Merkel number measure the heat transfer capability of the
cooling tower. The higher the NTU value, the closer the cooling tower to its
thermodynamic limit (Khan, 2001). As air mass flow rate increases Merkel number
increases, whereas Merkel number decreases while water mass flow rate increases as
shown in Figure 4.11. For water mass flow rate of 0.03 kg/s, Merkel number
exponentially rises as the air mass flow rate increases. Therefore, tower characteristic
increases with an increase in air mass flow rate and a decrease in water mass flow
rate.
0.2
0.4
0.6
0.8
1
0.0 0.5 1.0 1.5 2.0 2.5 3.0 3.5
Effe
ctiv
enes
s, ε
Water to air mass flow rate ratio, mw/ma,
0.064
0.047
0.032
0.017
ma (kg/s)
Twb,i = 23 0CQ = 1,6 kW

4. RESULTS and DISCUSSIONS Eser Can KARA
65
Figure 4.11. Variation of Merkel number with air mass flow rate flow rate
for different water mass flow rates
The relationship between Merkel number and water to air mass low rate ratio
for different air mass flow rates is illustrated in Figure 4.12. The highest Merkel
number value is calculated at the lowest value of m w m a ratio. If the m w m a ratio
increases at the constant air mass flow rate, Merkel number decreases with an
increase water mass flow rate. The lowest values of Merkel number is achieved at the
highest value of m w m a ratio. Merkel number decreases with a decrease of air mass
flow rate and an increase of water mass flow rate.
0
1
2
3
4
5
6
0.01 0.02 0.03 0.04 0.05 0.06 0.07
Mer
kel n
um
ber
, Me
Air mass flow rate, ma ,(kg/s)
0.03
0.04
0.05
mw (kg/s) Twb,i = 23 0CQ = 1.6 kW

4. RESULTS and DISCUSSIONS Eser Can KARA
66
Figure 4.12. Variation of Merkel number with water to air mass flow rate
ratio for different air mass flow rates
Variation of the cooling tower effectiveness with the Merkel number (Me) for
different values of water mass flow rate is illustrated in the Figure 4.13. As shown in
Figure 4.13. the cooling tower effectiveness increases with an increase in Merkel
number. The cooling tower effectiveness is higher for the higher air mass flow rate
and lower water mass flow rate, which means lower m w m a values and results the
best cooling. For higher m w m a , which means higher water mass flow rates,
cooling tower effectiveness and Merkel number decreases as shown in Figure 4.13.
A high degree of cooling tower effectiveness means better cooling tower
performance and higher heat removal rate. As shown in Figure 4.14. the cooling
tower effectiveness also depends on the inlet water temperature as well. When the
inlet water temperature is high and water mass flow rate is low, the higher value of
effectiveness is achieved. This result confirms the experimental results of Bedekar et
al. (1998) and Marmouch et al. (2009).
0
1
2
3
4
5
6
0.0 0.5 1.0 1.5 2.0 2.5 3.0 3.5
Mer
kel n
um
ber
, Me
Water to air mass flow rate ratio, mw/ma,
0.064
0.047
0.032
0.017
ma (kg/s)Twb,i = 23 0CQ = 1.6 kW

4. RESULTS and DISCUSSIONS Eser Can KARA
67
Figure 4.13. Variation of cooling tower effectiveness with Merkel number
for different water mass flow rates
Figure 4.14. Variation of cooling tower effectiveness with water inlet
temperature for different water mass flow rates
0
0.2
0.4
0.6
0.8
1
0 1 2 3 4 5 6
Effe
ctiv
enes
s, ε
Merkel number, Me
0.03
0.04
0.05
mw (kg/s)
Twb,i = 23 0CQ = 1.6 kW
0
0.2
0.4
0.6
0.8
1
20 30 40 50 60 70
Effe
ctiv
enes
s, ε
Inlet water temperature, Tw,i ,(0C)
0.03
0.04
0.05
mw (kg/s)Twb,i = 23 0CQ = 1.6 kW

5. CONCLUSIONS and RECOMMENDATIONS Eser Can KARA
68
5. CONCLUSIONS AND RECOMMENDATIONS
In this study, the heat transfer characteristics of a forced draft counter flow
wet cooling tower filled with clear PVC packings have been investigated for
different mass flow rate of air and water and different water inlet temperature. Water
and air are used as working fluids. The effects of air and water mass flow rates and
temperatures on cooling tower performance are investigated. From the experimental
study it can be concluded that the wet bulb temperature, the inlet water temperature,
and mass flow rate of air and water has a direct effect on the cooling tower
performance as well as on the outlet water temperature. During the experiments
water and air flow rates are varied between 0.03 – 0.05 kg/s and 0.017 – 0.064 kg/s
respectively.
The effect of air velocity on pressure drop for different water mass flow rates
is investigated. Pressure drop in cooling tower is one of the important concerns
because of the power required by the fan is directly proportional to the pressure drop.
If the velocity of air and water flow is increased in the cooling tower, the air side
pressure drop is increased. The higher the water and air mass flow rate, the higher the
pressure drop as illustrated in Figure 4.1. As shown in this figure, the pressure drop
is increased almost with the square of the air velocity at lower water flow rates. The
highest pressure drop is measured as water mass flow rate at 0.05 kg/s and air mass
flow rate at 0.064 kg/s. As a result, the operational cost rises because of higher power
requirement at higher pressure drop.
As shown in Figure 4.2., as air mass flow rate is increased, the outlet water
temperature is approached to wet bulb temperature. The increase of outlet water
temperature caused by the decrease of air mass flow rate. As a result, heat and mass
transfer coefficients are decreased and the results are obtained as illustrated in Figure
4.2., Figure 4.3., Figure 4.4., Figure 4.5., and Figure 4.6.
The cooling water range (𝑅), is increased with an increase in air mass flow
rate, whereas it is decreased with an increase in water mass flow rate. The highest
values of 𝑅, are reached for lower values of 𝑚 𝑤 𝑚 𝑎 . The best water cooling is
obtained at higher inlet water temperature and with lower mass flow rate of water

5. CONCLUSIONS and RECOMMENDATIONS Eser Can KARA
69
and higher air mass flow rate. As a result, as the water mass flow rate is increased,
cooling water range must decrease because the cooling load is assumed constant in
the experiments as illustrated in Figure 4.7. and Figure 4.8. On the other hand,
cooling tower range is decreased not as much as water mass flow rate is increased,
because as water mass flow rate is increased, heat and mass transfer coefficients are
increased.
To investigate the thermal performance of this cooling tower, the cooling
tower effectiveness and Merkel number are calculated. The thermal performance of
this cooling tower is increased with the increase in air mass flow rate and decreased
with the increase in water flow rate. Therefore, the best cooling tower range is
achieved at the highest mass flow rate of air and at the lowest mass flow rate of
water. As a result, the highest effectiveness value of the cooling tower is calculated
as 0.811 with water mass flow rate of 0.03 kg/s and air mass flow rate of 0.064 kg/s.
Whereas, the lowest effectiveness value of the cooling tower is calculated as 0.380
with water mass flow rate of 0.05 kg/s and air mass flow rate of 0.017 kg/s. As a
result, the mass flow rate of water and air are very important factors which affects
the cooling tower effectiveness as illustrated in Figure 4.9. and Figure 4.10.
The heat transfer capability of the cooling tower is measured by Merkel
number (Me). The higher the Me value, the closer the cooling tower to its
thermodynamic limit. Merkel number is increased with increasing air mass flow rate,
whereas Merkel number is decreased with increasing water mass flow rate as shown
in Figure 4.11. As a result, the highest Me value of the cooling tower is calculated as
4.630 with water mass flow rate of 0.03 kg/s and air mass flow rate of 0.064 kg/s.
Whereas, the lowest Me value of the cooling tower is calculated as 0.627 with water
mass flow rate of 0.05 kg/s and air mass flow rate of 0.017 kg/s. As a result, Me
number is increased with an increase in air mass flow rate and a decrease in water
mass flow rate as illustrated in Figure 4.11. and Figure 4.12. The cooling tower
effectiveness is increased with an increase in Merkel number as illustrated in Figure
4.13. Therefore, the better cooling tower range is achieved at the high degree of
cooling tower effectiveness. The cooling tower effectiveness also depends on the
inlet water temperature. The higher value of effectiveness is achieved if the inlet
5. CONCLUSIONS and RECOMMENDATIONS Eser Can KARA
70
water temperature is high and water mass flow rate is low as illustrated in Figure
4.14.
It is recommended to repeat these observations and calculations for higher
water inlet temperature and with a variety of different air and water mass flow rates.
As explained in the literature review section of this thesis, there are so many
theoretical studies on cooling towers but not much experimental work regarding the
cooling tower analysis. In addition, much of these works consider Merkel‟s theory
and his assumptions. One of these assumptions is water loss due to the evaporation,
which could be of interest especially at higher water inlet temperatures.

71
REFERENCES
AL-NIMR, M. A., 1998. Dynamic thermal behavior of cooling towers, Energy
Conversion and Management, 39(7):631-636.
AL-WAKED, and R. BEHNIA, M., 2005. The effect of windbreak walls on the
thermal performance natural draft dry cooling towers, Heat Transfer
Engineering, 26(8):50-62.
ATAEI, A., PANJESHAHI, M.H., and GHARAIE, M., 2008. Performance
evaluation of counter flow wet cooling towers using exergetic analysis,
Canadian Society for Mechanical Engineering, 32(3):499-511.
BAKER, D.R., and SHRYOCK, H.A., 1961. A comprehensive approach to the
analysis of cooling tower performance, Journal of Heat Transfer, 83:339-350.
BAKER, D.R., 1984. Cooling tower performance, Chemical Publishing Co., Inc.,
New York, 79-106.
BEDEKAR, S.V., NITHIARASU, P., and SEETHATAMU, K.N., 1998.
Experimental investigation of the performance of a counter flow packed bed
mechanical cooling tower, Energy, 23(11):943-947.
BERNIER, M. A., 1994. Cooling tower performance: theory and experiments,
ASHRAE Transactions., 100(2):114-121.
BRAUN, J. E., KLEIN, S. A., and MITCHELL, J., W., 1989. Effectiveness models
for cooling towers and cooling coils, ASHRAE Trans., 95:164-174.
CASTRO M.M., SONG T.W. and PINTO J.M., 2000. Operational cost minimization
in cooling water systems, Institution of Chemical Engineers Trans., 78:192-
201.
CORTINOVIS, G., F., RIBERIO, M., T., PAIVA, J., L., SONG, T., W., and PINTO,
J., M., 2009. Integrated analysis of cooling water systems: Modeling and
experimental validation, Applied Thermal Engineering, 29: 3124–3131.
CORTINOVIS, G., F., PAIVA, J., L., SONG, T., W., and PINTO, J., M., 2009. A
systemic approach for optimal cooling tower operation, Energy Conversion
and Management, 50: 2200–2209.
72
EL- DESSOUKY, H., 1993. Thermal and hydraulic performance of a three-phase
fluidized bed cooling tower, Experimental Thermal and Fluid Science, 6:417-
426.
EL- DESSOUKY, H.T.A., AL-HADDAD, A., and AL-JUWAYHEL, F., 1996.
Thermal and hydraulic performance of a modified two-stage evaporative
cooler, Renewable Energy, 7: 165-176.
______, 1997. A modified analysis of counter flow wet cooling towers, Journal of
Heat Transfer, 119:617-626.
ELSARRAG, E. 2006. Experimental study and predictions of an induced draft
ceramic tile packing cooling tower, Energy Conversion and Management,
47:2034-2043.
FISENKO, S., P., BRIN, A., A.,and PETRUCHIK, A., I., 2004. Evaporative cooling
of water in a mechanical draft cooling tower, International Journal of Heat
and Mass Transfer, 47:165-177.
GHARAGHEIZI, F., HAYATI, R., and FATEMI, S., 2007. Experimental study on
the performance of mechanical cooling tower with two types of film packing,
Energy Conversion and Management, 48:277–280.
GOSHAYSHI, H.R., and MISSENDEN, J.F., 2000. The investigation of cooling
tower packing in various arrangements, Applied Thermal Engineering,
20:69:80.
HALASIZ, B., 1999. Application of a general non-dimensional mathematical model
to cooling towers, International Journal of Thermal Sciences, 38: 75-88.
HOSEZ, M., ERTUNC, H., M., and BULGURCU, H. 2007. Performance prediction
of a cooling tower using artificial neural network. Energy Conversion and
Management, 48:1349–1359.
JIN, G., CAI, W., LU, L., LEE, E., L., and CHIANG, A., 2007. A simplified
modeling of mechanical cooling tower for control and optimization of
HVAC systems, Energy Conversion and Management, 44:355-365.
JORGE, F., and ARMANDO, C.O., 2000. Thermal behavior of closed wet cooling
towers for use with chilled ceilings, Appl. Therm. Eng., 20:1225-36.

73
JOSE, A.S., 2002. The use of thermo-fluid dynamic efficiency in cooling towers,
Heat Transfer Eng., 23:22-30.
KAIROUANI, L., HASSAIRI, M., and TAREK, Z.,2004. Performance of cooling
tower in south of Tunisia, Building and Environment, 39:351–355.
KAISER, A., S., LUCAS, M., VIEDMA, A., and ZAMORA, B., 2005. Numerical
model of evaporative cooling processes in a new type of cooling tower,
International Journal of Heat and Mass Transfer, 48:986–999.
KELLY N.W., and SWENSON L.K., 1956. Comparative performance of cooling
tower packing arrangements, Chemical Engineering Progress, 52:263–268.
KHAN, J.R., and ZUBAIR, S.M., 2001. An improved design and rating analyses of
counter flow wet cooling towers, ASME Journal of Heat Transfer,
123(4):770–778.
KHAN, J.R., YAQUB, M., and ZUBAIR, S.M., 2003. Performance characteristics of
counter flow wet cooling towers, Energy Conversion and Management,
44:2073-91.
KHAN, J.R., QURESHI, B., A., and ZUBAIR, S.M., 2004. A comprehensive design
and performance evaluation study of counter flow wet cooling towers,
International Journal of Refrigeration, 27:914-923.
KINTNER, M. and EMERY, A.F., 1995, Cost-optimal design for cooling towers,
ASHRAE J., 37:46-55.
KLOPPERS, J.C., and KROGER, D.G., 2005a. A critical investigation into the heat
and mass transfer analysis of counter flow wet cooling towers, International
Journal of Heat and Mass Transfer, 48:765–777.
______, 2005b. Influence of temperature inversions on wet cooling tower
performance, Applied Thermal Engineering, 25:1325-36.
______, 2005c. The Lewis factor and its influence on the performance prediction of
wet cooling towers, International Journal of Thermal Science, 25:879-884.
LEMOUARI, M., BOUMAZA, M., and MUJTABA, I.M., 2007. Thermal
performances investigation of a wet cooling tower, Applied Thermal
Engineering, 27:902-909.

74
LEMOUARI, M., BOUMAZA, M., and KAABI, A., 2009. Experimental analysis of
heat and mass transfer phenomena in a direct contact evaporative cooling
tower, Energy Conversion and Management, 50:1610–1617.
LONDON, A.L., MASAON, W.E. and BOELTER, L.K., 1940, Performance
characteristic of a mechanically induced draft, counter flow, packed cooling
tower, ASME Trans., 62:41-50.
LUCAS, M., MARTINEZ, P., J., and VIEDMA, A., 2009. Experimental study on
the thermal performance of a mechanical cooling tower with different drift
eliminators, Energy Conversion and Management, 50:490–497.
MAIYA, M.P., 1995. Analysis of modified counter-flow cooling towers, Heat
Recovery Systems and CHP, 15:293-303.
MAKKINEJAD, N., 2001. Temperature profile in counter current/cocurrent spray
towers, International Journal of Heat and Mass Transfer, 44:429-442.
MARMOUCH, H., ORFI, J., and NASRALLAH, S., B., 2009. Experimental study of
the performance of a cooling tower used in a solar distiller, Desalination,
250:456-458.
MARQUES, C., A., X., FONTES, C., H., EMBIRUCU, M., and KALID, R., A.,
2009. Efficiency control in a commercial counter flow wet cooling tower,
Energy Conversion and Management, 50:2843–2855.
MERKEL, F., 1925. Verdunstungskuhlung, Zeitschrift des Vereines Deutscher
Ingenieure, 70:123-128.
MILOSAVLJEVIC, N., and HEIKKILA, P., 2001. A comprehensive approach to
cooling tower design, Applied Thermal Engineering, 21:899-915.
MOHIUDDIN A.K.M. and KANT K., 1996. Knowledge base for the systematic
design of wet cooling towers, 191:43-51.
MUANGNOI, T., ASVAPOOSITKUL, W., and WONGWISES, S., 2007. An exergy
analysis on the performance of a counterflow wet cooling tower, Applied
Thermal Engineering, 27:910-917.
______, 2008. Effects of inlet relative humidity and inlet temperature on the
performance of counterflow wet cooling tower based on exergy analysis,
Energy Conversion and Management, 49:2795-2800.

75
NAHAVANDI, A.N., KERSHAW, R.M., and SERICO, B.J., 1975. The Effect of -
evaporation losses in the analysis of counter flow cooling towers, Journal of
Nuclear Engineering and Design, 32:33-39.
NUNEZ, M., P., GASCA, C., N., and FUANTES, M., A., 2007. Simplified model
for the determination of the steady state response of cooling systems, Applied
Thermal Engineering, 27:1173–1181.
PAPAEFTHIMIOU, V., D., ZANNIS, T., C., and ROGDAKIS, E., D., 2006.
Thermodynamic study of wet cooling tower performance, International
Journal of Energy Research, 30:411–426.
SARKER, M., M., A., KIM, E., MOON, C., G., and YOON, J., I., 2008a.
Performance characteristics of the hybrid closed circuit cooling tower, Energy
and Buildings, 40:1529–1535.
______, 2008b. Numerical simulation of the performance characteristics of the
hybrid closed circuit cooling tower, nonlinear analysis: Modeling and
Control, 13(1):89–101.
SHELTON, S.V., and WEBER, E.D., 1991. Modeling and optimization of
commercial building chiller/cooling tower systems, ASHRAE Trans.,
97(2):1209-1216.
SIMPSON, W.M., and SHERWOOD, T.K., 1946. Performance of small mechanical
draft cooling towers, American Society of Refrigerating Engineering,
52:535–543, and 574–576.
SOYLEMEZ, M. S., 1999. Theoretical and experimental analyses of cooling towers,
ASHRAE Trans., 105:330-337.
______, 2004. On the optimum performance of forced draft counter flow cooling
towers, Energy Conversion and Management, 45:2335–2341.
STEFANOVIC, V., ILIC, G., VUKIC, M., RADOJKOVIC, N., VUCKOVIC, G.,
and ZIVKOVIC, P., 2001. 3D Model in simulation of heat and mass transfer
processes in wet cooling towers, Scientific Journal Facta Universitatis, Series
Mechanical Engineering, 8:1065–1081.
76
SULTAN, G., I., HAMED, A., M., and SULTAN, A., A., 2002. The effect of inlet
parameters on the performance of packed tower-regenerator, Renewable
Energy, 26:271–283.
SUTHERLAND, J.W., 1983. Analysis of mechanical draught counter flow air/water
cooling towers, Journal of Heat Transfer, 105:576-583.
WEBB, R.L., 1984. A unified theoretical treatment for thermal analysis of cooling
towers, evaporative condensers, and fluid coolers, ASHRAE Trans.,
90(2):398-415.
WALKER, W.H., LEWIS, W.K., MCADAMS, W.H., and GILLILAND, E.R., 1923.
Principles of chemical engineering, 3 rd ed., New York, McGraw-Hill Inc.
WHILLER, A., 1976 A fresh look at the calculation of performance of cooling
towers, ASHRAE Trans., 82(1):269-282.

77
CURRICULUM VITAE
Eser Can Kara was born in January 4, 1981 in Malatya, Turkey. He graduated
from Adana Incirlik High School and enrolled at Gazi University to study
mechanical engineering. In 2005, he graduated from the Department of Mechanical
Engineering. He worked as an assistant manager at Infopark Company between 2005
and 2007. He started his MSc. studies in 2007 at the Department of Mechanical
Engineering of the Çukurova University. He has been working as an assistant
specialist at Vakıflar Bankası T.A.O. since 2008. He is married.

78
APPENDIX
Startup Procedure
Before starting to experiment the emergency shutdown procedure reviewed
and conducted a safety inspection of the laboratory environment. The work area for
any evidence of leakage is inspected. The following steps are verified before each
experiment started;
The cooling tower is disconnected from the mains power supply.
All switches are in the "off" ("O") position.
The drain cock at the back of the tank is closed and the drain line is plugged.
Ensured the needle valve at the base of the rotameter is (at least) partially
open by turning the valve in the counter-clockwise direction.
The incline manometer is adjusted scale position until the zero is level with
the left hand meniscus.
The tube connected to the column outlet pressure tapping connected to the
left hand end of the incline manometer and the other end of the manometer
opened to the atmosphere.
The water level in the tank inspected using the clear plastic sighting tube
provided. The water level should be at the maximum line marked on the tube,
if not, water added cautiously to fill the tank to the maximum line.
The reservoir filled for the air inlet and outlet wet bulb thermocouples
(𝑇2 𝑎𝑛𝑑 𝑇4) with water, and ensured that the wick is saturated and resting in
the reservoir.
After the above preparations are done following steps are carried out. First of
all, the entire experimental unit connected to the mains power. The mains power on
is switched, and the flow through the rotameter is checked. The damper allowed
covering the fan inlet so that there is minimal air flow through the system. Once the
unit is operating normally, the tank water level is reviewed - if below the minimum
level; a small amount of water added to the make-up tank. Gradually the tank filled
from the reservoir.

79