DEPARTMENT OF MATHEMATICS, STATISTICS & COMPUTERS … · Mutual Funds: Simple problems on...
177
Transcript of DEPARTMENT OF MATHEMATICS, STATISTICS & COMPUTERS … · Mutual Funds: Simple problems on...


DEPARTMENT OF MATHEMATICS,
STATISTICS & COMPUTERS
SEMESTER I and II 2019-20
TUTORIAL WORKBOOK
PREPARED BY:
1- Dr. Mrs. Seema A. Ukidve
2- Dr. Mrs. Neelam N. Yadav
3- Mr. Ramsagar B. Yadav

Why this tutorial handbook is introduced?
“Mathematics is not about numbers, equations, computations or algorithms: it is about
understanding.”
_________William Paul Thurston
“The only way to learn Mathematics is to do Mathematics.”
_________Paul Halmos
It has been observed that students enrolling for F.Y.B.COM lack basics of Mathematics and
Statistics as some of them opt for Secretarial Practice in F.Y.J.C and S.Y.J.C instead of
Mathematics due to which they loose connect with mathematical concepts and rigour.
To boost the confidence of students and to make them understand Mathematics and Statistics
lessons taught in the class and to provide them hand on practice of standard questions this tutorial
handboook has been introduced.
This tutorial handbook contains:
Latest Syllabus of Mathematical and Statistical techniques paper ,
Paper Pattern
Reference Books
Unit wise questions for practice with enough space to solve them
Graph Papers
We hope this handbook will inculcate the problem solving aptitude among students and remove
their mathematics phobia.

SYLLABUS FOR MATHEMATICAL AND STATISTICAL TECHNIQUES AT
F.Y.B.Com. EXAMINATION
Revised Course
(WITH EFFECT FROM THE ACADEMIC YEAR 2016-2017)
Why Revision?
There is a Rapid expansion of knowledge in subject matter areas and improved instructional method
during last decade. There are considerable curricular revisions happening at the high school level.
Application of Mathematics and Statistics are widely used in industry and business. Keeping this in mind,
a revision of syllabus required in accordance with the growth of subject of at the high school level and
emerging needs of industry and its application.
Objective:
The main objective of this course is to introduce mathematics and statistics to undergraduate students
of commerce, so that they can use them in the field of commerce and industry to solve the real life
problems.
Distribution of topics and lectures
a. Workload :
Theory: 5 lectures per week of which 2 lectures are for Mathematics and 3 lectures
for Statistics.
Tutorial: 1 lecture per week per batch. Batch size is as prescribed by the University.
No. of working weeks in a semester: 15
Total no. of lectures in a semester: 15 * 5 = 75
Introductory lecture of about 120 minutes may be arranged for students who did not offer general
mathematics in the 9th
& 10th
Standard and/or Mathematics at the XIth
and XIIth
to familiarize
the students with the concept of Tabulation, Graphical Representation of the data (basically
Histogram and Ogives)

Semester I
Course Topic No. of lectures
UBCOMFSI.6 Unit I 15
Mathematical
Unit II 15
and
Unit III 15
Statistical
Unit IV 15
Techniques-I
Unit V 15
Total 75
Total number of lectures 75 +Notional75=150 lectures = 3 CREDITS
Semester II
Course Topic No. of lectures
UBCOMFSII.6 Unit I 15
Mathematical
Unit II 15
and Unit III 15
Statistical Unit IV 15
Techniques-II
Unit V 15
Total 75
Total number of lectures 75 +Notional 75=150 lectures = 3 CREDITS

MATHEMATICAL AND STATISTICAL TECHNIQUES
WORKLOAD: MATHEMATICS : 2 lectures per week
STATISTICS : 3 lectures per week
TUTORIAL : 1 per week
Tutorial batch size : 25 Students
Semester I
Course: UBCOMFSI.6
Mathematical and Statistical Techniques-I
[A] MATHEMATICS: (40 marks)
Unit I: Shares and Mutual Funds
a. Shares: Concept of share, face value, market value, dividend, equity shares, preferential
shares, bonus shares. Simple examples.
b. Mutual Funds: Simple problems on calculation of Net income after considering entry
load, dividend, change in Net Asset Value (N.A.V.) and exit load. Averaging of price
under the Systematic Investment Plan (S.I.P.)
Unit II: Permutation, Combination and Linear Programming Problems:
Permutation and Combination: Factorial Notation, Fundamental principle of counting,
Permutation as arrangement, Simple examples, combination as selection, Simple examples,
Relation between n Cr and
n Pr Examples on commercial application of permutation and
combination.
Linear Programming Problem: Sketching of graphs of (i) linear equation Ax + By + C = 0
(ii) linear inequalities. Mathematical Formulation of Linear Programming Problems upto 3
variables. Solution of Linear Programming Problems using graphical method up to two
variables.

[B] STATISTICS: (60 marks)
Unit III: Summarization Measures:
a. Measures of Central Tendencies: Definition of Average, Types of Averages: Arithmetic Mean,
Median, and Mode for grouped as well as ungrouped data. Quartiles, Deciles and Percentiles.
Using Ogive locate median and Quartiles. Using Histogram locate mode. Combined and
Weighted mean.
Measures of Dispersions: Concept and idea of dispersion. Various measures Range, Quartile Deviation,
Mean Deviation, Standard Deviation, Variance, Combined Variance
Unit IV: Elementary Probability Theory:
a. Probability Theory: Concept of random experiment/trial and possible outcomes; Sample
Space and Discrete Sample Space; Events their types, Algebra of Events, Mutually
Exclusive and Exhaustive Events, Complimentary events.
Classical definition of Probability, Addition theorem (without proof), conditional
probability.
Independence of Events: P( A ∩ B ) = P(A) P(B). Simple examples.
b. Random Variable: Probability distribution of a discrete random variable; Expectation
and Variance of random variable, simple examples on probability distributions.
Unit V: Decision Theory:
Decision making situation, Decision maker, Courses of Action, States of Nature, Pay-off and
Pay-off matrix; Decision making under uncertainty, Maximin, Maximax, Minimax regret and
Laplace criteria; simple examples to find optimum decision. Formulation of Payoff Matrix.
Decision making under Risk, Expected Monetary Value (EMV); Decision Tree; Simple
Examples based on EMV. Expected Opportunity Loss (EOL), simple examples based on EOL.

Semester II
Course: UBCOMFSII.6
Mathematical and Statistical Techniques-II
[A] MATHEMATICS : (40 marks)
Unit I : Functions, Derivatives and Their Applications
a. Concept of real functions: constant function, linear function, xn , e
x, a
x, log x.
Demand, Supply, Total Revenue, Average Revenue, Total cost, Average cost and Profit
function. Equilibrium Point, Break-even point.
b. Derivative of functions:
Derivative as rate measure, Derivative of xn , e
x, a
x, log x
i. Rules of derivatives: Scalar multiplication, sum, difference, product, quotient
(Statements only), Simple problems. Second order derivatives.
ii. Applications: Marginal Cost, Marginal Revenue, Elasticity of Demand. Maxima and
Minima for functions in Economics and Commerce.
(Examination Questions on this unit should be application oriented only.)
Unit II: Interest and Annuity:
Interest: Simple Interest, Compound Interest (Nominal & Effective Rate of Interest),.
Calculations involving upto 4 time periods.
Annuity: Annuity Immediate and its Present value, Future value. Equated Monthly Installments
(EMI) using reducing balance method & amortization of loans. Stated Annual Rate & Affective
Annual Rate Perpetuity and its present value. Simple problems involving up to 4 time periods

[B] STATISTICS: (60 marks)
Unit III: Bivariate Linear Correlation and Regression
a. Correlation Analysis: Meaning, Types of Correlation, Determination of Correlation:
Scatter diagram, Karl Pearson’s method of Correlation Coefficient (excluding Bivariate
Frequency Distribution Table) and Spearman’s Rank Correlation Coefficient.
b. Regression Analysis: Meaning, Concept of Regression equations, Slope of the
Regression Line and its interpretation. Regression Coefficients (excluding Bivariate
Frequency Distribution Table), Relationship between Coefficient of Correlation and
Regression Coefficients , Finding the equations of Regression lines by method of Least
Squares.
Unit IV : Time series and Index Numbers
a. Time series: Concepts and components of a time series. Representation of trend by
Freehand Curve Method, Estimation of Trend using Moving Average Method and Least
Squares Method (Linear Trend only ). Estimation of Seasonal Component using Simple
Arithmetic Mean for Additive Model only (For Trend free data only). Concept of
Forecasting using Least Squares Method.
b. Index Numbers: Concept and usage of Index numbers, Types of Index numbers,
Aggregate and Relative Index Numbers, Lasperye’s, Paasche’s, Dorbisch-Bowley’s,
Marshall-Edgeworth and Fisher’s ideal index numbers, Test of Consistency: Time
Reversal Test and Factor Reversal Test. Chain Base Index Nos. Shifting of Base year.
Cost of Living Index Numbers, Concept of Real Income, Concept of Wholesale Price
Index Number. (Examples on missing values should not be taken)
Unit V: Elementary Probability Distributions
Probability Distributions:
i. Discrete Probability Distribution: Binomial, Poisson (Properties and applications only, no
derivations are expected)
Continuous Probability distribution: Normal Distribution. (Properties and applications only, no
derivations are expected

Tutorial:
Two tutorials to be conducted on each unit i.e. 10 tutorials per semester. At the end of each
semester one Tutorial assignment of 10 marks should be given.
Examination:
Semester End Examination: 100 marks
At the end of each semester, there will be a Semester End Examination of 100 marks , 3
hours duration and question paper pattern as shown below.
Question Paper Pattern :( Course: UBCOMFSI.6 and Course: UBCOMFSII.6)
1. In Section I (based on Mathematics), Two questions carrying 20 marks each. First
question should be on Unit I and Second question should be from Unit II.
2. In each question there should be five sub-questions carrying 5 marks each. Students
should be asked to answer any 4 sub questions from each question.
3. In Section II (based on Statistics), Three questions carrying 20 marks each. First
question should be on Unit III, Second question should be from Unit IV and third
question should be from Unit V.
4. In each question there should be five sub-questions carrying 5 marks each. Students
should be asked to answer any 4 sub questions from each question.
Reference Books:
1. Mathematics for Economics and Finance Methods and Modelling by Martin Anthony and
Norman Biggs, Cambridge University Press, Cambridge low‐priced edition, 2000, Chapters 1,
2, 4, 6 to 9 & 10.
2. Applied Calculus: By Stephen Waner and Steven Constenoble, Brooks/Cole Thomson Learning,
second edition, Chapter 1 to 5.
3. Business Mathematics By D. C. Sancheti and V. K. Kapoor, Sultan Chand & Sons, 2006, Chapter
1, 5, 7, 9 &10.

4. Mathematics for Business Economics: By J. D. Gupta, P. K. Gupta and Man Mohan, Tata
Mc‐ Graw Hill Publishing Co. Ltd., 1987, Chapters 9 to 11 & 16.
5. Quantitative Methods‐Part‐I By S. Saha and S. Mukerji, New Central Book Agency,
1996, Chapters 7 & 12.
6. Mathematical Basis of Life Insurance By S.P. Dixit, C.S. Modi and R.V. Joshi, Insurance
Institute of India, Chapters 2: units 2.6, 2.9, 2.20 & 2.21.
7. Securities Laws & Regulation of Financial Market : Intermediate Course Paper 8, Institute of
Company Secretaries of India, Chapter 11
8. Investments By J.C. Francis & R.W. Taylor, Schaum’s Outlines, Tata Mc‐Graw Hill Edition
2000, Chapters 2,4 & section 25.1.
9. Indian Mutual Funds Handbook : By Sundar Shankaran, Vision Books, 2006, Sections
1.7,1.8.1, 6.5 & Annexures 1.1to 1.3.
10. STATISTICS by Schaum Series.
11. Operations Research by Gupta and Kapoor
12. Operations Research by Schaum Series
13. Fundamentals of Statistics ‐ D. N. Elhance.
14. Statistical Methods ‐ S.G. Gupta (S. Chand & Co.
15. Statistics for Management ‐ Lovin R. Rubin D.S. (Prentice Hall of India)
16. Statistics ‐ Theory, Method & Applications D.S.Sancheti & V. K. Kapoor.
17. Modern Business Statistics ‐ (Revised}‐B. Pearles & C. Sullivan –Prentice Hall of India.
18. Business Mathematics & Statistics : B Aggarwal, Ane Book Pvt. Limited
19. Business Mathematics : D C Sancheti & V K Kapoor, Sultan Chand & Sons
20. Business Mathematics : A P Verma, Asian Books Pvt. :Limited.
QUESTION PAPER – SET I
MARKS:- 100 TIME:- 3 HRS
N.B: (1) ALL QUESTION ARE COMPALSORY
(2) ALL QUESTION CARRY EQUAL MARKS
(3) FIGURES TO THE RIGHT INDICATE MARKS TO A SUB-QUESTION.
(4) GRAPGH PAPER WILL BE SUPPLIED ON REQUEST.
(5) USE OF NON-PROGRAMMABLE CALCULATOR IS ALLOWED.
SECTION-I
Q.1 ATTEMPT ANY FOUR OF THE FOLLOWING
(a) 5 Marks (b) 5 Marks (c) 5 Marks (d) 5 Marks (e) 5 Marks
20 Marks
Q.2 ATTEMPT ANY FOUR OF THE FOLLOWING
(a) 5 Marks (b) 5 Marks (c) 5 Marks (d) 5 Marks (e) 5 Marks
20 Marks

SECTION-II
Q.3 ATTEMPT ANY FOUR OF THE FOLLOWING
(a) 5 Marks (b) 5 Marks (c) 5 Marks (d) 5 Marks (e) 5 Marks
20 Marks
Q.4 ATTEMPT ANY FOUR OF THE FOLLOWING
(a) 5 Marks (b) 5 Marks (c) 5 Marks (d) 5 Marks (e) 5 Marks
Q.5 ATTEMPT ANY FOUR OF THE FOLLOWING
(a) 5 Marks (b) 5 Marks (c) 5 Marks (d) 5 Marks (e) 5 Marks
20 Marks


SEMESTER-I
Unit I: Shares and Mutual Funds
1- If the market price of a share with face value Rs. 100 is Rs. 130 , how many shares of the
company can be bought for Rs. 3263, brokerage being 0.4%.


2- Smooth writing industry issued some shares of face value Rs. 10 each. A dividend of Rs.
7500 was declared by the company at 2.5% per share . Find number of shares issued by the
company.


3- Neil purchased 1200 units of a mutual fund by investing Rs. 60000. If the entry load was
2% . Find NAV on the date of purchase.


4- Nihir invested Rs. 40000 in a mutual fund on 14-2-2012 when its NAV was Rs. 13.65 . A
dividend of Rs. 3 per unit was given on 20-4-2012 . Afterwards he sold all the units on 20-8-
2012 when NAV was Rs. 16.85 . Find his gain if there is no entry or exit load .


5- An Investor joined the SIP Scheme for a Mutual Fund under which he would invest Rs.
15000 for 5 months . If the NAVs for each month are Rs. 42.6 , Rs. 45, Rs. 47 , Rs. 47.5 and
Rs. 60. Find the average cost using rupee averaging method , the entry load being 2.5%
throughout for these months.


6- Find the Face Value of a share if an investment of Rs. 9,00,000 put in to purchase 8%
shares quoted at Rs. 15 each, earned a total dividend of Rs.9600.


7- Mr. Chopra bought 400 shares of par value Rs. 10 each at the market price of Rs. 24
each. If the annual dividend distributed was at the rate of 12% , Find Mr. Chopra’s total
dividend and and rate of return on investment.

8- Ram invested Rs. 18,000 in a mutual fund scheme with entry load of 2.25% at NAV Rs.
110 . How many units did he purchase ? The current NAV is Rs. 130 . Find the current
value of his investment.


9- Katrina invested Rs. 15,000 on 5th of every month for 5 months in a SIP of a mutual
fund. The N.A.V on these dates were Rs. 42.26 , Rs. 40.25 , Rs. 49.57. Rs. 51.45 and Rs.
39.32 respectively. There was the same entry load of 2.3% for all these months . Find the
average acquisition cost per unit.

10- Mr. Bhavesh invested Rs. 50,000/- in the purchase of mutual fund units at NAV Rs.
16.50 . Calculate the number of units purchased when the entry load of 1.2% was applied .
How many more units he could have purchased if the scheme was load free ?


Unit II: Permutation, Combination and Linear Programming Problems:
1. In how many different ways can the letters of the word ‘LEADING’ be arranged such
that the vowels should always come together?


2. A committee of 5 persons to be formed from 6 doctors and 5 nurses . Find the total
number of ways if committee consist of i) All doctors ii) 3 doctors and 2 nurses

3. Solve the following L.P.P by graphical method.
Maximize: Z = 4x + 5y
Subject to : 2x + 3y ≤ 12 ;
x + y ≤ 5 ;
x ≥ 0 & y ≥ 0.


4. Solve the following LPP graphically:
Minimize Z = 9x + 10y,
Subject to: x + 2y ≥ 30,
3x + y ≥ 30,
x ≥ 0, y ≥ 0


5. A printing company prints two types of magazines A and B. The Company earns Rs. 25
and Rs. 35 on each copy of magazines A and B respectively. The magazines are processed
by 3 machines. Magazine A requires 2 hours on machine I, 4 hours on machine II and 2
hours on machine III. Magazine B requires 3 hours on machine I, 5 hours on machine II
and 3 hours on machine III. Machines I, II and III are available for 35, 50 and 70 hours per
week respectively. Formulate the L.P.P so as to maximize the total profit of the company.


6. From 4 professors and 6 students, a committee of 4 is to be formed. In how many ways
the committee can be formed such that it contains only one professor.


7. How many numbers of 5 digits can be formed using the digits 1,2,3,4,5,6 such that
i) no digit is repeated
ii) repetition of digits is allowed


8. How many ways out of 11 members of a cricket team choose a Captain , Vice-Captain
and Wicket-Keeper from among themselves ?


9. Solve the linear programming problem graphically:
Min. Z = 10x + 7y
Subject to : 2x + y ≥ 2,
x + 3y ≥ 3,
x ≥ 0, y ≥ 0 .


10. A Cracker manufacturer produces two types of crackers , rockets and bombs packed in
boxes of hundreds in its two factories . Factory I performs the basic assembly operation.
Factory II performs the finishing operation. For financial reason , factory I has only 180
hours available per week and factory II has 120 hours available. Factory I needs 3 hours on
each box of rockets and 10 hours on each box of bombs . Factory II needs 6 hours on box of
rockets and 4 hours on box of bombs. The profit of the company is Rs. 45 per box of
rockets and Rs. 55 per box of bombs. Formulate the LPP to maximize the profit.


Unit III: Summarization Measures:
1. The following are the runs scored by two batsmen A and B in 5 test matches. Decide
who should be selected for the coming tour.
Runs by batsman A: 56,58, 60, 62, 59
Runs by batsman B: 70, 62, 50,35,69


2. The ages of 100 persons are tabulated below. Find P9 and P87 .
Age(Years) 10-20 20-30 30-40 40-50 50-60 60-70 70-80
No. of persons 16 20 21 28 10 3 2

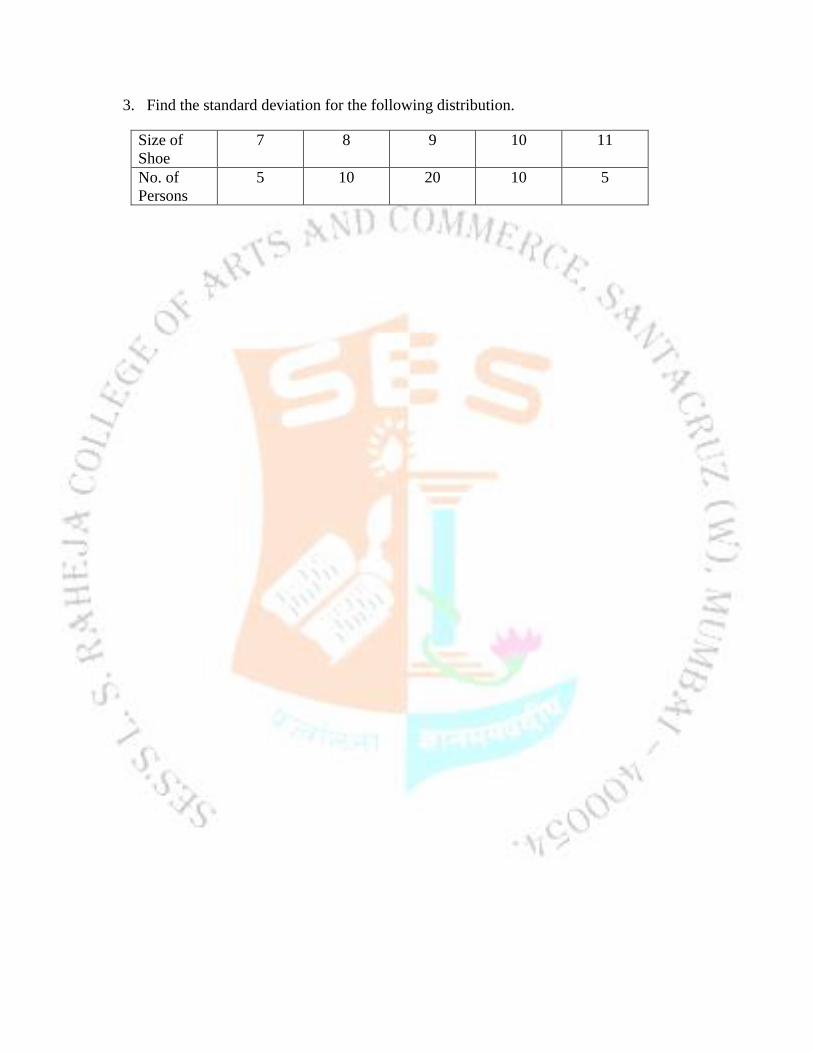
3. Find the standard deviation for the following distribution.
Size of
Shoe
7 8 9 10 11
No. of
Persons
5 10 20 10 5


4. Calculate M.D from mean and its coefficient for the following data:
x 11 12 13 14 15 16 17
f 3 6 10 8 5 3 2


5. Find the median for the following data representing the age in years of children.
Age in years 3 4 5 6 7 8 9 10
No. of children 14 20 40 54 40 18 7 7


6. Find the first quartile and second quartile for the following data:
Daily
wages in
₹
10-15 15-20 20-25 25-30 30-35 35-40 40-45 45-50 50-55
No. of
workers
12 28 36 50 25 18 16 10 5


7. Find the mode for the following data:
Income in
Rs.
2000-4000 4000-6000 6000-8000 8000-10000 10000-12000
No. of
persons
16 34 60 37 13


Unit IV: Elementary Probability Theory:
1) There are 3 doctors, 4 Engineers, 2 Statisticians and 1 Economists. A committee of 4 from
among them is to be formed. Find the probability that the committee consists of
a) One of each kind
b) At least one Doctor


2) If the letters of the word “FATHER” are arranged at random, what is the chance that the two
letters A and R will be at the either extremes?


3) A biased coin is tossed thrice. X denotes the number of heads in the three tosses. If the
probability distribution of X is as follows:
P(X = x) =5/16 ; x= 0,1
= 1/ 8 ; x= 2
= 1/4 ; x = 3
=0; otherwise
Find E(X) and V(X).


4) In a game of throwing a fair dice, A wins ₹60 if a 6 is thrown. He gains ₹30 if the dice shows
3 or 4 and he loses ₹30 if odd number occurs on the uppermost face of the dice. Find the
expected gain of A.


5) If x is a random variable having probability distribution
P(x) = x/8 ; x= 0,1
= k/ 4 ; x= 2
= kx/16 ; x = 3
Find the value of k and E(x).


6) From a well shuffled pack of cards, a card is drawn at random, find the probability that the
card drawn is (a) An ace (b) A heart card


7) A box contains 5 white balls and 3 black balls. If 5 balls are selected from the box, what is the
probability that 3 of them are white?


8) If X is a number appearing on the uppermost face of a fair dice, find E(x) and V(x).


Unit V: Decision Theory:
(A) Given the following pay-off table, decide the best decision using the criterion
a) Maximax
b) Maximin
c) Laplace
d) Minimax regret riterion
Pay off Table
Course of Action States of Nature
S1 S2 S3
A1 2500 2500 2500
A2 4000 3500 2000
A3 2500 2000 1200


(B) Given the following profit table. Find the optimum decision using EMV Criterion.
Profit Table
Course of
Action
State of Nature
S1 S2 S3
A1 2500 2500 2500
A2 4000 3500 2000
A3 5000 2500 1200
Probability of
State of
Nature
0.4 0.5 0.1


(C) You are given the following payoff table for three acts A1 ,A2 and the states of nature
S1 ,S2 ,S3 .Draw Decision tree.
Course of
Action
State of Nature
S1 S2 S3
A1 25000 35000 40000
A2 50000 20000 10000
Probability of
State of
Nature
0.3 0.5 0.2


(D) For the past 50 days, the sales from bakery have been as follows.
The bakery’s production cost is Rs. 8 per loaf and sales price is Rs. 12 per loaf. The unsold
breads are destroyed on the same day. Draw a pay-off table and determine the optimal act using
EMV criterion.
Daily Sales 80 100 120
No. of Days 15 25 10


(E) A newspaper boy has the following probability distribution of selling a fashion magazine.
No. of copies
Sold
10 11 12 13 14
Probability 0.10 0.15 0.20 0.25 0.30
Each magazine cost him Rs. 30 and is sold at Rs. 50. The newspaper boy cannot return the
unsold copies. Determine optimum number of copies the newspaper boy should order using
EMV criterion.


SEMESTER-II
Unit I : Functions, Derivatives and Their Applications
1- Find the derivative of y with respect to x.
(i) y = 4 x7 – log x + √𝒙
(ii) y = (x + ex) (log x – 10)


2- The total cost function is given by C = x2 + x + 10.
Find the average cost and marginal cost when x is 20.


3- Examine the points of maxima and minima for the function
f(x) = x3 – 6x2 + 9x.


4- If the demand function is given by D = 15 – 4p + p2.
Find the price elasticity of demand when price is 1.


5- The demand function function of a commodity is given by p = 18 + D – D2
Find the total revenue and marginal revenue function.


6- The demand function is D = (p + 3)/((p-1) where D = Price . Find the elasticity
of demand when price is 8.


7- Differentiate w.r.t x.
y = (x+3)2 (x – 2)


Unit II: Interest and Annuity:
1- A principal amounts to Rs. 11,880/- after 4 years and to 14,040/- after 7
years. Find the principal and the rate of simple interest .


2- Amit keeps a fixed deposit of Rs. 25,000/- in a bank for 3 years . If the
rate of interest is 10% per annum compounded annually , find the total
amount he will receive at the time of maturity after 3 years.


3- Bhavin promised to pay Ketan Rs. 3,66,025/- after 4 years . If the rate of
interest is 12% per annum , find its present worth.


4- Find the amount at the end of 1 year of an annuity of Rs. 5,000/- payable
at each quarter with rate of interest 12% per annum.


5- Rehan takes a loan of Rs. 30,000/- to be repaid in one year at 9% per
annum by reducing balance interest rate. Find the equated monthly
instalments (EMI).
Given that (1.0075)12 = 1.0938


6- A Principal amounts to Rs. 9,680 , after 3 years and to 10,800 after 5
years. Find the principal and rate od simple interest .


7- A sum of Rs. 12,000 becomes Rs. 17,280 at 20% compound interest p.a.
Find the period.


8- Mr. padwal purchased LCD TV worth Rs. 70,000/- with down payment of
Rs. 10,000 and quarterly instalment of equal amount for one year. What
is the quarterly instalment if the company wishes to get 12% compound
interest ?


9- Find the final amount of Rs. 10,000 at 9% p.a in 3 years compounded half
yearly.


UNIT:III BIVARIATE LINEAR CORRELATION AND REGRESSION
(1) From the following data calculate the coefficient of correlation.
No. of pairs of observations = 12, sum of x values = 35, sum of y
values = 60, sum of squares of x values = 148, sum of squares of y
values = 450, sum of products of x and y = 105.


(2) For the following data of (x) mark in test (y) marks in dancing
competition , calculate rank correlation coefficient.
X 67 42 53 67 62 60 54 67
Y 78 80 78 73 75 68 63 75


(3) Calculate the coefficient of correlation using the following data :-
n = 20, ∑ 𝒙 = 260 , ∑ 𝒚 = 450 , ∑ x2 = 4720 , ∑ y2 = 12230 and ∑ x.y = 7050.


(4) From the following data, find the regression equation of y on x &
the regression equation of x on y further estimate y if x = 16 and x if
y =18.
X 3 4 6 10 12 13 Y 12 11 15 16 19 17

(5) Calculate rank correlation coefficient for the f ollowing data
respectively, marks in Economics (x) and marks in English (y).

X 56 37 65 60 54 51 40 70
Y 50 42 55 48 51 53 38 47

(6) Given for 7 pairs of observations ∑ 𝒙 = 𝟐𝟏𝟗, ∑ 𝒚 = 16.9 ,
∑ 𝒙. 𝒚 = 𝟓𝟔𝟒 . 𝟖 , ∑ 𝒙 = 𝟕𝟑𝟔𝟒.Find the regression equation y on x ,

also estimate the value of y when x = 64.

(7) Given the two regression equations,find (i) mean values of x and y
(ii) coefficient of correlation where the regression equation of y on x is
2x + 3y = 5 and the regression equation of x on y is 5x + 8y = 13


(8) Given the two regression equations as 4x – y -23 = 0 and 3x -2y + 4 = 0.
Find (i) the Mean values of x and y (ii) the coefficient of correlation.


(9) The following data gives income (x) and savings (y) of a group of
persons . Estimate the saving of a person with income of Rs. 900.
X 650 700 500 600 800 1000 750

Y 90 100 50 80 110 200 100

UNIT:IV TIME SERIES AND INDEX NUMBERS

(1) Calculate 3 yearly moving averages for the following time series. Plot
the given data and the moving averages on the graph paper.
Year 2006 2007 2008 2009 2010 2011 2012 2013 2014
Time series
37 45 52 42 58 63 50 60 34

(2) In the following series of index number shift base from 2000 to 2003.
Year 2000 2001 2002 2003 2004 2005

Index 100 105 110 125 135 180

(3) Calculate 4 yearly moving averages for the following time series. Plot

the given data and the moving averages on the graph paper.
Year 2006 2007 2008 2009 2010 2011 2012 2013 2014
Time series
33 41 22 42 18 13 49 45 43

(4) Calculate the real income from the following data :-

Year 2003 2004 2005 2006 2007
Income(Rs.) 6000 7000 8000 9000 10,000 Index no. 150 175 160 180 200

(5) Calculate from the following data, the cost of living index number of

different Commodity groups.
Group Food Clothing Lighting & Fuel
Rent Misc
Group Index
320 300 250 450 260
Group Weight
50 10 8 20 12

(6) From the following data calculate the cost of living index number for

2006 by the family budget method. Also obtain the expenditure of a
person in the Year 2006 if his expenditure in 2001 was Rs. 6000/-.
Group Price in 2001 Price in 2006 Weight
Food 15 36 60
Clothing 48 96 5 Lighting & Fuel 30 90 10
Rent 60 180 15 Miscellaneous 45 90 10

(7) If the mean and variance of a Binomial distribution are 4 and 2.4

respectively , Find probability of (i) 5 successes (ii) 8 successes
(iii) at most 3 successes (iv) at least 9 successes.

(8) It is found that 1.4% of the items in a box of 100 items are defective .

out of 600 boxes , how many will have (i) no defective items (ii) only 1
defective item ? ( Given : e-1.4 = 0.2466 )

(9) If X is a normal variate with mean 40 and standard deviation 8, find

(i) P( x ≥ 42) (ii) P(x ≤ 39 ) (iii) P( 37 ≤ x ≤ 41 )

UNIT: V ELEMENTARY PROBABILITY DISTRIBUTIONS

(1) If mean and variance of a binomial distribution are 4 and 2
respectively , find probability that no. of successes is (i) only 3 (ii) at
most 2 (iii ) at least 7 (iv ) 3 or 4.

(2) If X follows normal distribution with mean 150 and variance 1600,
Find (i) P(x≤ 166)
(ii) P( x≥ 126 )
(iii) P( 37 ≤ x ≤ 41 )

(3) If the mean and variance of a Binomial distribution are 4 and 2.4

respectively ,Find probability of (i) 5 successes (ii) 8 successes
(iii) at most 3 successes (iv) at least 9 successes .

(4) A variate X follows Poisson distribution with parameter 3.

Evaluate : (i) P( X = 1 ) (ii)P( x < 1 ) (iii) P( x > 1 )
( GIVEN : e-3 = 0.0498 )

(5) It is found that 1.4% of the items in a box of 100 items are defective .

out of 600 boxes , how many will have (i) no defective items (ii) only 1
defective item ? ( Given : e-1.4 = 0.2466 )

(6) If a fair coin is tossed 6 times , find the probability that number of

heads is (i) none (ii) only 2 (iii) all (iv ) at least 4.

(7) Akash receives , on an average , 5 messages per day. Find the

probability that on a specific day , he will receive (i) only 2 (ii) only 3
(iii) at least 4 (iv) less than 3 messages. (Given : e-5 = 0.0067 )

(8) A firm has 300 accounts which are normally distributed with a mean of

Rs. 10,000 and Standard deviation of Rs 1000. Find
(i) the number of accounts with amounts lying between Rs.8000 and
Rs.11,000.
(ii) the number of accounts with an amount of Rs.7500 or less.

(9) If X is a normal variate with mean 40 and standard deviation 8, find
(i) P( x ≥ 42), (ii) P(x ≤ 39 ) (iii) P( 37 ≤ x ≤ 41 )