Department of Health and NHS England - National Audit · PDF fileHeld to account by NHS...
40
September 2017 Department of Health and NHS England A Short Guide to the
Transcript of Department of Health and NHS England - National Audit · PDF fileHeld to account by NHS...
2 About this guide and contacts | A Short Guide to the Department of Health and NHS England
Commissioning NHS primary care services
NHS hospital and specialist care services
Regulation and oversight
AppendicesOverview
If you would like to know more about the National Audit Office’s (NAO’s) work on the Department of Health and NHS England, please contact:
Jenny George Value for Money Director, Department of Health studies
[email protected] 020 7798 7819
Mike Newbury Financial Audit Director, Department of Health group audits
[email protected] 020 7798 5468
If you are interested in the NAO’s work and support for Parliament more widely, please contact:
[email protected] 020 7798 7665
The National Audit Office scrutinises public spending for Parliament and is independent of government. The Comptroller and Auditor General (C&AG), Sir Amyas Morse KCB, is an Officer of the House of Commons and leads the NAO. The C&AG certifies the accounts of all government departments and many other public sector bodies. He has statutory authority to examine and report to Parliament on whether departments and the bodies they fund have used their resources efficiently, effectively, and with economy. Our studies evaluate the value for money of public spending, nationally and locally. Our recommendations and reports on good practice help government improve public services, and our work led to audited savings of £734 million in 2016.
Design & Production by NAO External Relations DP Ref: 11580-001
© National Audit Office 2017
About this guide and contacts
This Short Guide summarises what the Department of Health and NHS England do, how much they spend, recent and planned changes and what to look out for across their main business areas and services.

Commissioning NHS primary care services
NHS hospital and specialist care services
Regulation and oversight
Appendices
3 Overview | A Short Guide to the Department of Health and NHS England
Overview
Overview
Major programmes and developments
Key themes from NAO reports
Accountability to Parliament
Key facts About the Department of Health and NHS England
Key trends Where the Department and NHS England spent their money in 2016-17
Spending pressures

Commissioning NHS primary care services
NHS hospital and specialist care services
Regulation and oversight
Appendices
4 Overview | A Short Guide to the Department of Health and NHS England
Overview
Key facts
3.6% increase in real-terms funding for health1 between 2014-15 and 2016-17 (6.4% in cash terms)
87.6% of people attending A&E were treated, discharged or admitted within four hours between January and March 2017, compared with a target of 95%
85% of people rated their overall experience of their GP as very good or fairly good in 2017 although this varies by area
5.1% of staff working in the NHS in England, in 2016, were from elsewhere in the EU
£791 million net overspend among NHS providers in 2016-17 and £902 million net underspend by NHS commissioners2
57% of clinical commissioning groups were rated outstanding or good in 2016-17 by NHS England
1 This is the funding received by the Department of Health.
2 More detail on this figure – and adjustments made – are available here.

Commissioning NHS primary care services
NHS hospital and specialist care services
Regulation and oversight
Appendices
5 Overview | A Short Guide to the Department of Health and NHS England
Overview
The Department of Health’s (the Department’s) stated purpose is to help people to live better for longer. It is supported by 27 agencies and public bodies, of which the largest is NHS England.
NHS England is an arm’s-length body of the Department and is responsible for arranging the provision of health services in England. The Department sets objectives for the NHS through an annual mandate.
About the Department and NHS England
Objectives for 2016-17
The 2015–2020 Shared Delivery Plan set out many shared objectives for the Department and NHS England.
In 2016-17 the Department and NHS England’s shared priorities included to:
• improve out-of-hospital care;
• create the safest, highest-quality healthcare services;
• maintain and improve performance against core standards and improve efficiency and productivity while achieving financial balance;
• prevent ill health and supporting people to live healthier lives; and
• support research, innovation and growth.
The Department’s individual objectives were to:
• enable people and communities to make decisions about their own health and social care;
• build and develop the workforce; and
• improve services through the use of digital technology, information and transparency.
NHS England’s individual objective was, through better commissioning, to:
• improve local and national health outcomes, particularly by addressing poor outcomes and inequalities.
Department of Health sets the overall strategy, funds and oversees the health and care system in England. It works with, and through, a variety of arm’s-length bodies including NHS England and regulators.
NHS England is responsible for the proper functioning of the commissioning system. It commissions specialised health services and primary care (jointly with clinical commissioning groups).
The Department allocates funding to NHS England
Accountable for performance against the mandate

Commissioning NHS primary care services
NHS hospital and specialist care services
Regulation and oversight
Appendices
6 Overview | A Short Guide to the Department of Health and NHS England
Overview
About the Department and NHS England continued
The organisations that oversee, support and deliver health and social care
Executive non-departmental public bodies – operate at arm’s-length from ministers. They are overseen by a board.
Commissioning of healthcare services Central support functions and sector improvement Regulators
Locally based bodies (also comprise local Sustainability and Transformation Partnerships)
Note
1 To simplify the diagram, we have not included: NHS Property Services Limited (a company wholly owned by the Secretary of State for Health); advisory non-departmental public bodies such as the NHS Pay Review Body and Review Body on Doctors’ and Dentists’ Remuneration; and a number of other bodies such as the National Information Board.
NHS Trusts NHS Foundation Trusts Independent providers
Commissioning Support Units
Provide support to clinical commissioning groups.
Human Fertilisation and Embryology Authority
Oversees the use of gametes and embryos in fertility treatment and research.
Health Research Authority
Protects and promotes the interest of patients and the public in health research.
Human Tissue Authority
Ensures that human tissue is used safely and ethically, and with proper consent.
NHS Improvement
Oversees NHS foundation trusts, NHS trusts and independent providers. NHS Improvement includes Monitor and the NHS Trust Development Authority.
Care Quality Commission
Regulates health and social care providers. Monitors and inspects services.
Executive agencies – responsible for undertaking some of the executive functions of the Department of Health.
Medicines and Healthcare products Regulatory Agency
Regulates medicines, medical devices and blood components for transfusion in the UK.
Public Health England
Provides advice, research and public health campaigns.
NHS Resolution
Manages negligence and other claims against the NHS in England on behalf of its member organisations.
NHS Blood and Transplant
Manages the supply of donated blood, organs and tissues, and seeks to improve blood and transplant services.
NHS Business Services Authority
Provides central services to NHS bodies, patients and the public, such as managing the NHS pension scheme, and administering payments to pharmacists and dentists.
National Institute for Health and Care Excellence
Provides national guidance and advice to improve healthcare.
NHS Digital
Provides information, data and IT systems for the health and care system.
Health Education England
Provides leadership and oversight of workforce planning, education and training.
Clinical commissioning groups
Plan and commission healthcare. Held to account by NHS England.
Primary care services
Comprises GP services, dental practices, community pharmacies and high street optometrists.
Department for Communities and Local Government
Funding for local government, including social care. Accountable to Parliament for overall funding to local authorities.
Local authorities
Assess needs and commission social care. Directly provide some services.
Main source of funding
NHS England
Accountable to the Department for the outcomes achieved by the NHS.
Responsible for the proper functioning of the commissioning system.
Commissions specialised health services and primary care (jointly with clinical commissioning groups).
Department of Health
Funding for health. Accountable to Parliament for health and adult social care.

Commissioning NHS primary care services
NHS hospital and specialist care services
Regulation and oversight
Appendices
7 Overview | A Short Guide to the Department of Health and NHS England
Overview
Key trends
Patients in England waiting no more than four hours in A&E, 2008-09 to 2016-17
Percentage of patients treated, discharged or admitted within four hours of arrival
Note
1 The target changed in 2010-11 from 98% to 95%.
Source: NHS England data
1 2 3 4 1 2 3 4 1 2 3 4 1 2 3 4 1 2 3 4 1 2 3 4 1 2 3 4 1 2 3 4 1 2 3 4
90
89
88
87
86
85
92
91
94
93
95
97
96
98
99
100
2008-09 2009-10 2010-11 2011-12 2012-13 2013-14 2014-15 2015-16 2016-17
Target
There are many different measures of performance covering various aspects of healthcare. Here, we illustrate trends for two selected indicators (one process and one outcome):
• The Department has set NHS England a goal of ensuring that 95% of people attending A&E are treated, discharged or admitted within four hours. This target has been missed in every quarter since autumn 2014. Between January and March 2017, the last quarter for which data are available, 87.6% of people attending A&E were treated, discharged or admitted within four hours.
• The Department has also set NHS England a goal of achieving “a significant reduction” in avoidable deaths. The number of avoidable deaths per 100,000 people has remained static since 2012. The rate has also remained higher for men compared with women. However, there is no information on performance since 2015 due to the time-lag in producing mortality data.
We present other key trends elsewhere in this document; on funding for commissioning, funding for general practice and waiting times for elective care.
Avoidable mortality in England, 2008 to 2015
Avoidable deaths per 100,000 people
Note
1 Figures are age-standardised to allow comparison across years.
Source: Office for National Statistics data
0
350
300
250
200
150
100
50
2008 2009 2010 2011 2012 2013 2014 2015
317.0304.6
295.5282.8
272.6 274.5 273.3 274.2
191.7181.0 177.2
171.1 167.5 166.7 167.6 168.8
Male
Female
Commissioning NHS primary care services
NHS hospital and specialist care services
Regulation and oversight
Appendices
8 Overview | A Short Guide to the Department of Health and NHS England
Overview
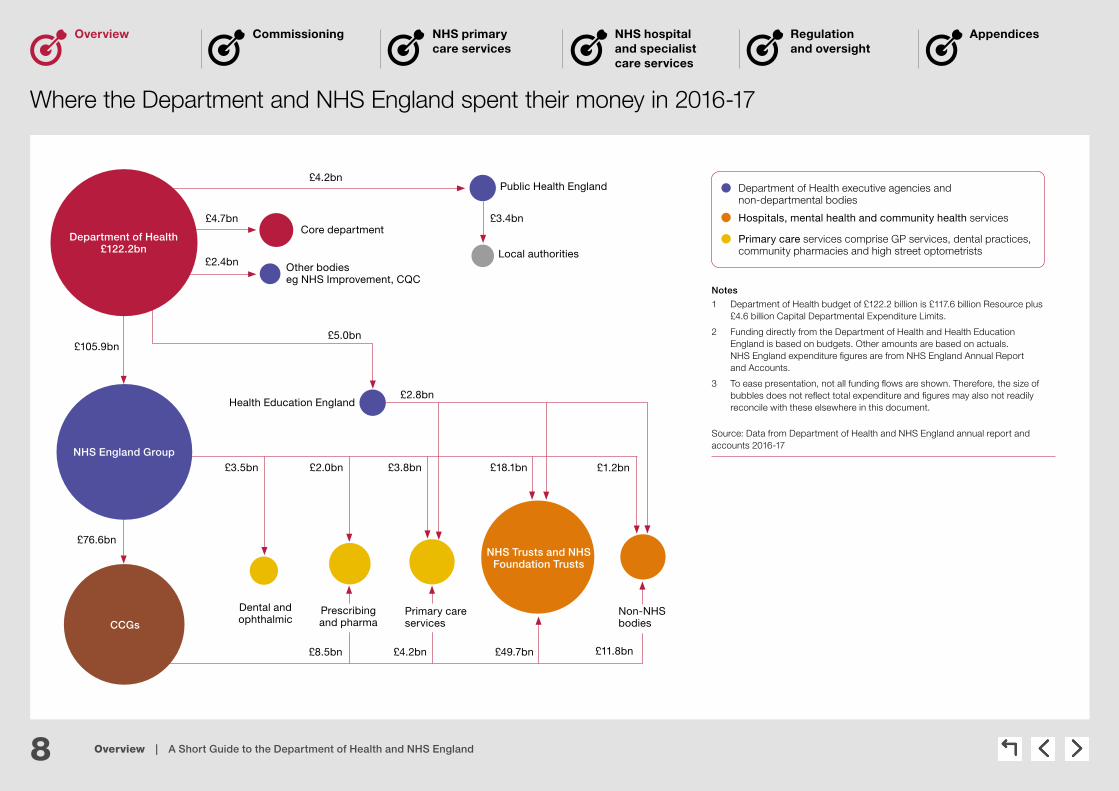
Where the Department and NHS England spent their money in 2016-17
Notes
1 Department of Health budget of £122.2 billion is £117.6 billion Resource plus £4.6 billion Capital Departmental Expenditure Limits.
2 Funding directly from the Department of Health and Health Education England is based on budgets. Other amounts are based on actuals. NHS England expenditure fi gures are from NHS England Annual Report and Accounts.
3 To ease presentation, not all funding fl ows are shown. Therefore, the size of bubbles does not refl ect total expenditure and fi gures may also not readily reconcile with these elsewhere in this document.
Source: Data from Department of Health and NHS England annual report and accounts 2016-17
Health Education England
Local authorities
Dental and ophthalmic
£8.5bn £4.2bn £49.7bn £11.8bn
£2.8bn
£2.0bn £3.8bn £18.1bn £1.2bn
£5.0bn
£3.4bn
£4.2bn
NHS England Group
Core department
Other bodieseg NHS Improvement, CQC
Public Health England
CCGs
Department of Health £122.2bn
NHS Trusts and NHS Foundation Trusts
£4.7bn
£2.4bn
Prescribing and pharma
Primary care services
Non-NHS bodies
£3.5bn
£105.9bn
£76.6bn
Hospitals, mental health and community health services
Department of Health executive agencies and non-departmental bodies
Primary care services comprise GP services, dental practices, community pharmacies and high street optometrists

Commissioning NHS primary care services
NHS hospital and specialist care services
Regulation and oversight
Appendices
9 Overview | A Short Guide to the Department of Health and NHS England
Overview
The Department had a Total Departmental Expenditure Limit spend of some £120.6 billion in 2016-17.1 In cash terms, spending increased by 6.4% from 2014-15 to 2016-17. After adjusting for inflation (see chart) this equates to the equivalent of a 3.6% increase.
Trend in funding
The health budget has been protected compared with most other areas of government spending. However, the Next Steps on the NHS Five Year Forward View, published in March 2017, outlined pressures on per-person spending levels and capital investment. The amount of healthcare delivered has also typically outstripped the increase in funding. In real terms, per person spending on health is expected to grow only slightly, from £2,185 in 2016-17 to £2,195 in 2020-21. NHS England expects continued pressures on waiting times for routine care, and that for some providers waiting times will grow.
Breakdown of financial position
The Department allocates funding to NHS England, which in turn provides funding to clinical commissioning groups and NHS trusts and NHS foundation trusts. The net financial outturn for 2016-17 showed that the main area for overspend was among trusts (see table). For 2016-17 NHS trusts and NHS foundation trusts overspent by £791 million, compared to a combined underspend of £902 million by commissioners.
Financial management
We noted, in auditing this year’s accounts, that “the Department has overseen some overall improvement in the financial position of the healthcare system in 2016-17. However, this improvement is focused on sustaining the system rather than transformation. [The additional funding2 in 2016-17] cannot be counted on as being available after 2018-19 in its current format. The Department has more to do to secure the healthcare system’s sustainability, as it acknowledges in the 2016-17 Annual Report and Accounts”.
1 The amount allocated to and spent by government departments is known as the total Departmental Expenditure Limit. It is comprised of the resource and capital departmental limits less depreciation. Total Departmental Expenditure Limit excludes annually managed expenditure (AME) set by HM Treasury and is spent on items that may be unpredictable or not easily controlled, for example, clinical negligence provisions and changes in market value of land and buildings, which accounted for £16.2 billion of spend in 2016-17.
2 Sustainability and Transformation Fund money.
Spending pressures
Health Total Departmental Expenditure Limit spending, adjusted for inflation
£ million
Real-terms spending increased by 3.6% from 2014-15 to 2016-17, and is projected to continue to increase slightly
Total Departmental Expenditure Limit
Projected Departmental Expenditure Limit
Note
1 Adjusted using the GDP deflator published 3 April 2017 and using 2016-17 as the base year.
Source: National Audit Office analysis of Department of Health Annual Report and Accounts July 2017
2014-15 2015-16 2016-17 2017-18 2018-19 2019-20 2020-210
20,000
40,000
60,000
80,000
100,000
120,000
140,000
116,381119,569 120,584 121,831 122,336 123,204 124,461
Summary of the revenue fi nancial performance of NHS commissioners, NHS trusts and NHS foundations trusts in 2016-17 1
Financial position in £ millions
Centrally commissioned services2 748 underspend (surplus)
Clinical commissioning groups2 154 underspend (surplus)
NHS trusts and NHS foundation trusts 791 overspend (deficit)
Net position across NHS commissioners and providers 111 underspend (surplus)
Adjustments3 144 overspend (deficit)
Net NHS revenue position 33 overspend (deficit)
Notes
1 Table shows the net Revenue Departmental Expenditure Limit (RDEL).
2 Centrally commissioned services includes public health and specialised services. It also includes primary care except where directly allocatedto clinical commissioning groups, which is instead included in the clinical commissioning groups’ fi gures.
3 Adjustments made to refl ect the correct Departmental Expenditure Limit scoring of income and depreciation of donated assets, PFI spending and provisions, which are not included in the provider defi cit fi gures.
Source: NHS England Annual Report and Accounts and the Department of Health Annual Report and Accounts

Commissioning NHS primary care services
NHS hospital and specialist care services
Regulation and oversight
Appendices
10 Overview | A Short Guide to the Department of Health and NHS England
Overview
Major programmes and developments
2012 2013 2014
Oct 2014
The NHS Five Year Forward View was published, a wide-ranging strategy for the NHS in England that set out seven new care models designed to break down the divides between primary, secondary, community and social care, and mental health. The strategy also envisaged the development of accountable care systems which, in their most integrated form, involve a single organisation having responsibility for commissioning and providing health and social care services across a local area.
2015 2016 2017
Apr 2013
211 (now 207) clinical commissioning groups became responsible for commissioning most healthcare.
Local authorities became responsible for commissioning public health services in addition to their existing responsibility for social care.
152 health and wellbeing boards were set up to improve the health and wellbeing of their local population.
Public Health England created to provide leadership in improving and protecting public health.
Mar 2012
The Health and Social Care Act provides for widespread reform of the health system in England, with the aim of improving the quality of care provided to patients.
Mar 2016
To implement the NHS Five Year Forward View, published in October 2014, clinical commissioning groups and NHS trusts were grouped into 44 sustainability and transformation plan areas. Each produced joint plans, published later in 2016, with their local authorities, for health and health service transformation up to 2020-21.
Apr 2015
The Better Care Fund started to fund community health and social care in accordance with plans approved by local health and wellbeing boards.
Dec 2015
NHS Sustainability and Transformation Fund introduced, to enable NHS providers to deliver efficiencies and improvements, linked to performance standard.
May 2017
The NHS was the victim of the international cyber attack ‘WannaCry’; around 20% of hospitals reported some disruption, mostly to planned care.
Mar 2017
NHS Five Year Forward View; Next Steps published by NHS England setting the national priorities as improving A&E performance, access to GP services, cancer services and mental health. It also provided more detail on intentions to integrate care locally through, for example, accountable care systems.
Jun 2015
Lord Carter’s review of efficiency in hospitals estimated that if ‘unwarranted variation’ is removed from trust spend, £5 billion of savings could be saved by 2020.
Apr 2016
NHS Improvement was formed. It is the operational name for an organisation that brings together Monitor, the NHS Trust Development Authority, Patient Safety (including the National Reporting and Learning System), the Advancing Change Team, and the Intensive Support Teams. It is responsible for overseeing and supporting NHS providers to improve quality and financial sustainability.
Jul 2016
NHS Improvement launched the ‘financial reset’, allocating extra funding to NHS providers while introducing new incentives, controls and sanctions with the aim of ensuring providers commence 2017-18 in financial balance.
Jun 2017
First group of accountable care systems were announced, covering some seven million people. They are intended to be the forefront of national action to provide joined-up and better-coordinated care.
Commissioning NHS primary care services
NHS hospital and specialist care services
Regulation and oversight
Appendices
11 Overview | A Short Guide to the Department of Health and NHS England
Overview
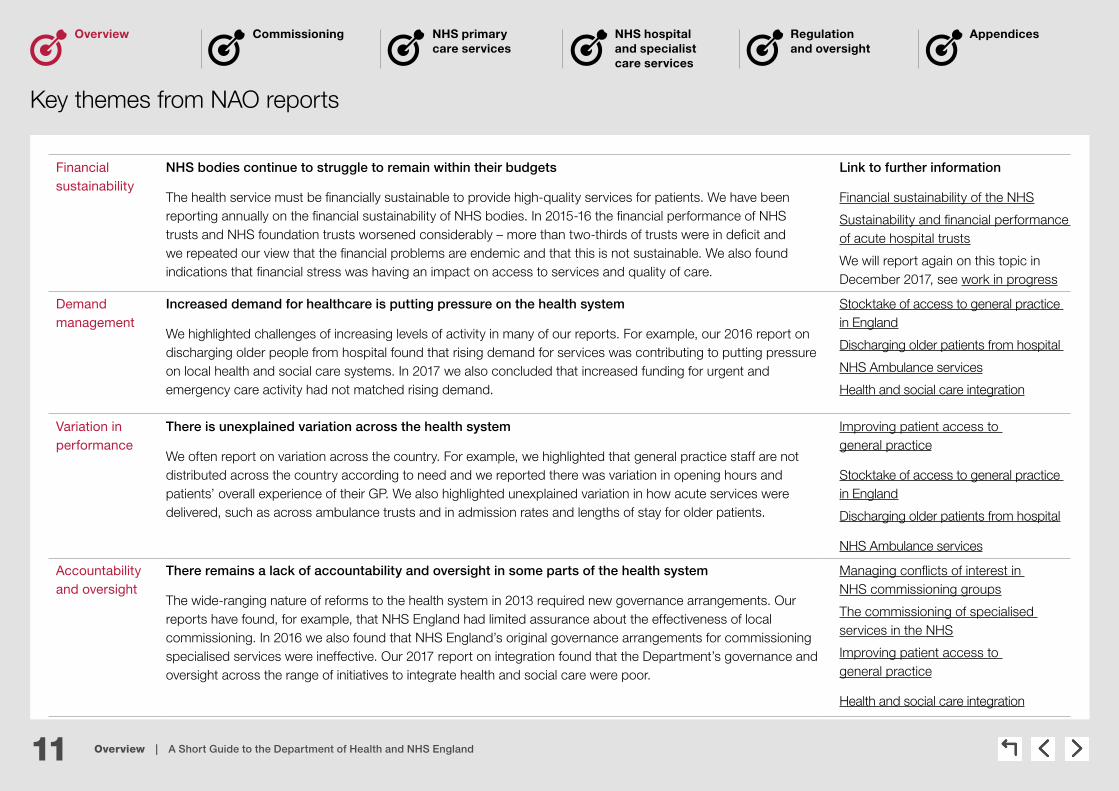
Key themes from NAO reports
Financial sustainability
NHS bodies continue to struggle to remain within their budgets
The health service must be financially sustainable to provide high-quality services for patients. We have been reporting annually on the financial sustainability of NHS bodies. In 2015-16 the financial performance of NHS trusts and NHS foundation trusts worsened considerably – more than two-thirds of trusts were in deficit and we repeated our view that the financial problems are endemic and that this is not sustainable. We also found indications that financial stress was having an impact on access to services and quality of care.
Link to further information
Financial sustainability of the NHS
Sustainability and financial performance of acute hospital trusts
We will report again on this topic in December 2017, see work in progress
Demand management
Increased demand for healthcare is putting pressure on the health system
We highlighted challenges of increasing levels of activity in many of our reports. For example, our 2016 report on discharging older people from hospital found that rising demand for services was contributing to putting pressure on local health and social care systems. In 2017 we also concluded that increased funding for urgent and emergency care activity had not matched rising demand.
Stocktake of access to general practice in England
Discharging older patients from hospital
NHS Ambulance services
Health and social care integration
Variation in performance
There is unexplained variation across the health system
We often report on variation across the country. For example, we highlighted that general practice staff are not distributed across the country according to need and we reported there was variation in opening hours and patients’ overall experience of their GP. We also highlighted unexplained variation in how acute services were delivered, such as across ambulance trusts and in admission rates and lengths of stay for older patients.
Improving patient access to general practice
Stocktake of access to general practice in England
Discharging older patients from hospital
NHS Ambulance services
Accountability and oversight
There remains a lack of accountability and oversight in some parts of the health system
The wide-ranging nature of reforms to the health system in 2013 required new governance arrangements. Our reports have found, for example, that NHS England had limited assurance about the effectiveness of local commissioning. In 2016 we also found that NHS England’s original governance arrangements for commissioning specialised services were ineffective. Our 2017 report on integration found that the Department’s governance and oversight across the range of initiatives to integrate health and social care were poor.
Managing conflicts of interest in NHS commissioning groups
The commissioning of specialised services in the NHS
Improving patient access to general practice
Health and social care integration

Commissioning NHS primary care services
NHS hospital and specialist care services
Regulation and oversight
Appendices
12 Overview | A Short Guide to the Department of Health and NHS England
Overview
Each organisation in central government must have an accounting officer who is personally responsible and accountable to Parliament for:
• regularity and propriety of expenditure;
• robust evaluation of different mechanisms for delivering policy objectives;
• value for money;
• management of risk; and
• accurate accounting for the use of resources.
In Accountability to Parliament for taxpayers’ money (2016), we highlighted major concerns about how this accountability is exercised across government. The Committee of Public Accounts also concluded that “accountability to Parliament for the use of public funds has been weakened by the failure of the government’s accountability arrangements to keep pace with increasingly complex ways of delivering policies and services”. Subsequently, government committed to each government department producing an Accounting Officer System Statement, which sets out its accountability relationships and processes and is part of the accounting officer’s personal responsibility for the use of taxpayer’s money. The Department of Health (the Department) published its statement in July 2017, which can be accessed here.
Another key accountability control is a ministerial direction, which is where an accounting officer should request formal direction if a minister requires them to proceed with a decision where they have serious concerns about propriety, regularity, feasibility or value for money that they are not able to resolve. This control is rarely used and has not been used by the Department.
The accounting officer for the Department is the permanent secretary, and for NHS England it is the chief executive. The Department’s accounting officer is accountable to Parliament for the general performance of the health system in England, including NHS England. This requires the accounting officer to gain assurance that NHS England is discharging its statutory duties and meeting the objectives set out in the mandate. NHS England’s accounting officer responsibilities include assurance of the wider commissioning system, including clinical commissioning groups. NHS England is accountable, through its board, to the Secretary of State for Health for delivery of the mandate.
Accountability to Parliament

Commissioning NHS primary care services
NHS hospital and specialist care services
Regulation and oversight
Appendices
13 Overview | A Short Guide to the Department of Health and NHS England
Overview
There are four essential elements of accountability
The 2015–2020 Shared Delivery Plan sets out the Department’s and its agencies’ objectives and vision for the health service. The Department issues a mandate annually to NHS England setting out its objectives, while other arm’s-length bodies receive remit letters from the health minister setting out their objectives.
In addition to accounting officers, health bodies are also accountable to their individual boards. In some cases they are also accountable to their local population, through organisations such as Healthwatch and health and wellbeing boards.
The majority of the Department’s funding is spent by healthcare commissioners and providers but the Department remains accountable to Parliament for the proper stewardship of the resources allocated to it. The Department must provide assurance that its arm’s-length bodies and the NHS (including NHS trusts and NHS foundation trusts) are performing effectively and have the necessary governance and controls to ensure regularity, propriety and value for money. Some arm’s-length bodies, such as NHS England, are also directly accountable to Parliament, as are NHS foundation trusts.
The NHS Outcomes Framework sets out the outcomes and corresponding indicators used to hold NHS England to account. The Department has also set public health, adult social care and education outcomes frameworks to hold other organisations to account. However, a reoccurring theme from our reports is that the Department and NHS England, and other health bodies, do not have sufficient data to evaluate outcomes, make decisions or understand costs.
Accountability to Parliament continued
A mechanism or forum to hold
to account
Robust performance and cost data
Clear roles and someone
to hold to account
A clear expression of spending
commitments and objectives

14 Commissioning | A Short Guide to the Department of Health and NHS England
Commissioning NHS primary care services
NHS hospital and specialist care services
Regulation and oversight
AppendicesOverview
Commissioning
How is it delivered?
In your area Recent and planned developments
What are the things to look out for?
15 Commissioning | A Short Guide to the Department of Health and NHS England
Commissioning NHS primary care services
NHS hospital and specialist care services
Regulation and oversight
AppendicesOverview
Responsibilities
Commissioning is, in basic terms, the process of planning, funding and monitoring services. Since 1 April 2013, NHS services have been commissioned by NHS England and clinical commissioning groups:
• NHS England sets the framework for health commissioning in England and is responsible for holding clinical commissioning groups to account for delivering their statutory functions.
• NHS England is also responsible for commissioning specialised services, primary care, offender healthcare and some services for the armed forces. Specialised services are generally provided by relatively few hospitals and accessed by a small number of patients.
• Clinical commissioning groups are responsible for commissioning hospital and community care for their local populations.
• Commissioning support units offer commissioners support on data analysis and procurement, service transformation, contracting, HR and financial management.
• Local authorities have responsibility for commissioning public health services and social care. Health and wellbeing boards, a formal committee of the local authority, have a duty to promote integration and, with clinical commissioning groups, produce Joint Strategic Needs Assessments.
Staff
In 2016-17, clinical commissioning groups employed 16,216 people. It is not possible to determine how many of NHS England’s 4,503 permanent staff perform a commissioning role. Commissioning support units employed some 6,111 permanent staff in 2016-17.
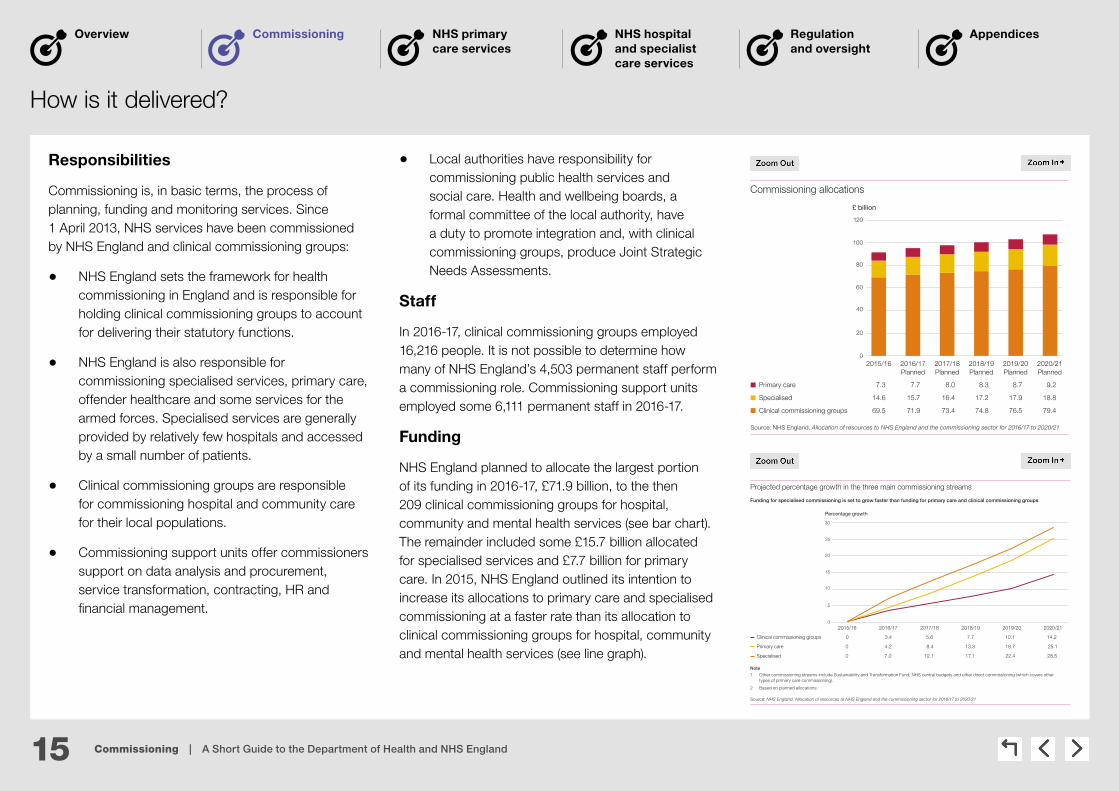
Funding
NHS England planned to allocate the largest portion of its funding in 2016-17, £71.9 billion, to the then 209 clinical commissioning groups for hospital, community and mental health services (see bar chart). The remainder included some £15.7 billion allocated for specialised services and £7.7 billion for primary care. In 2015, NHS England outlined its intention to increase its allocations to primary care and specialised commissioning at a faster rate than its allocation to clinical commissioning groups for hospital, community and mental health services (see line graph).
How is it delivered?
Commissioning allocations
£ billion
2015/16 2016/17Planned
2017/18Planned
2018/19Planned
2019/20Planned
2020/21Planned
0
20
40
60
80
100
120
Primary care 7.3 7.7 8.0 8.3 8.7 9.2
Specialised 14.6 15.7 16.4 17.2 17.9 18.8
Clinical commissioning groups 69.5 71.9 73.4 74.8 76.5 79.4
Source: NHS England, Allocation of resources to NHS England and the commissioning sector for 2016/17 to 2020/21
Clinical commissioning groups 0 3.4 5.6 7.7 10.1 14.2
Primary care 0 4.2 8.4 13.3 18.7 25.1
Specialised 0 7.0 12.1 17.1 22.4 28.5
Projected percentage growth in the three main commissioning streams
Percentage growth
2015/16 2016/17 2017/18 2018/19 2019/20 2020/210
5
10
15
20
25
30
Funding for specialised commissioning is set to grow faster than funding for primary care and clinical commissioning groups
Note
1 Other commissioning streams include Sustainability and Transformation Fund, NHS central budgets and other direct commissioning (which covers othertypes of primary care commissioning).
2 Based on planned allocations.
Source: NHS England, Allocation of resources to NHS England and the commissioning sector for 2016/17 to 2020/21
16 Commissioning | A Short Guide to the Department of Health and NHS England
Commissioning NHS primary care services
NHS hospital and specialist care services
Regulation and oversight
AppendicesOverview
In your area
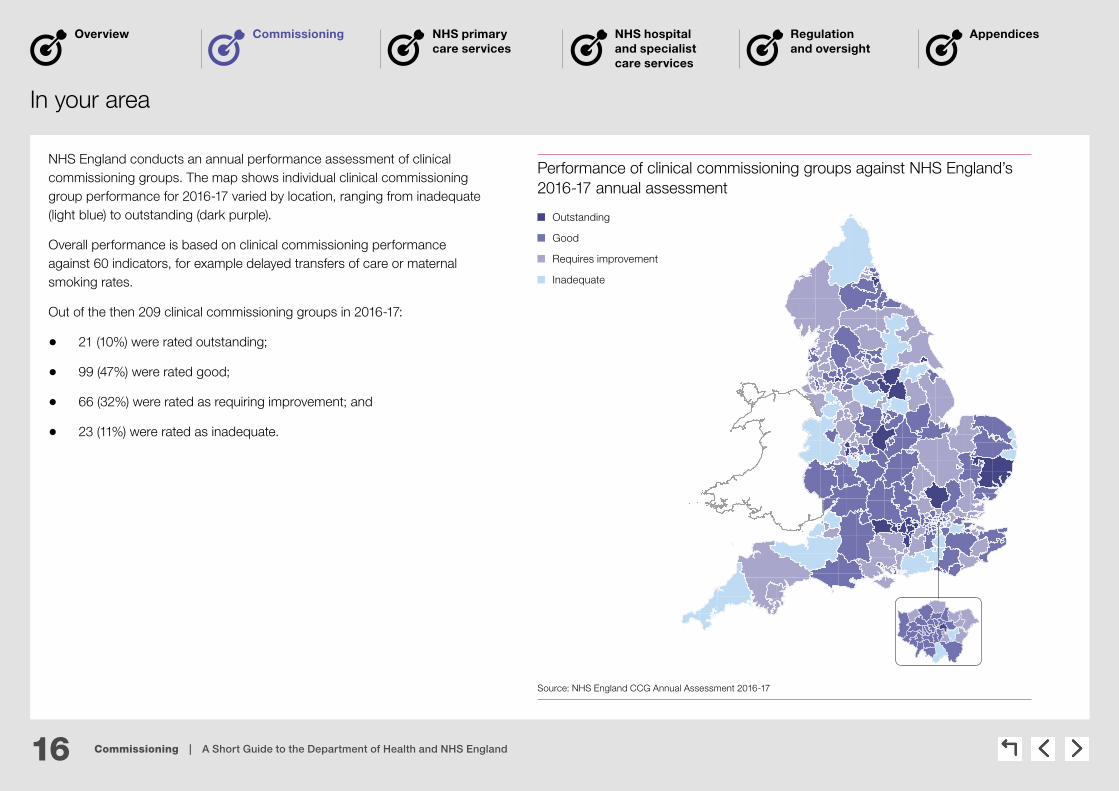
NHS England conducts an annual performance assessment of clinical commissioning groups. The map shows individual clinical commissioning group performance for 2016-17 varied by location, ranging from inadequate (light blue) to outstanding (dark purple).
Overall performance is based on clinical commissioning performance against 60 indicators, for example delayed transfers of care or maternal smoking rates.
Out of the then 209 clinical commissioning groups in 2016-17:
• 21 (10%) were rated outstanding;
• 99 (47%) were rated good;
• 66 (32%) were rated as requiring improvement; and
• 23 (11%) were rated as inadequate.
Performance of clinical commissioning groups against NHS England’s 2016-17 annual assessment
Outstanding
Good
Requires improvement
Inadequate
Source: NHS England CCG Annual Assessment 2016-17

17 Commissioning | A Short Guide to the Department of Health and NHS England
Commissioning NHS primary care services
NHS hospital and specialist care services
Regulation and oversight
AppendicesOverview
Recent and planned developments
Sustainability and Transformation Plans
In December 2015, NHS England announced a new planning framework for NHS services called Sustainability and Transformation Plans. NHS organisations and local authorities in different areas of England came together in partnerships to develop ‘place-based plans’ for the future of health and social care services for their local population. These plans had to cover all areas of clinical commissioning group and NHS England commissioned activity, and focus on better integration with social care and other local authority services.
Draft plans were produced by June 2016 and the 44 ‘final’ plans were submitted in October (available here). As set out in this year’s mandate for NHS England, the Department expects concrete progress on these plans in 2017-18. A number of metrics will be used to measure progress across the partnership areas (‘footprints’) in delivering the Five Year Forward View, although no further detail is given on these.
Accountable care systems
The Five Year Forward View envisaged the development of accountable care systems which, in their most integrated form, involve a single organisation having responsibility for commissioning and providing health and social care services across a local area. The first group of accountable care organisations were announced in June 2017, covering some seven million people. They are intended to be the forefront of national action to provide joined-up and better-coordinated care.
Devolution
In November 2014 the government announced a series of devolution deals with local areas, including deals for local areas to provide health and social care. In April 2016, local authorities and clinical commissioning groups in Greater Manchester took control of approximately £6 billion of health and social care spending. Other devolution deals have also been agreed, which include North-East, Tees Valley, the West Midlands, Liverpool and Sheffield.
Mergers of clinical commissioning groups
In November 2016 NHS England published updated guidance for clinical commissioning groups who wish to change their constitution or merge. NHS England advise that mergers should only be considered when there are demonstrable benefits to patients and fit with local Sustainability and Transformation Plans. As at July 2017, there are 207 clinical commissioning groups compared with 211 in April 2013. More mergers are expected with, for example, Birmingham CrossCity, Birmingham South Central and Solihull clinical commissioning groups seeking to develop a new single commissioning organisation by April 2018.

18 Commissioning | A Short Guide to the Department of Health and NHS England
Commissioning NHS primary care services
NHS hospital and specialist care services
Regulation and oversight
AppendicesOverview
What are the things to look out for?
Do commissioners have the capability to effectively manage services?
Our report, The commissioning of specialised services in the NHS, found that national-level contracting had strengthened NHS England’s position to influence providers and reduce prices but it was not clear whether its commissioning hubs had the skills to manage these contracts effectively.
Our report, Investigation into the collapse of the Uniting Care Partnership contract in Cambridgeshire and Peterborough, found that the contract design and negotiation process both indicated a lack of commercial expertise on the part of both the clinical commissioning groups and the trusts concerned.
Is funding distributed fairly between commissioners?
Our report, Funding health: Making allocations to local areas, concluded that the reforms of the health system in 2013 had brought greater central control over the division of funding between primary care, hospital, community and mental health services, and public health, but removed a degree of local discretion and flexibility. We found that progress in moving commissioners towards their target funding allocations was slow. However, NHS England subsequently agreed to increase the pace with which allocations are moved towards a fair share of funding.
Can clinical commissioning groups better meet the needs of the local population?
Our report, Improving patient access to general practice, found that the new commissioning arrangements – with clinical commissioning groups increasingly taking responsibility for primary care services – offered the opportunity of greater local understanding in the management of services. Due to their local presence, clinical commissioning groups should be better placed than NHS England to identify emerging problems with access. However, our evidence suggested that some commissioners had a limited understanding of whether services are meeting people’s needs and had limited capacity to manage any significant service changes.
How are conflicts of interest managed? Our report, Managing conflicts of interest in NHS clinical commissioning groups, found that the arrangements from April 2015 for co-commissioning primary care services from GPs increased the risk of conflicts of interest in clinical commissioning groups, especially when they commission services where GPs are likely to be involved as providers. We found that while NHS England recognised the increased risk and was developing plans to manage it, they had a limited understanding of how effectively clinical commissioning groups are managing conflicts of interest or whether they are complying with requirements.

19 NHS primary care services | A Short Guide to the Department of Health and NHS England
Commissioning NHS primary care services
NHS hospital and specialist care services
Regulation and oversight
AppendicesOverview
NHS primary care services
How is it delivered?
In your area Recent and planned developments
What are the things to look out for?
20 NHS primary care services | A Short Guide to the Department of Health and NHS England
Commissioning NHS primary care services
NHS hospital and specialist care services
Regulation and oversight
AppendicesOverview
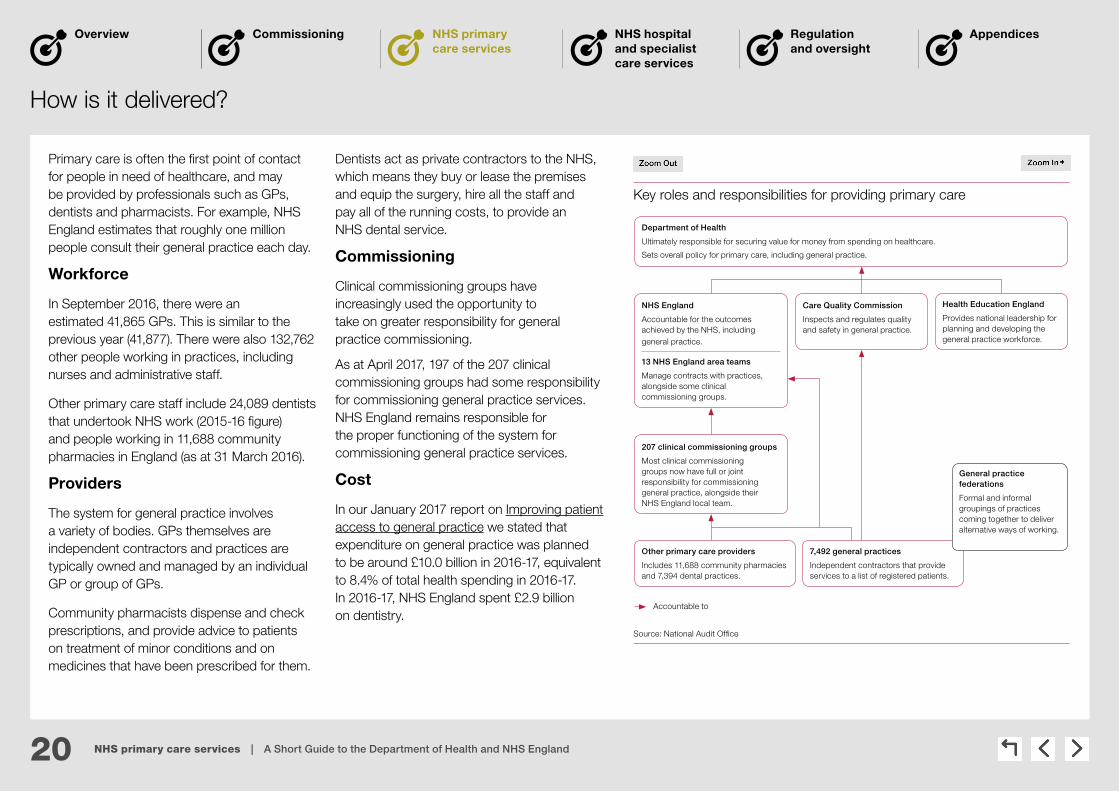
Primary care is often the first point of contact for people in need of healthcare, and may be provided by professionals such as GPs, dentists and pharmacists. For example, NHS England estimates that roughly one million people consult their general practice each day.
Workforce
In September 2016, there were an estimated 41,865 GPs. This is similar to the previous year (41,877). There were also 132,762 other people working in practices, including nurses and administrative staff.
Other primary care staff include 24,089 dentists that undertook NHS work (2015-16 figure) and people working in 11,688 community pharmacies in England (as at 31 March 2016).
Providers
The system for general practice involves a variety of bodies. GPs themselves are independent contractors and practices are typically owned and managed by an individual GP or group of GPs.
Community pharmacists dispense and check prescriptions, and provide advice to patients on treatment of minor conditions and on medicines that have been prescribed for them.
Dentists act as private contractors to the NHS, which means they buy or lease the premises and equip the surgery, hire all the staff and pay all of the running costs, to provide an NHS dental service.
Commissioning
Clinical commissioning groups have increasingly used the opportunity to take on greater responsibility for general practice commissioning.
As at April 2017, 197 of the 207 clinical commissioning groups had some responsibility for commissioning general practice services. NHS England remains responsible for the proper functioning of the system for commissioning general practice services.
Cost
In our January 2017 report on Improving patient access to general practice we stated that expenditure on general practice was planned to be around £10.0 billion in 2016-17, equivalent to 8.4% of total health spending in 2016-17. In 2016-17, NHS England spent £2.9 billion on dentistry.
How is it delivered?
Key roles and responsibilities for providing primary care
Department of Health
Ultimately responsible for securing value for money from spending on healthcare.
Sets overall policy for primary care, including general practice.
NHS England
Accountable for the outcomes achieved by the NHS, including general practice.
13 NHS England area teams
Manage contracts with practices, alongside some clinical commissioning groups.
Care Quality Commission
Inspects and regulates quality and safety in general practice.
Health Education England
Provides national leadership for planning and developing the general practice workforce.
Accountable to
207 clinical commissioning groups
Most clinical commissioning groups now have full or joint responsibility for commissioning general practice, alongside their NHS England local team.
Other primary care providers
Includes 11,688 community pharmacies and 7,394 dental practices.
7,492 general practices
Independent contractors that provide services to a list of registered patients.
General practice federations
Formal and informal groupings of practices coming together to deliver alternative ways of working.
Source: National Audit Offi ce

21 NHS primary care services | A Short Guide to the Department of Health and NHS England
Commissioning NHS primary care services
NHS hospital and specialist care services
Regulation and oversight
AppendicesOverview
In your area
Staffing
In our report, Stocktake of access to general practice in England, we found that general practice staff are not distributed across the country according to need, and that urban areas typically have fewer GPs and nurses per head of population. Although there remains significant disparity between different areas in the number of general practice staff, the disparity has reduced since 2010. Patients at practices where there are fewer GPs and nurses for each patient unsurprisingly report more problems in making and accessing appointments.
Experience
There is a regular survey, carried out on behalf of NHS England, to assess patients’ experience of healthcare services provided by GP surgeries. It asks people about their experience of access to GP surgeries, making appointments, the quality of care received from GPs and practice nurses, satisfaction with opening hours and experience of out-of-hours services. In 2017 the majority of people (85%) rated their overall experience of their GP as very good or fairly good. However, as shown on the map, this varies by clinical commissioning group area across England. Many of the worst-performing areas are London’s and its surrounding clinical commissioning groups, as well as other urban areas such as Birmingham.
The results of the 2017 survey of GPs were published in July 2017 and can be accessed here.
Patient-reported experience of GP services in 2017
73.3% – 81.4%
81.4% – 84.1%
84.1% – 86.0%
86.0% – 87.7%
87.7% – 92.5%
Percentage of people reporting a ‘very good’ or ‘fairly good’ experience of GP services, in quintiles.
Source: National Audit Offi ce analysis of the 2017 GP survey

22 NHS primary care services | A Short Guide to the Department of Health and NHS England
Commissioning NHS primary care services
NHS hospital and specialist care services
Regulation and oversight
AppendicesOverview
Recent and planned developments
Objectives
The Department’s mandate to NHS England sets out its ambition for people to have better access to GP services – stating that, by March 2018, 40% of people from England should have access to GP services from 8 am to 8 pm, seven days a week, extending to 100% by March 2019. Since April 2014, NHS England has committed £175 million to 57 GP Access Fund pilot sites, covering more than 18 million patients, to test alternative ways of improving access.
Future funding
The General Practice Forward View, published in April 2016, committed NHS England to provide extra support to general practice services. In January 2017 we reported that spending on general practice is expected to rise from £9.5 billion in 2015-16 to £11.0 billion (in 2015-16 prices) by 2020-21, a 16% real-terms increase, but will remain less than 10% of total health spending (see graph).
Workforce
As a part of the General Practice Forward View NHS England will support practices to:
• purchase online consultation systems, improving access and making best use of clinicians’ time; and
• train reception and clerical staff to undertake enhanced roles in active signposting and management of clinical correspondence.
NHS England will also invest to support an additional 1,500 clinical pharmacists to work in general practice by 2020-21. Clinical pharmacists work as part of the general practice team to resolve day-to-day medicine issues and consult with and treat patients directly.
Performance
As of 31 March 2017, 130 GP (1.7%) practices were placed in special measures after being inspected by the Care Quality Commission. NHS England plans to collect data on practice performance and waiting times for GP appointments for routine conditions.
Annual change in spending on general practice, 2010-11 to 2020-21
Spending (£bn) Proportion of total health spending (%)
Spending on general practice is set to increase faster than total health spending
Notes
1 Spending on general practice includes out-of-hours GP services, dispensing of drugs and local authority investment in public health servicesin general practice.
2 Total health spending taken as total Departmental Expenditure Limit for the Department of Health. Responsibility for delivering particular serviceschanged in April 2013, meaning the proportions of total health spending shown before 2013-14 are not directly comparable to later years.
Source: National Audit Office analysis of Department of Health, NHS England and NHS Digital data
2010
-11
2011
-12
2012
-13
2013
-14
2014
-15
2015
-16
2016
-17
2017
-18
2018
-19
2019
-20
2020
-21
Actual/planned spending on 9.0 8.9 8.8 9.0 9.1 9.5 10.0 10.2 10.5 10.7 11.0 general practice at 2015-16 prices (£bn)
Spending on general practice as 8.31 8.16 8.04 8.04 7.97 8.06 8.39 8.47 8.74 8.83 9.02 proportion of total health spending (%)
0
2
4
6
8
10
12
14
0
2
4
6
8
10
12 16

23 NHS primary care services | A Short Guide to the Department of Health and NHS England
Commissioning NHS primary care services
NHS hospital and specialist care services
Regulation and oversight
AppendicesOverview
What are the things to look out for?
Is there sufficient supply of GP staff, and is demand for GP services understood?
We reported, in Improving patient access to general practice, that NHS England and Health Education England’s efforts to increase the GP workforce were at particular risk from falling retention and increases in part-time working. We also found that the Department and NHS England had not fully considered the consequences and cost-effectiveness of their commitment to extend access and had not fully assessed the resources that will be required.
Health Education England recognised that information on local staffing needs was not complete and it did not routinely obtain plans from general practices. This meant that the needs of primary care may have been misrepresented in the regional workforce plans (Managing the supply of NHS clinical staff in England).
Is funding fairly allocated among areas? In our 2014 report, Funding healthcare: Making allocations to local areas, we found that funding was not allocated equitably according to need. NHS England had sought to make allocations to local areas fairer by introducing a more up-to-date calculation of local needs in 2016-17. However, the allocations to local areas balanced historical funding – and so financial stability – with relative patient need.
Since this report, NHS England committed to reducing variation in allocations at a local level; planned allocations for 2020-21 are expected to have almost half the variation (26%) between the extremes in 2016-17 (Improving patient access to general practice).
Is the main contract for general practice fit for purpose?
Our report, Improving patient access to general practice, highlighted that, while the contract stipulated that ‘core hours’ are 8 am to 6.30 pm from Monday to Friday, practices did not necessarily have to be open throughout these core hours. We found that patients registered to practices that are open for fewer than 45 hours per week attended accident and emergency (A&E) departments more often and in general shorter opening hours were associated with poorer outcomes.
24 NHS hospital and specialist care services | A Short Guide to the Department of Health and NHS England
Commissioning NHS primary care services
NHS hospital and specialist care services
Regulation and oversight
AppendicesOverview
NHS hospital and specialist care services
How is it delivered?
In your area Recent and planned developments
What are the things to look out for?
25 NHS hospital and specialist care services | A Short Guide to the Department of Health and NHS England
Commissioning NHS primary care services
NHS hospital and specialist care services
Regulation and oversight
AppendicesOverview
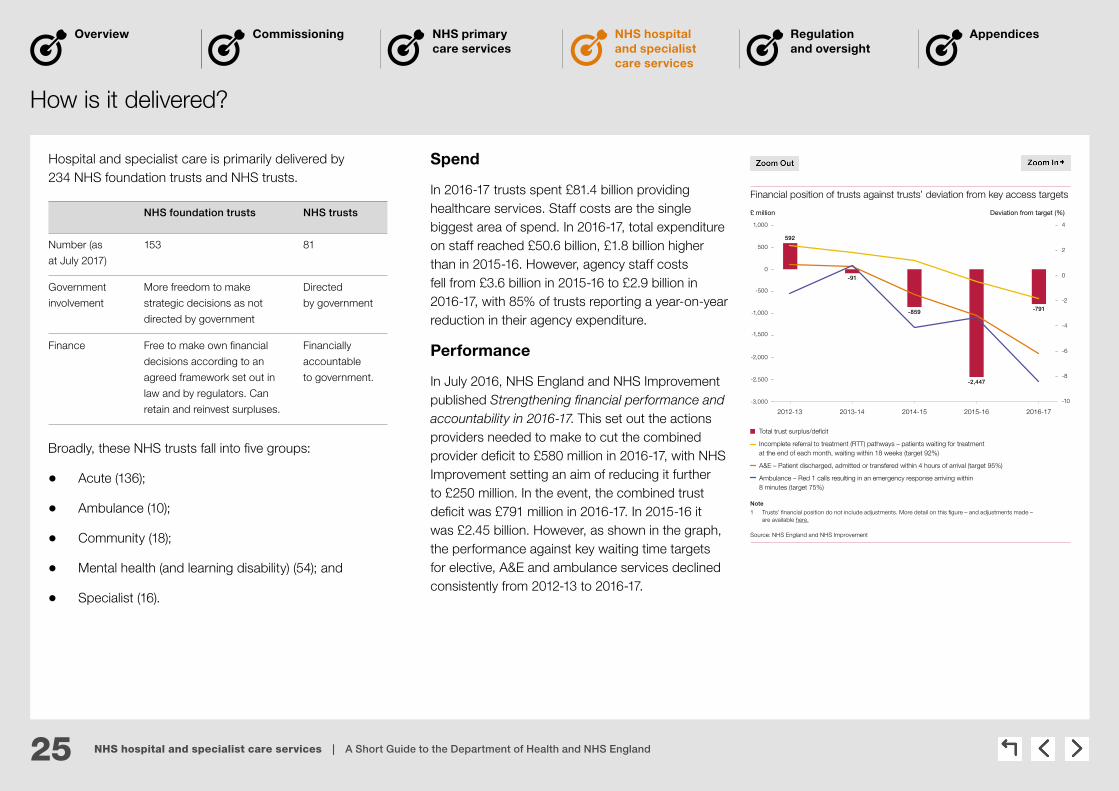
Hospital and specialist care is primarily delivered by 234 NHS foundation trusts and NHS trusts.
How is it delivered?
Total trust surplus/deficit
Incomplete referral to treatment (RTT) pathways – patients waiting for treatment at the end of each month, waiting within 18 weeks (target 92%)
A&E – Patient discharged, admitted or transfered within 4 hours of arrival (target 95%)
Ambulance – Red 1 calls resulting in an emergency response arriving within 8 minutes (target 75%)
Financial position of trusts against trusts’ deviation from key access targets
£ million Deviation from target (%)
Note
1 Trusts’ financial position do not include adjustments. More detail on this figure – and adjustments made – are available here.
Source: NHS England and NHS Improvement
2012-13 2013-14 2014-15 2015-16 2016-17
-3,000
-2,500
-2,000
-1,500
-1,000
-500
0
500
1,000
-10
-8
-6
-4
-2
0
2
4
592
-91
-2,447
-859 -791
Broadly, these NHS trusts fall into five groups:
• Acute (136);
• Ambulance (10);
• Community (18);
• Mental health (and learning disability) (54); and
• Specialist (16).
Spend
In 2016-17 trusts spent £81.4 billion providing healthcare services. Staff costs are the single biggest area of spend. In 2016-17, total expenditure on staff reached £50.6 billion, £1.8 billion higher than in 2015-16. However, agency staff costs fell from £3.6 billion in 2015-16 to £2.9 billion in 2016-17, with 85% of trusts reporting a year-on-year reduction in their agency expenditure.
Performance
In July 2016, NHS England and NHS Improvement published Strengthening financial performance and accountability in 2016-17. This set out the actions providers needed to make to cut the combined provider deficit to £580 million in 2016-17, with NHS Improvement setting an aim of reducing it further to £250 million. In the event, the combined trust deficit was £791 million in 2016-17. In 2015-16 it was £2.45 billion. However, as shown in the graph, the performance against key waiting time targets for elective, A&E and ambulance services declined consistently from 2012-13 to 2016-17.
NHS foundation trusts NHS trusts
Number (as
at July 2017)
153 81
Government
involvement
More freedom to make
strategic decisions as not
directed by government
Directed
by government
Finance Free to make own financial
decisions according to an
agreed framework set out in
law and by regulators. Can
retain and reinvest surpluses.
Financially
accountable
to government.
26 NHS hospital and specialist care services | A Short Guide to the Department of Health and NHS England
Commissioning NHS primary care services
NHS hospital and specialist care services
Regulation and oversight
AppendicesOverview
In your area
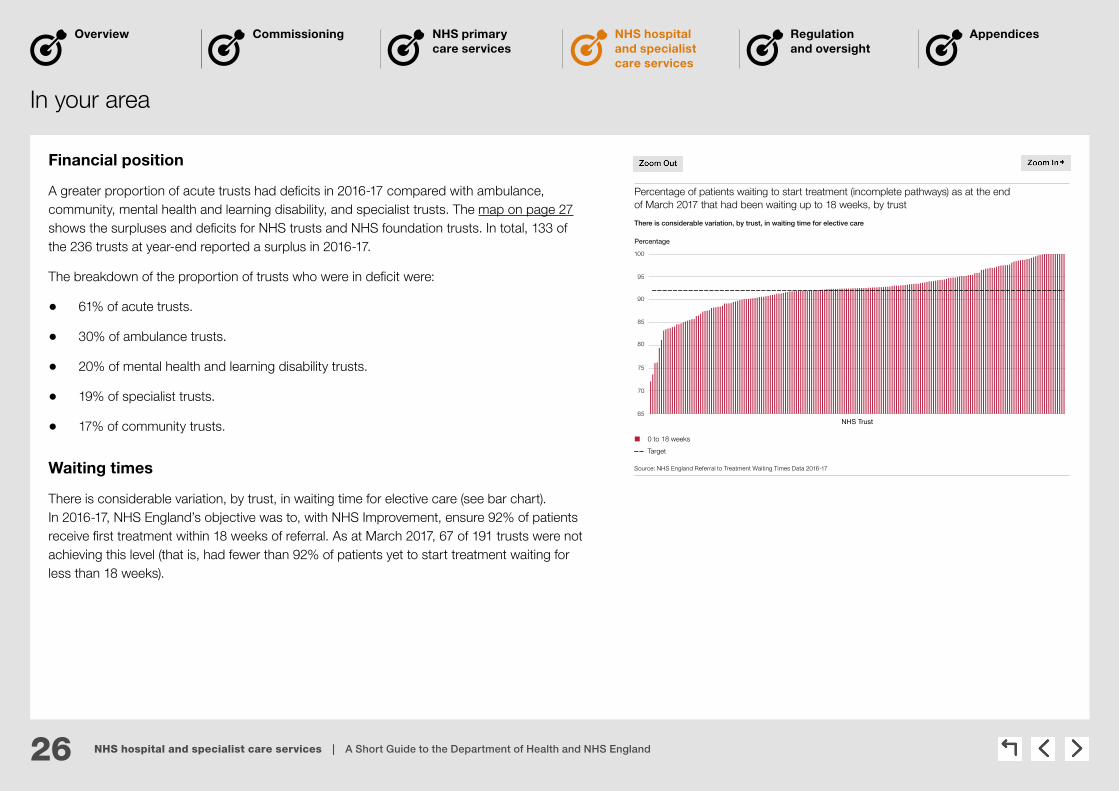
Financial position
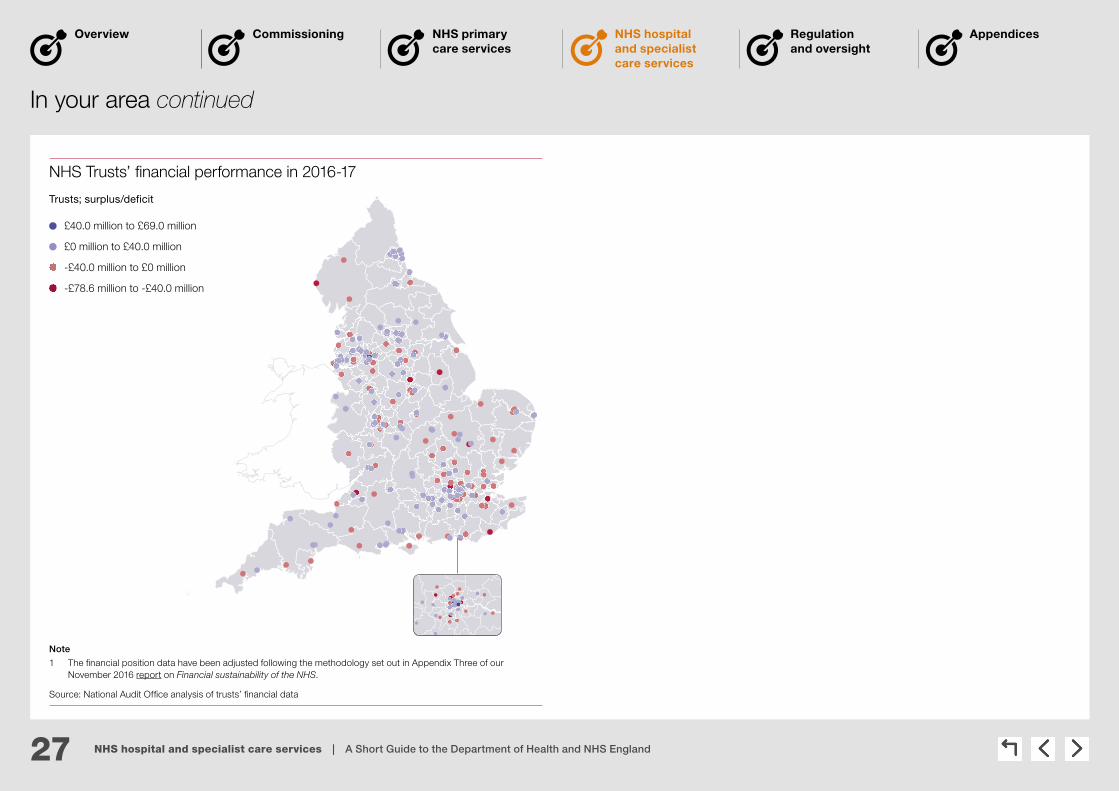
A greater proportion of acute trusts had deficits in 2016-17 compared with ambulance, community, mental health and learning disability, and specialist trusts. The map on page 27 shows the surpluses and deficits for NHS trusts and NHS foundation trusts. In total, 133 of the 236 trusts at year-end reported a surplus in 2016-17.
The breakdown of the proportion of trusts who were in deficit were:
• 61% of acute trusts.
• 30% of ambulance trusts.
• 20% of mental health and learning disability trusts.
• 19% of specialist trusts.
• 17% of community trusts.
Waiting times
There is considerable variation, by trust, in waiting time for elective care (see bar chart). In 2016-17, NHS England’s objective was to, with NHS Improvement, ensure 92% of patients receive first treatment within 18 weeks of referral. As at March 2017, 67 of 191 trusts were not achieving this level (that is, had fewer than 92% of patients yet to start treatment waiting for less than 18 weeks).
Percentage of patients waiting to start treatment (incomplete pathways) as at the end of March 2017 that had been waiting up to 18 weeks, by trust
Percentage
There is considerable variation, by trust, in waiting time for elective care
65
70
75
80
85
90
95
100
NHS Trust
0 to 18 weeks
Target
Source: NHS England Referral to Treatment Waiting Times Data 2016-17
27 NHS hospital and specialist care services | A Short Guide to the Department of Health and NHS England
Commissioning NHS primary care services
NHS hospital and specialist care services
Regulation and oversight
AppendicesOverview
In your area continued
NHS Trusts’ fi nancial performance in 2016-17
£40.0 million to £69.0 million
£0 million to £40.0 million
-£40.0 million to £0 million
-£78.6 million to -£40.0 million
Trusts; surplus/deficit
Note
1 The fi nancial position data have been adjusted following the methodology set out in Appendix Three of ourNovember 2016 report on Financial sustainability of the NHS.
Source: National Audit Offi ce analysis of trusts’ fi nancial data

28 NHS hospital and specialist care services | A Short Guide to the Department of Health and NHS England
Commissioning NHS primary care services
NHS hospital and specialist care services
Regulation and oversight
AppendicesOverview
Recent and planned developments
New models of care
In 2015, NHS England selected 50 vanguards to “lead on the development of new care models which will act as the blueprints for the NHS moving forward”. New models of care include joining up A&E, GP out of hours, minor injuries clinics, ambulance services and 111 so that patients know where they can get urgent help easily and effectively, seven days a week. In 2016 the new care models programme began working with a cohort of small district general hospitals (22 in total) to look at strengthening their acute medical model. The programme is offering support to these hospitals, giving opportunities for members to learn from each other and see what works in sustaining an acute medical model.
Moving care out of hospitals
One of the objectives of NHS England and the Department is to see more services provided out-of-hospital and greater integration with social care, so that care is more joined-up. The Five Year Forward View reiterated the ambition to deliver more healthcare out of acute hospitals and closer to home, with the aim of providing improving care while reducing both unplanned bed days in hospitals and net costs. Many acute hospitals providers in England now also provide community services and in some cases adult social care services.
Sustainability and Transformation Plans
In December 2015, NHS England announced Sustainability and Transformation Plans, (see Page 17). These plans are expected to help meet a ‘triple challenge’ set out in the NHS Five Year Forward View – better health, transformed quality of care delivery, and sustainable finances. Sustainability and Transformation Plan proposals are intended to improve care by making practical changes to how the NHS works, like making it easier to see a GP, speeding up cancer diagnosis and offering help faster to people with mental ill health. While Sustainability and Transformation Plans are wider than hospital and specialised care these sectors feature prominently. For example, a high priority for Sustainability and Transformation Plan areas is to use existing services in the community more effectively to reduce demand for hospital care.

29 NHS hospital and specialist care services | A Short Guide to the Department of Health and NHS England
Commissioning NHS primary care services
NHS hospital and specialist care services
Regulation and oversight
AppendicesOverview
What are the things to look out for?
Issue Relevant findings from recent NAO work
Is rising demand for services being managed effectively?
Our report, NHS Ambulance services, found that demand for ambulance services continued to grow rapidly due to increasing numbers of older patients with multiple conditions, an increasing number of alcohol and mental health-driven issues, and the availability of primary care services in the community and how patients seek help. We also found that increased funding for urgent and emergency activity had not kept pace with rising demand, and that most trusts were struggling to recruit the staff they need and then to retain them.
Our report, Discharging older patients from hospital, highlighted that rising demand for services, combined with restricted or reduced funding, was putting pressure on the capacity of local health and social care systems. It concluded there were far too many older people in hospitals who do not need to be there, which was a particular issue given the increases in demand. In particular, the study found that 1.15 million bed days were lost to reported delayed transfers of care in acute hospitals during 2015 (up 31% since 2013).
Is overspending becoming normal practice?
Our report, Sustainability and financial performance of acute hospital trusts, found that acute trusts were under financial stress, with six in 10 reporting a deficit in 2014-15. Acute trusts were more likely to report a deficit in 2014-15 (61%) than ambulance trusts (20%), community trusts (16%) or mental health and learning disability trusts (29%). We concluded that running a deficit seemed to be becoming normal practice for acute trusts and that NHS trusts and NHS foundation trusts under financial stress continued to rely on cash support from the Department.
Are trusts too dependent on temporary staffing?
Our report, Financial sustainability of the NHS, found that trusts’ spending on agency and contract staff was significant. Trusts spent 7.6% of their total staff costs on agency and contract staff in 2015-16, up from 7.1%, 5.6% and 4.8% in 2014-15, 2013-14 and 2012-13 respectively. The Department, Monitor and the NHS Trust Development Authority introduced controls on agency spending in October 2015. However, the amount trusts spent on agency and contract staff remained high. They spent £3.7 billion in 2015-16, compared with £3.3 billion in 2014-15.
The latest data show that agency spend fell in 2016-17 although by less than had been planned.
Why is there variation in performance between secondary care providers?
We often report on variation between trusts, including in:
• our study on NHS Ambulance services which found, for example, that the percentage of incidents in which an ambulance was deployed and later stood down varied from 4% to 46% between trusts in 2015-16; and
• the proportion of hospitals admitting older patients from A&E (from 37%–61%) and those discharging them by the next day (27%–41%), although individual hospital performance may have been affected by a range of external factors (Discharging older patients from hospital).
30 Regulation and oversight | A Short Guide to the Department of Health and NHS England
Commissioning NHS primary care services
NHS hospital and specialist care services
Regulation and oversight
AppendicesOverview
Regulation and oversight
How is it delivered?
In your area Recent and planned developments
What are the things to look out for?

31 Regulation and oversight | A Short Guide to the Department of Health and NHS England
Commissioning NHS primary care services
NHS hospital and specialist care services
Regulation and oversight
AppendicesOverview
How is it delivered?
The Care Quality Commission
The Care Quality Commission is the independent regulator of health and social care in England. Its role is to make sure health and social care services provide people with safe, effective, compassionate, high-quality care and it encourages care services to improve.
The Care Quality Commission monitors, inspects and regulates services and publishes what it finds, including performance ratings to help people choose between providers.
Clinical commissioning group and local authority commissioners and contract managers
Responsible for managing the contracts, and monitoring the performance, of the providers they commission services from.
NHS England
Hold clinical commissioning groups to account for their performance. They also have oversight of the services they commission directly.
Professional standards bodies
The nine regulators of health and care professionals (for example, General Medical Council and Nursing and Midwifery Council) are overseen by the Professional Standards Authority (which also accredits registers of practitioners in unregulated occupations).
Parliamentary and Health Service Ombudsmen / Local Government Ombudsmen
Investigate and respond to individual complaints made by the public on health and social care issues.
Healthwatch England / local Healthwatch
Healthwatch England acts as a consumer champion for health and social care. Each area in England has a local Healthwatch – which are independent organisations who listen to patients’ views and work to make local services better.
NHS Improvement
NHS Improvement is responsible for overseeing NHS foundation trusts, NHS trusts and independent providers. It is the operational name, since 1 April 2016, for an organisation that brings together: Monitor, NHS Trust Development Authority, Patient Safety, including the National Reporting and Learning System, Advancing Change Team and Intensive Support Teams.
NHS Improvement is responsible for providing increased support to hospitals to continue to improve care and boost efficiency.
The main bodies involved in regulation and oversight of healthcare in England are the Care Quality Commission and NHS Improvement.
The other health organisations involved in oversight and regulation are:

32 Regulation and oversight | A Short Guide to the Department of Health and NHS England
Commissioning NHS primary care services
NHS hospital and specialist care services
Regulation and oversight
AppendicesOverview
In your area
Quality special measures
Special measures for quality apply to trusts that have serious failures in quality of care and where there are concerns that existing management cannot make the necessary improvements without support. NHS Improvement is responsible for placing trusts in special measures, although this is usually based on evidence provided by the Care Quality Commission. NHS Improvement will only take a trust out of special measures following a recommendation from the Care Quality Commission, although it must also take assurance that improvements will be sustained.
Financial special measures
In July 2016, NHS Improvement launched the financial special measures programme for trusts which have either not agreed, or deviated significantly from, savings targets.
The five organisations in both Quality and Financial special measures as at July 2017 were:
Barts Health NHS Trust; Brighton and Sussex University Hospitals NHS Trust; East Sussex Healthcare NHS Trust; Northern Lincolnshire and Goole NHS Foundation Trust; and St George’s University Hospital NHS Foundation Trust.
The eight organisations in Quality special measures only as at July 2017 were:
Colchester Hospital University NHS Foundation Trust; London Ambulance Service NHS Trust; Princess Alexandra Hospital NHS Trust; South East Coast Ambulance Service NHS Foundation Trust; United Lincolnshire Hospitals NHS Trust; Walsall Healthcare NHS Trust; West Hertfordshire NHS Trust; and Worcestershire Acute Hospitals NHS Trust.
The five organisations in Financial special measures only as at July 2017 were:
East Kent Hospitals University NHS Foundation Trust; Gloucestershire Hospitals NHS Foundation Trust; Maidstone and Tunbridge Wells NHS Trust; North Bristol NHS Trust; and University Hospitals of North Midlands NHS Trust.
NHS trusts currently or previously in special measures
Currently in both Quality and Financial special measures
Currently in Quality special measures
Was previously in Quality special measures
Currently in Financial special measures
Was previously in Financial special measures
NHS trusts in special measures
Source: National Audit Offi ce analysis of NHS Improvement information
33 Regulation and oversight | A Short Guide to the Department of Health and NHS England
Commissioning NHS primary care services
NHS hospital and specialist care services
Regulation and oversight
AppendicesOverview
Recent and planned developments
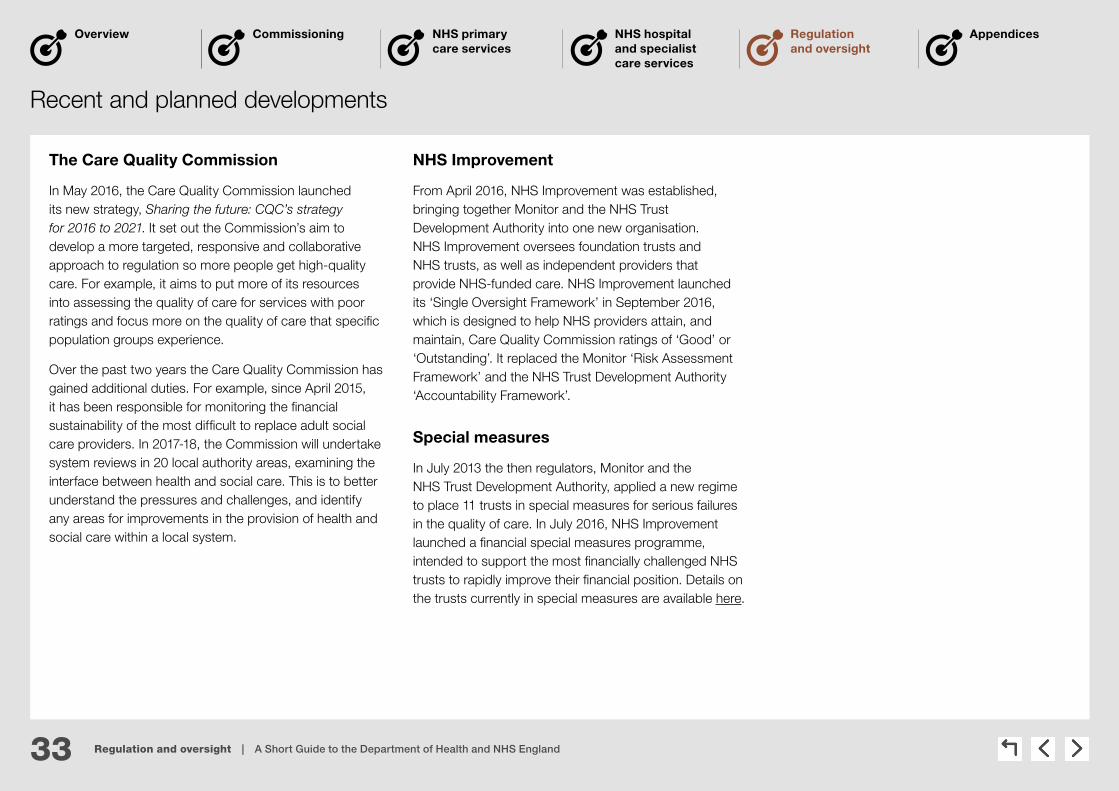
The Care Quality Commission
In May 2016, the Care Quality Commission launched its new strategy, Sharing the future: CQC’s strategy for 2016 to 2021. It set out the Commission’s aim to develop a more targeted, responsive and collaborative approach to regulation so more people get high-quality care. For example, it aims to put more of its resources into assessing the quality of care for services with poor ratings and focus more on the quality of care that specific population groups experience.
Over the past two years the Care Quality Commission has gained additional duties. For example, since April 2015, it has been responsible for monitoring the financial sustainability of the most difficult to replace adult social care providers. In 2017-18, the Commission will undertake system reviews in 20 local authority areas, examining the interface between health and social care. This is to better understand the pressures and challenges, and identify any areas for improvements in the provision of health and social care within a local system.
NHS Improvement
From April 2016, NHS Improvement was established, bringing together Monitor and the NHS Trust Development Authority into one new organisation. NHS Improvement oversees foundation trusts and NHS trusts, as well as independent providers that provide NHS-funded care. NHS Improvement launched its ‘Single Oversight Framework’ in September 2016, which is designed to help NHS providers attain, and maintain, Care Quality Commission ratings of ‘Good’ or ‘Outstanding’. It replaced the Monitor ‘Risk Assessment Framework’ and the NHS Trust Development Authority ‘Accountability Framework’.
Special measures
In July 2013 the then regulators, Monitor and the NHS Trust Development Authority, applied a new regime to place 11 trusts in special measures for serious failures in the quality of care. In July 2016, NHS Improvement launched a financial special measures programme, intended to support the most financially challenged NHS trusts to rapidly improve their financial position. Details on the trusts currently in special measures are available here.
34 Regulation and oversight | A Short Guide to the Department of Health and NHS England
Commissioning NHS primary care services
NHS hospital and specialist care services
Regulation and oversight
AppendicesOverview
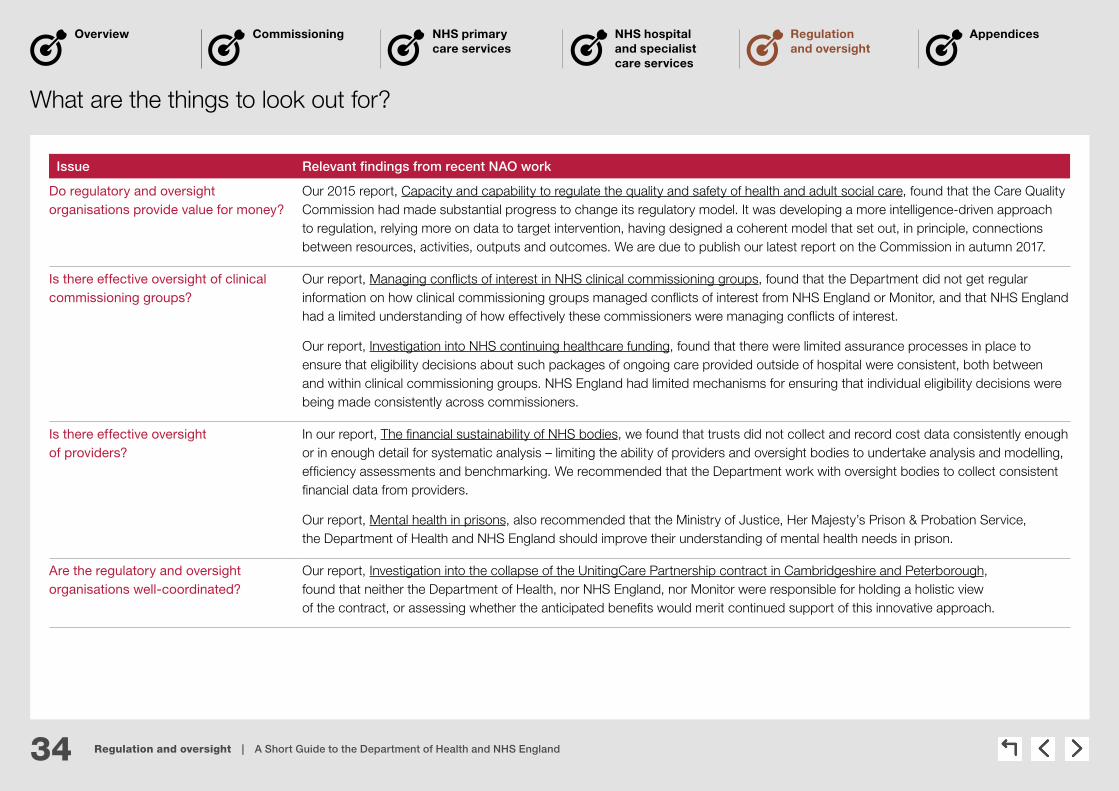
What are the things to look out for?
Issue Relevant findings from recent NAO work
Do regulatory and oversight organisations provide value for money?
Our 2015 report, Capacity and capability to regulate the quality and safety of health and adult social care, found that the Care Quality Commission had made substantial progress to change its regulatory model. It was developing a more intelligence-driven approach to regulation, relying more on data to target intervention, having designed a coherent model that set out, in principle, connections between resources, activities, outputs and outcomes. We are due to publish our latest report on the Commission in autumn 2017.
Is there effective oversight of clinical commissioning groups?
Our report, Managing conflicts of interest in NHS clinical commissioning groups, found that the Department did not get regular information on how clinical commissioning groups managed conflicts of interest from NHS England or Monitor, and that NHS England had a limited understanding of how effectively these commissioners were managing conflicts of interest.
Our report, Investigation into NHS continuing healthcare funding, found that there were limited assurance processes in place to ensure that eligibility decisions about such packages of ongoing care provided outside of hospital were consistent, both between and within clinical commissioning groups. NHS England had limited mechanisms for ensuring that individual eligibility decisions were being made consistently across commissioners.
Is there effective oversight of providers?
In our report, The financial sustainability of NHS bodies, we found that trusts did not collect and record cost data consistently enough or in enough detail for systematic analysis – limiting the ability of providers and oversight bodies to undertake analysis and modelling, efficiency assessments and benchmarking. We recommended that the Department work with oversight bodies to collect consistent financial data from providers.
Our report, Mental health in prisons, also recommended that the Ministry of Justice, Her Majesty’s Prison & Probation Service, the Department of Health and NHS England should improve their understanding of mental health needs in prison.
Are the regulatory and oversight organisations well-coordinated?
Our report, Investigation into the collapse of the UnitingCare Partnership contract in Cambridgeshire and Peterborough, found that neither the Department of Health, nor NHS England, nor Monitor were responsible for holding a holistic view of the contract, or assessing whether the anticipated benefits would merit continued support of this innovative approach.

35 Appendices | A Short Guide to the Department of Health and NHS England
Commissioning NHS primary care services
NHS hospital and specialist care services
Regulation and oversight
AppendicesOverview
Appendix Three – Staff attitude
and engagement
Appendices
Appendix Two – Staff and pay
in 2016-17
Appendix One – Exiting the
European Union
Appendix Five – Department of Health
sponsored bodies
Appendix Four – Recent NAO reports

36 Appendices | A Short Guide to the Department of Health and NHS England
Commissioning NHS primary care services
NHS hospital and specialist care services
Regulation and oversight
AppendicesOverview
Appendix One – Exiting the European Union
Two potential issues for the Department arising from the decision to leave the EU are the implications for clinical staff and reciprocal healthcare agreements.
Clinical staff:
• 5.1% of staff working in the English NHS, in 2016, were from elsewhere in the EU. This varies by profession and region, with highest levels in London (see table).
• To reduce reliance on doctors who trained outside of the UK, the Department is planning to increase the number of doctors trained each year from 6,500 to 8,000.
Reciprocal healthcare agreements:
• The three arrangements which might be affected are those covering:
• emergency healthcare needs that arise during a temporary visit – the European Health Insurance Card (EHIC) scheme. The government has said that it will seek an ongoing arrangement akin to this scheme as part of negotiations with the EU;
• healthcare needs of state pensioners living in another European Economic Area (EEA state) – the S1 scheme; and
• the cost of pre-planned treatments undertaken in another EEA state – the S2 scheme.
• Recovering costs of treating EU citizens: Under these schemes the UK claimed £56.3 million from other EEA countries in 2015-16 (see figure.)
• Payments for UK citizens abroad: Under these same schemes, these EEA countries claimed £565.2 million from the UK in 2015-16. The cost related to UK pensioners living abroad (S1 scheme) made up 75.9% (£429.1 million) of this total.
UK charging for visitors from the EEA, 2013-14 to 2015-16
Source: Comptroller and Auditor General, Recovering the cost of NHS treatment for overseas visitors, Session 2016-17,HC 728, National Audit Office, October 2016
2015-16
2014-15
2013-14
0 10 20 30 40 50 60
£ million
S2
S1
11.0 31.314.0
10.8 28.310.6
10.6 29.812.5
EHIC scheme
£56.3
£49.7
£52.9
Percentage of EU nationals working in the NHS, by region
Region North, Midlands and South West
South and East
London England Total EU staff
All NHS staff 2%–5% 6%–8% 10%-11% 5.1% 59,796
Doctors 7%–8% 8%–11% 12%–14% 9.2% 10,386
Nurses and health visitors 1%–7% 9%–13% 13%-14% 7.0% 22,227
Other staff 1%–3% 4%–6% 8%–9% 3.7% 27,208
Note
1 Staffi ng levels as at September 2016.
Source: Health Select Committee, Brexit and health and social care – people and processes, Session 2016-17, HC 640, 2017

37 Appendices | A Short Guide to the Department of Health and NHS England
Commissioning NHS primary care services
NHS hospital and specialist care services
Regulation and oversight
AppendicesOverview
Appendix Two – Staff and pay in 2016-17
Department group staffing
Across the whole Departmental of Health group, there were 1.20 million staff in 2016-17 (1.18 million in 2015-16) at a cost of £53.7 billion (£51.8 billion in 2015-16). This number excludes staff in independent providers (which includes GPs).
Department of Health and NHS England staffing
The Department employed 1,733 full-time equivalent staff in 2016-17, spending £79.4 million on staffing. NHS England employed 4,696 people in 2016-17 at a cost of £294.8 million. Median total remuneration is higher at the Department (£44,800 compared with £38,812).
In 2016-17, the Department decreased its staffing numbers by 8%. It also decreased its expenditure on off-payroll, temporary and consultancy staff by 10% to £18.7 million.
While NHS England increased its permanent staffing numbers by 7% from 2015-16 to 2016-17, it reduced its expenditure on consultancy, agency and temporary staff over the same period. In 2016-17 NHS England (including its commissioning support units) spent £18 million on consultancy staff compared with £25 million in 2015-16. It also spent £131 million on contingent staff – which includes agency staff and secondees – compared with £176 million in 2015-16.
Both NHS England and the Department employ more women than men. In addition:
• 6% of the Department’s staff and 5% of NHS England’s staff have disclosed a disability; and
• 17% of the Department’s staff and 14% of NHS England’s staff have disclosed that they are from a black, asian and minority ethnic background (BAME).
Note
1 The Department of Health uses full-time equivalent fi gures to present staffi ng information. Median remuneration includes agency staff.
Source: NHS Digital, Department of Health and NHS England.
Workforce in Department of Health & NHS England 2016-17
Staff breakdown 2016-17 (FTE)
Ratio
Department of Health NHS EnglandPay multiples 2016-17
Staff gender
Female 59% | 69%Male 41% | 31%
4.6 5.4
Band of highest paid director’s total remuneration (£) 205,000–210,000 205,000–210,000
Median total remuneration (£) 44,800 38,812
Department of Health
Department of Health
Department of Health
NHS England NHS England NHS England
Disability
White 73% | 74%BAME 17% | 14% Not declared 10% | 12%
Non-disabled 84% | 83%Not declared 10% | 12% Disabled 6% | 5%
Ethnicity
Department of Health NHS England
Permanent Staff numbers
1,733(full-time equivalent)
4,696
Cost (£m)
79.4 294.8
Source: Data for Department of Health is from September 2016, Data for NHS England is from March 2017

38 Appendices | A Short Guide to the Department of Health and NHS England
Commissioning NHS primary care services
NHS hospital and specialist care services
Regulation and oversight
AppendicesOverview
Appendix Three – Staff attitude and engagement
The government has conducted its Civil Service People Survey annually for the past six years. The most recent survey was carried out during November 2016, and covered the Department and its two executive agencies (Public Health England, and the Medicines and Healthcare products and Regulatory Agency). Since it is not part of the civil service, NHS England was not included in this survey.
The Department announced a restructure and associated staffing reductions in February 2016 as part of its change programme (DH2020). By the end of March 2017, 573 staff were approved to leave the Department through early release or voluntary redundancy (voluntary exit scheme).
The Department’s scores have decreased compared with 2015 across all main areas of the survey. The Department also scored lower than the civil service benchmark, with particularly low scores for ‘organisational objectives and purpose’, and ‘leadership and managing change’.
The survey also produces an employment engagement index for each department. This is based on responses to questions asking about how employees feel about the organisation they work for and the extent to which they feel motivated. The engagement index for the Department was 14 percentage points lower than the civil service benchmark.
Note
1 MHRA = Medicines and Healthcare products Regulatory Agency.
Source: Civil Service People Survey 2016 and 2015
Attitudes of staff in 2016 compared with 2015 – Department of Health
Resources and workload Pay and benefits
My work My teamOrganisational objectives and purpose
Learning and development
My manager
Inclusion and fair treatment
Leadership and managing change
77%
-3%
27%
-11%
29%
-3%
65%
-5%
61%
-15%
67%
-5%
69%
-6%
66%
-11%
43%
-10%
Key
Results in 2016
Increase since 2015
Decrease since 2015
No change
75%
76%50%
83%
73%
68%
31%
80%
43%
Civil service average
Civil service averageCivil service average
Civil service average
Civil service average
Civil service average
Civil service average
Civil service average
Civil service average
Engagement index 2016
MHRA
Public Health England
Department of Health 45%
64%
56%
Civil service benchmark 2016 (59%)
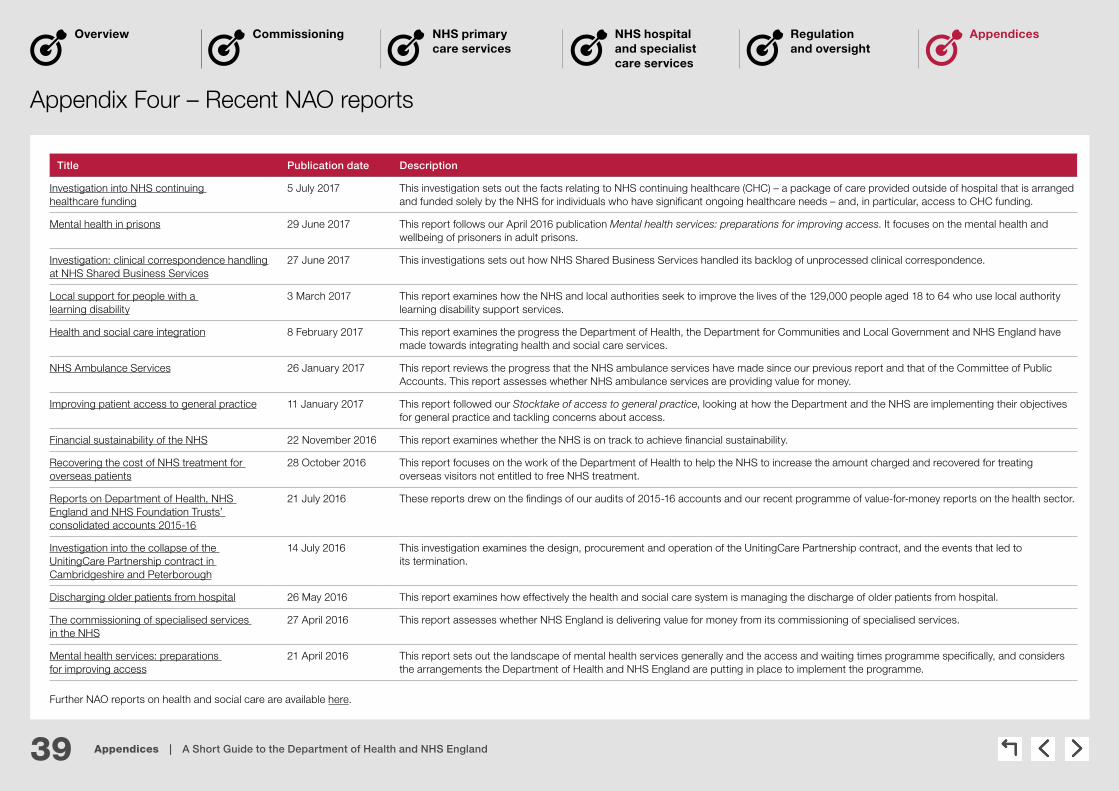
39 Appendices | A Short Guide to the Department of Health and NHS England
Commissioning NHS primary care services
NHS hospital and specialist care services
Regulation and oversight
AppendicesOverview
Appendix Four – Recent NAO reports
Title Publication date Description
Investigation into NHS continuing healthcare funding
5 July 2017 This investigation sets out the facts relating to NHS continuing healthcare (CHC) – a package of care provided outside of hospital that is arranged and funded solely by the NHS for individuals who have significant ongoing healthcare needs – and, in particular, access to CHC funding.
Mental health in prisons 29 June 2017 This report follows our April 2016 publication Mental health services: preparations for improving access. It focuses on the mental health and wellbeing of prisoners in adult prisons.
Investigation: clinical correspondence handling at NHS Shared Business Services
27 June 2017 This investigations sets out how NHS Shared Business Services handled its backlog of unprocessed clinical correspondence.
Local support for people with a learning disability
3 March 2017 This report examines how the NHS and local authorities seek to improve the lives of the 129,000 people aged 18 to 64 who use local authority learning disability support services.
Health and social care integration 8 February 2017 This report examines the progress the Department of Health, the Department for Communities and Local Government and NHS England have made towards integrating health and social care services.
NHS Ambulance Services 26 January 2017 This report reviews the progress that the NHS ambulance services have made since our previous report and that of the Committee of Public Accounts. This report assesses whether NHS ambulance services are providing value for money.
Improving patient access to general practice 11 January 2017 This report followed our Stocktake of access to general practice, looking at how the Department and the NHS are implementing their objectives for general practice and tackling concerns about access.
Financial sustainability of the NHS 22 November 2016 This report examines whether the NHS is on track to achieve financial sustainability.
Recovering the cost of NHS treatment for overseas patients
28 October 2016 This report focuses on the work of the Department of Health to help the NHS to increase the amount charged and recovered for treating overseas visitors not entitled to free NHS treatment.
Reports on Department of Health, NHS England and NHS Foundation Trusts’ consolidated accounts 2015-16
21 July 2016 These reports drew on the findings of our audits of 2015-16 accounts and our recent programme of value-for-money reports on the health sector.
Investigation into the collapse of the UnitingCare Partnership contract in Cambridgeshire and Peterborough
14 July 2016 This investigation examines the design, procurement and operation of the UnitingCare Partnership contract, and the events that led to its termination.
Discharging older patients from hospital 26 May 2016 This report examines how effectively the health and social care system is managing the discharge of older patients from hospital.
The commissioning of specialised services in the NHS
27 April 2016 This report assesses whether NHS England is delivering value for money from its commissioning of specialised services.
Mental health services: preparations for improving access
21 April 2016 This report sets out the landscape of mental health services generally and the access and waiting times programme specifically, and considers the arrangements the Department of Health and NHS England are putting in place to implement the programme.
Further NAO reports on health and social care are available here.

40 Appendices | A Short Guide to the Department of Health and NHS England
Commissioning NHS primary care services
NHS hospital and specialist care services
Regulation and oversight
AppendicesOverview
Appendix Five – Department of Health sponsored bodies
Executive non-departmental public bodiesCare Quality Commission www.cqc.org.uk/
Health Education England www.hee.nhs.uk/
Health Research Authority www.hra.nhs.uk/
Human Fertilisation and Embryology Authority www.hfea.gov.uk/
Human Tissue Authority www.hta.gov.uk/
NHS Blood and Transplant www.nhsbt.nhs.uk/
NHS Business Services Authority www.nhsbsa.nhs.uk/
NHS Digital1 www.digital.nhs.uk
NHS England www.england.nhs.uk/
NHS Resolution resolution.nhs.uk/
National Institute for Health and Care Excellence www.nice.org.uk/
NHS Improvement2 improvement.nhs.uk/
Executive agencies Public Health England www.gov.uk/government/organisations/public-health-england
Medicines and Healthcare products Regulatory Agency www.gov.uk/government/organisations/medicines-and-healthcare-products-regulatory-agency
Advisory non-departmental public bodiesAdministration of Radioactive Substances Advisory Committee
Advisory Committee on Clinical Excellence Awards
British Pharmacopoeia Commission
Commission on Human Medicines
Committee on Mutagenicity of Chemicals in Food, Consumer Products and the Environment
Independent Reconfiguration Panel
NHS Pay Review Body
Review Body on Doctors’ and Dentists’ Remuneration
Other bodiesAccelerated Access Review
Morecambe Bay Investigation
National Data Guardian
National Information Board
Porton Biopharma Limited
Notes
1 NHS Digital used to be called the Health and Social Care Information Centre. It changed its trading name in April 2016.
2 Monitor, the NHS Trust Development Authority and a number of smaller bodies became a jointly-led organisation, NHS Improvement, on 1 April 2016.