Department of Health and Human Servicesoig.hhs.gov/oas/reports/region4/40400009.pdf · Department...
21
Transcript of Department of Health and Human Servicesoig.hhs.gov/oas/reports/region4/40400009.pdf · Department...


Department of Health and Human Services OFFICE OF
INSPECTOR GENERAL
Daniel R. Levinson Inspector General
MAY 2006
A-04-04-00009
REVIEW OF GEORGIA’S MEDICAID COST OUTLIER
PAYMENTS

Office of Inspector General http://oig.hhs.gov
The mission of the Office of Inspector General (OIG), as mandated by Public Law 95-452, as amended, is to protect the integrity of the Department of Health and Human Services (HHS) programs, as well as the health and welfare of beneficiaries served by those programs. This statutory mission is carried out through a nationwide network of audits, investigations, and inspections conducted by the following operating components: Office of Audit Services The Office of Audit Services (OAS) provides all auditing services for HHS, either by conducting audits with its own audit resources or by overseeing audit work done by others. Audits examine the performance of HHS programs and/or its grantees and contractors in carrying out their respective responsibilities and are intended to provide independent assessments of HHS programs and operations. These assessments help reduce waste, abuse, and mismanagement and promote economy and efficiency throughout HHS. Office of Evaluation and Inspections The Office of Evaluation and Inspections (OEI) conducts national evaluations to provide HHS, Congress, and the public with timely, useful, and reliable information on significant issues. Specifically, these evaluations focus on preventing fraud, waste, or abuse and promoting economy, efficiency, and effectiveness in departmental programs. To promote impact, the reports also present practical recommendations for improving program operations. Office of Investigations The Office of Investigations (OI) conducts criminal, civil, and administrative investigations of allegations of wrongdoing in HHS programs or to HHS beneficiaries and of unjust enrichment by providers. The investigative efforts of OI lead to criminal convictions, administrative sanctions, or civil monetary penalties. Office of Counsel to the Inspector General The Office of Counsel to the Inspector General (OCIG) provides general legal services to OIG, rendering advice and opinions on HHS programs and operations and providing all legal support in OIG’s internal operations. OCIG imposes program exclusions and civil monetary penalties on health care providers and litigates those actions within HHS. OCIG also represents OIG in the global settlement of cases arising under the Civil False Claims Act, develops and monitors corporate integrity agreements, develops compliance program guidances, renders advisory opinions on OIG sanctions to the health care community, and issues fraud alerts and other industry guidance.

Notices
THIS REPORT IS AVAILABLE TO THE PUBLIC at http://oig.hhs.gov
In accordance with the principles of the Freedom of Information Act (5 U.S.C.
552, as amended by Public Law 104-231), Office of Inspector General, Office of Audit Services reports are made available to members of the public to the extent
the information is not subject to exemptions in the act. (See 45 CFR part 5.)
OAS FINDINGS AND OPINIONS
The designation of financial or management practices as questionable or a
recommendation for the disallowance of costs incurred or claimed, as well as other conclusions and recommendations in this report, represent the findings and
opinions of the HHS/OIG/OAS. Authorized officials of the HHS divisions will make final determination on these matters.

EXECUTIVE SUMMARY BACKGROUND Georgia Medicaid Payments The Georgia Department of Community Health (the State agency) pays hospitals for Medicaid inpatient services through a hybrid diagnosis-related group (DRG) prospective payment system. Most cases are reimbursed using a DRG per case rate. Although DRG payments vary by category of inpatient Medicaid cases, the payments for each category of cases are fixed. Under this system, hospitals have a financial incentive to avoid extremely costly cases. To counter this incentive and promote access to hospital care for high-cost patients, the State agency makes additional payments called cost outlier payments. Outlier payments can be viewed as a form of insurance for hospitals against the large losses that could result from extremely expensive cases. Medicare Outlier Payments The Georgia Medicaid outlier policy is similar to the initial Medicare outlier policy. However, the Medicare program adopted new regulations in 2003 to address vulnerabilities that resulted in excessive payments to certain hospitals that were aggressively increasing charges. Because of these increases, the Centers for Medicare & Medicaid Services (CMS) outlier formula overestimated the hospitals’ costs, and CMS paid approximately $9 billion in excessive Medicare outlier payments from 1998 through 2002 for cases that should not have qualified as extraordinarily high-cost cases. OBJECTIVE Our objective was to determine whether Georgia’s method of computing inpatient hospital cost outlier payments effectively limited outlier payments to high-cost cases. SUMMARY OF FINDINGS Georgia’s method of computing inpatient hospital cost outlier payments did not effectively limit outlier payments to high-cost cases. Instead of applying a current cost-to-charge ratio (costs divided by charges) to current billed charges from July 1998 through December 2002, the State agency applied an outdated cost-to-charge ratio to current billed charges, thus increasing cost outlier payments. The calculation of inpatient cost outlier payments includes applying the cost-to-charge ratio to current billed charges. During the audit period, actual cost-to-charge ratios steadily declined as current billed charges increased, which should have resulted in lower outlier payments. However, except for making an adjustment in 2002, the State agency kept outlier payments artificially high by not updating cost-to-charge ratios at a pace commensurate with increasing hospital charges.
i

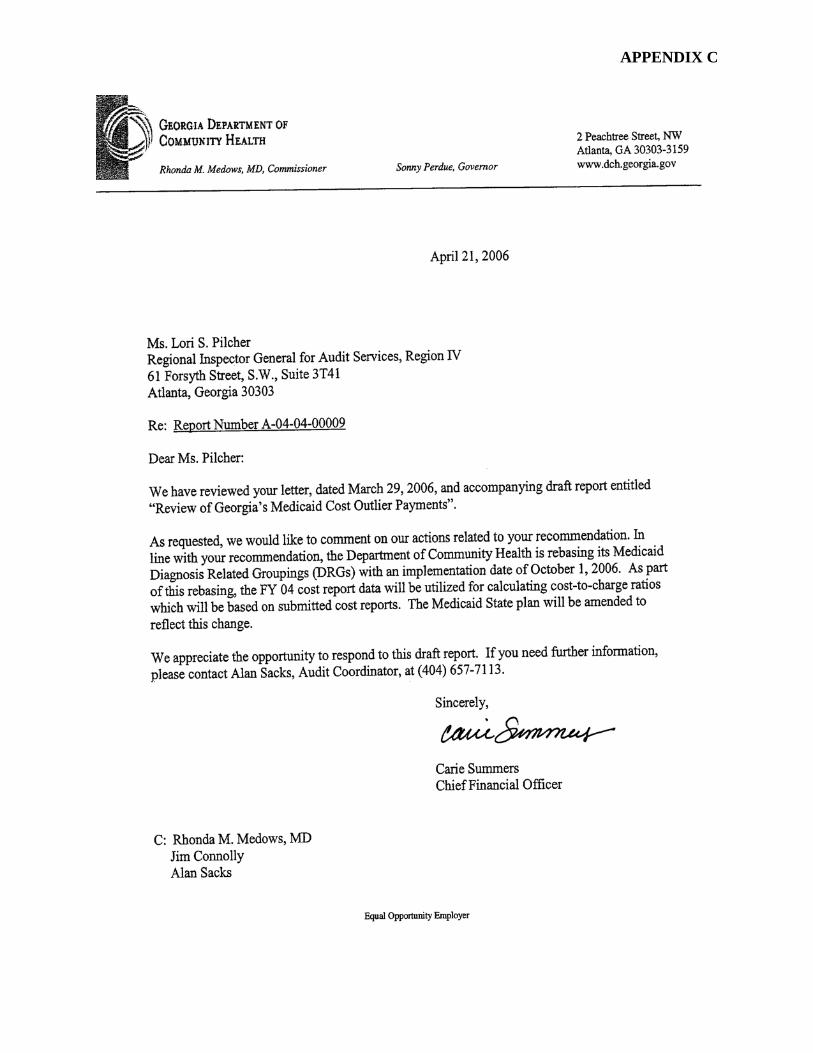
The State agency relied on historical cost-to-charge ratios because its State plan amendments required the use of audited cost report data to calculate cost-to-charge ratios. Audited cost reports typically run about 4 years behind the current year. Thus, the State agency relied on outdated cost-to-charge ratios in determining outlier payments. If the State agency continues to use outdated cost-to-charge ratios, it is likely that cost outlier payments will continue to increase as hospitals increase charges faster than costs. Had the State agency applied current cost-to-charge ratios to convert billed charges to costs, it could have saved approximately $22.7 million in cost outlier payments between 1998 and 2002 at the three hospitals reviewed. We believe that additional savings exist at other hospitals. RECOMMENDATION We recommend that the State agency amend its Medicaid State plan to require that the data for calculating cost-to-charge ratios be based on submitted cost reports instead of audited cost reports. STATE COMMENTS The State will begin using submitted cost reports to calculate its cost-to-charge ratios as of October 1, 2006. The State will amend its Medicaid State plan to reflect this change. The State’s complete response is included as Appendix C. OFFICE OF INSPECTOR GENERAL RESPONSE We agree with the State’s proposed changes and revisions.
ii

TABLE OF CONTENTS Page INTRODUCTION......................................................................................................................1 BACKGROUND ................................................................................................................1 Medicaid Program...............................................................................................1 Outlier Payments and the Prospective Payment System.....................................1 Potential Problems With the Cost-to-Charge Ratio ............................................1 Excessive Medicare Outlier Payments................................................................2 OBJECTIVE, SCOPE, AND METHODOLOGY..............................................................2 Objective .............................................................................................................2 Scope...................................................................................................................2 Methodology.......................................................................................................3 FINDINGS AND RECOMMENDATION...............................................................................4 STATE REQUIREMENTS ................................................................................................4 COST OUTLIER PAYMENTS NOT LIMITED TO HIGH-COST CASES.....................5
OUTDATED COST-TO-CHARGE RATIOS....................................................................5 EXCESSIVE OUTLIER PAYMENTS ..............................................................................6 RECOMMENDATION ......................................................................................................6 APPENDIXES A – COST OUTLIER PAYMENTS BY HOSPITAL B – COST AND CHARGE CHANGES AT THE SAMPLED HOSPITALS C – STATE’S RESPONSE TO DRAFT REPORT
iii

INTRODUCTION BACKGROUND Medicaid Program Title XIX of the Social Security Act established Medicaid in 1965 as a joint Federal and State program. Medicaid provides medical assistance to low-income persons who are age 65 or over, blind, or disabled; to members of families with dependent children; and to qualified children and pregnant women. Each State administers its Medicaid program in accordance with a State plan that the Centers for Medicare & Medicaid Services (CMS) approves. Within broad Federal rules, each State decides eligible groups, types and range of services, payment levels for services, and administrative and operating procedures. The Georgia Department of Community Health (the State agency) administers the State’s Medicaid program. Outlier Payments and the Prospective Payment System The State agency pays hospitals for Medicaid inpatient stays using a hybrid prospective payment system that includes a preestablished amount for each discharge based on a diagnosis-related group (DRG) code. Although a hospital’s costs can vary significantly among patients within a specific DRG, the DRG base payment is fixed. Congress established Medicare outlier payments for situations in which the cost of treating a Medicare patient is extraordinarily high in relation to the average cost of treating comparable conditions or illnesses. To compensate hospitals when they incur significantly high costs for Medicaid patients, the State agency similarly pays outlier payments to help defray these extra costs. The outlier policy promotes access to care for extremely costly patients who would otherwise be financially unattractive. Historically, the State agency used a formula similar to the Medicare formula to calculate Medicaid cost outlier payments. The formulas are similar in that both begin with a DRG payment, both have thresholds that must be met, and both allow outlier payments for high-cost cases. If the total cost for services rendered on a claim exceeds the threshold amount, the claim is eligible for an outlier payment. The Medicaid cost outlier payment is normally equal to 90 percent of the unreimbursed allowable costs after the base payment. The outlier determination depends on the cost of services. Because hospitals cannot calculate the exact cost for each admission, the State agency must convert billed charges to estimated costs using a predetermined cost-to-charge ratio to determine whether a claim qualifies as an extraordinarily high-cost case. The cost-to-charge ratio is calculated by dividing the hospital’s total costs by its total charges. Potential Problems With the Cost-to-Charge Ratio As long as hospital costs and charges change at roughly the same rate, estimating costs using the hospital-specific cost-to-charge ratio produces a reliable result. Over time, the cost-to-charge
1

ratio will reflect the changes in the costs and charges. However, when a hospital dramatically increases its charges relative to costs and the State agency does not routinely update the cost-to-charge ratio, the estimated costs may not reflect actual operating costs. Using a substantially inflated cost-to-charge ratio will yield higher outlier payments than would be appropriate because the outlier payments could be triggered by higher charges and not by higher costs. Nationally, hospitals have steadily increased charges in relation to costs since the mid-1980s. The increase in charges caused the average cost-to-charge ratio to decrease from approximately 80 percent to less than 50 percent of the difference between the total estimated cost for the stay and the DRG amount plus a hospital-specific threshold amount.1 In addition, CMS determined that hospital charges have been increasing faster than hospital costs.2
Excessive Medicare Outlier Payments In 2003, CMS modified the Medicare inpatient prospective payment system policy to correct a problem that resulted in excessive outlier payments. From 1998 to 2002, CMS reported that it paid approximately $9 billion more in outlier payments than intended because its outlier computation overestimated costs for hospitals that raised charges faster than costs. As a result, hospitals that dramatically increased their charges received outlier payments for cases with high charges rather than high costs. Upon discovering the vulnerabilities of the Medicare outlier policy, CMS revised the formula to use the cost-to-charge ratio from the latest cost reporting period, i.e., the most recently settled or tentatively settled cost report. Using the cost-to-charge ratios from tentatively settled cost reports reduces the time lag for updating the cost-to-charge ratio by a year or more. In addition, outlier payments are now subject to adjustment when the hospital’s cost report is settled and the actual cost-to-charge ratio is determined. This potential adjustment could ensure that the outlier payment appropriately reflects the hospital’s true costs of providing care. OBJECTIVE, SCOPE, AND METHODOLOGY Objective Our objective was to determine whether Georgia’s method of computing inpatient hospital cost outlier payments effectively limited outlier payments to high-cost cases. Scope This audit is one of a series of audits of State Medicaid agencies’ outlier payments.
1MedPac analysis of data from the American Hospital Association annual survey of hospitals from 1985 to 2001. 2CMS determined that hospital charges increased 7.63 percent and 10 percent in 2000 and 2001, respectively, and that these rates were higher than rates of hospital cost increases (Federal Register, volume 67, No. 148, page 50124, dated August 1, 2002).
2

We limited our review to the 93 Georgia hospitals that received cost outlier payments (see Appendix A). Our audit period covered outlier payments made from July 1998 through December 31, 2002. During this period, the State agency paid the 93 hospitals about $4.8 billion in DRG base payments and $245.9 million in cost outlier payments. We used hospital cost reports for fiscal years (FYs)1998 through 2003 and other statistical information from the State agency to identify trends in hospital charges, costs, and outlier payments. We judgmentally selected three hospitals for onsite reviews on the basis of high cost outlier payments, type of hospital, and percentage increase in cost outlier payments. We also selected two other hospitals that had similar attributes and requested certain information from the hospitals. We made no site visits to these two other hospitals. We did not perform a detailed review of State agency or provider internal controls because the audit objectives did not require us to do so. The State agency provided a report of the Medicaid outlier paid claims used in our review. The State agency extracted these paid-claims data from its files. To validate the accuracy of the data, we reconciled 90 electronic claims from the State agency to detailed claim documentation at the 3 hospitals that we visited. We performed the audit at the State agency in Atlanta, Georgia, and at three Georgia hospitals. Methodology We conducted interviews and reviewed documentation at the State agency to determine how the State agency calculated and monitored cost outlier payments. The State agency provided a list of hospitals receiving DRG base and cost outlier payments. We used this list to identify three hospitals that received a high percentage of, and showed high growth in, cost outlier payments. We also reviewed the meeting minutes of the hospitals’ boards of directors and interviewed department managers to determine how the hospitals set procedure charges. To quantify the effect of high charges on cost outlier payments at the three hospitals, we recalculated each outlier payment using the cost-to-charge ratio from the hospitals’ Medicaid “as submitted” cost reports. Specifically, we replaced the cost-to-charge ratio in the cost outlier formula with the cost-to-charge ratio from the cost report pertaining to the discharge date. For example, for a cost outlier payment with a discharge date of September 1, 2000, we recomputed the cost outlier payment using the cost-to-charge ratio from the hospital’s cost report period that included the date of discharge instead of the historical cost-to-charge ratio (from the 1994 cost report) that the State agency used. Because we intentionally selected 3 hospitals that received high levels of outlier payments, the potential cost savings that we computed for these hospitals may not be representative of the 90 other hospitals in our review. Therefore, we did not project or extrapolate our results to those hospitals. We performed our audit in accordance with generally accepted government auditing standards.
3

FINDINGS AND RECOMMENDATION Georgia’s method of computing inpatient cost outlier payments did not effectively limit outlier payments to high-cost cases. Instead of applying a current cost-to-charge ratio to current billed charges from July 1998 through December 2002, the State agency applied an outdated cost-to-charge ratio to current billed charges, thus increasing cost outlier payments. The calculation of inpatient cost outlier payments includes applying the cost-to-charge ratio to current billed charges. During the audit period, actual cost-to-charge ratios steadily declined as current billed charges increased, which should have resulted in lower outlier payments. However, except for making an adjustment in 2002, the State agency kept outlier payments artificially high by not updating cost-to-charge ratios at a pace commensurate with increasing hospital charges.
The State agency relied on historical cost-to-charge ratios because its State plan amendments (SPAs) required the use of audited cost report data to calculate cost-to-charge ratios. Audited cost reports typically run about 4 years behind the current year. Thus, the State agency relied on outdated cost-to-charge ratios in determining outlier payments. If the State agency continues to use outdated cost-to-charge ratios, it is likely that cost outlier payments will continue to increase as hospitals increase charges faster than costs. Had the State agency applied current cost-to-charge ratios to convert billed charges to costs, it could have saved approximately $22.7 million in cost outlier payments between 1998 and 2002 at the three hospitals reviewed. We believe that additional savings exist at other hospitals. STATE REQUIREMENTS State guidelines indicate that outlier payments are based on costs and are intended for high-cost cases:
• Georgia’s SPAs 98-09 and 02-008 include provisions for cost outlier reimbursements. The SPAs specify the cost report as the source of data used to calculate outliers.
• The Georgia Department of Community Health “Policies and Procedures for Hospital
Services Manual,” part II, section 1001.8, “Reimbursement for Outlier Cases,” states: “All outlier cases under the hybrid-DRG system are determined based on cost.”
• The manual (section 1001.8A) also states that high-cost DRGs will be reimbursed a
supplemental amount based on 90 percent of the cost differential between the DRG base rate and the actual cost of the case.
In addition, Georgia’s SPAs 98-09 and 02-008 both state that audited cost reports should be the data source for calculating prospective payment rates.
4

COST OUTLIER PAYMENTS NOT LIMITED TO HIGH-COST CASES Georgia did not effectively limit cost outlier payments to high-cost cases. The State applied a historical cost-to-charge ratio, which did not reflect recent increases in hospital charges, to current billed charges, thus increasing cost outlier payments. The State’s method allowed the three hospitals that we reviewed to increase their outlier payments through increases in charges rather than costs (see Appendix B). With only two exceptions, current cost-to-charge ratios at the three hospitals reviewed were lower than the historical ratios that the State used to determine outlier payments during our audit period. Table 1 compares the State’s historical ratios with the ratios that we calculated using current cost report data.
Table 1: Historical Ratios Versus Current Ratios
Hospital A Hospital B Hospital C
Year
Historical Ratio
Current Cost
Report Ratio
Historical Ratio
Current Cost
Report Ratio
Historical Ratio
Current Cost
Report Ratio
1999 54.0% 41.5% 52.8% 56.3% 51.2% 44.3% 2000 54.0% 24.3% 52.8% 50.0% 51.2% 38.5% 2001 54.0% 25.7% 52.8% 49.2% 51.2% 35.6% 2002 54.0% 17.9% 52.8% 50.7% 51.2% 36.9% 2003 48.5% 19.0% 56.7% 50.1% 44.9% 44.9%
As discussed later in this report, the use of historical cost-to-charge ratios resulted in significantly higher cost outlier payments than would have occurred if the State agency had used more current cost-to-charge ratios. OUTDATED COST-TO-CHARGE RATIOS The State agency relied on historical cost-to-charge ratios because its SPAs required the use of audited cost report data, which run about 4 years behind the current year, to calculate the ratios. Thus, the State agency relied on outdated cost-to-charge ratios in determining outlier payments. For example, in 1998, the State agency updated its cost-to-charge ratios based on 1994 cost reports. The State agency used the resulting 1994 cost-to-charge ratios to calculate outlier payments from 1998 through June 2002. Thus, 1994 data were in use for 48 months of our 54-month audit period (1998–2002). This reliance on outdated cost-to-charge ratios created a loophole for hospitals to exploit by increasing charges.
5

EXCESSIVE OUTLIER PAYMENTS The State agency’s cost outlier payments increased significantly without assurance that the payments were directed toward high-cost cases. The State agency’s methods allowed the three hospitals in our review to receive approximately $22.7 million in outlier payments that the hospitals would not have received had the State agency used current cost-to-charge ratios. Table 2 demonstrates the financial effect on the three hospitals after we revised the outlier payments to reflect updated cost-to-charge ratios.
Table 2: Financial Effect of Using Current Versus Historical Ratios
Provider
Total
Number of Outlier Claims
Claims
Ineligiblefor OutlierPayments
Claims Subject to Reduced Outlier
Payments
Total Reduction in Outlier Payments
Hospital A 354 245 109 $16,514,433 Hospital B 560 26 534 1,296,306 Hospital C 147 55 92 4,934,109
Total 1,061 326 735 $22,744,848 Had the State agency used a current cost-to-charge ratio for the three hospitals, their outlier payments would have been reduced. RECOMMENDATION We recommend that the State agency amend its Medicaid State plan to require that the data for calculating cost-to-charge ratios be based on submitted cost reports instead of audited cost reports. STATE COMMENTS The State is rebasing its Medicaid DRGs with an implementation date of October 1, 2006. As part of this rebasing, the State will use FY 2004 cost report data, which will be based on submitted cost reports, to calculate cost-to-charge ratios. The State will amend the Medicaid State plan to reflect this change. The State’s complete response is included as Appendix C. OFFICE OF INSPECTOR GENERAL RESPONSE We agree with the State’s proposed changes and revisions.
6

APPENDIXES

APPENDIX A Page 1 of 3
COST OUTLIER PAYMENTS BY HOSPITAL
July 1, 1998–December 31, 2002
Outlier Rank Total Base Payment1 Total Cost Outlier
Total Medicaid Reimbursement2
Cost Outlier in Relation to
Base Payment3 Type
1
$219,445 $76,037 $295,482 34.65% Urban 2 27,176,019 7,866,955 35,042,974 28.95% Urban 3 6,234,090 1,776,151 8,010,241 28.49% Urban 4 48,687,015 12,844,747 61,531,762 26.38% Urban 5 19,311,610 4,812,710 24,124,320 24.92% Urban 6 36,364,199 8,295,708 44,659,907 22.81% Urban 7 162,819,054 33,749,403 196,568,457 20.73% Urban
8 (Hospital A) 121,548,047 21,233,022 142,781,069 17.47% Urban 9 (Hospital B) 247,993,633 37,275,037 285,268,670 15.03% Urban
10 (Hospital C) 75,548,353 10,598,461 86,146,814 14.03% Urban 11 425,263 59,075 484,338 13.89% Urban 12 9,708,823 1,236,250 10,945,074 12.73% Urban 13 7,586,505 869,110 8,455,614 11.46% Urban 14 10,240,016 976,378 11,216,394 9.53% Urban 15 15,815,945 1,385,030 17,200,975 8.76% Urban 16 55,319,922 4,740,990 60,060,912 8.57% Urban 17 17,612,958 1,496,455 19,109,413 8.50% Urban 18 19,950,988 1,630,702 21,581,690 8.17% Urban 19 7,542,791 529,072 8,071,864 7.01% Urban 20 1,997,423 137,982 2,135,405 6.91% Urban 21 3,932,039 247,896 4,179,935 6.30% Urban 22 10,435,822 649,179 11,085,001 6.22% Urban 23 311,911,992 16,001,920 327,913,912 5.13% Urban 24 103,230,285 5,226,100 108,456,385 5.06% Urban 25 1,994,292 100,128 2,094,420 5.02% Urban 26 78,801,902 3,638,034 82,439,936 4.62% Urban 27 239,811,644 10,690,475 250,502,119 4.46% Urban 28 134,296,892 5,576,035 139,872,927 4.15% Urban 29 37,780,206 1,549,890 39,330,097 4.10% Rural 30 6,927,596 268,395 7,195,990 3.87% Urban 31 13,816,463 528,575 14,345,038 3.83% Urban 32 95,367,026 3,515,373 98,882,400 3.69% Urban 33 15,971,886 524,991 16,496,877 3.29% Urban
1The total base payment includes regular Medicaid claims and disproportionate share hospital payments.
2Total Medicaid reimbursement equals total base payments plus outlier payments.
3The cost outlier in relation to base payment equals the total cost outlier divided by total Medicaid reimbursement.

APPENDIX A Page 2 of 3
Outlier Rank Total Base Payment1 Total Cost Outlier
Total Medicaid Reimbursement2
Cost Outlier in Relation to
Base Payment3 Type
34 12,995,814 425,508 13,421,322 3.27% Urban 35 10,939,519 336,728 11,276,248 3.08% Rural 36 25,214,360 771,667 25,986,028 3.06% Urban 37 51,123,435 1,412,543 52,535,978 2.76% Urban 38 $18,219,754 $492,631 $18,712,385 2.70% Urban 39 210,207,508 5,598,670 215,806,178 2.66% Urban 40 23,952,170 635,473 24,587,643 2.65% Urban 41 10,308,363 273,008 10,581,372 2.65% Urban 42 16,149,409 403,306 16,552,715 2.50% Urban 43 25,870,219 630,888 26,501,106 2.44% Urban 44 2,634,189 58,243 2,692,432 2.21% Urban 45 67,723,923 1,419,474 69,143,397 2.10% Urban 46 830,607,087 16,802,647 847,409,735 2.02% Urban 47 10,888,457 219,879 11,108,336 2.02% Urban 48 74,880,650 1,507,725 76,388,375 2.01% Rural 49 46,550,541 903,718 47,454,259 1.94% Urban 50 5,380,820 103,030 5,483,850 1.91% Urban 51 23,256,130 443,703 23,699,833 1.91% Urban 52 36,332,561 678,518 37,011,079 1.87% Urban 53 12,709,730 226,969 12,936,699 1.79% Urban 54 91,361,558 1,555,402 92,916,960 1.70% Urban 55 60,746,976 1,008,054 61,755,030 1.66% Urban 56 17,254,099 272,192 17,526,290 1.58% Urban 57 133,921,435 2,103,610 136,025,045 1.57% Urban 58 6,441,156 98,977 6,540,132 1.54% Urban 59 2,447,996 35,416 2,483,413 1.45% Rural 60 2,394,721 34,355 2,429,076 1.43% Urban 61 63,439,003 884,019 64,323,022 1.39% Urban 62 25,422,360 334,952 25,757,312 1.32% Urban 63 94,508,692 1,180,586 95,689,278 1.25% Urban 64 38,345,243 470,177 38,815,420 1.23% Rural 65 42,631,673 513,090 43,144,763 1.20% Urban 66 52,632,041 592,687 53,224,728 1.13% Urban 67 22,644,470 253,815 22,898,285 1.12% Urban 68 5,104,185 50,927 5,155,112 1.00% Urban 69 2,387,184 23,368 2,410,552 0.98% Urban 70 3,097,192 29,398 3,126,590 0.95% Rural 71 37,505,204 336,728 37,841,932 0.90% Rural 72 3,183,186 27,268 3,210,453 0.86% Urban 73 25,582,690 203,769 25,786,459 0.80% Urban

APPENDIX A Page 3 of 3
Outlier Rank Total Base Payment1
Total Cost Outlier
Total Medicaid Reimbursement2
Cost Outlier in Relation to
Base Payment3 Type
74 $18,843,695 $148,516 $18,992,211 0.79% Urban 75 16,472,403 126,545 16,598,947 0.77% Rural 76 11,046,357 83,685 11,130,043 0.76% Urban 77 63,063,000 469,997 63,532,997 0.75% Rural 78 32,973,431 185,092 33,158,523 0.56% Rural 79 17,242,347 80,291 17,322,639 0.47% Urban 80 4,969,491 21,433 4,990,924 0.43% Rural 81 9,526,711 30,242 9,556,953 0.32% Rural 82 33,891,245 104,421 33,995,665 0.31% Rural 83 11,563,580 33,583 11,597,163 0.29% Rural 84 13,656,752 38,156 13,694,909 0.28% Rural 85 29,962,774 75,776 30,038,550 0.25% Rural 86 41,486,106 100,714 41,586,820 0.24% Rural 87 25,926,995 61,383 25,988,378 0.24% Rural 88 7,214,095 16,816 7,230,911 0.23% Rural 89 21,462,988 46,570 21,509,558 0.22% Urban 90 13,565,862 25,636 13,591,498 0.19% Rural 91 106,750,542 184,338 106,934,880 0.17% Urban 92 33,978,313 53,587 34,031,900 0.16% Rural 93 41,689,947 41,978 41,731,925 0.10% Urban
Total $4,813,396,884 $245,856,545 $5,059,253,429 5.11%

APPENDIX B Page 1 of 2
COST AND CHARGE CHANGES AT THE SAMPLED HOSPITALS
We used the hospitals’ fiscal year 1998 cost report data as a constant base year in this analysis. The percent of change each year is in relation to the 1998 data.
Hospital A Cost and Charge Changes
-50%0%
50%100%150%200%250%
Percent Percent Percent Percent Percent
Change Change Change Change Change
1999 2000 2001 2002 2003
Hospital Cost
Hospital Charge
Hospital BCost and Charge Changes
0%20%40%60%80%
100%
Percent Percent Percent Percent Percent
Change Change Change Change Change
1999 2000 2001 2002 2003
Hospital Cost
Hospital Charge

APPENDIX B Page 2 of 2
COST AND CHARGE CHANGES AT THE SAMPLED HOSPITALS
Hospital CCost and Charge Changes
0%50%
100%150%200%
Percent Percent Percent Percent Percent
Change Change Change Change Change
1999 2000 2001 2002 2003
Hospital Cost
Hospital Charge
APPENDIX C