DEPARTMENT OF ENVIRONMENTAL AFFAIRS annual rEpOrT|2015… · 1 DEPARTMENT OF ENVIRONMENTAL AFFAIRS...
244
DEPARTMENT OF ENVIRONMENTAL AFFAIRS ANNUAL REPORT|2015/16 VOTE 27
Transcript of DEPARTMENT OF ENVIRONMENTAL AFFAIRS annual rEpOrT|2015… · 1 DEPARTMENT OF ENVIRONMENTAL AFFAIRS...

DEPARTMENT OF ENVIRONMENTAL AFFAIRS
annual rEpOrT|2015/16
VOTE 27


DEPARTMENT OF ENVIRONMENTAL AFFAIRS
Annual Report 2015/16

First publication in 2013 by the Department of Environmental Affairs (DEA) Copyright © 2015 DEA
Design and layout by Department of Environment Affairs Chief Directorate Communication Private Bag X447, Pretoria 0001 South Africa

TablE Of COnTEnTs 1
fOrEwOrd by MinisTEr ..................................................................................................................................................................................................................................................... 1
sTaTEMEnT by dEpuTy MinisTEr ....................................................................................................................................................................................................................................... 3
rEpOrT Of ThE aCCOunTing OffiCEr ........................................................................................................................................................................................................................... 5
EnTiTiEs rEpOrTing TO ThE MinisTEr ............................................................................................................................................................................................................................. 17
parT b pErfOrManCE infOrMaTiOn 24
sTraTEgiC ObjECTiVEs, pErfOrManCE indiCaTOrs, plannEd TargETs and aCTual aChiEVEMEnTs ............................................................................................................ 25
linking pErfOrManCE wiTh budgETs ........................................................................................................................................................................................................................ 81
parT C gOVErnanCE 98
risk ManagEMEnT ......................................................................................................................................................................................................................................................... 94
rEpOrT Of ThE audiT and risk COMMiTTEE ...................................................................................................................................................................................................................97
parT d huMan rEsOurCE OVErsighT rEpOrT 106
huMan rEsOurCEs OVErsighT sTaTisTiCs .................................................................................................................................................................................................................102
parT E finanCial infOrMaTiOn 136
rEpOrT Of ThE audiTOr-gEnEral ...............................................................................................................................................................................................................................142
annual finanCial sTaTEMEnTs ..................................................................................................................................................................................................................................145

parT a gEnEral infOrMaTiOnPART A: GENERAL INFORMATION

physiCal addrEss:Department of Environmental Affairs473 Steve BikoArcadiaPretoria 0083
pOsTal addrEss:Private Bag X447Pretoria0001
South Africa
TElEphOnE nuMbErs:Tel: +27 12 399 9000
Call Centre: +27 86 111 2468
Fax +27 12 359 3625
EMail addrEss:[email protected]
wEbsiTE addrEss:
www.environment.gov.za
1. dEparTMEnT’s gEnEral infOrMaTiOn

lisT Of aCrOnyMsAEL Air Emission Licence AEWA African-Eurasian Migratory Waterbird AgreementAG Auditor-General AGSA Auditor-General of South Africa AIS Alien Invasive Species AQA Air Quality Act AQM Air Quality Management AQMP Air Quality and Management Planning BABS Bioprospecting, Access and Benefit Sharing BEE Black Economic Empowerment BBBEE Broad Based Black Economic Empowerment BMP Biodiversity Management Plan BRICS Brazil, Russia, India, China and South Africa CC Climate Change CFO Chief Financial Officer CITES Convention on International Trade in Endangered Species of Wild
Fauna and Flora.CMP Conference of the Members of Protocol CO2 Carbon Dioxide COP Congress of the Parties. CPO Chief Procurement OfficerCSIR Council for Scientific and Industrial Research DAFF Department of Agriculture Forestry and Fisheries DBC Departmental Bargaining Council DBSA Development Bank of Southern Africa DEA Department of Environmental Affairs DLDD Desertification Land Degradation and Drought DPSA Department of Public Service and Administration
lisT Of aCrOnyMsDST Department of Science & Technology DWA Department of Water Affairs DAFF Department of Agriculture Forestry and Fisheries EEZ Exclusive Economic Zone Information SystemEDMS Electronic Document Management System EIA Environmental Impact Assessment EMF Environmental Management Framework EMI Environmental Management Inspectors EPWP Expanded Public Works Programme FTE Full Time Equivalent GEF Global Environment Facility GHG Green House Gas GIS Geographical Information System GMO Genetically Modified Organisms HOD Head of Department HR Human Resources HRD Human Resources Development ICT Information and Communication Technologies IDP Integrated Development Plan IBSA India Brazil South Africa ICM Integrated Coastal Management ICT Information and Communication Technologies IDP Integrated Development Plan IEG International Environmental Governance IEM Integrated Environmental Management IGC Intergovernmental Committee IGCCC Intergovernmental Committee on Climate Change IPCC Intergovernmental Panel on Climate Change
2. lisT Of abbrEViaTiOns/aCrOnyMs (COnTinuEd)

lisT Of aCrOnyMsIRP Integrated Resource Plan IWMP Industry Waste Management Plans KZN KwaZulu Natal M&E Monitoring and EvaluationMCS Modified Cash StandardsMEC Member of the Executive CouncilMETT Management Effectiveness Tracking ToolMINMEC Minister and Members of Executive CouncilMoU Memorandum of UnderstandingMPA Marine Protected AreaMPRDA Mineral and Petroleum Resources Development ActMRV Monitoring, Reporting and VerificationMSP Master Systems PlanMTSF Medium Term Strategic FrameworkNCMP National Coastal Management ProgrammeNEMA National Environmental Management ActNPA National Prosecuting AuthorityNSSD National Strategy for Sustainable DevelopmentOHS Occupational Health and SafetyOAG Office of the Accountant-GeneralPAIA Promotion of Access to Information ActPFMA Public Finance Management ActPMDS Performance Management Development SystemPPP Public Private PartnershipSA South AfricaSAAQIS South African Air Quality Information SystemSAEO South Africa Environment OutlookSAEON South African Environmental Observation Network
lisT Of aCrOnyMsSANBI South African National Biodiversity InstituteSASSETA Safety and Security Sector Education and Training AuthoritySAWS South African Weather ServicesSCM Supply Chain ManagementSDIP Service Delivery Improvement PlanSETA Sector Education and Training AuthorityTOR Terms of ReferenceUNCCD United Nations Convention to Combat DesertificationUNFCCC United Nations Framework Convention on Climate ChangeWEF World Economic ForumWHC World Heritage ConventionWSP Workplace Skills Plan
2. lisT Of abbrEViaTiOns/aCrOnyMs (COnTinuEd)

DEPARTMENT OF ENVIRONMENTAL AFFAIRS ANNUAL REPORT 2015/161
3. fOrEwOrd by ThE MinisTEr
It is with great pleasure and accomplishment that we submit the 2015/16 Annual Report of the Department of Environmental Affairs.
The report, presented to Parliament, outlines the achievements of the Department in the financial year 2015/16, in tandem with our constitutional mandate – to ensure the right to an environment that is not harmful to the health and well-being of South Africans and all those who live in our country.
The 2015/16 financial year has been remarkable for the Department, and South Africa, on a number of fronts.
Not least the leadership role played by South Africa in reaching a legally binding climate change agreement at the 21st Conference of the Parties to the United Nations Framework Convention on Climate Change (UNFCC) in Paris in December 2015.
The agreement is the culmination of a four-year negotiation process that was initiated in Durban in 2011 at the 17th Conference of the Parties to the UNFCCC. The conclusion to the Durban Mandate, which was to develop a protocol, legal instrument or an agreed outcome with legal force, under the Convention, by no later than 2015, will see the new agreement come into effect from 2020.
In preparation for the international climate change talks, all Parties to the UNFCCC were required to submit Intended Nationally Determined Contributions (INDCs) to the UNFCCC Secretariat, to show what is being done to address climate change. South Africa’s INDC, submitted to the UNFCCC in September 2015, encompasses three distinct components namely mitigation, adaptation and the means of implementation.
Representing South Africa, in April 2016 we joined leaders from across the globe in signing the Paris Agreement at the United Nations in New York. South Africa is committed to ensuring that we continue to play a positive role in the building of a low-carbon, job-creating and pro-development green economy.
Protecting the environment, while ensuring that all people benefit from available natural resources through the implementation of sustainable development policies, is a priority for the Department and the Government of South Africa. This is the reason why the implementation of our Climate Change Response Policy is being accelerated. This has seen the development of the first phase of Desired Emission Reduction Objectives (DERO’s) and the introduction of the Carbon Budget system, which is being introduced over five years until 2020. Our own biodiversity research organisation, the South African National Biodiversity Institute, has been appointed as the National Implementing Entity (NIE) of the Global Adaptation Fund. Examples of projects launched in the past year include the Greater uMgeni Catchment area in KwaZulu Natal, the Mopani District in Limpopo, and the Namaqua District in Northern Cape. These projects, valued at $10 million, include the enhancement of early warning systems, protecting local communities from extreme weather events, and promoting climate smart agricultural practices.
Through our Green Economy strategy we have continued to work towards promoting equitable, inclusive, sustained and environmentally sound economic growth and social development.
In line with the Integrated Resource Plan, we aim to have reduced our energy demand significantly by 2030 through technological innovation, good behavioural practice and a public commitment to more efficient, sustainable and equitable energy use.
This includes the development of an efficient, lower-carbon public transport system that makes everyday use of private vehicles an unnecessary extravagance.
The development and growth of the Oceans Economy programme through Operation Phakisa is gaining traction. Investments are being made in manufacturing facilities that will facilitate boatbuilding and the oil and gas exploration sector. In the aquaculture sector more than R400 million worth of investments have been committed across 10 aquaculture farms which are already in production. Through Operation Phakisa, the government envisages that oceans of South Africa can move from a R54 billion contribution to GDP with 316 000 jobs in 2010, to R177 billion and 1 million jobs in the foreseeable future.

2
Advances in the past year also include Norms and Standards for coast management setback lines being developed, a National Framework on Marine Spatial Planning approved, and 22 additional Marine Protected Areas declared. We welcome this significant progress recorded in these areas of our work-programme. We are a nation at work for the betterment of our people’s economy and the improvement of our environment.
Our success in our environment programme, have also seen our rhino population increase over the years. Our successful conservation track record, seem to have attracted our poachers to our shores. Our country continues to be a target for poachers and smugglers who have set their sights on our rhino, elephant, cycad and numerous other species. Rhino poaching continues to be addressed by the Government in a multi-pronged and multi-sectoral manner through the Cabinet-approved Integrated Strategic Management Approach for Rhinoceros in South Africa. The interventions are slowly starting to yield successes, most notably a decrease in the number of rhino poached in South Africa in 2015 and the first quarter of 2016, alongside an increase in the number of poachers arrested and convicted.
The Committee of Inquiry into the feasibility, or not, of a legal rhino horn trade, completed its work during 2015 and reported to the Inter-Ministerial Committee, which submitted a number of recommendations to Cabinet at the start of the 2016/17 financial year.
The Committee’s work was directed at determining, amongst others, whether South Africa should table a proposal to the 17th Conference of the Parties to the Convention on the International Trade in Endangered Species of Wild Fauna and Flora (CITES) in Johannesburg in 2016.
Preparatory work for the CITES COP17 got underway in the year under review. The international Convention is an opportunity for South Africa to showcase its successful achievements in conservation.
Ensuring compliance with national environmental legislation, including environmental impact, air quality measures, waste management and environmental crimes such as
poaching, is an important part of the Department’s work. In the year under review 630 officials were trained in environmental compliance and enforcement, while 19 operations were conducted. A total of 245 environmental administrative enforcement actions were issued, and 31 cases were finalised and dockets handed to the National Prosecuting Authority of South Africa.
I am pleased to present the 2015/16 report which complies with all statutory reporting requirements, particularly section 40(1) of the Public Finance Management Act (PFMA), 1999, and paragraph 18 of the National Treasury Regulations.
Ms Edna MOlEwa, Mp
MinisTEr Of EnVirOnMEnTal affairs

DEPARTMENT OF ENVIRONMENTAL AFFAIRS ANNUAL REPORT 2015/163
4. sTaTEMEnT by ThE dEpuTy MinisTEr
The South African Constitution requires that the Department of Environmental Affairs ensures the right to an environment that is not harmful to the health and well-being of our people. These measures should prevent ecological degradation, promote conservation and secure ecologically sustainable development and use of natural resources, while promoting justifiable economic and social development. This constitutional provision therefore underscores the need for balancing economic and other development goals with environmental sustainability. This approach has further been translated into our subsequent legislation which we have since promulgated.
Through the implementation of the 17 Strategic Development Goals and South Africa’s National Development Plan Agenda 2030 we aim to address the triple challenges of poverty, unemployment and inequality over the next 15 years.
Efforts to facilitate the transition to a green economy, have resulted in the approval of 53 projects by the
National Green Fund, resulting in approximately 8 124 job opportunities being created and at least 6 300 individuals being trained since 2013.
Green Fund interventions have realised some 30 000 hectares converted to conservation land-use, benefiting landowners within the wildlife economy.
Through the Expanded Public Works Programme (EPWP), we have launched programmes via the Department’s 14 Working For programmes to contribute to land and ecosystem restoration and water resource management. Besides Working on Fire, the Working for Water, Working for We Hands, Working for Coasts and the People and Parks programme have contributed to sustainable rural development and job creation while also contributing to our ability to adapt to climate change.
Through the Department’s Environmental Programmes more than 28 000 full-time equivalent jobs have been created, with 1 020 young people benefiting from the Youth Environmental Services.
The waste sector is a segment of our economy that has the potential to become one of the largest small and medium enterprise growth areas in our country, not only through the creation of businesses and jobs, but also through its contribution to a cleaner, greener and healthier society.
This area has been globally identified as one of the critical sectors with the potential to contribute substantially to the generation of jobs within the green economy. It has a total estimated value of R25 billion.
Reducing, recovering or minimising waste provides opportunities for socio-economic development; new jobs and businesses; maximising resource recovery for downstream manufacturing growth and reducing reliance on declining natural resources.
The development of the recycling economy is promoted through the Waste Management Act and the National Environmental Management: Waste Amendment Act (NEMWAA). The NEMWAA provides for a National Pricing Strategy for waste management charges, the creation of the Waste Management Bureau to oversee the implementation of Industry Waste Management Plans (lndWMPs), including the management and the disbursement of revenue collected from waste management charges.
In the past year the Hazardous Waste Roadmap which deals with the import, storage, treatment and disposal of hazardous waste, including medical waste, was finalised. The first Section 28 Notice of Intention was published in July 2015 calling for the electronic waste, Paper and Packaging and Lighting Industry Waste Management Plans. In addition, a tyre levy has been introduced and is being implemented by the National Treasury through the Customs and Excise Act.
This past year the Department hosted the 10th Annual Air Quality Governance Lekgotla where the South African Atmospheric Emission Licensing and Inventory Portal (SAAELIP)

4
was launched. This portal comprises the System for National Atmospheric Emission Licensing (SNAEL) and the National Atmospheric Emission Inventory System (NAEIS) which are aimed at propelling transparent air quality governance and improved service delivery.
The systems are a part of Government’s objectives outlined in the National Environmental Management: Air Quality Act, and further the Department’s goal of putting into place systems and tools for effective and efficient air quality management. The number of government-owned monitoring stations to send data to the South African Air Quality Information System, managed by the South African Weather Services, increased to 116. An additional 29 stations are owned by industry.
In the field of Biodiversity Conservation, the Department hosted the Second Biodiversity Economy lndaba in Durban where stakeholders committed to greater inclusivity in the wildlife and bioprospecting sectors, as well as the equitable sharing of benefits between the private sector and communities.
The lndaba sought to promote the sustainable use of biological resources and how it could promote socio-economic and livelihood support, whilst these activities increase awareness and allocate resources integral for sustainable use of the biodiversity.
Discussions were informed by the National Biodiversity Economy Strategy (NBES). This 14-year Strategy is the Government’s blueprint for sustaining the growth of the wildlife and bioprospecting industries by providing a basis for addressing constraints for growth in the sector; outlining stakeholder responsibilities; and monitoring progress with regard to Transformative Enabling Interventions.
A Market-Sizing Report and the Scoping Report on Biodiversity Mainstreaming in Business were also launched at the lndaba.
Key findings of the Bioprospecting and Biotrade Market-Sizing in South Africa were that the potential market size of the bioprospecting industry up until 2012, was at least R2.5 million per year. This means that the industry has reached only about 20% of its potential.
As a means of promoting a sense of guardianship of wildlife within communities, four dehorned rhinos were also handed over to the Senzo’kuhle Nkos’uNodada Community Trust at a ceremony held in Nambiti Private Game Reserve near Ladysmith in KwaZulu-Natal on 05 November 2015. The donation was facilitated by the National Department of Environmental Affairs and the KwaZulu-Natal Department of Economic Development, Tourism and Environmental Affairs. The rhinos were donated by Ezemvelo KZN Wildilfe.
The game reserve is owned by the Community Trust established after the community won a land claim. The donation of the 4 dehorned rhinos by Ezemvelo KZN Wildlife is an acknowledgement of the role that communities play in conservation and sustainable use of the country’s biodiversity. It is also an encouragement to communities to take the lead in conserving a key member of the Big Five amid high levels of rhino poaching.
Twenty-two individuals received bioprospecting permits and a payment of R2.6 million was made to two communities from Lephalale in Limpopo by the Council for Scientific and Industrial Research (CSIR) for the development of a non-carbohydrate sweetener derived from an indigenous plant called Molomo Monate.
I am pleased to present the 2015/16 Annual Report.
barbara ThOMsOn, Mp
dEpuTy MinisTEr Of EnVirOnMEnTal affairs

DEPARTMENT OF ENVIRONMENTAL AFFAIRS ANNUAL REPORT 2015/165
5. rEpOrT Of ThE aCCOunTing OffiCEr
OVErViEw Of ThE OpEraTiOns Of ThE dEparTMEnT The legal mandate and core business of the Department of Environmental Affairs is to manage, protect and conserve South Africa’s environment and natural resources. The mandate is informed by Section 24 of the Constitution of South Africa, which affords everyone the right to (a) an environment that is not harmful to their health or well-being; and (b) to have the environment protected, for the benefit of present and future generations, through reasonable legislative and other measures.
To give effect to these constitutional environmental rights and the need for sound environmental management and sustainable development, the Department has over a period of time developed a comprehensive legislative/regulatory framework. This regulatory framework consists of acts of parliament (environmental laws), regulations, policies, norms and standards and other regulatory tools which are aimed at promoting sound environmental management practices in order to protect and conserve the environment for the benefit of current and future generations. In addition to the development, implementation and on-going review of a progressive regulatory framework for sound environmental management, other critical environmental management interventions by the Department includes raising awareness on key environment issues and promoting a culture of environmental activism among ordinary citizens, building capacity within the sector and establishing and strengthening national, regional and global partnerships to address common environmental challenges.
The long term vision of the Department is to have “a prosperous and equitable society living in harmony with our natural resources” as outlined in our medium term strategic plan. To support the achievement of this vision, the Department has identified five strategic oriented goals, namely:
• Environmental economic contribution optimised;
• Environmental/ ecological integrity safeguarded and enhanced;
• Social transformation within our communities;
• Global agenda influenced and obligations met; and
• A capable and efficient Department.
The Department is structured into seven programmes as outlined in the performance progress included in Part B of this annual report. The seven different programmes and their purposes are reflective of the different areas and subsectors of environment management and the objective is to ensure that specific attention is given to each area of our mandate whilst acknowledging the interrelationship and ensuring an integrated approach.
Overview of the Results, Challenges and significant projects/events for the yearIn the financial year under review, the Department made commitments towards 171 annual targets across its seven programmes as outlined in the approved Annual Performance Plan. The planned targets for the year reflected the level of progress we needed to achieve as we work towards our medium terms goals set out in the five year strategy of the Department for the MTSF period ending in 2019/20. At the end of the financial year, a significant progress in achieving the planned targets for the year was made. A total of 139 out of the 171 annual targets were achieved as planned (58 of these were exceeded). This translated into 81% (139/171) overall achievement on our predetermined objectives for the year. The remaining 32 out of the 171 planned annual targets were not achieved due to a number of different challenges as outlined in the report. In 32 missed performance areas, 29 planned annual targets were partially achieved as some notable progress was made even though the planned output were not fully met. There was a significant delay on progress in relation to the other three (3) remaining annual targets. Notwithstanding the delays with regard to the other predetermined objectives as outlined, Management is however still satisfied with the overall performance of the Department for the year under review.

6
In each area where the annual targets have not been achieved as planned, the specific challenges linked to that area of work have been highlighted in the detailed progress report, including an outline of the interventions and corrective steps that Management will undertake in the 2016/17 financial year to deal with these challenges. In general, Management has also taken note of the broader on-going impact which the current economic climate is having on the operations of the Department. The current economic challenges continues to have an effect on allocation of financial resources. This has an impact on internal organisational capacity and service delivery. In light of this economic challenges the Department will keep on finding ways to be more innovative and economical in utilising available capacity and do more with existing resources.
The detailed achievements against planned targets for the year are contained in the detailed audited report in Part B of this annual report (page 18 to 76), with specific challenges and corrective measures where planned targets have not been met.
The significant project(s) and/or event(s) for the year are as follows: The Department hosted the following national events to celebrate/commemorate key international environment days to raise environmental awareness and engage stakeholders within the environment sector.
Celebration of international environment days:
wOrld EnVirOnMEnT dayAs part of the Environment Month calendar of events, the Department hosted and celebrated the 2015 World Environment Day in Kimberley, Northern Cape. The Department of Environmental Affairs partnered with the Northern Cape Province to celebrate the day – marked annually on June 05 – under the theme ‘’Seven Billion Dreams. One Planet. Consume with Care.’’ The theme, which was declared by the United Nations Environment Programme (UNEP), centred on the well-being of humanity, the environment, and the functioning of the economy, which ultimately depend upon the responsible management of the planet’s natural resources. World Environment
Day was established in 1972 by the United Nations General Assembly at the Stockholm Conference on Human Environment to present an opportunity for everyone to realise their responsibility to become agents of change. The day is to create, educate and raise awareness on environmental conservation.
wOrld OCEans dayThe 2015/16 World Oceans Day event was held on 08 June 2015 in Port Elizabeth, Eastern Cape. The purpose of this event is to raise awareness about the significance of the marine environment and to also promote the role of the oceans and the importance of conserving and protecting the marine environment. World Oceans Day (WOD) was celebrated under the UNEP’s theme: “Healthy Oceans, Healthy Planet”. The Department of Environmental Affairs has strategically customised the theme to “Healthy Oceans, Healthy Planet: Enabling Sustainable Ocean Economy Development,” as a way to highlight Government’s commitment to sustainable ocean economy through Operation Phakisa.
wOrld day TO COMbaT dEsErTifiCaTiOn (wdCd)On 17 June 2016, South Africa joined other nations around the world in celebrating the World Day to Combat Desertification under the theme “Inclusive cooperation for achieving Land Degradation Neutrality”. The slogan for the Day, “Protect Earth. Restore Land. Engage People” addresses the importance of comprehensive participation and cooperation in working towards achieving land degradation neutrality.
MarinE wEEkOn the 5th October 2015, South Africa launched the celebration of the Marine Week in Polokwane, Limpopo Province. It was the first time the celebration was taken to an inland location with the objective to create awareness of the oceans and coastal environment in order to promote sustainable use and conservation for the benefit of present and future generations. The campaign was celebrated under the theme: “Oceans 70/20: Decoding Mysteries, Maximising Opportunities.” Oceans are often mysterious, unexplored and full of wonder.

DEPARTMENT OF ENVIRONMENTAL AFFAIRS ANNUAL REPORT 2015/167
Hosting of strategic multi stakeholder consultation/engagement platforms: annual air QualiTy lEkgOTlaThe tenth Annual Air Quality Governance Lekgotla was hosted in Bloemfontein. During the opening session of the Lekgotla, the 2015 State of Air Report and National Air Quality Indicator was tabled.
The 2015 Lekgotla was hosted under theme “Launching the Air Quality Management Systems for Transparent Governance and Improved Service Delivery.” The Lekgotla brought together at least 350 Air quality officials from all three spheres of government, to deliberate on various pertinent issues such as Air Quality Management Planning Tools, Ambient Air Quality Monitoring as well as Compliance Monitoring and Enforcement. The platform created an opportunity for Government officials to interact and strengthen regulatory tools towards improved air quality management.
ChEMiCals ManagEMEnT and land rEMEdiaTiOn suMMiTIn October 2015, the Department hosted a Chemicals Management and Land Remediation Summit that has facilitated a national dialogue with regards to the management of chemicals and remediation of contaminated land to ensure sustainable management of environmental resources. The gathering further assisted industries in their responsibilities regarding chemicals management and contamination of land by sharing information, forming partnerships, drafting and enforcing relevant legislation to manage industry.
The Summit brought together the combined knowledge of academics, government professionals, consultants, industries and technology developers/experts, and provides a thematic network on interdisciplinary research, integrating technological, societal and economical aspects for the management of chemicals and remediation of contaminated land in South Africa.
OVErViEw Of ThE finanCial rEsulTs Of ThE dEparTMEnT
Department receipts
dEparTMEnTal rECEipTs
2015/16 2014/15EsTiMaTE aCTual aMOunT
COllECTEd(OVEr)/undEr COllECTiOn
EsTiMaTE aCTual aMOunT COllECTEd (OVEr)/undEr COllECTiOn
r’000 r’000 r’000 r’000 r’000 r’000Sale of goods and services other than capital assets
3 775 3 790 (15) 1 442 3 793 (2 351)
Fines, penalties and forfeits 1 400 2 080 (680) 5 000 1 742 3 258
Interest, dividends and rent on land 80 124 (44) 140 98 42
Sale of capital assets 300 114 186 1 500 1 443 57
Financial transactions in assets and liabilities 21 199 5 378 15 821 18 250 24 946 (6 696)
TOTal 26 754 11 486 15 268 26 332 32 022 (5 690)
Fines, penalties and forfeits includes Domestic Fines amounting to R1, 3 m from Dube Trade port for unlawful construction and development without prior Environmental authorisation.
Sale of goods and services other than capital assets includes establishment of Environmental and Waste Management Authorisation licence fees amounting to R1,8m

8
Tariff pOliCy
Control of vehicles in the coastal zoneThe Regulations in accordance with the National Environmental Management Act, 1998 (Act No.7 of 1998) made provision for the applicable permit processing fees.
Threatened or Protected SpeciesThe Regulations in accordance with the National Environmental Management: Biodiversity Act, 2004 (Act No.10 of 2004) made provision for the applicable permit processing fees.
Oceans and Coastal Environmental ManagementThe Department issued permits in respect of the control of vehicles in the coastal zone, dumping at sea, recreational scuba diving, filming of protected species, boat based whale watching operations and white shark cage diving operations under the following regulations and Acts: the Control of Vehicles in the coastal zone regulations under the National Environmental Management Act, 1988 (Act No. 107 of 1988); the Dumping at Sea Control Act, 1980 (Act No. 73 of 1980) and the Marine Living Resources Act, 1998 (Act No. 18 of 1988). These fees were gazetted in terms of the various Acts.
prOgraMME ExpEndiTurE
prOgraMME naME
2015/16 2014/15final apprOpriaTiOn aCTual ExpEndiTurE (OVEr)/undEr
ExpEndiTurEfinal apprOpriaTiOn aCTual ExpEndiTurE (OVEr)/undEr
ExpEndiTurE r’000 r’000 r’000 r’000 r’000 r’000
Administration 832 487 832 487 - 731 335 731 335 -
Legal, Authorisation and Compliance 131 717 131 417 300 102 123 100 621 1 502
Oceans and Coasts 372 021 368 659 3 362 349 257 349 257 -
Climate Change and Air Quality 246 114 246 114 - 229 292 229 292 -
Biodiversity and Conservation 700 648 699 863 785 643 068 643 068 -
Environmental Programmes 3 580 570 3 579 640 930 3 553 433 3 549 608 3 825
Chemicals and Waste Management 79 740 79 740 - 71 878 71 878 -
TOTal 5 943 297 5 937 920 5 377 5 680 386 5 675 059 5 327
The Department spent R5 937 920 000 of the total allocation of R5 943 297 000 which presents a 99.9% total spending. The 0.1% not spent during the 2015/16 financial year is mainly due to the following:
• Compensation of Employees funds not spent due to posts filled later than anticipated.
• Projects that progressed slower than anticipated.

DEPARTMENT OF ENVIRONMENTAL AFFAIRS ANNUAL REPORT 2015/169
VirEMEnTs
prOgraMME frOM prOgraMME TO aMOunT r’000 % VirEMEnT rEasOn fOr VirEMEnT1 Administration 6 Environmental Programmes 22 838 2.6% Funding Expanded Public
Works Programme projects. Correcting allocations reprioritised under the Adjusted Estimates back to Pogramme 6 to fund commitments of EPWP projects for the 2015/16 financial year
3 Oceans and Coasts 31 962 8.0%
5 Biodiversity and Conservation 6 Environmental Programmes 17 654 2.4%
2 Legal, Authorization and Compliance
3 457 0.5% Funding systems for enforcement function at the ports of entry to ensure that illegal environmental species do not leave nor enter South Africa
4 Climate Change and Air Quality 3 678 0.5% Finding participation in international forums to discuss the climate change impacts and regulations on the environment and oceans
7 Chemicals and Waste Management
3 619 0.5% Funding hazardous waste and licencing expenditure
All virements were applied within the 8% limitations of the PFMA
Fruitless and wasteful expenditure – relating to prior year
The disclosure of possible fruitless and wasteful expenditure during the 2015/16 financial year has been corrected in order not to disclose until it is proven to be classified accordingly.

10
fuTurE plans Of ThE dEparTMEnTNone
publiC priVaTE parTnErships The Department has relocated to its new DEA Green Building head office with effect from 01 August 2014. This signifies a major milestone that effectively marks the beginning of the Operations Phase of the project. In terms of Schedule 5B to the PPP Agreement, the first six months after the service commencement date (01 August 2014) allows both parties to settle down into the new working environment. This also enabled Imvelo Concession Company (RF) (PTY) LTD (Private Party) to fine tune the building operational systems.
The official operations performance monitoring process started from February 2015, resulting in the full implementation of the payment mechanism as provided for in terms of Schedule 6 to the PPP Agreement. Gross unitary monthly instalment per Clause 2.3 has been paid amounting to R129 346 million; as well as pass-through costs and additional payment amounting to R5 183 million as per Clause 6.24 of Schedule 6 of the PPP Agreement as at 31 March’16. The new DEA Green Building creates a pleasant and conducive working environment that promote productivity across the entire organisation.
The Imvelo Concession Company (Pty) Ltd consists of the following concessionaires:
• Grinakar/Aveng LTD 30%
• Old Mutual PLC 30%
• Wiphold LTD; and 20%
• Kagiso/Tiso Holdings 20%
disCOnTinuEd aCTiViTiEs/aCTiViTiEs TO bE disCOnTinuEdNone
nEw Or prOpOsEd aCTiViTiEs None
supply Chain ManagEMEnT No unsolicited bid proposals concluded for the year under review
Indicate whether SCM processes and systems are in place to prevent irregular expenditure • SCM Processes and systems are in place such as financial delegations, policies,
practice notes and relevant legislations.
• Bid Committees (Specification, Evaluation and Adjudication) are in place and members are appointed in writing
• When invoices are received, they are verified against the checklist to establish irregular expenditure.
• When irregular expenditure is discovered, it is recorded and reported to the relevant authority for formal responses as per the National Treasury practise notes.
• Updated Asset register in place
• Disposal committee in place
Challenges experienced in SCM and how they were resolved • Market research not done regularly, resulting in deviations from the normal
procurement processes, e.g. Single Source/Sole Providers/Urgent.
• Solution: National Treasury SCM Instruction note 3 of 2016/17 addressed the challenge.
• Inaccurate lease commitment report (photocopy machines).
• Solution: Quarterly verification (photocopy machines) to be conducted. Source documents to be verified against the commitment report.
• Delays in initiation of projects, Bid Evaluation and Adjudication Committees.
• Solutions: Terms of Reference to be submitted with the Procurement Plan to fast-track the procurement process.
• Project managers not submitting closeout reports and the renewal of contract on time regarding expired contract.
• Solutions: Contract management system has been developed. End Users to be trained and implemented.
Gifts and Donations received in kind from non-related parties None

DEPARTMENT OF ENVIRONMENTAL AFFAIRS ANNUAL REPORT 2015/1611
ExEMpTiOns and dEViaTiOns rECEiVEd frOM ThE naTiOnal TrEasuryIn the previous and the current financial year the National Treasury in terms of Section 79 of the PFMA exempted the department from applying the Modified Cash Standard (MCS) in respect of transfer payments to environment projects and to allow reporting as per the approved economic structure and appropriation.
The EPWP projects are appropriated by National Treasury in the Estimates of National Expenditure as transfer payments, since inception 2001. The Department of Environmental Affairs (DEA) accordingly complies with Treasury Regulations 8.4.1; 8.4.2 in the accounting and recording of transfers to EPWP projects. The Treasury Regulation 8.4.1(e) has specifically been implemented to provide means for additional controls in management of EPWP projects and the department processes and systems are in full compliance with section 38 (1)(j) of the PFMA.
Per the Office of the Accountant-General it was requested that the Chief Procurement Officer (CPO) test compliance to Supply Chain Process. The CPO confirmed compliance with Supply Chain Processes and the treatment thereof as applicable to transfer payments.
However, since the inception of the Modified Cash Standard (MCS) in 2013, the Auditor-General has indicated, based on the 2013/14 financial year audit that the DEA does not comply with MCS treatment. The department enhanced disclosure of work in progress and assets related to the Expanded Public Works Programme projects included in transfer payments in the previous financial year’s annual financial statements as agreed with the Office of the Accountant-General. It was never clear what is meant by the non-compliance in respect of transfer payments to EPWP projects and what was the department required to do in providing further disclosure in its financial statements. The department has requested the clarity and further guidance from the Office of the Accountant-General since 2014 without progress. The Minister of Environmental Affairs subsequently wrote a letter to the Minister of Finance requesting his intervention, since July 2016, in order to resolve this long outstanding matter, hence the delayed tabling of department’s annual report.
Subsequent to further engagements between the Office of the Auditor-General and Office of Accountant-General, the department has met with the Auditor-General, and received clear guidance on how at best to further elaborate the enhancement of disclosure notes to the financial statements. Regardless of how funds are appropriated, MCS requires the department to account for the use of funds under goods and services, and capital.
In conclusion the Annual Financial Statements and disclosure notes have been amended to reclassify the transfers to households to respectively Goods and Services and Expenditure for Capital Assets in line with the immediate use of the funds.
EVEnTs afTEr ThE rEpOrTing daTE None
Other None
aCknOwlEdgEMEnTs I wish to express my gratitude to the Minister and the Deputy Minister for their leadership and guidance in advancing the department specifically and the sector in general. The progress and impact is also as a result of the support and constructive partnership with other key stakeholders within the sector and the broader society for which we are also grateful.
COnClusiOnI am also thankful to our management team and all our employees for their hard work and continued commitment in ensuring that we deliver on our obligation and commitments to the people of South Africa. I look forward to another year in which we all continue to build on our achievements and working together in finding innovative ways to overcome our challenges and ensure that the constitutionally enshrined environmentally right remains a reality to all of society.
Ms nOsiphO ngCabadirECTOr-gEnEraldaTE: 16 nOVEMbEr 2016

12
6. sTaTEMEnT Of rEspOnsibiliTy and COnfirMaTiOn Of aCCuraCy fOr ThE annual rEpOrTTo the best of my knowledge and belief, I confirm the following:
All information and amounts disclosed throughout the Annual Report are consistent.
The Annual Report is complete, accurate and is free from any omissions.
The Annual Report has been prepared in accordance with the guidelines on the Annual Report as issued by the National Treasury.
The Annual Financial Statements (Part E) have been prepared in accordance with the modified cash standard and the relevant frameworks and guidelines issued by the National Treasury.
The Accounting Officer is responsible for the preparation of the Annual Financial Statements and for the judgements made in this information.
The Accounting Officer is responsible for establishing, and implementing a system of internal control that has been designed to provide reasonable assurance as to the integrity and reliability of the performance information, the human resources information and the Annual Financial Statements.
The external auditors are engaged to express an independent opinion on the Annual Financial Statements.
In my opinion, the annual report fairly reflects the operations, the performance information, the human resources information and the financial affairs of the Department for the financial year ended 31 March 2016.
Yours faithfully
Ms nOsiphO ngCabadirECTOr-gEnEraldaTE: daTE: 16 nOVEMbEr 2016

DEPARTMENT OF ENVIRONMENTAL AFFAIRS ANNUAL REPORT 2015/1613
7. sTraTEgiC OVErViEw
VisiOnA prosperous and equitable society living in harmony with our natural resources.
MissiOnProviding leadership in environmental management, conservation and protection towards sustainability for the benefit of South Africans and the global community.
dEparTMEnTal ValuEsWe are driven by our Passion as custodians and ambassadors of the environment, we have to be Proactive and foster Innovative thinking and solutions to environmental management premised on a People centric approach that recognises the centrality of Batho-Pele, for it is when we put our people first that we will serve with Integrity, an important ingredient for high Performance driven organisation such as ours.
8. lEgislaTiVE and OThEr MandaTEsThe mandate and core business of the Department of Environmental Affairs is underpinned by the Constitution of the Republic of South Africa and all other relevant legislation and policies applicable to the government, including the Batho Pele White Paper. In addressing the mandate for sound environmental management, the following policies, legislation and regulations have been enacted to give effect to the constitutional environmental rights of all South Africans in its Section 24, which provides a specific definition of the term sustainable development, namely that: Everyone has the right to an environment that is not harmful to their health or well-being; and to have the environment protected, for the benefit of present and future generations, through reasonable legislative and other measures that:
i. Prevent pollution and ecological degradation;
ii. Promote conservation; and
iii. Secure ecologically sustainable development and use of natural resources while promoting justifiable economic and social development.
In the context of this constitutional definition, the policies, legislation and regulations have been enacted in the form of overarching and enabling Integrated Environmental
Management legislation which provides for subsidiary issue specific legislation on biodiversity and heritage resources; oceans and coasts; climate change and air quality management; and waste and chemicals management. There have not been any relevant court rulings that had a significant ongoing impact on the mandate of the department and service delivery obligations.
inTEgraTEd EnVirOnMEnTal ManagEMEnT
Policies• White Paper on Environmental Management, 1998.
• National Framework Strategy for Sustainable Development, 2009.
• National Strategy for Sustainable Development 1, 2011.
Acts of ParliamentThe National Environmental Management Act (NEMA), 1998, (Act No. 107 of 1998), which establishes the concepts of participatory, cooperative and developmental governance in environmental management. It establishes principles for environmental management and provides for structures to facilitate these.
The National Environmental Management Amendment Act, 2003 (Act No. 46 of 2003), which DEAls with compliance and enforcement and provides for Environmental Management Inspectors (EMIs). The National Environmental Management Amendment Act, 2004 (Act No. 8 of 2004), which streamlines the process of regulating and administering the impact assessment process. Chapter 5 of the act lays down procedures with which the Minister or MEC, as the case may be, must comply before listing or delisting an activity.
The National Environment Laws Amendment Act, 2008 (Act No. 44 of 2008), which amends the National Environmental Management Act, 1998, so as to clarify any uncertainty in the act; authorises the Minister of Water Affairs and Forestry to designate persons as environmental management inspectors; provides for environmental management inspectors to be regarded as peace officers as contemplated in the Criminal Procedure Act, 1977; and amends the National Environmental Management: Air Quality Act, 2004, so as to substitute Schedule 1 of that act.

14
The National Environmental Management Amendment Act, 2008 (Act No. 62 of 2008), which empowers the Minister of Minerals and Energy to implement environmental matters in terms of the National Environmental Management Act, 1998, in so far as it relates to prospecting, mining, exploration or related activities; aligns environmental requirements in the Mineral and Petroleum Resources Development Act (MPRDA), Act 28 2002, with NEMA (1998), by providing for the use of one environmental system and by providing for environmental management programmes; and further regulates environmental authorisations.
The National Environment Laws Amendment Act, 2009 (Act No. 14 of 2009), which amends the Atmospheric Pollution Prevention Act, 1965, so as to adjust the penalties provided for in the said act, the Environment Conservation Act, 1989, so as to adjust the penalties provided for in the said act, the National Environmental Management: Air Quality Act, 2004, so as to provide for a processing fee to review a licence, and to include directors or senior managers in a juristic person for the criteria for a fit and proper person.
biOdiVErsiTy and hEriTagE rEsOurCEs
PoliciesWhite paper on conservation and sustainable use of biodiversity, 1997.
Acts of ParliamentThe World Heritage Convention Act, 1999 (Act No. 49 of 1999), which provides for the cultural and environmental protection and sustainable development of, and related activities in a world heritage site.
The National Environmental Management: Protected Areas Amendment Act, 2009 (Act 15 of 2009), which provides for the assignment of national parks, special parks and heritage sites to South African National Parks; makes provision for flight corridors and permission of the management authority to fly over a special national park, national park or heritage site; and provides for the winding up and dissolution of South African National Parks.
The National Environmental Management: Biodiversity Act, 2004 (Act No. 10 of 2004), which significantly reforms South Africa’s laws regulating biodiversity. Its sets out the mechanisms for managing and conserving South Africa’s biodiversity and its components; protecting species and ecosystems that warrant national protection; the sustainable use of indigenous biological resources; the fair and equitable sharing of benefits arising from bioprospecting, including indigenous biological resources; and the
establishment of the South African National Biodiversity Institute.
National Environmental Management: Protected Areas Act, 2003 (Act No. 57 of 2003) which provides for the protection and conservation of ecologically viable areas. It further provides for the establishment of a national register of protected areas and the proclamation and management of these areas.
The National Environmental Management: Protected Areas Amendment Act, 2004 (Act no. 31 of 2004), which provides for a national system of protected areas in South Africa as part of a strategy to manage and conserve the country’s biodiversity. A significant part of this act is that the state is appointed as the trustee of protected areas in the country.
OCEans and COasTal EnVirOnMEnTal ManagEMEnT
PoliciesWhite Paper for Sustainable Coastal Development in South Africa, 2000
Acts of ParliamentThe National Environmental Management: Integrated Coastal Management Act, 2008 (Act No. 24 of 2008), which establishes a system of integrated coastal and estuarine management in the Republic; ensures that development and the use of natural resources within the coastal zone is socially and economically justifiable and ecologically sustainable; determines the responsibilities of organs of state in relation to coastal areas; controls dumping at sea and pollution in the coastal zone; and gives effect to South
Africa’s international obligations in relation to coastal matters.
Sea Shores Act, 1935, (Act No. 21 of 1935), which declares the President to be the owner of the seashore and the sea within South Africa’s territorial water and regulate the granting of rights and alienation thereof.
Sea Birds and Seals Protection Act, 1973 (Act No. 46 of 1973), which provides for control over certain islands and rocks for the protection and conservation of seabirds and seals.
Dumping at Sea Control Act, 1980 (Act No. 73 of 1980), which regulates the control of dumping substances at sea.
Sea Fishery Act, 1988 (Act No. 12 of 1988), most of the powers in terms of this Act were transferred to the Minister of Agriculture, Forestry and Fisheries. The Minister only retains

DEPARTMENT OF ENVIRONMENTAL AFFAIRS ANNUAL REPORT 2015/1615
powers in terms of section 38 of the Act.
Antartic Treaties Act, 1996 (Act No. 60 of 1996),which provides for the implementation of certain treaties relating to Antarctica. The treaty is primarily concerned with the regulation of activities in Antarctica, including territorial claims, research and strict environmental protection in general and the protection of certain identified species such as seals.
Marine Living Resources Act, 1998 (Act No. 18 of 1998), which deals with the long-term sustainable utilisation of marine living resources. Most of the powers and functions in terms of this Act were transferred to the Minister of Agriculture Forestry and Fisheries. The Minister of Water and Environmental Affairs only retained functions pertaining to the Marine Protected Areas, regulatory powers that relates to the protection of the marine environment.
Prince Edward Islands Act, 1948 (Act No. 43 of 1948), which provides for the confirmation of the annexation to the Union of South Africa of the Prince Edward Islands, and for the administration, government and control of the said islands.
CliMaTE ChangE and air QualiTy ManagEMEnT
PoliciesWhite Paper on National Climate Change Response, 2011.
Acts of ParliamentThe National Environmental Management: Air Quality Act, 2004 (Act No. 39 of 2004), which reforms the law regulating air quality in order to protect the environment by providing reasonable measures for the prevention of pollution and ecological degradation and for securing ecologically sustainable development; and provides for national norms and standards regulating air quality monitoring.
South African Weather Service Act, 2001 (Act No. 8 of 2001), which established the South African Weather Service; determined its objects, functions and method of work, the manner in which it is to be managed. It governs and regulates its staff matters and financial affairs.
ChEMiCals and wasTE ManagEMEnT
PoliciesWhite Paper on Integrated Pollution and Waste Management, 2000.
Acts of ParliamentThe National Environmental Management: Waste Act, 2008 (Act No. 59 of 2008), which reforms the law regulating waste management in order to protect health and the environment by providing reasonable measures for the prevention of pollution; provides for national norms and standards for regulating the management of waste by all spheres of government; and provides for the licensing and control of waste management activities.

16
MS L MAKOTOKO
ChiEf OpEraTing OffiCEr
MR I ABADER
dEpuTy dirECTOr-gEnErallEgal, auThOrisaTiOns
COMplianCE and EnfOrCEMEnT
DR M MAYEKISO
dEpuTy dirECTOr-gEnEralOCEans and COasTs
MR S MUNZHEDZI
dEpuTy dirECTOr-gEnEralbiOdiVErsiTy and COnsErVaTiOn
DR G PRESTON
dEpuTy dirECTOr-gEnEral EnVirOnMEnTal
prOgraMMEs
MR M GORDON
dEpuTy dirECTOr-gEnEral ChEMiCals & wasTE
ManagEMEnT
MR A WILLS
dEpuTy dirECTOr-gEnEral EnVirOnMEnTal adVisOry sErViCEs
MS E MAKAU
finanCial ManagEMEnT sErViCEs (CfO)
MR A PILLAY
hEad Of inTErnal audiT uniT (aCTing)
MS B.E.E MOLEWA
MinisTEr
MS B THOMSON
dEpuTy MinisTEr
MS J BEAUMONT
dEpuTy dirECTOr-gEnEralCliMaTE ChangE and air
QualiTy
MS N NGCABA
dirECTOr-gEnEral
9.OrganisaTiOnal sTruCTurE

DEPARTMENT OF ENVIRONMENTAL AFFAIRS ANNUAL REPORT 2015/1617
10. EnTiTiEs rEpOrTing TO ThE MinisTEr
naME Of EnTiTy lEgislaTiVE MandaTE finanCial rElaTiOnship naTurE Of OpEraTiOnsSouth African NationalBiodiversity Institute (SANBI)
SANBI was established in terms of the National Environmental Management: Biodiversity Act, 2004 (Act No. 10 of 2004)
Transfer payment The mandate of SANBI is to play a leading role in South Africa’s national commitment to biodiversity management. In partnership with the Department of Environmental Affairs and the biodiversity sector, SANBI is tasked to lead the biodiversity research agenda; provide knowledge and information; give policy support and advice; manage gardens as windows to our biodiversity for leisure, enjoyment, spiritual upliftment and education; and engage in ecosystem restoration and rehabilitation programmes and best-practice models to manage biodiversity better
iSimangaliso Wetland ParkAuthority
iSimangaliso Wetland Park (“Park”) was inscribed as South Africa’s first world heritage site in December 1999 as an area of exceptional and outstanding universal heritage significance
Transfer payment The iSimangaliso Wetland Park Authority in recognition of its exceptional natural beauty and unique global values, is responsible for managing the affairs of the Park. The 332 000 hectare Park contains three major lake systems, eight interlinking ecosystems, 700 year old fishing traditions, most of South Africa’s remaining swamp forests, Africa’s largest estuarine system, 526 bird species and 25 000 year-old coastal dunes – among the highest in the world. iSimangaliso also contains four wetlands of international importance under the Ramsar Convention
South African WeatherService (SAWS)
SAWS was established in terms of the South African Weather Service Act, 2001 (Act No. 8 of 2001)
Transfer payment The mandate of SAWS is to provide useful and innovative weather, climate and related products and services for all South African and the African Continent through the following: Enhancing observational data and communications networks; Effectively developing and managing talent within the sector; Enhancing collaborative partnerships and effectively disseminating weather services products to the users; Utilising cutting edge technology to convert data into meaningful products and services for risk mitigation; Advancing the science of meteorology, research and relevant applications; and enhancing fiscal discipline and resource mobilisation to ensure sustainability
South African NationalParks (SANParks)
SANParks was established in terms of the National Environmental Management: Protected Areas Act, 2003 (Act No. 57 of 2003)
Transfer payment The mandate of SANParks is to oversee the conservation of South Africa’s biodiversity, landscapes and associated heritage assets through a system of national parks. The core areas which provide a fundamental basis of the SANParks’ mandate are; conservation management through the national parks system, constituency building and people focused eco-tourism management

18
parT b: pErfOrManCE infOrMaTiOnPART B: PERFORMANCE INFORMATION

DEPARTMENT OF ENVIRONMENTAL AFFAIRS ANNUAL REPORT 2015/1619
1. audiTOr-gEnEral’s rEpOrT On prEdETErMinEd ObjECTiVEs
1.1. I performed procedures to obtain evidence about the usefulness and reliability of the reported performance information of the following selected programmes presented in the annual performance report of the department for the year ended 31 March 2016:
• Programme 3: Oceans and Coasts on pages 49 to 54
• Programme 4: Climate Change and Air Quality on pages 55 to 62
• Programme 6: Environmental Programmes on pages 67 to 72
1.2. 12. I evaluated the usefulness of the reported performance information to determine whether it was presented in accordance with the National Treasury’s annual reporting principles and whether the reported performance was consistent with the planned programmes. I further performed tests to determine whether indicators and targets were well defined, verifiable, specific, measurable, time bound and relevant, as required by the National Treasury’s Framework for managing programme performance information (FMPPI).
1.3. I assessed the reliability of the reported performance information to determine whether it was valid, accurate and complete.
I did not identify any material findings on the usefulness and reliability of the reported performance information for any of the programmes assessed as indicated in paragraph 11 above.
2. OVErViEw Of dEparTMEnTal pErfOrManCE
sErViCE dEliVEry EnVirOnMEnTThe prevailing economic challenges and the resulting fiscal constraints that the Government continues to experience has an on-going impact in funding the operations of DEA. These challenges require that the Department be more efficient and find innovative ways to deliver on its approved plans and constitutional mandate. The Department has during the financial year under review had to review its existing personnel structure. These resulted in a significant reduction of the number of posts/personnel allocation as it was necessary to abolish some of the vacant posts on the approved establishment and to reprioritise other posts as new vacancies arise. The objective is to make sure that the Department operates within the allocated personnel
funds and to accommodate the reduction in the allocation from the National Treasury. The focus is on prioritising critical human resources capacity required for the execution of the core mandate of the DEA and ensuring that we operate with the minimum required capacity for support and general administrative functions. The Department is also working on building and strengthening partnerships with different sectors of society and key stakeholders, including international donor organisation. These collaborations and partnerships are aimed at ensuring that in addition to working together towards common goals, we also ensure that the funding of environment and sustainable development programmes and intervention is not only reliant on public funds but other funding models are explored and optimised.
sErViCE dEliVEry iMprOVEMEnT planAs required in terms of Part III.C.1-2 of the Public Service Regulations, the Department has a comprehensive Service Delivery Improvement Programme which is made up of an approved Service Delivery Charter and Service Delivery Improvement Plan (SDIP) supported by a service standard matrix that focuses on improving governance within the department. The Service Charter is placed at the entrance points in the department. The charter seeks to emphasise our commitment to serving the general public with humility, in line with the government principles of “Batho Pele”, which amongst others include exercising courtesy in our DEAlings with the public, consultation, openness and transparency, access to information and proving value for public resources. A system or mechanism for lodging any complaints relating to the work of the Department is also outlined in the Charter. Compliance with approved service standards is monitored internally on a quarterly basis and reported to Parliament and the general public in the Department’s Annual Report.

20
Main sErViCEs and sTandards
Main sErViCEs bEnEfiCiariEs CurrEnT/aCTual sTandard Of sErViCE dEsirEd Of sTandard Of sErViCE aCTual aChiEVEMEnT
Response to fraud and corruption allegation
Internal Client /Members of the Public
27% (3/11). There are currently 11 reported fraud and corruption cases under different stages of investigation. 3 of the cases are within time frame and 11 are outside of time-frame
100% reported fraud and corruption within timeframes
74% (17/23) reported fraud and corruption within timeframes
Responding to Presidential Hotline queries on time
Members of the Public 100% (5/5) queries received and all responded to on time
100% 100% (7/7) queries received and all responded to on time
Legitimate invoices from suppliers paid with prescribed timeframes (30 days)
Members of the public 99.8% Invoices as at 31 March 2015)
27 172 invoices paid on time out of 27 217 invoices to the amount of R5 161 646. 45 Invoices to the amount of R1 456 were not within 30 days
100% 99% of invoices paid within 30 days.
27 749 invoices paid on time.
10 Invoices were paid outside timeframes
Responding to Parliamentary questions on time
Members of Parliament 95% (140/148) of parliamentary questions and requirements responded to within the timeframes
100% 100% (111/111) of parliamentary questions and requirements responded to within the timeframes
Responding to complaints and incidents on time
Members of the public 95% (105/111) of DEA environmental complaints and incidents responded to in accordance with the set timeframe
92% 94% (118/125) of DEA environmental complaints and incidents responded to in accordance with the set timeframe
Issuing of Environmental Authorisations
• Developers
• Environmental Assessment Practitioners
• Industry
• Interested and Affected Parties
75.45% EIA applications finalised within timeframes (330 applications finalised , 249 finalised within timeframes)
65% 90% (251/279) EIA applications finalised within timeframes
Finalisation of appeals Internal client 98% (47/48) appeals received is finalised within the timeframes
85% 88% (51/58)
Processing of Litigation matters Internal Clients 100% Compliant ( 83/83 active matters (includes 10 new matters that were received)
95% 100% Compliant (84/84 active matters (includes 12 new matters that were received)
Responding to PAIA requests on time
Members of the Public 100% (30/30) compliance with the implementation of PAIA
95% 100% (49/49) compliance with the implementation of PAIA

DEPARTMENT OF ENVIRONMENTAL AFFAIRS ANNUAL REPORT 2015/1621
Main sErViCEs bEnEfiCiariEs CurrEnT/aCTual sTandard Of sErViCE dEsirEd Of sTandard Of sErViCE aCTual aChiEVEMEnT
Issuing Of Marine Research Permits Industry/ Government Entities 96% (50/52) issued within timeframe. 100% 99% (79/80 of permits issued within timeframe
Issuing of off-road vehicle permits (ORV)
Researchers working on protected species and within Marine Protected
Areas (MPA’s)
79% (38/48) of permits were issued on timeframe 100% 98% (61 /62) of permits issued within timeframe
Issuing of dumping permits Applicants 100% (11/11) of the dumping permits were issued on timeframe
100% 100% (10/10) of permits issued within timeframe
Issuing of permits for activities within marine protected areas
Applicants (film producers/scuba operators/research organisations)
100% (71/71) issued on timeframe. 100% 75% (48/64) of permits issued within timeframe
Issuing of GMO applications • Traders
• Exporters or importers of GMO listed Species
• Scientific Institutions
• Government Departments and Parastatals
100% (46/46) of GMO applications for permits received, reviewed and assessed for Environmental compliance within prescribed timeframe
100% 100% (39/39) of received GMO permits applications assessed for environmental compliance within prescribed time frame
Issuing of CITES permits • Traders
• Exporters or importers of CITES listed species
• Scientific Institutions
• Government Departments and Parastatals
100% (168/168) CITES permit applications received and evaluated
100% 100% (140/140) CITES permit applications received and evaluated within prescribed timeframe
Issuing of TOPS permits • Traders
• Exporters or importers of TOPS listed species
• Scientific Institutions
• Government Departments and Parastatals
100% (74/74) TOPS permit applications received and evaluated
100% 100% 93/93 TOPS permits applications received and evaluated within prescribed timeframe
Main sErViCEs and sTandards (COnTinuEd)

22
Main sErViCEs bEnEfiCiariEs CurrEnT/aCTual sTandard Of sErViCE dEsirEd Of sTandard Of sErViCE aCTual aChiEVEMEnT
Issuing of BABS applications Applicants 28/28 (100%) BABS permit applications received and assessed for environmental compliance within prescribed timeframe
100% 100% (31/ 31) received BABS permit applications assessed for environmental compliance within prescribed timeframe
Issuing of Waste Management Licences
Applicants 90% (25/28) waste management licenses were finalised within legislated time frames
95% 67% (26/39) Waste Management Licences we finalised within legislated timeframe
Issuing of Remediation orders Areas (MPA’s) 100% (69 out of 69) processed within timeframes 50% 70% (14/20) processed within timeframes
Main sErViCEs and sTandards (COnTinuEd)

DEPARTMENT OF ENVIRONMENTAL AFFAIRS ANNUAL REPORT 2015/1623
baThO pElE arrangEMEnTs wiTh bEnEfiCiariEs/sTakEhOldErs (COnsulTaTiOn aCCEss)
CurrEnT/aCTual arrangEMEnTs dEsirEd arrangEMEnTs aCTual aChiEVEMEnTsRegular stakeholder consultation events on work of DEA
Public Participation events
Gazetting of draft regulations, policies and legislation for public comments before Finalisation
Facilitation of regular Environmental Campaigns
Maintain current arrangements • 19 Public Participation events were held during the year including Ministerial events
• 143 Media statement/speeches issued
• 4 Environmental awareness campaigns conducted
sErViCE dEliVEry infOrMaTiOn TOOlCurrEnT/aCTual arrangEMEnTs dEsirEd arrangEMEnTs aCTual aChiEVEMEnTs
DEA Website ( www.environment.gov.za)
DEA Call centre (086 111 2468)
Information centre (walk-in centre )
Use of regional and national Media (print media, radio and television)
Capacity to respond to media queries
Maintain use of current tools 143 Media statement/speeches issued
16 Opinion pieces published on various print media
19 Public Participation events were held during the year including Ministerial events
4 Stakeholder publications were produced and published ( Environment Quarterly)
495 Media queries received in the 2015/16 financial year. 434 were finalised within 48 hours resulting to 88%
70 9549 website hits
64 919 Members of the public visited the information centre
COMplainTs MEChanisMCurrEnT/aCTual arrangEMEnTs dEsirEd arrangEMEnTs aCTual aChiEVEMEnTs
Regular stakeholder consultation events on work of DEA
Public Participation events
Gazetting of draft regulations, policies and legislation for public comments before Finalisation
Facilitation of regular Environmental Campaigns
Maintain current mechanisms 100% (7/7) queries received and all responded to on time
99.9% of matters received through the call centre were resolved within the set service standard (48 hours)
A total of 4070 requests/queries received through the call centre ( 2116 calls and 1954 emails)
OrganisaTiOnal EnVirOnMEnTThe Department is committed to good corporate governance, accountability and implementation of effective and best management practices. These are important elements in ensuring that we carry out our constitutional mandate in line with good corporate values and principles, and we maintain the confidence and trust of South Africans and all our stakeholders. The Department consistently improves the integrity and reliability of internal systems and processes on the basis of lessons learnt from the outcomes and findings of

24
the Management Performance Assessment Tool (MPAT), an initiative of the Department of Performance Monitoring and Evaluation in the Presidency, as well as internal and external audits.
kEy pOliCy dEVElOpMEnTs and lEgislaTiVE ChangEsThere were no major Policy developments and legislative changes finalised for the period under review, however the following regulations were developed and policies drafted:
• Compliance and Enforcement Strategy finalised and approved
• Draft regulations for the registration of Professional Hunters and Trainers Hunting Outfitters developed and published for public participation
• Norms and standards for the management of protected areas finalised and published for public participation
• Amended regulations for Special Nature Reserves, National Parks and World Heritage published for implementation
• EIA regulations and revised listing notices published for implemented
3. sTraTEgiC OuTCOME OriEnTEd gOals• Environmental Economic Contribution Optimised
• Socially Transformed & Transitioned Communities
• Environmental/ Ecological Integrity Safeguarded & Enhanced
• Global Agenda Inuenced & Obligations Met
• A Capable and ecient department
The Department is directly responsible for delivering on, and coordinating the work and priorities outlined in Outcome 10 (Environmental Assets and Natural Resources that are Valued, Protected and Continually Enhanced) of the 12 Government Outcomes, and also make a contribution to other outcomes, mainly Outcome 4 (Decent Employment through Inclusive Economic Growth). The two outcome oriented goals of the department (1. Environmental assets conserved, valued, sustainably used, protected and continually enhanced; and
2.Enhanced socio-economic benefits and employment creation for the present and future generations from a healthy environment) are aligned to the outcome 10 and
4 priorities. Below is a summary of progress made in relation to the two mentioned Outcomes:
Outcome 10: Environmental Assets and Natural Resources that are Valued, Protected and Continually Enhanced
Sub output: Reduced greenhouse gas emissions, climate change and improved air/ atmospheric quality: The Outcome 10 Delivery Agreement addresses the following key sub outcomes from the National Development Plan (NDP) 2030 Vision namely:
1) Ecosystems are sustained and natural resources are used efficiently; On the action to expand the conservation area estate through declaration of state owned protected areas 11.73% land under conservation was achieved (from 11.3%) in the previous financial year. 92.6% of area of state managed protected areas assessed had a METT score above 67%. With regards to the land under rehabilitation Department of Environmental Affairs (DEA) has cumulatively achieved 36 380ha out of the planned annual target of 25 116ha.
2) An effective climate change mitigation and adaptation response; Work around the total emissions of the greenhouse gases on Setting of first Desired Emissions Reduction Outcomes (DERO’s) is on going, terms of reference for DERO’s and Carbon budgets were approved. Carbon budgets have been allocated to 9 companies that have submitted sufficient data. Executive Authority approved the publication of the Draft Notice to declare GHG as Priority Pollutants and National Pollution Prevention Plans Regulations for final public comments. The design of the Climate Change Response Monitoring and Evaluation system was completed in 2014/15 financial year.
Outcome 4: Decent Employment through Inclusive Economic Growth
Output 2: More labour absorbing growth Sub-output: Green Economy:The National Green Fund was established with an initial allocation of R800 million. An additional R300 million was allocated to the Fund, bringing the total allocation to R1,1 billion. The Department of Environmental Affairs in partnership with the National Treasury coordinates the implementation of the National Green Fund. As of the end of the financial year 2015/2016, a total of 53 projects were approved for implementation, which included, 29 investment projects, 16 research and policy development and 8 capacity development initiatives.

DEPARTMENT OF ENVIRONMENTAL AFFAIRS ANNUAL REPORT 2015/1625
4. pErfOrManCE infOrMaTiOn by prOgraMMEsTraTEgiC ObjECTiVEs, pErfOrManCE indiCaTOrs, plannEd TargETs and aCTual aChiEVEMEnTs
prOgraMME 1: adMinisTraTiOnThe purpose of the Programme is to provide leadership, strategic, centralised administration, executive support, corporate services and facilitate effective cooperative governance, international relations and environmental education and awareness. The programme is made-up of six subprogrammes which are as follows: (1) Management (2) Corporate Affairs (3) Environmental Advisory Services (4) Financial Management (5) Office Accommodation (6) Environmental Sector Coordination.
sTraTEgiC ObjECTiVE
pErfOrManCE indiCaTOr
basElinE annual TargET 2015/16
prOgrEss/ aChiEVEMEnT againsT TargET
COMMEnTs (ChallEngEs/ExplanaTiOns On VarianCEs)
COrrECTiVE MEasurEs
Equitable and sound corporate governance
Percentage compliance
With key legislation and corporate and governance requirements
100% 2012/13 Annual report
Tabled 2013/14 - 2017/18 Strategic Plan and APP
tabled
2014/15-2018/19 first draft Strategic Plan and APP
100% compliance with statutory tabling and prescripts
(All MPAT Standards with moderated score of 3 and above)
100% compliance with key governance requirements and set timeframes as follows:
• DEA 2016/17 Annual Performance Plan tabled in Parliament within timeframes. 1st and 2nd draft 2016/17 Annual Performance Plan submitted to National Treasury and Presidency/DPME.
• All DEA quarterly performance reports submitted to National Treasury and DPME within timeframes; interim financial statements submitted to National Treasury on time,
• 2014/15 DEA Annual report tabled to Parliament on time
None None
Unqualified audit report
2012/13 Unqualified audit report
Unqualified audit report
DEA received an unqualified audit report/opinion from the Auditor General South Africa (AGSA) for the 2014/15 financial year
None None
Percentage adherence to Cabinet and Cluster schedule as per approved protocol
93% 100% 94% (48/51) adherence to the Schedule
Planned target missed by a variance of 6% as clashes of dates between scheduled and ad-hoc meetings resulted in unavailability of managers
Ongoing identification of alternative Managers to attend other meetings to manage clashes

26
sTraTEgiC ObjECTiVE
pErfOrManCE indiCaTOr
basElinE annual TargET 2015/16
prOgrEss/ aChiEVEMEnT againsT TargET
COMMEnTs (ChallEngEs/ExplanaTiOns On VarianCEs)
COrrECTiVE MEasurEs
Equitable and sound corporate governance
Percentage expenditure
96% 9 [ R4 942 661/ R5 175 321] Expenditure (excluding the Green Fund is 99.7 percent)
98% 99.97% (5 939 569/5 943 297) Planned target exceeded with a variance of 2% and this is an iDEAl performance
None
Percentage of Expenditure on affirmative procurement
61% (R879 665 892 spent on BEE out of total expenditure of R1 447 933 826)
61% 75% of expenditure on affirmative procurement (R929 710/R1240 781)
Planned target exceeded with a variance of 23%. A higher expenditure on BBBEE companies than the planned target is iDEAl and in line with the DEA transformation objective
None
Value focused funding and resourcing (leveraged public and private sector investments)
Financial value of resources raised from international donors to support SA and African environment programmes
Total: US$ 25 million (Multilateral : US$ 15 million and Bilateral: US$ 10 million
US$ 20 million Total resources mobilized for the year: US$88 million
Planned target exceeded by 340% USD. Exceeding the target did not have any impact on resources earmarked for other priorities. Mobilisation of more funds that estimated is a desired performance
None
Number of investor projects funded
10 projects in the TFCA investment catalogue funded
1 project in the TFCA investment catalogue funded
1 project funded (Songimvelo Nature Reserve 4x4 trail)
None None
Biodiversity sector financing model developed and implemented
N/A Financing model for biodiversity sector developed
Policy and institutional review undertaken as part of a process to develop the cost assessment and the model
Delays in accessing funds from the donor (UNDP) due to cumbersome administrative processes affected the commencement of the project
The funding agreement between UNDP and DEA was amended and work has since commenced. The final report for the cost assessment and model will be completed during 2016/17 financial year
prOgraMME 1: adMinisTraTiOn (COnTinuEd)

DEPARTMENT OF ENVIRONMENTAL AFFAIRS ANNUAL REPORT 2015/1627
sTraTEgiC ObjECTiVE
pErfOrManCE indiCaTOr
basElinE annual TargET 2015/16
prOgrEss/ aChiEVEMEnT againsT TargET
COMMEnTs (ChallEngEs/ExplanaTiOns On VarianCEs)
COrrECTiVE MEasurEs
Value focused funding and resourcing (leveraged public and private sector investments)
DEA expansion plan approved
DEA expansion plan approved
DEA expansion plan approved
DEA Expansion Plan approved None None
Adequate and appropriately skilled, transformed and diverse workforce
Percentage vacancy rate
19.3% (366/1897) 9.5% 6.8% (130/1896) vacancy rate Planned target exceeded with a variance of 28%. A lower vacancy rate is a desirable performance and has no impact of resources as only funded and prioritised posts are filled. This is in line with the strategic objective to have a sufficiently resourced Department to enable successful strategy execution
None
Percentage turnover rate
10% 8% 4.4% (73 employees left DEA / out of 1652 employees at the beginning of the period)
Planned target exceeded with a variance of 45%. A lower level of turnover is a desirable performance. This had no implications on resources allocated for other priorities
None
Percentage implementation of PMDS policy framework
(Number of Human Resources Development ( HRD) strategy
73% (83% - 1253/1514 Biannual/ Verifications Statements received)
95% Compliance with contracting and assessment requirements
Percentage implementation of PMDS policy framework achieved as follows:
• 98% of employee performance agreements/work plans submitted (1918/1950)
• 98% (1826/1870) compliance with submission of first biannual individual assessment reports
Planned target exceeded with a variance of 3%. A higher performance (100%) is a desirable performance and exceeding the target in this area had no implications on resources earmarked for other priorities
None
prOgraMME 1: adMinisTraTiOn (COnTinuEd)

28
sTraTEgiC ObjECTiVE
pErfOrManCE indiCaTOr
basElinE annual TargET 2015/16
prOgrEss/ aChiEVEMEnT againsT TargET
COMMEnTs (ChallEngEs/ExplanaTiOns On VarianCEs)
COrrECTiVE MEasurEs
Adequate and appropriately skilled, transformed and diverse workforce
Number of Human Resources Development ( HRD) strategy initiatives implemented
• 68% (635/934) of Workplace Skills Plan (WSP) implemented
• 40 full time bursaries and 55 part time bursaries approved
3 Interventions:
• 100 Interns recruited
• 70 bursaries issued
• 80% of WSP implemented
Planned HRD targets achieved as follows:
• 100 interns recruited
• 73 bursaries issued (30 full time and 43 part time bursaries awarded)
• 83% (820/990) of WSP implemented
Planned target exceeded with a slight margin/variance with no impact on resources earmarked for other priorities. A higher performance is a desirable performance and is in line with the DEA strategic objective in these area.
None
Percentage compliance to the Employment Equity targets
56% Women (846/1514)
50% 56% (991/ 1767) women Planned target exceeded with a variance of 12%. Progress higher than the planned target is iDEAl as it is in line with DEA transformation objectives. Exceeding the target had no implications on resources
None
N/A 50% Women in SMS 43% (76/ 176) women in SMS Planned target missed by a variance of 7%. There were limited vacancies at SMS level
DEA will continue with efforts to fill new/available SMS vacancies with female candidates in 2016/17
90% Blacks (1360/1514)
90% Blacks 91% (1611/ 1767) Blacks Planned target exceeded with a slight variance of 1% with no impact on resources earmarked for other priorities. The performance is in line with the DEA transformation objectives
None
2% People with disabilities (32/1514)
2% People with disabilities
2.7% (48/ 1767) people with disabilities
Planned target exceeded with a slight variance of 35% with no impact on resources earmarked for other priorities. The performance is in line with the DEA transformation objectives
None
prOgraMME 1: adMinisTraTiOn (COnTinuEd)

DEPARTMENT OF ENVIRONMENTAL AFFAIRS ANNUAL REPORT 2015/1629
sTraTEgiC ObjECTiVE
pErfOrManCE indiCaTOr
basElinE annual TargET 2015/16
prOgrEss/ aChiEVEMEnT againsT TargET
COMMEnTs (ChallEngEs/ExplanaTiOns On VarianCEs)
COrrECTiVE MEasurEs
Secure, harmonious, and conducive working environment
Average number of days taken to resolve disciplinary cases
N/A 90 days: Misconduct cases
30 misconduct cases finalised in 56.3 average days (1689 / 30 = 56.3 days)
Planned target exceeded by 34 days. This had no impact on resources earmarked for other priorities and the higher performance is in line with DEA strategic objectives
None
Secure, harmonious, and conducive working environment
Average number of days taken to resolve disciplinary cases
N/A 30 days: Grievance cases
38 grievance cases finalised in 36.07 average days (1371 / 38= 36.07 days)
Planned target missed by 6 days. Cases delayed due to a number of factors, including availability of relevant key parties (employees and witnesses) to an investigation
The grievance cases which have been delayed will be prioritised for finalisation in the 2016/17 financial year
Staff satisfaction survey conducted and recommendations implemented
Survey conducted and recommen-dations made to management
DEA staff satisfaction survey conducted ; feedback analysed and recommendations submitted to Management
None None
Percentage implementation of security risk Assessment recommendations
83% implemen-tation of security risk assessment recommenda-tions
90% security risk assessment rec-ommendations implemented
54% (7/13) security risk assessment recommendations implemented
Planned target missed by 36%. The outstanding targets are fully dependant on the third party
DEA has since engaged the third party on the issues. A meeting was held with the third party to resolve outstanding matters
prOgraMME 1: adMinisTraTiOn (COnTinuEd)

30
sTraTEgiC ObjECTiVE
pErfOrManCE indiCaTOr
basElinE annual TargET 2015/16
prOgrEss/ aChiEVEMEnT againsT TargET
COMMEnTs (ChallEngEs/ExplanaTiOns On VarianCEs)
COrrECTiVE MEasurEs
Strengthened Leadership and embedded DEA culture
Percentage SMS Development programme implemented
N/A 80% 100% implementation of SMS development programme (5 of the planned SMS development programmes implemented)
• DEA Learning Network hosted (8 sessions)
• SMS coaching programme undertaken (28 SMS members)
• SMS Bursaries (1 issued )
• Executive Management Development Programme (61 SMS attended)
• Implementation of Project Khaedu (8 SMS members)
Planned target exceeded with a variance of 20%. Exceeding the target had no impact on resources earmarked for other priorities
None
Percentage implementation of planned culture intervention
80% 100% implementa-tion of the planned culture interventions annual plan
100% (36/36) of Culture Intervention Plan implemented
None None
Efficient and Effective Information Technology systems
Number of funded Master System Plan (MSP) initiatives
7 initiatives implemented
6 Funded Master System Plan (MSP)initiatives imple-mented
67% achieved on the implementation of MSP initiatives. 4 of the 6 projects achieved successfully and 2 projects work in progress
Planned target missed by 23%. Financial constraints resulted in the need to reprioritise some of the MSP projects and planned milestones to the next financial year
Prioritisation and implementation of delayed MSP projects will be undertaken in 2016/17
Percentage availability of DEA IT services (EDMS and Email)
98.06% availability of IT Services
96% availability of IT Services
99.85% Planned target exceeded by a variance of 4%. Exceeding the target had no impact on resources earmarked for other priorities
None
prOgraMME 1: adMinisTraTiOn (COnTinuEd)

DEPARTMENT OF ENVIRONMENTAL AFFAIRS ANNUAL REPORT 2015/1631
sTraTEgiC ObjECTiVE
pErfOrManCE indiCaTOr
basElinE annual TargET 2015/16
prOgrEss/ aChiEVEMEnT againsT TargET
COMMEnTs (ChallEngEs/ExplanaTiOns On VarianCEs)
COrrECTiVE MEasurEs
Efficient and Effective Information Technology systems
Percentage of IT service requests resolved within 24hrs
80% 80% of IT service requests resolved within 24hrs
85% (6802/8034) Planned target exceeded by 6%. Exceeding the target had no impact on resources earmarked for other priorities
None
Improved profile, support and capacity for the environment sector
Number of media statements/speeches issued and opinion pieces published
137 statements/ speeches issued
120 statements/ speeches issued
143 statements/speeches issued Planned target exceeded by 19%. Exceeding the target had no impact on resources earmarked for other priorities
None
3 opinion pieces published
7 opinion pieces published
16 opinion pieces published Planned target exceeded by a variance of 129%. Exceeding the target had no impact on resources earmarked for other priorities
None
Number of communication events including Ministerial Public Participation Programme (PPP) events
10 Public Participation Events hosted
14 Public Participa-tion events
19 Public Participation events hosted
Planned target exceeded by a variance of 36%. Exceeding the target had no impact on resources earmarked for other priorities
None
Number of publications produced and distributed
4 editions of stakeholder publications per annum
4 stakeholder publi-cations
4 Stakeholder publication printed and distributed
None None
Number of environmental awareness activities conducted (Learnerships, CAPS training and campaigns)
82 teachers trained
100 teachers trained
161 teachers trained Planned target exceeded by a variance of 61%. Exceeding the target had no impact on resources earmarked for other priorities
None
prOgraMME 1: adMinisTraTiOn (COnTinuEd)

32
sTraTEgiC ObjECTiVE
pErfOrManCE indiCaTOr
basElinE annual TargET 2015/16
prOgrEss/ aChiEVEMEnT againsT TargET
COMMEnTs (ChallEngEs/ExplanaTiOns On VarianCEs)
COrrECTiVE MEasurEs
Improved profile, support and capacity for the environment sector
Number of environmental awareness activities conducted (Learnerships, CAPS training and campaigns)
100 unemployed youths recruited and learnership programme implemented
100 unemployed youths recruited and learnership programme imple-mented
100 leaners appointed None None
5 Environmental campaigns
4 Environmental awareness cam-paign implemented
4 Environmental awareness campaign implemented
None None
Number of SETA sector skills plans with environmental focus
ESSP implemented
12 Sector skills plans with environmental focus
12 sector skills plans were confirmed to have environmental focus
None None
Number of Integrated Environmental Management (IEM) training session conducted per annum
2013/2014 Induction training program developed and implemented
4 IEM training ses-sions conducted
8 Integrated Environmental Management (IEM) sessions conducted
Planned target exceeded by a variance of 100%. Exceeding the target had no impact on resources earmarked for other priorities
None
Number of municipalities official/councillors trained on waste management
N/A 200 284 municipal officials trained Planned target exceeded by a variance of 42%. Exceeding the target had no impact on resources earmarked for other priorities
None
Effective partnership, cooperative Governance and Local Government support
Percentage implementation of the Local government support strategy
50% implementation of annual plan
100% of annual action plan imple-mented
74% implementation of planned actions. (37/50) of the planned actions are on target
Planned target missed by 26%. Implementation of delayed interventions required multiple stakeholder coordination and cooperation. High level of stakeholder dependency resulted in delays
Delayed interventions will be prioritised and carried out in 2016/17
prOgraMME 1: adMinisTraTiOn (COnTinuEd)
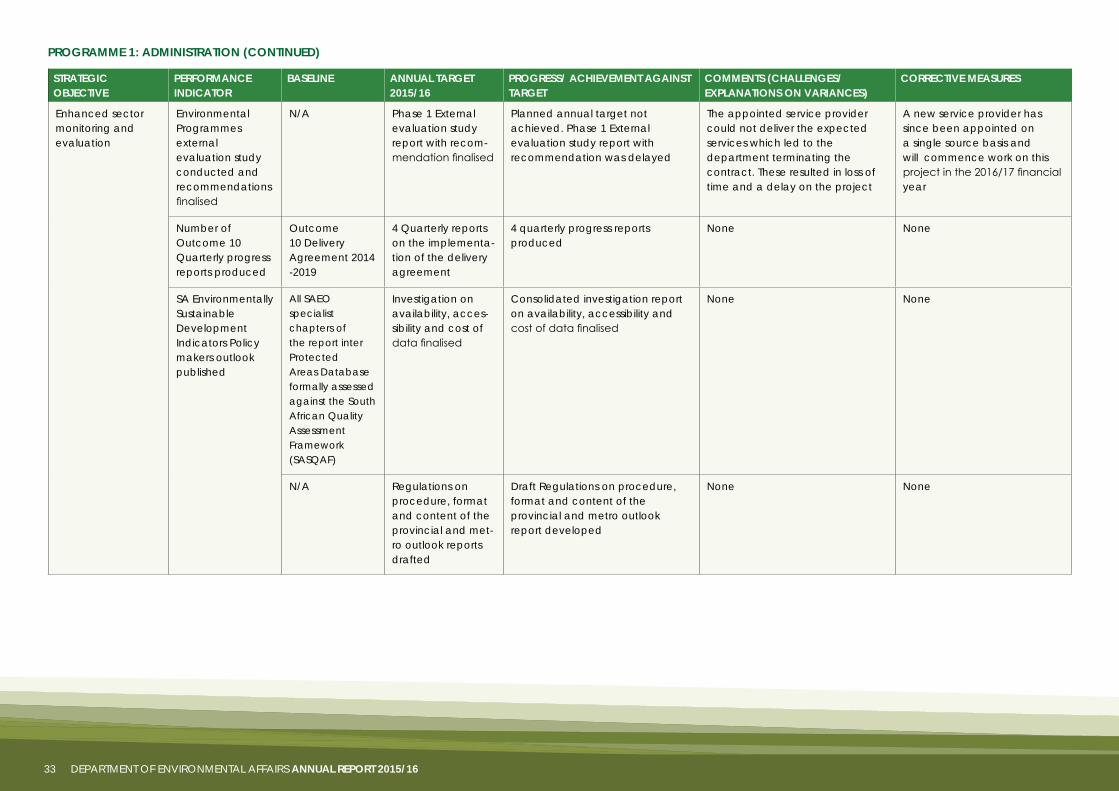
DEPARTMENT OF ENVIRONMENTAL AFFAIRS ANNUAL REPORT 2015/1633
sTraTEgiC ObjECTiVE
pErfOrManCE indiCaTOr
basElinE annual TargET 2015/16
prOgrEss/ aChiEVEMEnT againsT TargET
COMMEnTs (ChallEngEs/ExplanaTiOns On VarianCEs)
COrrECTiVE MEasurEs
Enhanced sector monitoring and evaluation
Environmental Programmes external evaluation study conducted and recommendations finalised
N/A Phase 1 External evaluation study report with recom-mendation finalised
Planned annual target not achieved. Phase 1 External evaluation study report with recommendation was delayed
The appointed service provider could not deliver the expected services which led to the department terminating the contract. These resulted in loss of time and a delay on the project
A new service provider has since been appointed on a single source basis and will commence work on this project in the 2016/17 financial year
Number of Outcome 10 Quarterly progress reports produced
Outcome 10 Delivery Agreement 2014 -2019
4 Quarterly reports on the implementa-tion of the delivery agreement
4 quarterly progress reports produced
None None
SA Environmentally Sustainable Development Indicators Policy makers outlook published
All SAEO specialist chapters of the report inter Protected Areas Database formally assessed against the South African Quality Assessment Framework (SASQAF)
Investigation on availability, acces-sibility and cost of data finalised
Consolidated investigation report on availability, accessibility and cost of data finalised
None None
N/A Regulations on procedure, format and content of the provincial and met-ro outlook reports drafted
Draft Regulations on procedure, format and content of the provincial and metro outlook report developed
None None
prOgraMME 1: adMinisTraTiOn (COnTinuEd)

34
sTraTEgiC ObjECTiVE
pErfOrManCE indiCaTOr
basElinE annual TargET 2015/16
prOgrEss/ aChiEVEMEnT againsT TargET
COMMEnTs (ChallEngEs/ExplanaTiOns On VarianCEs)
COrrECTiVE MEasurEs
Enhanced sector monitoring and evaluation
Number of high-level environmental and sustainable development threat, weakness/opportunity early warning and response options researched and reports developed
Quarterly Environmental Threat, Weakness and Opportunity Scan (QETWOS) system established, and tested
4 quarterly warn-ing and/ or issue scanning reports prepared
4 quarterly early warning and/or issue scanning reports were prepared
None None
6 issues investigated Shale gas carbon footprint; Peak phosphate; Environmental Offsetting; National Evaluations; MTSF 2014-2019; SIP 19
4 issue response options Shale gas carbon footprint; National Evaluations; MTSF 2014-2019
4 emerging issue response options prepared
4 emerging issue response options prepared
None None
prOgraMME 1: adMinisTraTiOn (COnTinuEd)

DEPARTMENT OF ENVIRONMENTAL AFFAIRS ANNUAL REPORT 2015/1635
sTraTEgiC ObjECTiVE
pErfOrManCE indiCaTOr
basElinE annual TargET 2015/16
prOgrEss/ aChiEVEMEnT againsT TargET
COMMEnTs (ChallEngEs/ExplanaTiOns On VarianCEs)
COrrECTiVE MEasurEs
Enhanced sector monitoring and evaluation
SA Environmentally Sustainable Development Indicators published
20 Environmental Sustainability Indicators based on 45 variables updated and published by the DEA since 2008 20 NSSD1 Sustainable Development Headline Indicators
Development of the Environmentally sustainable devel-opment indicators
Environmental sustainable development indicators developed
None None
Strengthened knowledge, science and policy interface
Environmental sector evidence- policy interface system in place
Coordination and support provided for the development of the sector R,D&E thematic strategies
Change strategy on R,D&E framework developed
Change strategy on R,D&E framework developed
None None
Number of environmental sustainability research projects commissioned
South Africa green economy modelling report published
4 policies researched (SD, GE and SCP)
1 environmental sustainability policy research project commissioned
1 environmental sustainability policy research project commissioned
None None
prOgraMME 1: adMinisTraTiOn (COnTinuEd)

36
sTraTEgiC ObjECTiVE
pErfOrManCE indiCaTOr
basElinE annual TargET 2015/16
prOgrEss/ aChiEVEMEnT againsT TargET
COMMEnTs (ChallEngEs/ExplanaTiOns On VarianCEs)
COrrECTiVE MEasurEs
Effective knowledge and information management for the sector
National Ocean and coastal information management system developed and implemented
System specification and design made and project plan determined
Technical development of system initiated
Requirement and architectural design finalised
Requirement and architectural design finalised
None None
National climate change response M&E system development and implemented
Draft Climate Change Response M&E System developed
M&E data sharing framework devel-oped
M&E data sharing Framework report completed
None None
Web-based plat-form of the climate change M&E sys-tem developed
User Requirement Specification (URS) document for the web-based climate change M&E system finalised
None None
Number of environmental knowledge and information management systems developed and implemented
GIS intranet available and 3 Environmental sector projects and initiatives supported by GIS
GIS internal & external plat-forms maintained and key projects supported (SIPs, Operation Phakisa; Enforcement)
GIS internal and external platforms maintained as scheduled and key projects supported (Operation Phakisa, Renewable Energy, Off road vehicle, Coastal viewer, EMFs, Translocation of mammals)
None None
prOgraMME 1: adMinisTraTiOn (COnTinuEd)

DEPARTMENT OF ENVIRONMENTAL AFFAIRS ANNUAL REPORT 2015/1637
sTraTEgiC ObjECTiVE
pErfOrManCE indiCaTOr
basElinE annual TargET 2015/16
prOgrEss/ aChiEVEMEnT againsT TargET
COMMEnTs (ChallEngEs/ExplanaTiOns On VarianCEs)
COrrECTiVE MEasurEs
Effective knowledge and information management for the sector
Number of environmental knowledge and information management systems developed and implemented
Spatial tools:
Proof of concept for a pre-screening tool Developed
Procurement procedure for pre-screening tool in place
3 Spatial tools :
Pre-screening tool developed
Pre-screening tool framework developed and service provider appointed
None None
GIS database de-veloped
GIS database developed and maintained
None None
Proof of Concept and TORs for GEO portal developed
Proof of Concept and TORs for GEO portal developed
None None
SASQAF data improvement plan for the protected areas database generated and implemented
SASQAF data annual improve-ment plan for the protected areas database imple-mented
SASQAF data annual improvement plan for the protected areas database implemented
None None
N/A • Protected areas database: Private nature reserves-Finalised
• Protected areas database stew-ardship sites data audited
• Private nature reserves finalised. Data captured, validated and incorporated into the PACA database
• Protected Area database Stewardship sites data audited. Data obtained from available sources and captured, validated and incorporated into the PACA database
None None
prOgraMME 1: adMinisTraTiOn (COnTinuEd)

38
sTraTEgiC ObjECTiVE
pErfOrManCE indiCaTOr
basElinE annual TargET 2015/16
prOgrEss/ aChiEVEMEnT againsT TargET
COMMEnTs (ChallEngEs/ExplanaTiOns On VarianCEs)
COrrECTiVE MEasurEs
Effective knowledge and information management for the sector
Number of environmental knowledge and information management systems developed and implemented
Approval of the Bid Specification Committee for the South African National Environmental Information Meta-Database Project
SA National Environ-mental Information Meta-Database Phase I – Scoping Project completed
SA National Environmental Information Meta-Database Phase I – Scoping Project was completed
None None
Enhanced international cooperation supportive of SA environmental /sustainable development priorities
Number of South Africa’s International Environment and Sustainable Development negotiating positions developed and negotiated
Climate Investment funds; UNFCCC long term finance; Green Climate fund and Adaptation Fund
2 Climate change positions for formal international engagements (UN-FCCC and IPCC) approved
2 Climate change positions for formal international engagements approved (UNFCCC and IPCC )
None None
Positions prepared, negotiated and reported for: Ramsar Convention UNCCD IPBES
4 Biodiversity po-sitions developed (WHC; Ramsar; UNCCD & AEWA)
4 Biodiversity positions developed None None
4 chemicals and waste position papers developed
5 chemicals and waste position pa-pers developed
7 chemicals and waste position papers developed
Planned target exceeded by a variance of 40%. Exceeding the target had no impact on resources earmarked for other priorities
None
prOgraMME 1: adMinisTraTiOn (COnTinuEd)

DEPARTMENT OF ENVIRONMENTAL AFFAIRS ANNUAL REPORT 2015/1639
sTraTEgiC ObjECTiVE
pErfOrManCE indiCaTOr
basElinE annual TargET 2015/16
prOgrEss/ aChiEVEMEnT againsT TargET
COMMEnTs (ChallEngEs/ExplanaTiOns On VarianCEs)
COrrECTiVE MEasurEs
Enhanced international cooperation supportive of SA environmental /sustainable development priorities
Number of South Africa’s International Environment and Sustainable Development negotiating positions developed and negotiated
Cabinet approval to evaluate the possibility of trade in rhino horn as part of interventions to reduce poaching
Report on recom-mendations on a possible trade in rhino finalised and approved by Cabinet
Report on recommendations on a possible trade in rhino finalised and submitted to Cabinet for consideration
Report submitted to Cabinet in the 4h quarter following a consultative process and had to wait for next meeting of Cabinet for consideration and final decision
Cabinet considered and approved the report at its meeting on 13 April 2016
Number of International Environmental Management engagements coordinated
N/A 16 Bilateral / Pleu-rilateral engage-ments coordinated (Africa, BRICS, S-S, S-N)
24 International Environmental Management engagements (Bilateral / Pleurilateral) were coordinated:
• Africa engagements
• South-South
• North-South
• BRICS (Moscow),
• GEF Projects
Planned target exceeded by a variance of 50%. Exceeding the target had no impact on resources earmarked for other priorities
None
N/A 3 Multilateral engagements coor-dinated (IEG)
17 Multilateral engagements coordinated and briefing notes prepared
Planned target exceeded with a variance of 14 additional multilateral engagements. These had no impact on resources earmarked for other priorities as the work is carried out through internal human resource capacity within DEA
None
N/A 3 Sustainable Devel-opment engage-ments coordinated
5 Sustainable Development engagements coordinated (HLPF, BRICS, WEF-Africa, UNGA / Post-2015 Summit & GoF47 and GRI & IRP meetings)
Planned target exceeded by a variance of 67%. Exceeding the target had no impact on resources earmarked for other priorities
None
prOgraMME 1: adMinisTraTiOn (COnTinuEd)

40
sTraTEgiC ObjECTiVE
pErfOrManCE indiCaTOr
basElinE annual TargET 2015/16
prOgrEss/ aChiEVEMEnT againsT TargET
COMMEnTs (ChallEngEs/ExplanaTiOns On VarianCEs)
COrrECTiVE MEasurEs
Enhanced international cooperation supportive of SA environmental /sustainable development priorities
South Africa’s preparations for hosting of the CITES CoP17 coordinated
CITES CoP17 Local Organising Committee established
Local Organising Committee Action Plan for hosting of CITES CoP17 finalised
Local Organising Committee Action Plan for hosting of CITES CoP17 finalised
None None
Mandatory international reports prepared and submitted within time frame
Second National Communication submitted to the UNFCCC
Draft Third National Communication developed
Draft Third National Communication developed
None None
GHG Inventory 2000-2010 finalised
Draft Second Bi-ennial
Update Report developed
Draft Second Bi-ennial Update Report developed
None None
National reports developed and submitted
5 National reports submitted:
• Cartagena Protocol
• WHC
• MAB Programme
• AEWA
• TFCA country report
5 National reports submitted:
• Cartagena Protocol
• WHC
• AEWA
• TFCA country report
• MAB Programme
None None
Annual London Convention dumping report submitted
Annual London Convention dump-ing report submit-ted
Annual London Convention dumping report compiled and submitted to the Secretariat of the Convention
None None
2013/14 NEMA S26 report tabled in Parliament
2014/15 NEMA S26 report tabled in Parliament
2014/15 NEMA S26 report tabled in Parliament
None None
prOgraMME 1: adMinisTraTiOn (COnTinuEd)

DEPARTMENT OF ENVIRONMENTAL AFFAIRS ANNUAL REPORT 2015/1641
suMMary Of prOgraMME pErfOrManCE: adMinisTraTiOn Summary of Programme Performance: The Annual Performance Plan of this Programme for the 2015/16 financial year included a total of 67 annual targets. A total of 58 annual targets (87%) of the planned 67 were achieved. Eight annual targets (12%) were partially achieved (i.e. even though the actual target was not achieved, there was significant progress made towards the planned annual targets) and one annual target (1%) was not achieved as there were significant delays on that area of work. The specific details and circumstances which resulted in delays and non-achievement of planned annual targets have been provided in the detailed report above. These includes the planned corrective measures which the department will implement to address the challenges/delays.

42
prOgraMME 2: lEgal auThOrisaTiOns COMplianCE and EnfOrCEMEnTThe purpose of the Programme is to promote the development and implementation of an enabling legal regime and licensing/ authorisation system to ensure enforcement and compliance with environmental law. The programme is made-up of six subprogrammes which are as follows: (1) Legal, Authorisations and Compliance Management (2) Integrated Environmental Authorisations (3) Compliance Monitoring (4) Enforcement (5) Corporate Legal Support and Litigation (6) Law Reform and Appeals.
sTraTEgiC ObjECTiVE
pErfOrManCE indiCaTOr
basElinE annual TargET 2015/16
prOgrEss/ aChiEVEMEnT againsT TargET
COMMEnTs (ChallEngEs/ExplanaTiOns On VarianCEs)
COrrECTiVE MEasurEs
Improved compliance with environmental legislation
Percentage of administrative enforcement actions resulting in compliance
75% 80% 75% (208/277) Planned target missed by a variance of 5%. Performance indicator measures impact of administrative enforcement actions/desired level of compliance expected from industry
Performance/levels of compliance is not within the control of DEA
Number of environmental Administrative enforcement actions issued
N/A 180 245 Planned target exceeded by a variance of 36%. Exceeding the target had no impact on resources earmarked for other priorities
None
Number of criminal cases finalised and dockets handed over to the NPA
24 28 31 Planned target exceeded by a variance of 11%. Exceeding the target had no impact on resources earmarked for other priorities
None
Number of environmental authorisations inspected for compliance
125 140 158 Planned target exceeded by a variance of 13%. Exceeding the target had no impact on resources earmarked for other priorities
None
Number of joint compliance operations conducted
N/A 7 19 Planned target exceeded by a variance of 171%. Exceeding the target had no impact on resources earmarked for other priorities
None

DEPARTMENT OF ENVIRONMENTAL AFFAIRS ANNUAL REPORT 2015/1643
sTraTEgiC ObjECTiVE
pErfOrManCE indiCaTOr
basElinE annual TargET 2015/16
prOgrEss/ aChiEVEMEnT againsT TargET
COMMEnTs (ChallEngEs/ExplanaTiOns On VarianCEs)
COrrECTiVE MEasurEs
Improved compliance with environmental legislation
Number of officials trained in environmental compliance and enforcement
260 280 630 Planned target exceeded by a variance of 125%. Target over achieved by bringing forward training which was planned to be conducted in future years. Exceeding the target had no impact on resources earmarked for other priorities. Project implemented in partnership with donor funder( GEF) which covered expenses
None
Number of environmental Compliance promotion campaigns conducted
N/A 5 23 Planned target exceeded by an additional 18 campaigns. Exceeding the target had no impact on resources earmarked for other priorities
None
prOgraMME 2: lEgal auThOrisaTiOns COMplianCE and EnfOrCEMEnT (COnTinuEd)

44
sTraTEgiC ObjECTiVE
pErfOrManCE indiCaTOr
basElinE annual TargET 2015/16
prOgrEss/ aChiEVEMEnT againsT TargET
COMMEnTs (ChallEngEs/ExplanaTiOns On VarianCEs)
COrrECTiVE MEasurEs
Improved compliance with environmental legislation
Number of interventions implemented in support of the integrated strategic management of Rhino populations
1 intervention implemented for the safety and security of wildlife including rhinos
MoU with SSA
Key negotiations with strategic government partners
4 interventions implemented: Multilaterals and Bilateral interventions implemented
4 interventions in support of the integrated strategic management of Rhino implemented. Coordinated and participated in the following multilateral and bilateral forums, committees and meetings to enhance interventions aimed at improved the protection of Rhinos:
• The Rhino Elephant Security Group meeting in Tanzania to strengthen ties between countries that participates in the Interpol Environmental Crime Working Group;
• DEA ,SANParks and SAPS bilateral to DEAl with the outcomes of the Firearms raid undertaken in the KNP;
• Ongoing participation in the Mission Area Joint Operations Centre (MAJOC) commissioned in the KNP;
• Rhino Protection Programme Steering Committee meetings
• Border Management Agency establishment Task Team sessions
• Cross Border Roads and Transport Agency (CBRTA) activities
• South Africa/ Tanzania information sharing study tour
• Vietnam Youth Trail Programme
None None
prOgraMME 2: lEgal auThOrisaTiOns COMplianCE and EnfOrCEMEnT (COnTinuEd)

DEPARTMENT OF ENVIRONMENTAL AFFAIRS ANNUAL REPORT 2015/1645
sTraTEgiC ObjECTiVE
pErfOrManCE indiCaTOr
basElinE annual TargET 2015/16
prOgrEss/ aChiEVEMEnT againsT TargET
COMMEnTs (ChallEngEs/ExplanaTiOns On VarianCEs)
COrrECTiVE MEasurEs
Improved compliance with environmental legislation
Number of interventions implemented in support of the integrated strategic management of Rhino populations
1 intervention implemented for the safety and security of wildlife including rhinos
MoU with SSA
Key negotiations with strategic government partners
Law enforcement and other joint collaborations coordinated
Law enforcement and other joint collaborations coordinated as follows:
• SA-Mozambique Joint Management Committee meetings (implementation of MOU)
• Mission Area Joint Operations Centre (MAJOC) operations
• Eastern Cape Priority Crimes Committee on Wildlife in February 2016
• National Joint Operations (NATJOINTS)
• Priority Committee on Wildlife Crime
• Private Rhino Owners Workshop
• Intelligence Working Group
None None
Database/ wildlife information system framework developed
Wildlife information system framework developed
None None
Study on impacts of Rhino pouching and opportunities For development of wildlife economies conducted
Studies concluded reports submitted to the Executive Authority
None None
prOgraMME 2: lEgal auThOrisaTiOns COMplianCE and EnfOrCEMEnT (COnTinuEd)

46
sTraTEgiC ObjECTiVE
pErfOrManCE indiCaTOr
basElinE annual TargET 2015/16
prOgrEss/ aChiEVEMEnT againsT TargET
COMMEnTs (ChallEngEs/ExplanaTiOns On VarianCEs)
COrrECTiVE MEasurEs
Coherent and aligned multi-sector regulatory system and decision support across Government
Number of interventions for streamlining environmental authorisation/ management developed
2 additional IEM Instruments evaluated, adjusted or developed
4 additional IEM Instruments developed: Adoption regulations Gazetted
Adoption regulations (called instrument regulations) processed for gazetting have been developed and approved by MINMEC
More time than anticipated was needed for consultation
Regulations submitted to Minister for consideration and gazetting
NEMA/SEMA Law reform concept document
NEMA/SEMA Law reform concept document developed
None None
Gazetted outputs for SIP8
Outputs for SIP8 – Wind Solar developed and processed for gazetting.
None None
Exception listing notice
Exception listing notice developed None None
N/A 24H regulations gazetted for implementation
24H regulations finalised and submitted to the Executive Authority for gazetting for implementation
Additional time needed to undertake further consultation on the regulations
Regulations submitted to Executive Authority for consideration and gazetting
3 Interventions for Streaming environmental authorisations for SIP and IPAP priorities under development
2 Strategic Environmental Management initiatives implemented :
• Shale gas : Environmental attributes, baseline stakeholder consultation conducted
2 stakeholder engagements conducted
None None
prOgraMME 2: lEgal auThOrisaTiOns COMplianCE and EnfOrCEMEnT (COnTinuEd)

DEPARTMENT OF ENVIRONMENTAL AFFAIRS ANNUAL REPORT 2015/1647
sTraTEgiC ObjECTiVE
pErfOrManCE indiCaTOr
basElinE annual TargET 2015/16
prOgrEss/ aChiEVEMEnT againsT TargET
COMMEnTs (ChallEngEs/ExplanaTiOns On VarianCEs)
COrrECTiVE MEasurEs
Coherent and aligned multi-sector regulatory system and decision support across Government
Number of interventions for streamlining environmental authorisation/ management developed
3 Interventions for Streaming environmental authorisations for SIP and IPAP priorities under development
• Draft sensitivity map for the aquaculture SEA developed
Inception meeting for the aquaculture SEA held and first phase of information collection has been initiated
The project is a joint initiative with the Dept. of Agriculture, Forestry and Fisheries and consultation was required on the development of the terms of reference and this required more time
The required consultation to agree the TOR has been conducted and the project currently underway
N/A Strategic Infrastructure Projects (SIPs) implemented: Strategic Environmental Assessments (SEA) interventions – Phase 1 of the Solar and Wind SEAs finalised
Final SEA document for SIP 8 Wind and Solar Available
None None
SIP 10 Electricity transmission – Draft corridors identified
SIP 10 Electricity Transmission final corridors identified
None None
Draft of the site protocol for SEA on the SKA prepared
First draft of specialist reports containing the information of which the protocol will be developed has been prepeared
The specialists have had difficulty in accessing the forms on which the assessments were to be undertaken
The draft protocol is anticipated to be available in July 2016
TORs for phase 2 of SIP 8(b) Approved
TORs for Phase 2 of SIP8(b) approved
None None
prOgraMME 2: lEgal auThOrisaTiOns COMplianCE and EnfOrCEMEnT (COnTinuEd)

48
sTraTEgiC ObjECTiVE
pErfOrManCE indiCaTOr
basElinE annual TargET 2015/16
prOgrEss/ aChiEVEMEnT againsT TargET
COMMEnTs (ChallEngEs/ExplanaTiOns On VarianCEs)
COrrECTiVE MEasurEs
Coherent and aligned multi-sector regulatory system and decision support across Government
Number of interventions for streamlining environmental authorisation/ management developed
N/A SIP 19 part 1 –TOR finalised and approved
Draft terms of reference for SIP19 Strategic Environmental Assessment (SEA) developed
SIP 19 has not yet been approved and these necessitate a change of focus to the terms of reference (focusing on the land care and the Working For Programmes). The change in approached impacted on timeframes and resulted in delays as further consultation needed to be undertaken
The required consultation work on the revised terms of reference has been undertaken and the terms of reference will be finalises in the early part of 2016/17
Number of environmental sustainability policies reviewed
4 policies and research strategies formulated
Environmental sustainability policy action plan developed
Environmental sustainability policy action plan developed
None None
suMMary Of prOgraMME pErfOrManCE: lEgal auThOrisaTiOns COMplianCE and EnfOrCEMEnT Summary of Programme Performance: The Annual Performance Plan of this Programme for the 2015/16 financial year had a total of 16 annual targets. A total of 11 annual targets (69%) of the planned 16 were achieved. The remaining five annual targets (31%) were partially achieved. The challenges which resulted in the non-achievement of the planned annual targets and corrective interventions have been identified.
prOgraMME 2: lEgal auThOrisaTiOns COMplianCE and EnfOrCEMEnT (COnTinuEd)

DEPARTMENT OF ENVIRONMENTAL AFFAIRS ANNUAL REPORT 2015/1649
prOgraMME 3: OCEans and COasTsThe purpose of the Programme is to promote, manage and provide strategic leadership on oceans and coastal conservation. The programme is made-up of five sub programmes which are as follows: (1) Oceans and Coasts Management (2) Integrated Coastal Management (3) Oceans and Coastal Research (4) Oceans Conservation (5) Specialist Monitoring Services.
sTraTEgiC ObjECTiVE
pErfOrManCE indiCaTOr
basElinE annual TargET 2015/16
prOgrEss/ aChiEVEMEnT againsT TargET
COMMEnTs (ChallEngEs/ExplanaTiOns On VarianCEs)
COrrECTiVE MEasurEs
Threats to environmental quality and integrity managed
National Coastal Management Programme interventions implemented
Draft National Coastal Management Programme (NCMP) developed
Situational analysis report on coastal rehabilitation developed
Situational analysis report on coastal rehabilitation developed
None None
N/A Draft National norms and standards for coastal management setback lines developed
Final draft of the National Norms and Standards developed
None None
Number of priority areas with coastal access
Draft coastal area strategy developed
Stakeholder consultation for designation of coastal access for 3 priority areas finalised
Stakeholder Consultations for three identified priority areas (Eerste Rivier, Ballots Bay and Alexander Bay) for Coastal access land/sites finalised
None None
Ocean and coastal management strategies and plans developed and implemented
NPOA for protection of the marine environment from Land-based sources of pollution
National review of coastal effluent disposal completed
National review of coastal effluent disposal completed
None None

50
sTraTEgiC ObjECTiVE
pErfOrManCE indiCaTOr
basElinE annual TargET 2015/16
prOgrEss/ aChiEVEMEnT againsT TargET
COMMEnTs (ChallEngEs/ExplanaTiOns On VarianCEs)
COrrECTiVE MEasurEs
Threats to environmental quality and integrity managed
Ocean and coastal management strategies and plans developed and implemented
No comprehensive strategy for Antarctica
Draft Antarctic strategy developed
Draft Antarctic strategy developed ( first part of strategy – Report on Economic Study)
None None
National Ocean and Coast spatial plan framework submitted to 3D - Audit initiated for key datasets linking to fundamental elements of OCSP
National Framework on Marine Spatial Planning approved
National Framework on Marine Spatial Planning approved
None None
Strengthened knowledge, science and policy interface
Number of peer-reviewed scientific publications (including theses and research policy reports )
15 peer-reviewed publications (including theses)
20 peer-reviewed scientific publications (including theses)
26 scientific publications peer-reviewed
Planned target exceeded by a variance of 30%. Exceeding the target had no impact on resources earmarked for other priorities
None
Marine top predator population estimates and ecological studies undertaken (Including climate change)
Seabird population estimates for: 12 species around SA (annually) 1 Southern Ocean species (cumulative)
Population estimates of 12 mainland seabird breeding species
Population estimates undertaken for all the 12 birds species plus 1 new Species Southern Ocean Species (Rock Hopper Penguin)
None None
Annual seal pup counts undertaken
80% of seal pup counts completed (based on 2014/15 data)
100% (18 out of 18) seal pup colonies' counts completed
Planned target exceeded by a variance of 25%. Exceeding the target had no impact on resources earmarked for other priorities
None
prOgraMME 3: OCEans and COasTs (COnTinuEd)

DEPARTMENT OF ENVIRONMENTAL AFFAIRS ANNUAL REPORT 2015/1651
sTraTEgiC ObjECTiVE
pErfOrManCE indiCaTOr
basElinE annual TargET 2015/16
prOgrEss/ aChiEVEMEnT againsT TargET
COMMEnTs (ChallEngEs/ExplanaTiOns On VarianCEs)
COrrECTiVE MEasurEs
Strengthened knowledge, science and policy interface
Marine top predator population estimates and ecological studies undertaken (Including climate change)
Evaluate and refine methods of whale population estimation appropriate to South Africa and adjacent high seas undertaken
1 top predator ecological study per annum (cetaceans, sharks or turtles)
2 whale cruises conducted Planned annual target exceeded by a variance of 100%. Exceeding the target had no impact on resources earmarked for other priorities
None
Ocean and coast research, survey and monitoring projects undertaken
N/A National Plankton Monitoring Protocol completed
South African National Plankton Monitoring Protocol (SAMPoMP) completed
None None
N/A Terms of Reference for study on effectiveness of MPAs finalised
Terms of reference for MPA Effectiveness study finalised
None None
3 surveys of priority habitats (cumulative)
One survey of a new priority habitat and two areas resurveyed
6 priority area surveyed (Protea Banks, Inshore Eastern Cape Rocky Shore Intertidal Survey, south coast Robberg MPA Survey, Biodiversity sampling undertaken during the Marion on Marion Island Voyage, Betty’s Bay MPA and Cape Canyon off Saldanha). 2 re-surveys (De Hoop MPA)
Planned annual target exceeded additional 5 surveys. Exceeding the target had no impact on resources earmarked for other priorities
None
4 Observation platform deployed and maintained
3 Moorings deployed along SAMBA Oceanographic Observation Line
3 moorings deployed along South East Atlantic Ocean (SAMBA Oceanographic Line)
Planned annual target was exceeded with a deployment of 4 additional moorings. Exceeding the target had no impact on resources earmarked for other priorities
None
prOgraMME 3: OCEans and COasTs (COnTinuEd)

52
sTraTEgiC ObjECTiVE
pErfOrManCE indiCaTOr
basElinE annual TargET 2015/16
prOgrEss/ aChiEVEMEnT againsT TargET
COMMEnTs (ChallEngEs/ExplanaTiOns On VarianCEs)
COrrECTiVE MEasurEs
Strengthened knowledge, science and policy interface
Ocean and coast research, survey and monitoring projects undertaken
4 Observation platform deployed and maintained
3 Moorings deployed along ASCA Oceanographic Observation
• 4 deep moorings deployed along South West Indian Ocean (ASCA Line)
• 2 shallow moorings in ASCA.
• 1 Shallow mooring in the South Coast
Planned annual target was exceeded with a deployment of 4 additional moorings. Exceeding the target had no impact on resources earmarked for other priorities
None
SCOR Science Plan for International Indian Ocean Expedition 2
South African Science plan for Indian Ocean Research Cruises developed
The South African Science Plan for the Second International Indian Ocean Expedition (IIOE2) finalised
None None
Ocean and coast research, survey and monitoring projects undertaken
1 Coastal research project completed
1 coastal research project completed per annum (Phase 3 Coastal Vulnerability study)
1 coastal research project completed (Phase 3 Coastal Vulnerability completed)
None None
Number of relief voyages to remote stations (Antarctica and Islands) undertaken
3 relief voyages undertaken
3 relief voyages per annum undertaken)
3 relief voyages undertaken None None
Ecosystems conserved, managed and sustainably used
Number of Estuary Management Plans developed
20 estuary management plans developed
2 Additional Estuarine Management Plans developed
2 Estuarine Management Plans developed ( Buffalo River Estuary in East London and Hartenbos estuary in Namaqua district municipality)
None None
prOgraMME 3: OCEans and COasTs (COnTinuEd)

DEPARTMENT OF ENVIRONMENTAL AFFAIRS ANNUAL REPORT 2015/1653
sTraTEgiC ObjECTiVE
pErfOrManCE indiCaTOr
basElinE annual TargET 2015/16
prOgrEss/ aChiEVEMEnT againsT TargET
COMMEnTs (ChallEngEs/ExplanaTiOns On VarianCEs)
COrrECTiVE MEasurEs
Ecosystems conserved, managed and sustainably used
Percentage of Exclusive Economic Zone under Marine Protected Areas
2% (30 000/1 500 000 Km2 ) of EEZ protected
4 287.532 sq.km (0.4% of EEZ) maintained as MPAs and MPA regulations developed for Public comment
4 287.532 sq.km (0.4% of EEZ) maintained as MPAs. 22 MPAs network gazetted for public comments. Consultation on the draft regulations undertaken
None None
Enhanced sector monitoring and evaluation
State of Environment report on Oceans and Coasts published
State of the Oceans Report compiled
Annual report card on key ocean and coasts indicators compiled
Annual report card on key Ocean and coasts indicators compiled
None None
Oceans and Coasts’ Monitoring and evaluation programme developed and implemented
N/A National Oceans & Coasts Water Quality Monitoring Programme developed and piloted in Port St Johns
Draft concept document for oceans and coasts water quality monitoring programme developed. Programme piloted in Port St Johns
Development of National Oceans and Coasts Water Quality Monitoring Programme required more time than anticipated. Benchmarking with other countries (with similar challenges) needs to be made to inform South African’s approach. Stakeholders consultation on the on the concept document needed) as there are many marine water quality monitoring initiatives that need to be standardized
Process to be fast tracked in the next financial year
prOgraMME 3: OCEans and COasTs (COnTinuEd)

54
suMMary Of prOgraMME pErfOrManCE: OCEans and COasTsSummary of Programme Performance: The Annual Performance Plan of this Programme for the 2015/16 financial year had a total of 21 annual targets. A total of 20 annual targets (95%) of the planned 21 were achieved. The remaining one annual target (5%) was partially achieved. The challenges which resulted in the non-achievement of the planned annual target and corrective interventions have been identified.

DEPARTMENT OF ENVIRONMENTAL AFFAIRS ANNUAL REPORT 2015/1655
prOgraMME 4: CliMaTE ChangE and air QualiTyThe purpose of the Programme is to improve air and atmospheric quality, lead and support, inform, monitor and report efficient and effective international, national and significant provincial and local responses to climate change. The programme is made-up of seven sub programmes which are as follows: (1) Climate Change Management (2) Climate Change Mitigation (3) Climate Change Adaptation (4) Air Quality Management (5) South African Weather Service (6) International Climate Change Relations and Negotiations (7) Climate Change Monitoring and Evaluation.
sTraTEgiC ObjECTiVE
pErfOrManCE indiCaTOr
basElinE annual TargET 2015/16
prOgrEss/ aChiEVEMEnT againsT TargET
COMMEnTs (ChallEngEs/ExplanaTiOns On VarianCEs)
COrrECTiVE MEasurEs
Threats to environmental quality and integrity managed
Climate Change Regulatory Framework and tools developed and Implemented
Long term adaptation scenarios and draft adaptation plans for key sectors
Discussion document for the National Climate Change Response Bill published
Discussion document for National Climate Change Response Bill in place but not yet published. Presentation prepared to be presented in IGCCC before being published
The IGCCC recommended that DEA convenes an intergovernmental IGCCC workshop in May 2016 to enhance the discussion document prior to publication for public comments
The discussion document will be published for public comments following the May 2016 IGCCC Workshop
National Framework for Climate Services developed and implemented
Global Framework for Climate Services Roadmap for Development of NFCS
National Framework for Climate Services finalised
National Framework of Climate Services finalised
None None
Provincial and Local Government Climate Change Adaptation Programme implemented
2 capacity building and 3 Adaptation climate change awareness events conducted per annum
Lets’ Respond Toolkit rolled out in 40 Municipalities
Let’s Respond Toolkit rolled out to a total of 74 municipalities in the performance cycle
Planned target exceeded with a variance of 85%. Exceeding the target had no impact on resources earmarked for other priorities
None

56
sTraTEgiC ObjECTiVE
pErfOrManCE indiCaTOr
basElinE annual TargET 2015/16
prOgrEss/ aChiEVEMEnT againsT TargET
COMMEnTs (ChallEngEs/ExplanaTiOns On VarianCEs)
COrrECTiVE MEasurEs
Threats to environmental quality and integrity managed
Provincial and Local Government Climate Change Adaptation Programme implemented
N/A Resilient Cities programme developed
Resilient Cities programme developed. The following activities facilitated as part of supporting implementation of Resilient Cities programme:
• Meeting hosted with CSIR on 29 January 2016 to discuss the incorporation of Cities Resilient work into the Urban Knowledge Hub.
• Concept note developed and awaiting approval at the Cities Resilience workshop scheduled to take place in the first quarter of the next financial year.
• Cities Resilient presented at the Technical Working Group (TWG) meeting of 30 March 2016
None None
N/A 3 Provincial Climate change adaptation response strategies/ plans developed (Limpopo; Mpumalanga & North West)
• Provincial Climate change adaptation response strategies developed for 3 provinces (Limpopo; Mpumalanga and North West)
None None
Number of sector mitigation potential and impact studies conducted
5 studies conducted
2 studies:
Phase 1 National Carbon Sinks Atlas finalised
Final report on Phase 1 Carbon Sink Atlas produced and the draft sinks atlas (Phase 1) developed
None None
prOgraMME 4: CliMaTE ChangE and air QualiTy (COnTinuEd)

DEPARTMENT OF ENVIRONMENTAL AFFAIRS ANNUAL REPORT 2015/1657
sTraTEgiC ObjECTiVE
pErfOrManCE indiCaTOr
basElinE annual TargET 2015/16
prOgrEss/ aChiEVEMEnT againsT TargET
COMMEnTs (ChallEngEs/ExplanaTiOns On VarianCEs)
COrrECTiVE MEasurEs
Threats to environmental quality and integrity managed
Number of sector mitigation potential and impact studies conducted
5 studies conducted
Draft user-friendly greenhouse gas mitigation potential analysis model developed
Draft user-friendly greenhouse gas mitigation potential analysis model developed
None None
Number of Climate Change Response Policy interventions implemented
Mapping existing relevant research, Planning and modelling processes concluded
3 Interventions implemented: TORs for updating DEROs, and Carbon Budgets (2021 – 2025 & 2026 – 2030)
Terms of reference approved. GIZ is in a process of appointing of the service provider
None None
A carbon budgets/ carbon tax report has been produced
Pollution prevention plans for carbon budgets ( 2016 - 2020) approved
Carbon budgets have been allocated to 9 companies that have submitted sufficient data. Executive Authority approved the publication of the Draft Notice to declare GHG as Priority Pollutants and National Pollution Prevention Plans Regulations for final public comments
Draft notice to declare GHG as Priority Pollutants and National Pollution Prevention Plans Regulations will be published in early 2016 as most of the stakeholders were unavailable in the last month of the 3rd quarter of 2015/16
The Draft Notice to declare GHG as Priority Pollutants and National Pollution Prevention Plans Regulations is to be published in 2016/17
99% of allocated funds (about R790 million of the R800 million) committed to 34 Projects inclusive of 16 research and development initiative
4 quarterly Green Fund implementation reports prepared (Green Fund implementation/coordination
4 quarterly reports on implementation of Green Fund projects produced
None None
prOgraMME 4: CliMaTE ChangE and air QualiTy (COnTinuEd)

58
sTraTEgiC ObjECTiVE
pErfOrManCE indiCaTOr
basElinE annual TargET 2015/16
prOgrEss/ aChiEVEMEnT againsT TargET
COMMEnTs (ChallEngEs/ExplanaTiOns On VarianCEs)
COrrECTiVE MEasurEs
Negative impacts on health and wellbeing minimised
National adaptation strategy developed and implementation facilitated
Long term adaptation scenarios and draft adaptation plans for key sectors
Draft National Climate Change Adaptation Strategy/Plan for South Africa developed
Draft National Climate Change Adaptation Strategy developed
None None
Number of sector adaptation plans finalised and implementation facilitated
Scoping report to support policy alignment for climate change adaptation, and draft sector adaptation plans
Implementation of 5 Climate Change Adaptation Sector plans facilitated:
• Agriculture• Water• Health• Rural Settlement• Biodiversity
Implementation of 4 Climate Change Adaptation Sector plans facilitated and progress report prepared.
Facilitation of planned activities for the agriculture sector plan not undertaken due to challenges with availability of stakeholders
Further consultation on outstanding activities for the agriculture sector to be undertaken 2016/17
Number of Climate Change Risk Analysis and Adaptation studies conducted
Long-term Adaptation Scenario Phase 1 completed for 5 sectors (Water, Agriculture, Biodiversity, Marine Fisheries and Health)
Climate Change Risk Analysis for 2 provinces conducted
Climate Change Risk Analysis and Vulnerability Assessment Reports have been finalised for 2 provinces; Free State and Northern Cape
None None
Situational analysis and needs assessment (SANAS) of provincial CC response planning and adaptive capacity
Provincial Climate Change situational analysis and needs assessment (SANAS) finalised
SANAs report has been finalised None None
prOgraMME 4: CliMaTE ChangE and air QualiTy (COnTinuEd)

DEPARTMENT OF ENVIRONMENTAL AFFAIRS ANNUAL REPORT 2015/1659
sTraTEgiC ObjECTiVE
pErfOrManCE indiCaTOr
basElinE annual TargET 2015/16
prOgrEss/ aChiEVEMEnT againsT TargET
COMMEnTs (ChallEngEs/ExplanaTiOns On VarianCEs)
COrrECTiVE MEasurEs
Negative impacts on health and wellbeing minimised
Improvement in the National Air Quality Indicator
0.972 1.30 National Air Quality Indicator: 0.79 Planned target exceeded with a low margin. Performance lower than the planned target is iDEAl as it indicates an improvement in the quality of air. Exceeding the target had no impact on resources earmarked for other priorities
None
Number of air quality monitoring stations reporting to SAAQIS
85 (72 Government owned)
100 government owned air quality monitoring stations reporting to SAAQIS
145 stations (116 Government and 29 Industry owned stations) reporting to SAAQIS
Planned target exceeded with a variance of 45%. Exceeding the target had no impact on resources earmarked for other priorities
None
Number of air quality monitoring stations meeting minimum data requirements (80% data recovery)
N/A 40 air quality monitoring stations meeting a minimum of 80% data recovery
22 air quality monitoring stations are currently meeting minimum data requirements (80% data recovery)
Planned target of 40 stations reporting data recovery of 80% was not achieved. A number of network owners are facing challenges in operating the stations due to limited technical capacity
DEA has initiated a comprehensive 4-day Ambient Monitoring Course together with NACA. The course has been offered to all provinces. DEA is also providing additional support through the procurement of data loggers and instruments (through SAWS MoU) for installation in monitoring stations without these equipment. In addition, DEA will be engaging with HOD and municipal managers in order to find a common resolution to these challenges
prOgraMME 4: CliMaTE ChangE and air QualiTy (COnTinuEd)

60
sTraTEgiC ObjECTiVE
pErfOrManCE indiCaTOr
basElinE annual TargET 2015/16
prOgrEss/ aChiEVEMEnT againsT TargET
COMMEnTs (ChallEngEs/ExplanaTiOns On VarianCEs)
COrrECTiVE MEasurEs
Negative impacts on health and wellbeing minimised
Percentage of facilities with Atmospheric Emission Licences reporting to the National Atmospheric Emissions Inventory System (NAEIS)
N/A 50% of facilities with AELs reporting to the NAEIS
68% (800/1176) of the registered facilities with AEL have reported to the NAEIS
Planned target exceeded with a variance of 36%. Exceeding the target had no impact on resources earmarked for other priorities
None
Air Quality Regulatory Framework and tools developed and implemented
S21 Amended S23 small boilers promulgated Dust and modelling regs 2 Draft offset policy developed
Draft S23 – Small Scale Charcoal Plants Declaration as Controlled Emitters
Small-Scale charcoal plants have been declared controlled emitters by the Executive Authority
None None
prOgraMME 4: CliMaTE ChangE and air QualiTy (COnTinuEd)

DEPARTMENT OF ENVIRONMENTAL AFFAIRS ANNUAL REPORT 2015/1661
sTraTEgiC ObjECTiVE
pErfOrManCE indiCaTOr
basElinE annual TargET 2015/16
prOgrEss/ aChiEVEMEnT againsT TargET
COMMEnTs (ChallEngEs/ExplanaTiOns On VarianCEs)
COrrECTiVE MEasurEs
Negative impacts on health and wellbeing minimised
Air Quality Regulatory Framework and tools developed and implemented
2 AQMPs under implementation (Highveld and Vaal Triangle). Waterberg AQMP published in the gazette
Annual plans of 3 Priority Area AQMPs implemented (Highveld, Vaal Triangle Air shed & Waterberg-Bojanala)
2015/16 Annual Plan plans for 3 AQMPs (Highveld; Waterberg-Bojanala and Vaal Triangle Airshed) implemented and an annual priority area progress report was prepared
• Waterberg Bojanala Priority Area AQMP was published on 09 December 2015. (Gazette number 39489, No. 1207)
• Waterberg Bojanala Priority Area (WBPA) Implementation Task Team has been established and progress is available. The 2016/17 annual implementation plan has been compiled
• Priority Area Implementation team hosted a meeting with WBPA Authorities, on the 10 December 2015, to start with implementation of WBPA AQMP
• Planned annual activities for the Highveld, Vaal Triangle AQMP facilitated and quarterly reports prepared
None None
Enhanced sector monitoring and evaluation
Framework for reporting on greenhouse gas emissions by industry developed and reports compiled
National Climate Change Response White Paper
Annual CC M&E reports published
Annual CC M&E report finalised (individual chapters) but not yet published
Section on COP 21 outcomes had to wait for the COP 21 conference in December 2015 before it could be written and finalised
Annual CC M&E report to be published in 2016-17 financial year
2000 – 2012 GHG Inventory developed
2000 – 2012 GHG Inventory First Order Draft finalised
None None
prOgraMME 4: CliMaTE ChangE and air QualiTy (COnTinuEd)

62
suMMary Of prOgraMME pErfOrManCE: CliMaTE ChangE and air QualiTy Summary of Programme Performance: The Annual Performance Plan of this Programme for the 2015/16 financial year had a total of 22 annual targets. A total of 17 annual targets (77%) of the planned 22 were achieved. The remaining five annual targets (23%) were partially achieved. The challenges which resulted in the non-achievement of the planned annual targets and corrective interventions have been identified.

DEPARTMENT OF ENVIRONMENTAL AFFAIRS ANNUAL REPORT 2015/1663
prOgraMME 5: biOdiVErsiTy and COnsErVaTiOnThe purpose of the Programme is to ensure the regulation and management of all biodiversity, heritage and conservation matters in a manner that facilitates sustainable economic growth and development. The programme is made-up of eight sub programmes which are as follows: (1) Biodiversity and Conservation Management (2) Biodiversity Planning and Management (3) Protected Areas Systems Management (4) iSimangaliso Wetland Park Authority (5) South African National Parks (6) South African National Biodiversity Institute (7) Biodiversity Monitoring and Evaluation (8) Biodiversity Economy and Sustainable Use.
sTraTEgiC ObjECTiVE
pErfOrManCE indiCaTOr
basElinE annual TargET 2015/16
prOgrEss/ aChiEVEMEnT againsT TargET
COMMEnTs (ChallEngEs/ExplanaTiOns On VarianCEs)
COrrECTiVE MEasurEs
Ecosystems conserved, managed and sustainably used
Percentage of land under conservation
10.67% (13 016 461/121 991 200 ha of land under conservation)
11.7% of land under conservation (14 289 772/ 121991200ha)
11.73% of land under conservation (14,300,113.09/121 909 000ha)
None None
Number of additional biodiversity stewardship sites established
Stewardship Guidelines
1 additional stewardship site established
Planned annual target not achieved. Establishment of 1 additional stewardship site still in process. Consultations was done with SANParks, lawyers and members of the Special Wetland Management Association for Nuwejaars held (22-23 February 2016). Consultations ongoing
As a result of a 6 year delay in the process; Landowners (SMA members) expressed uncertainty around the process and were reluctant to amend the completed contracts. Concerns around DEAs support to the implementation of the Nuwejaars Protected Environment (once declared) was also raised
Agreement made for Nuwejaars SMA to submit an updated needs analysis for the establishment of the Nuwerjaars stewardship/PE to DEA to determine a way forward
Percentage of area of state managed protected areas assessed with a METT score above 67%
85% area of state managed protected areas assessed with METT score above 67%
87% of area of state managed protected areas assessed with a METT score above 67%
92.6% of area of state managed protected areas assessed with a METT score above 67%
Planned target exceeded with a variance of 6%. Exceeding the target had no impact on resources earmarked for other priorities
None
Number of tools for the conservation and sustainable use of biodiversity developed and implemented
BMPs for Black Rhino, Albany Cycad and Pelargonium Sidoides gazetted and implemented
2 Biodiversity Management Plans approved (African Lion, White Rhino)
2 Biodiversity Management Plans were gazetted for implementation (The African Lion and White Rhino)
None None

64
sTraTEgiC ObjECTiVE
pErfOrManCE indiCaTOr
basElinE annual TargET 2015/16
prOgrEss/ aChiEVEMEnT againsT TargET
COMMEnTs (ChallEngEs/ExplanaTiOns On VarianCEs)
COrrECTiVE MEasurEs
Improved access, fair and equitable sharing of benefits
Number of community based interventions to promote access to natural resources
4 natural resource based projects initiated (Awelani, Witsieshoek, People and Parks programme and Bushbuckridge)
Bushbuckridge Project Management Unit established
Project Management Unit established
None None
N/A Annual plan for 2014 People and Parks resolutions implemented (50% implementation of resolutions)
Implementation of 2014 People and Parks resolutions facilitated in nine provinces and annual progress report prepared. 51% (15/29) of resolutions implemented as per annual plan
None None
Number of NBEDS annual targets implemented
N/A National Biodiversity Economy Development Strategy approved
National Biodiversity Economy Development Strategy approved
None None
Number of additional World Heritage Sites nominated
N/A 1 additional world heritage site nominated
1 additional world heritage site was nominated
None None
Number of benefit sharing agreements concluded and approved
N/A 5 benefit sharing agreements concluded and approved
1 benefit sharing agreement concluded and approved. 4 benefit sharing agreements submitted to Executive Authority for consideration
4 BABS agreements were prepared and finalised for final consideration and approval. There is a delay in approval of agreements due to necessary shifts in advancing meaningful transformation and beneficiation in new agreements
Process to be fast tracked in the next financial year. Part of the shift in beneficiation modalities will be addressed in the legislative amendments
prOgraMME 5: biOdiVErsiTy and COnsErVaTiOn (COnTinuEd)

DEPARTMENT OF ENVIRONMENTAL AFFAIRS ANNUAL REPORT 2015/1665
sTraTEgiC ObjECTiVE
pErfOrManCE indiCaTOr
basElinE annual TargET 2015/16
prOgrEss/ aChiEVEMEnT againsT TargET
COMMEnTs (ChallEngEs/ExplanaTiOns On VarianCEs)
COrrECTiVE MEasurEs
Improved access, fair and equitable sharing of benefits
Number of natural resource based enterprises established in support of wildlife economy vision 2024
N/A 10 sustainable natural resource based enterprises established
8 sustainable natural resource based enterprises established (Funding for all business plans approved)
Finalisation of 2 enterprises outstanding by the end of the reporting period. Establishment of enterprises follows a comprehensive consultative process to secure buy-in from key stakeholders, sourcing of funding; development and approval of business plans. It is not always possible to accurately project the time it will take to finalise the above key processes
Establishment of 1 of 2 outstanding enterprise finalised in the first quarter of 2016/17. Establishment of the other enterprise will be finalised during the 2016/17 financial year
Strengthened knowledge, science and policy interface
Number of interventions and research programmes aimed at advancing the Biodiversity Science Policy Interface
Draft elephant Research strategy
Elephant research conducted on one focus area of the strategy
Elephant research conducted on the Status quo on Small Elephant Populations in South Africa and report prepared
None None
Number of research/science based policy recommendations finalised
N/A 1 science-based policy recommendation finalised (Intensive breeding)
2 Stakeholder workshops on the intensive breeding of colour variants convened and reports drafted
None None
prOgraMME 5: biOdiVErsiTy and COnsErVaTiOn (COnTinuEd)

66
suMMary Of prOgraMME pErfOrManCE: biOdiVErsiTy and COnsErVaTiOnSummary of Programme Performance: The Annual Performance Plan of this Programme for the 2015/16 financial year had a total of 12 annual target. A total of 9 annual targets (75%) of the planned 12 were achieved. The remaining two annual targets (17%) were partially achieved (i.e. even though the actual target was not achieved, there was however significant progress made towards the planned target) and one annual target (8%) was not achieved as there were significant delays on this area of work. The challenges which resulted in the non-achievement of the target and the corrective interventions have been provided in the detailed performance report.

DEPARTMENT OF ENVIRONMENTAL AFFAIRS ANNUAL REPORT 2015/1667
prOgraMME 6: EnVirOnMEnTal prOgraMMEsThe purpose of the Programme is to implementation of expanded public works and green economy projects in the environmental sector. The programme is made-up of Five (5) sub programmes which are as follows: (1) Environmental Protection and Infrastructure Programme (2) Working for Water and Working on Fire (3) Green Fund (4) Environmental Programmes Management (5) Information Management and Sector Coordination.
sTraTEgiC ObjECTiVE
pErfOrManCE indiCaTOr
basElinE annual TargET 2015/16
prOgrEss/ aChiEVEMEnT againsT TargET
COMMEnTs (ChallEngEs/ExplanaTiOns On VarianCEs)
COrrECTiVE MEasurEs
Improved socio-economic benefits
Number of Full Time Equivalents (FTEs) created
16 706 34 824 28 141 Full Time Equivalents (FTEs) created
Planned target missed by a variance of 19%. Late start of some projects resulted in non-achievement of the planned target
Project implementation will continue in the 2016/17 financial year
Number of Work Opportunities created (% of Women;% of Youth &% of People with Disabilities)
63 378 (Women – 51%; Youth – 63% & People with Disabilities – 1, 86%)
66 150 (Women -55%;) Youth -60% People with Disabilities – 2%)
73 381 work opportunities created Planned target exceeded with a variance of 11%. Exceeding the target had no impact on resources earmarked for other priorities
None
Women 54.07% (39 977.10 / 73 381)
Youth 64.51% (47 338.08/ 73 381)
People with Disabilities 3.79% (2 781.13 / 73 381)
Number of accredited training person days created
84 758 143 665 139 986 accredited training person days created
Delays in project start date impacted on the achievement of planned training person days
Project implementation will continue in 2016/17 and additional training person days created
Number of youths benefiting from the Youth Environmental Service (YES)
963 900 1020 of youths benefiting from the Youth Environmental Service (YES)
Planned annual target exceeded by a variance of 13%. Exceeding the target had no impact on resources earmarked for other priorities
None
Number of SMMEs used (empowerment)
2 949 2 354 2360 SMMEs used Planned target exceeded with a slight variance of 0.3%. Exceeding the target had no impact on resources earmarked for other priorities
None

68
sTraTEgiC ObjECTiVE
pErfOrManCE indiCaTOr
basElinE annual TargET 2015/16
prOgrEss/ aChiEVEMEnT againsT TargET
COMMEnTs (ChallEngEs/ExplanaTiOns On VarianCEs)
COrrECTiVE MEasurEs
Improved socio-economic benefits
Number of School Desk Equivalent
22 424 200 000 143 488 Planned target missed by a variance of 28%.Timber: There was an insufficient supply of the required volume of the right timber (large trees) for processing in the factories. Kiln space: There were significant delays in securing additional kiln space. Conversion rates: The conversion rates of wild timber to finished desks, with the available equipment, is still low. With the proposed remedial measures, significant improvements are envisaged
The required timber is being sourced through partnerships with the forestry industry. Procurement of additional kiln space underway, and partnership developed with the forestry industry and with DAFF for kiln space
Number of buyback and/or recycling facilities created
9 12 12 None None
Number of overnight Visitor, and staff accommodation units established
104 53 51 (33 overnight visitor units and 18 staff accommodation units established). 3 new overnight visitor accommodation building were constructed and 48 units renovated/upgraded
Planned target missed by a variance of 4%. The outstanding 2 units were replaced by doing renovation work on 2 administrative buildings in conservation areas
The outstanding 2 units were replaced by doing work on 2 administrative buildings in conservation areas
Number of Climate Change flagship Programmes facilitated/ coordinated
Long term adaptation scenarios and draft adaptation plans for key sectors
Sector Flagship Framework developed (Renewable Energy)
Renewable Energy flagship framework developed
None None
prOgraMME 6: EnVirOnMEnTal prOgraMMEs (COnTinuEd)

DEPARTMENT OF ENVIRONMENTAL AFFAIRS ANNUAL REPORT 2015/1669
sTraTEgiC ObjECTiVE
pErfOrManCE indiCaTOr
basElinE annual TargET 2015/16
prOgrEss/ aChiEVEMEnT againsT TargET
COMMEnTs (ChallEngEs/ExplanaTiOns On VarianCEs)
COrrECTiVE MEasurEs
Ecosystem conserved, managed and sustainably used
Number of wetlands under rehabilitation
96 120 118 The wetlands rehabilitation programme was transferred from the implementer to DEA. The delays in the process of ceding contracts from the implementer to DEA resulted in the work starting at a later date (September) and less than planned wetlands were therefore rehabilitated
The programme is on-going and rehabilitation of wetlands will continue in 2016/17 rehabilitation
Number of trees planted
50 541 3 030 000 4,331,406 Planned target exceeded by a variance of 43%. Exceeding the target had no impact on resources earmarked for other priorities
None
Number of hectares of land under rehabilitation/ restoration
46 181 25 116 36 380 Planned target exceeded by a variance of 45%. Exceeding the target had no impact on resources earmarked for other priorities
None
Number of community parks created or rehabilitated
27 52 50 ( 38 community parks created and 12 community parks rehabilitated)
Planned target missed by a variance of 2%. Creation of two parks could be finalised due to delays with project start dates
The outstanding community parks will be created in 2016/17
Number of kilometres of accessible coastline cleaned
2 203 2 113 2 113 None None
prOgraMME 6: EnVirOnMEnTal prOgraMMEs (COnTinuEd)

70
sTraTEgiC ObjECTiVE
pErfOrManCE indiCaTOr
basElinE annual TargET 2015/16
prOgrEss/ aChiEVEMEnT againsT TargET
COMMEnTs (ChallEngEs/ExplanaTiOns On VarianCEs)
COrrECTiVE MEasurEs
Threats to environment quality and integrity managed
Number of Environmental Monitors trained and deployed in conservation areas
907 1 441 1 442 Planned target exceeded with a slight margin/variance with no impact on resources earmarked for other priorities
None
Number of emerging invasive alien species targeted for early detection
60 60 74 Planned target exceeded with a variance of 23% Exceeding the target had no impact on resources earmarked for other priorities.
None
Number of sites where biological control agents released
510 525 673 Planned target exceeded with a variance of 28%. Exceeding the target had no impact on resources earmarked for other priorities.
None
Number of initial hectares of invasive alien plants treated
945 276 192 293 192 350 Planned target exceeded with a slight variance of 0.02%. Exceeding the target had no impact on resources earmarked for other priorities.
None
Number of follow-up hectares of invasive alien plants treated
N/A 631 352 686 020 Planned target exceeded with a variance of 9%. Exceeding the target had no impact on resources earmarked for other priorities.
None
Percentage of wild fires suppressed (provided there are not more than 2000)
N/A 90% 100% (total of 1830 fires were reported and suppressed)
Planned target exceeded with a variance of 11%. Exceeding the target had no impact on resources earmarked for other priorities
None
prOgraMME 6: EnVirOnMEnTal prOgraMMEs (COnTinuEd)

DEPARTMENT OF ENVIRONMENTAL AFFAIRS ANNUAL REPORT 2015/1671
sTraTEgiC ObjECTiVE
pErfOrManCE indiCaTOr
basElinE annual TargET 2015/16
prOgrEss/ aChiEVEMEnT againsT TargET
COMMEnTs (ChallEngEs/ExplanaTiOns On VarianCEs)
COrrECTiVE MEasurEs
Threats to environment quality and integrity managed
Number of eradication interventions on emerging invasive alien species
N/A 37 70 eradication interventions on emerging invasive alien species
Planned target exceeded with a variance of 89%. Exceeding the target had no impact on resources earmarked for other priorities.
None
Number of prioritised non-plant invasive species eradicated, managed, controlled or contained
10 12 13 prioritised non-plant invasive species eradicated, managed, controlled or contained
Planned target exceeded with a variance of 8%. Exceeding the target had no impact on resources earmarked for other priorities
None
prOgraMME 6: EnVirOnMEnTal prOgraMMEs (COnTinuEd)

72
suMMary Of prOgraMME pErfOrManCE: EnVirOnMEnTal prOgraMMEs Summary of Programme Performance: The Annual Performance Plan of this Programme for the 2015/16 financial year had a total of 22 annual targets. A total of 16 annual targets 73%) of the planned 22 were achieved. The remaining six annual targets (27%) were partially achieved. The challenges which resulted in the non-achievement of the planned annual targets and corrective interventions have been identified.

DEPARTMENT OF ENVIRONMENTAL AFFAIRS ANNUAL REPORT 2015/1673
prOgraMME 7: ChEMiCals and wasTE ManagEMEnTThe purpose of the Programme is to manage and ensure that chemicals and waste management policies and legislation are implemented and enforced in compliance with chemicals and waste management authorisations, directives and agreements. The programme is made-up of five sub programmes which are as follows: (1) Chemicals and Waste Management (2) Hazardous Waste Management and Licensing (3) General Waste and Municipal Support (4) Chemicals and Waste Policy, Evaluation and Monitoring (5) Chemicals Management.
sTraTEgiC ObjECTiVE
pErfOrManCE indiCaTOr
basElinE annual TargET 2015/16
prOgrEss/ aChiEVEMEnT againsT TargET
COMMEnTs (ChallEngEs/ExplanaTiOns On VarianCEs)
COrrECTiVE MEasurEs
Threats to environmental quality and integrity managed
Number of industry waste management plans (IndWMPs) reviewed per annum
An Integrated Industry Waste Tyre Management Plan Approved
3 IndWMP reviewed: E-waste ; Lighting Paper and Packaging
3 draft Industry Waste Management Plans reviewed and comments/inputs made on plans ( Lighting ; e-waste and paper and packaging industry plans)
None None
Percentage increase in waste diverted from landfill
N/A 25% of waste tyres 42% (72 052 / 172 441) of waste tyres have been diverted from the landfill sites
Planned target exceeded with a variance of 68%. Exceeding the target had no impact on resources earmarked for other priorities
None
Number of unlicensed waste disposal facilities authorised per annum
15 57 Planned annual target not achieved. No licenses have been issued at this stage. 07 final Basic Assessment reports have been submitted to competent authorities for decision making. 04 Final Scoping Reports submitted to the Competent Authority
The scope of work for some sites changed and that resulted in delays with conducting environmental impact assessments. Further delays were experienced in completing the final reports by municipalities
18 Final Basic Assessment Reports will be submitted for decision making in the first quarter of 2016/17
Number of chemicals and waste management Instruments developed and implemented
Multilateral Environmental Agreements (Stockholm, Rotterdam and Montreal) action plans implemented
National Implementation Plan for the Stockholm Convention updated
National Implementation Plan (NIP) updated and submitted to the Executive Authority for consideration
NIP update process was delayed due to additional time required for consultation
NIP updated considered by the Executive Authority and approved in May 2016

74
sTraTEgiC ObjECTiVE
pErfOrManCE indiCaTOr
basElinE annual TargET 2015/16
prOgrEss/ aChiEVEMEnT againsT TargET
COMMEnTs (ChallEngEs/ExplanaTiOns On VarianCEs)
COrrECTiVE MEasurEs
Threats to environmental quality and integrity managed
Number of chemicals and waste management Instruments developed and implemented
Multilateral Environmental Agreements (Stockholm, Rotterdam and Montreal) action plans implemented
PCB phase out plan for municipalities finalised
PCB Phase-out Plan for Municipalities finalised
None None
Draft Minamata Convention Impact Study developed
Service provider appointed and draft Minamata Convention Impact Study developed
None None
Number of waste management facilities audited per annum
Waste Act in place
15 facilities audited 16 facilities were audited Planned target exceeded with a variance of 7%. Exceeding the target had no impact on resources earmarked for other priorities
None
Negative impacts on health and wellbeing minimised
Hectares of Asbestos Contaminated Land remediated
N/A 2 Hectares Remediated
Planned annual target not achieved. Appointment of implementing agent for the project through the EPWP model finalised in the fourth quarter of the year
Project delayed due to unavailability of funds. A decision was made to follow a changed approach and implement the project through the EPWP implementation model. The changed approach needed more time as it involved key processes including development and approval of a business plan; detailed compliance and administrative process with National Treasury and appointment of an implementer for the project
Implementation of the project will be carried out in the first quarter of 2016/17
prOgraMME 7: ChEMiCals and wasTE ManagEMEnT (COnTinuEd)

DEPARTMENT OF ENVIRONMENTAL AFFAIRS ANNUAL REPORT 2015/1675
sTraTEgiC ObjECTiVE
pErfOrManCE indiCaTOr
basElinE annual TargET 2015/16
prOgrEss/ aChiEVEMEnT againsT TargET
COMMEnTs (ChallEngEs/ExplanaTiOns On VarianCEs)
COrrECTiVE MEasurEs
Negative impacts on health and wellbeing minimised
Percentage decrease on HCFC consumption
HCFC Phase-out Management Plan Finalised
10% (4284.3 tons) 26.17% decrease on HCFC consumption.
Consumption from April 2015 to March 2016 is 1345.602 tons tonnes. Current consumption is at 1345.602, from our allowable (the 10% {4626.18} of our baseline which is 5140.2). The country has only consumed 29% of the allowable. Percentage = 1345.602/ 5140.20 X 100 = 26.177% which is our consumption, that means reduction is currently at 73.82%
Planned annual target exceeded with a variance of 161%. Exceeding the target had no impact on resources earmarked for other priorities
None
Growth in industries that depend on environmental services
Number of jobs created within the waste management sector
1 424 576 685 jobs were created Planned annual target exceeded with a variance of 19%. Exceeding the target had no impact on resources earmarked for other priorities
None
Number of waste management enterprises established (SMMEs, Cooperatives)
N/A 20 35 SMMEs created Planned annual target exceeded with a variance of 75%. Exceeding the target had no impact on resources earmarked for other priorities
None
prOgraMME 7: ChEMiCals and wasTE ManagEMEnT (COnTinuEd)

76
suMMary Of prOgraMME pErfOrManCE: ChEMiCals and wasTE ManagEMEnTSummary of Programme Performance: The Annual Performance Plan of this Programme for the 2015/16 financial year had a total of 11 annual targets. A total of 8 annual targets (73%) of the planned 11 were achieved. The remaining one annual target (9%) was partially achieved and two annual targets (18%) were not achieved as there were significant delays on that area of work. The challenges which resulted in the non-achievement of the targets and the corrective interventions have been provided in the detailed performance report.

DEPARTMENT OF ENVIRONMENTAL AFFAIRS ANNUAL REPORT 2015/1677
sTraTEgy TO OVErCOME arEas On undErpErfOrManCEIn each area where the planned target has not been achieved, Management has reflected on the factors causing the delays (challenges) and identified the corrective measures to be implemented as detailed in the audited performance information report. This is a standard management practice aimed at ensuring effective implementation and monitoring of the Department’s approved Annual Performance Plan. Progress on these areas will be reviewed in the first and following quarters of the next financial year (2016/17) to assess the effectiveness of the identified corrective measures and to determine the need for further management intervention where required.
Changes to planned targetsBelow are the details of a submission that was made mid-year to amend some of the deliverables in the department’s 2015/16 Annual Performance Plan. Approval for these amendments was obtained.
prOgraMME 1: adMinisTraTiOn
Strategic Objective: Efficient and effective Information Technology systems
sTraTEgiC ObjECTiVE: sTraTEgiC ObjECTiVE: EffiCiEnT and EffECTiVE infOrMaTiOn TEChnOlOgy sysTEMspErfOrManCE indiCaTOr basElinE CurrEnT (2015/16) annual TargET
(as pEr TablEd app)prOpOsEd aMEndMEnTs briEf MOTiVaTiOn/rEasOns fOr ThE apprOVEd
aMEndMEnTsNumber of Funded Master System Plan (MSP) initiatives implemented
2 of the 9 projects achieved as planned, 2 partially achieved, 2 off target and 3 deferred to next financial year due to financial constraints
9 Funded Master System Plan (MSP) initiatives implemented
6 Funded Master System Plan (MSP) initiatives implemented
It is recommended that the annual target be revised as a result of financial constraints which have necessitated the reprioritisation of funds. The other three MSP projects will be funded and implemented in the next financial year
Strategic objective: Effective knowledge and information management for the sector
sTraTEgiC ObjECTiVE: sTraTEgiC ObjECTiVE: EffECTiVE knOwlEdgE and infOrMaTiOn ManagEMEnT fOr ThE sECTOrpErfOrManCE indiCaTOr basElinE CurrEnT (2015/16) annual TargET
(as pEr TablEd app)prOpOsEd aMEndMEnTs briEf MOTiVaTiOn/rEasOns fOr ThE apprOVEd
aMEndMEnTsNumber of environmental knowledge and information systems developed implemented
GIS Protected Area Register (PAR) internet developed
3 Spatialtools:
Pre-screening tool implemented and testing undertaken
3 Spatial tools:
Pre-screening tool developed
The department will not be able to use the services of a company which was originally identified facilitate the work of developing the pre-screening tool due to an intellectual property issue which arose when finalising the contract. The process of appointed an alternative company resulted in substantial delays of about 6 months. The development was supposed to start in April 2015, it will now only start in October 2015

78
prOgraMME 2: lEgal, auThOrisaTiOn,COMplianCE and EnfOrCEMEnT
Strategic objective: Coherent and aligned multi-sector regulatory system and decision support across Government
sTraTEgiC ObjECTiVE: COhErEnT and alignEd MulTi-sECTOr rEgulaTOry sysTEM and dECisiOn suppOrT aCrOss gOVErnMEnTpErfOrManCE indiCaTOr basElinE CurrEnT (2015/16) annual TargET
(as pEr TablEd app)prOpOsEd aMEndMEnTs briEf MOTiVaTiOn/rEasOns fOr ThE apprOVEd
aMEndMEnTsNumber of interventions for streamlining environmental authorisation management developed
N/A Strategic Infrastructure (SIPs) implemented: TORs for SIP19 SEA finalised and approved
TORs for SIP19 SEA finalised and approved
SIP 19 has not as yet been approved as an official SIP by the Presidential Infrastructure Coordinating Commission (PICC). However, DAFF and Environmental Programmes Branch (EP) have expressed concern that the EIA requirements are impacting on their ability to implement their program within the year of funding. The CD: IEMS has also identified that the use of an EIA for the environmental approval of land care and alien invasive project linked to riverine areas may not be the most effective manner of authorisation. Between the three stakeholders, it has been requested that we initiate a Strategic Environmental Assessment (SEA) for these projects as a first phase of implementing SIP 19, should it be approved in the future. This has required EAS branch to interface with Environmental Programmes Branch and DAFF in terms of a rationale for the SEA, collaboration and the co-funding, which has resulted in delays in the commencement of the SEA for SlP 19
prOgraMME 4: CliMaTE ChangE ManagEMEnT and air QualiTy ManagEMEnT
Strategic Objective: Threats to environmental quality and integrity managedsTraTEgiC ObjECTiVE: ThrEaTs TO EnVirOnMEnTal QualiTy and inTEgriTy ManagEd
pErfOrManCE indiCaTOr basElinE CurrEnT (2015/16) annual TargET (as pEr TablEd app)
prOpOsEd aMEndMEnTs briEf MOTiVaTiOn/rEasOns fOr ThE prOpOsEd aMEndMEnTs
Number of sector mitigation potential impact studies conducted
Initial mitigation potential analysis for 5 sectors studies conducted finalised
Mitigation potential analysis updated Draft user-friendly greenhouse gas mitigation potential analysis model developed
It is not possible to adequately update the mitigation potential analysis (MPA) as significant policies are not ready in the current financial year to enable the update.The IRP has not been released by the DoE. The approach has changed to instead develop a draft analysis model as part of the preparation to conduct mitigation potential analysis in-house when the necessary data becomes available

DEPARTMENT OF ENVIRONMENTAL AFFAIRS ANNUAL REPORT 2015/1679
prOgraMMME 5: biOdiVErsiTy and COnsErVaTiOn
Strategic Objective: Strengthened knowledge, science and policy interface
sTraTEgiC ObjECTiVE: sTrEngThEnEd knOwlEdgE, sCiEnCE and pOliCy inTErfaCE pErfOrManCE indiCaTOr basElinE CurrEnT (2015/16) annual TargET
(as pEr TablEd app) prOpOsEd aMEndMEnTs briEf MOTiVaTiOn/rEasOns fOr ThE apprOVEd
aMEndMEnTsNumber of interventions and research programmes aimed at advancing the Biodiversity Science Policy Interface
Desertification, Land Degradation & Drought (DLDD) research strategy
Phase 2: UNCCD DLDD impact indicator identified conducted and research
Phase 2: UNCCD DLDD impact indicator identified conducted and research during the financial year 2016/17
The DLDD phase 2 gives effect to South Africa’s obligations under the UNCCD. The recent developments following the meeting of the Committee for the Review of the Implementation of the Convention (CRIC) in April 2015 brought about changes in the reporting cycle of the CRIC from 2 to 4 years in line with the GEF replenishment cycle. The implication of these is that South Africa will have to undertake this DLDD reporting exercises in 2016/2017 in order for the Country to report in 2018 to the CRIC
prOgraMME 6: EnVirOnMEnTal prOgraMMEs
Strategic Objective: Improve socio economic benefits
sTraTEgiC ObjECTiVE: sTraTEgiC ObjECTiVE: iMprOVEd sOCiO-ECOnOMiC bEnEfiTspErfOrManCE indiCaTOr basElinE CurrEnT (2015/16) annual TargET
(as pEr TablEd app)prOpOsEd aMEndMEnTs briEf MOTiVaTiOn/rEasOns fOr ThE prOpOsEd
aMEndMEnTsPercentage of young people placed in exit opportunities
N/A 75% Removal of the annual target from the 2015/16 annual performance plan of the Departmen
It is recommended that annual target be removed from 2015/16 annual performance plan of the Department

80
prOgraMME 7: ChEMiCals and wasTE ManagEMEnT
Strategic Objective: Threats to environmentalquality and integrity managed
sTraTEgiC ObjECTiVE: ThrEaTs TO EnVirOnMEnTalQualiTy and inTEgriTy ManagEdpErfOrManCE indiCaTOr basElinE CurrEnT (2015/16) annual TargET
(as pEr TablEd app)prOpOsEd aMEndMEnTs briEf MOTiVaTiOn/rEasOns fOr ThE apprOVEd
aMEndMEnTsNumber of chemicals and waste management instruments developed and implemented
National Chemicals Management Profile updated
Study on impact of Minamata
Convention on finalised
Draft study on impact of Minamata Convention on developed
This area of work/project is new and the complexities has resulted in the project cost of the project being higher than the budgeted funds. It is recommended that the annual target be revised to enable a portion of the work to be done in the current financial year, and final phase in 2016/17. These will allow the department to spread the funding of the project over two financial years to DEAl with high cost
Strategic Objective: Negative impacts on health and wellbeing minimised
sTraTEgiC ObjECTiVE: nEgaTiVE iMpaCTs On hEalTh and wEllbEing MiniMisEdpErfOrManCE indiCaTOr basElinE CurrEnT (2015/16) annual TargET
(as pEr TablEd app)prOpOsEd aMEndMEnTs briEf MOTiVaTiOn/rEasOns fOr ThE apprOVEd
aMEndMEnTsHectares of Asbestos Contaminated Land remediated
Secondary Asbestos Remediation Plan
5 Hectares remediated 2 Hectares remediated It is recommended that the planned annual target be revised to two hectares due to financial constraints. The lack of financial resources to fund the project has necessitated a change of project scope and approach. The rehabilitation of the 2 hectares will be done through the EPWP approach

DEPARTMENT OF ENVIRONMENTAL AFFAIRS ANNUAL REPORT 2015/1681
linking pErfOrManCE wiTh budgETs
prOgraMME 1: adMinisTraTiOn
sub- prOgraMME naME
2015/16 2014/15final apprOpriaTiOn aCTual ExpEndiTurE (OVEr)/undEr
ExpEndiTurEfinal apprOpriaTiOn aCTual ExpEndiTurE (OVEr)/undEr
ExpEndiTurEr’000 r’000 r’000 r’000 r’000 r’000
Management 177 744 177 744 - 130 661 130 661 -
Corporate Affairs 207 862 207 862 - 185 749 185 749 -
Environmental Advisory Service 113 384 113 384 - 111 326 111 326 -
Financial Management 66 639 66 639 - 60 017 60 017 -
Office Accommodation 201 235 201 235 - 186 947 186 947 -
Environmental Sector Coordination 65 623 65 623 - 56 635 56 635 -
TOTal 832 487 832 487 - 731 335 731 335 -
prOgraMME 2: lEgal, auThOrisaTiOns and COMplianCE
sub- prOgraMME naME
2015/16 2014/15final apprOpriaTiOn aCTual ExpEndiTurE (OVEr)/undEr
ExpEndiTurEfinal apprOpriaTiOn aCTual ExpEndiTurE (OVEr)/undEr
ExpEndiTurEr’000 r’000 r’000 r’000 r’000 r’000
Legal Authorisation Compliance Management
15 114 15 114 - 7 040 7 040 -
Compliance Monitoring 24 775 24 775 - 19 966 19 966 -
Integrated Environment Authorisation 30 466 30 166 300 27 363 25 861 1 502
Enforcement 35 894 35 894 - 26 970 26 970 -
Corporate Legal Sup and Litigation 10 766 10 766 - 8 821 8 821 -
Law Reform and Appeals 14 702 14 702 - 11 963 11 963 -
TOTal 131 717 131 417 300 102 123 100 621 1 502

82
prOgraMME 3: OCEans and COasTs
sub- prOgraMME naME
2015/16 2014/15final apprOpriaTiOn aCTual ExpEndiTurE (OVEr)/undEr
ExpEndiTurEfinal apprOpriaTiOn aCTual ExpEndiTurE (OVEr)/undEr
ExpEndiTurEr’000 r’000 r’000 r’000 r’000 r’000
Oceans and Coasts Management 11 233 11 233 - 5 290 5 290 -
Integrated Coastal Management 66 017 66 017 - 88 595 88 595 -
Oceans and Coastal Research 115 665 115 665 - 92 956 92 956 -
Oceans Conservation 172 049 168 687 3 362 157 932 157 932 -
Specialist Monitoring Service 7 057 7 057 - 4 484 4 484 -
TOTal 372 021 368 659 3 362 349 257 349 257 -
prOgraMME 4: CliMaTE ChangE and air QualiTy
sub- prOgraMME naME
2015/16 2014/15final apprOpriaTiOn aCTual ExpEndiTurE (OVEr)/undEr
ExpEndiTurEfinal apprOpriaTiOn aCTual ExpEndiTurE (OVEr)/undEr
ExpEndiTurEr’000 r’000 r’000 r’000 r’000 r’000
Climate Change Management 6 667 6 667 - 7 642 7 642 -
Climate Change Mitigation 8 769 8 769 - 8 374 8 374 -
Climate Change Adaptation 6 953 6 953 - 6 593 6 593 -
Air Quality Management 41 101 41 101 - 36 597 36 597 -
South African Weather Service 160 423 160 423 - 152 489 152 489 -
International Climate Change Relations and Negotiations
13 046 13 046 - 10 207 10 207 -
Climate Change Monitoring and Evaluation
9 155 9 155 - 7 390 7 390 -
TOTal 246 114 246 114 - 229 292 229 292 -

DEPARTMENT OF ENVIRONMENTAL AFFAIRS ANNUAL REPORT 2015/1683
prOgraMME 5: biOdiVErsiTy and COnsErVaTiOn
sub- prOgraMME naME
2015/16 2014/15final apprOpriaTiOn aCTual ExpEndiTurE (OVEr)/undEr
ExpEndiTurEfinal apprOpriaTiOn aCTual ExpEndiTurE (OVEr)/undEr
ExpEndiTurEr’000 r’000 r’000 r’000 r’000 r’000
Biodiversity and Conservation Management
18 178 18 178 - 15 801 15 801 -
Biodiversity Planning Management 26 189 26 189 - 19 954 19 954 -
Protected Areas System Management 42 187 42 187 - 44 537 44 537 -
iSimangaliso Wetland Park Authority 31 628 31 628 - 30 610 30 610 -
South African National Parks 278 675 278 675 - 275 068 275 068 -
South African National Biodiversity Institute
232 149 232 149 - 223 447 223 447 -
Biodiversity Monitoring and Evaluation 9 744 8 959 785 8 642 8 642 -
Biodiversity Economy and Sustainable Use
61 898 61 898 - 25 009 25 009 -
TOTal 700 648 699 863 785 643 068 643 068 -
prOgraMME 6: EnVirOnMEnTal prOgraMMEs
sub- prOgraMME naME
2015/16 2014/15final apprOpriaTiOn aCTual ExpEndiTurE (OVEr)/undEr
ExpEndiTurEfinal apprOpriaTiOn aCTual ExpEndiTurE (OVEr)/undEr
ExpEndiTurEr’000 r’000 r’000 r’000 r’000 r’000
Environmental Protection and Infrastructure Programme
1 429 525 1 429 525 - 1 481 104 1 481 104 -
Working for Water and Working on Fire 1 794 606 1 793 676 930 1 775 337 1 771 512 3 825
Green Fund 300 000 300 000 - 250 000 250 000 -
Environmental Programme management
6 605 6 605 - 7 273 7 273 -
Enforcement Management and Sector Coordination
49 834 49 834 - 39 719 39 719 -
TOTal 3 580 570 3 579 640 930 3 553 433 3 549 608 3 825

84
prOgraMME 7: ChEMiCals and wasTE ManagEMEnT
sub- prOgraMME naME
2015/16 2014/15final apprOpriaTiOn aCTual ExpEndiTurE (OVEr)/undEr
ExpEndiTurEfinal apprOpriaTiOn aCTual ExpEndiTurE (OVEr)/undEr
ExpEndiTurEr’000 r’000 r’000 r’000 r’000 r’000
Chemicals and Waste Management 9 951 9 951 - 5 992 5 992 -
Hazardous Waste Management and Licensing
27 940 27 940 - 22 514 22 514 -
General waste and Municipal Support 19 212 19 212 - 25 240 25 240 -
Chemicals and Waste Policy, Evaluation and Monitoring
9 356 9 356 - 6 682 6 682 -
Chemicals Management 13 281 13 281 - 11 450 11 450 -
TOTal 71 878 71 878 - 74 445 73 113 1 332

DEPARTMENT OF ENVIRONMENTAL AFFAIRS ANNUAL REPORT 2015/1685
TransfEr payMEnTs
TransfEr payMEnTs TO publiC EnTiTiEs
naME Of publiC EnTiTy sErViCEs rEndErEd by ThE publiC EnTiTy
aMOunT TransfErrEd TO ThE publiC EnTiTy r’000
aMOunT spEnT by ThE publiC EnTiTy r’000
aChiEVEMEnTs Of ThE publiC EnTiTy
South African Weather Service (SAWS)
Weather services, climate and related products (disseminating weather services product)
160 423 160 423 • For period under review, SAWS manged to ensure that 8 strategic partnerships are in place to ensure Entity’s sustainability
• National Framework for Climate Services developed and approved
• 65% of bursars absorbed in critical and scarce areas
iSimangaliso Wetland Park Authority
heritage site management 92 769 92 769 • Created 1547 temporary jobs and 15 permanent jobs
• 94 SMMEs supported and trained 1425 beneficiaries
• Annual Park Revenue increased 55% (from 2013/14 baseline) due to large number of visitors and an increase in tariffs as well as an annual escalation on licences
South African National Parks (SANParks)
Conservation management through the national parks system
546 979 546 979 • 6364 full time equivalent jobs were created through the Expanded Public Works Programme (EPWP)
• 980 SMMEs were supported, a total amount of R196 million was spent toward this initiatives
• 12 socio-economic initiatives were implemented as part of SANParks Corporate Social Investment (CSI) initiatives
• The Accommodation Occupancy Rate improved by 1.3% compared to the same period in the previous financial year, and 0.9% better than the planned quarterly target of 72.5%
South African National Biodiversity Institute (SANBI)
Biodiversity Management 304 412 304 412 • 115 wetlands under rehabilitation
• 1197 unemployed youth skilled and hosted in the biodiversity sector
• 6% annual increase in visitor numbers

86
TransfEr payMEnTs TO all OrganisaTiOns OThEr Than publiC EnTiTiEs
The table below reflects the transfer payments made for the period 1 April 2015 to 31 March 2016
naME Of TransfErEE TypE Of OrganisaTiOn purpOsE fOr whiCh ThE funds wErE usEd
COMplianCE wiTh s 38 (1) (j) Of ThE pfMa
aMOunT TransfErrEd (r’000)
aMOunT spEnT by ThE EnTiTy (r’000)
Development Bank of South Africa Public Corporation Implementation of Green Fund projects
Yes 300 000 300 000
Global Environmental Fund Foreign Government International membership fee Yes 16 000 16 000
National Regulator for Compulsory Specifications
Departmental Agency Financial Contribution Yes 6 832 6 832
Compensation Fund of South Africa Departmental Agency Contribution to Fund in respect of project staff
Yes 1 044 1 044
Social benefit Household Leave gratuity and severance package
Yes 2 623 2 623
National Association for Clean Air Non-profit Institution Financial Contribution Yes 1 400 1 400
Kwazulu-Natal Conservation Board Non-profit Institution Financial Contribution Yes 1 287 1 287
African World Heritage Fund Non-profit Institution Financial Contribution Yes 1 000 1 000
Various municipalities Municipality Vehicle licences Yes 42 42
SABC Departmental Agency Radio and TV licences Yes 2 2
Natural Resources Management and Social Responsibility Projects Implementing Agents
Household Implementation of Environmental Protection and Infrastructure Programme Projects
Yes 2 428 697 2 428 697
The table below reflects the transfer payments which were budgeted for in the period 1 April 2015 to 31 March 2016, but no transfer payments were made
naME Of TransfErEE purpOsE fOr whiCh ThE funds wErE TO bE usEd
aMOunT budgETEd fOr (r’000) aMOunT TransfErrEd (r’000) rEasOns why funds wErE nOT TransfErrEd
None

DEPARTMENT OF ENVIRONMENTAL AFFAIRS ANNUAL REPORT 2015/1687
COndiTiOnal granTsNone
dOnOr funds
dOnOr funds rECEiVEd
Donor Fund: United Nations Development Programme: Benguela Coastal Current Large Marine Ecosystem Programme
naME Of dOnOr uniTEd naTiOns dEVElOpMEnT prOgraMMEName of donor United Nations Development Programme
Full amount of the funding R319 283.38
Period of the commitment Ongoing
Purpose of the funding To give effect to the Strategic Action Programme by establishing a Benguela Current Commission in order to establish a formal institutional structure for co-operation between the Contracting Parties that will facilitate the understanding, protection, conservation and sustainable use of the Benguela Current Large Marine Ecosystem by the Contracting Parties; and to further the objectives recorded in the Strategic Action Programme
Expected outputs Established Benguela Current Commission
Actual outputs achieved Project completed
Amount received in current period (R’000) R0.0
Amount spent by the department (R’000) R1 142 000
Reasons for the funds unspent Donor funded project completed, await final funds transfer from RDP Funds
Monitoring mechanism by the donor Reporting to Donor

88
Donor Fund: United Nations Development Programme: Strengthening Law Enforcement Capabilities to Combat Wildlife Crime for Conservation and Sustainable Use of Species In South Africa: target: Rhinoceros
naME Of dOnOr uniTEd naTiOns dEVElOpMEnT prOgraMMEName of donor United Nations Development Programme
Full amount of the funding R32 285 000
Period of the commitment May 2014 – April 2019
Purpose of the funding Improve the effectiveness of efforts to combat wild life crime in South Africa’s protected arrears system, focussed on rhinoceros, through improved forensic technologies and capacity, strengthened data catering, sharing and analysis systems at national level, and enhance corporation structures and mechanisms at international level to support law efforts along the whole trafficking chain
Expected outputs Strengthening Law Enforcement Capabilities to Combat Wildlife Crime for Conservation and Sustainable Use of Species In South Africa: target: Rhinoceros
Actual outputs achieved Strengthening Law Enforcement Capabilities to Combat Wildlife Crime
Amount received in current period (R’000) R0.00
Amount spent by the department (R’000) R7 725 000
Reasons for the funds unspent None
Monitoring mechanism by the donor Reporting to Donor
Donor Fund: United Nations Development Programme: South Africa: Enabling Activities for the Preparation of Third National Communications (TNC) and Biennial Update Report (BUR)
naME Of dOnOr uniTEd naTiOns dEVElOpMEnT prOgraMMEName of donor United Nations Development Programme
Full amount of the funding R4 426 000
Period of the commitment August 2014 – June 2019
Purpose of the funding Undertake national stocktaking and stockholder consultations to review work carried out under previous climate change enabling activities and identify gaps and propose relevant activities to be undertaken within the framework of preparing the TNC under the UNFCCC
Expected outputs Preparation of Third National Communications (TNC) and Biennial Update Report (BUR)
Actual outputs achieved Implemented activities for the Preparation of Third National Communications (TNC) and Biennial Update Report (BUR)
Amount received in current period (R’000) R0.00
Amount spent by the department (R’000) R554 000
Reasons for the funds unspent Now project in process for preparation
Monitoring mechanism by the donor Reporting to Donor

DEPARTMENT OF ENVIRONMENTAL AFFAIRS ANNUAL REPORT 2015/1689
Donor Fund: United Nations Development Programme: Synergies Workshop among the Basel, Stockholm and Rotterdam Conventions
naME Of dOnOr uniTEd naTiOns dEVElOpMEnT prOgraMMEName of donor United Nations Development Programme
Full amount of the funding R789 502.07
Period of the commitment Ongoing
Purpose of the funding Facilitating a national dialogue involving relevant stakeholders on the Rotterdam Convention for South Africa
Expected outputs Hosting Rotterdam Convention
Actual outputs achieved Project completed
Amount received in current period (R’000) None
Amount spent by the department (R’000) R789 502.07
Reasons for the funds unspent Donor funded project completed, await final funds transfer from RDP Funds
Monitoring mechanism by the donor Report on the Rotterdam Convention
Donor Fund: United Nations Development Programme: 6th Session of the AEWA Meeting of Parties
naME Of dOnOr uniTEd naTiOns dEVElOpMEnT prOgraMMEName of donor United Nations Development Programme
Full amount of the funding R1 293 000
Period of the commitment Ongoing
Purpose of the funding Facilitating the 6th Session of the AEWA Meeting of Parties
Expected outputs Hosting the 6th Session of the AEWA Meeting of Parties
Actual outputs achieved 6th Session of the AEWA Meeting of Parties
Amount received in current period (R’000) R00.00
Amount spent by the department (R’000) R1 293 000
Reasons for the funds unspent Awaiting claims for payment
Monitoring mechanism by the donor Reporting on Progress to Donor

90
Donor Fund: United Nations Development Programme: Hazardous Material Management Programme
naME Of dOnOr uniTEd naTiOns dEVElOpMEnT prOgraMMEName of donor United Nations Development Programme
Full amount of the funding R2 192 464.56
Period of the commitment Not specified
Purpose of the funding Hazardous Material Management Programme
Expected outputs Development of the hazardous material management programme
Actual outputs achieved Project completed
Amount received in current period (R’000) R0.00
Amount spent by the department (R’000) R653 902.33
Reasons for the funds unspent Donor funded project completed, await final funds transfer from RDP Funds
Monitoring mechanism by the donor Reporting to Donor
Donor Fund: United Nations Development Programme: Payment for Watershed Services
naME Of dOnOr uniTEd naTiOns dEVElOpMEnT prOgraMMEName of donor United Nations Development Programme
Full amount of the funding R646 718.30
Period of the commitment Not specified
Purpose of the funding Payment for Watershed Services
Expected outputs Watershed Services
Actual outputs achieved Achieved and Finalised
Amount received in current period (R’000) R00.00
Amount spent by the department (R’000) R00.00
Reasons for the funds unspent Balance of R22 718,30 to be returned to Donor
Monitoring mechanism by the donor Reporting to Donor

DEPARTMENT OF ENVIRONMENTAL AFFAIRS ANNUAL REPORT 2015/1691
Donor Fund: Australia: Funding Agreement in Relation to South Africa Land Sector
naME Of dOnOr uniTEd naTiOns dEVElOpMEnT prOgraMMEName of donor Australia
Full amount of the funding R7 262 000
Period of the commitment March 2013 to February 2015
Purpose of the funding Land sector measurements, reporting and verification capacity building project
Expected outputs Established MRV capacity building project
Actual outputs achieved Established MRV capacity building project
Amount received in current period (R’000) R00.00
Amount spent by the department (R’000) R2 252 478.62
Reasons for the funds unspent Final accounting procedures in order to close the account
Monitoring mechanism by the donor Audited financial statements each year to Donor
Donor Fund: Australia: Funding Agreement in Relation to South Africa Land Sector
naME Of dOnOr uniTEd naTiOns dEVElOpMEnT prOgraMMEName of donor Denmark
Full amount of the funding R376 000
Period of the commitment Not specified
Purpose of the funding Investment and Infrastructure Development Projects under the Transfrontier Conservation Area Development Programme
Expected outputs Development and/or packaging of cross-border tourism products in TFCA’s increasing worldwide knowledge of tourism activities in TFCAs thereby generating interest to visit; and developing a pipeline if investment opportunities in TFCAs and facilitating their development in order to enhance the attractiveness of these destinations
Actual outputs achieved Programme under implementation
Amount received in current period (R’000) R.00
Amount spent by the department (R’000) R376 000
Reasons for the funds unspent Awaiting claims for payment
Monitoring mechanism by the donor Reporting on Progress to Donor

92
Donor Fund: Germany: 1st Biennial Updated Report: Compilation, review and publication: Prometium Carbon Programme
naME Of dOnOr uniTEd naTiOns dEVElOpMEnT prOgraMMEName of donor Germany
Full amount of the funding R1 254 298, 00
Period of the commitment October 2013 to March 2014
Purpose of the funding Compilation, review and publication of the 1st Biennial Updated Report: Prometium Carbon
Programme Prometium Carbon Programme
Expected outputs 1st Biennial Updated Report, compiled, reviewed and published
Actual outputs achieved Project Completed
Amount received in current period (R’000) R0.00
Amount spent by the department (R’000) R1 254 000
Reasons for the funds unspent Project finalised, await funds transfer from RDP Fund to close account
Monitoring mechanism by the donor Project Progress Reports to Donor
Monitoring mechanism by the donor Reporting on Progress to Donor

DEPARTMENT OF ENVIRONMENTAL AFFAIRS ANNUAL REPORT 2015/1693
parT C: gOVErnanCE PART C: GOvERNANCE

94
1 inTrOduCTiOn Commitment by the department to maintain the highest standards of governance is fundamental to the management of public finances and resources. Users want assurance that the department has good governance structures in place to effectively, efficiently and economically utilize the state resources, which is funded by the tax payer.
2 risk ManagEMEnTThe department follows an integrated approach towards risk management and has adopted the Public Service Risk Management Framework in developing the approved risk management strategy. During the planning process, strategic and operational risks are identified. Risks are continuously monitored to determine, amongst other things, the emerging risks for the department. Risk management surveys are conducted bi-annually to determine the progress/understanding of risk management in the organisation. Risk progress is monitored quarterly by the Risk Management Unit. The analysis and status of the risks are presented to the Risk Management Committee, Audit Committee and Senior Managers of the department.
The Risk Management Committee provides assurance to the Accounting Officer and Audit Committee that risks are managed effectively.
The table below provide details on the 2015/16 strategic risks, mitigation plans and progress.
risk risk MiTigaTiOn prOgrEss againsT plannEd MiTigaTiOnInability to achieve DEA’s goals/priorities due to the reduction of budget by National Treasury
• Implementation of cost cutting measures (Operational Costs)• Re-prioritization of resources across the DEA• Explore partnerships• Sourcing of additional funds
• Internal cost cutting measures implemented • Reprioritisation and budget pressure presented to National Treasury• Partnerships with National Research Forum (NRF), Department of Science and Technology
(DST) etc. to reduce research vessel costs
Poor planning, control and implementation of projects
• Conduct Audits on projects• Develop & review project planning and management framework• Implement corrective measures and audit recommendations
• Audits conducted on projects and Audit recommendations implemented• Management of the Smit Amandla contract has been implemented and monthly meetings
to ensure the monitoring of performance management
Inadequate IT services & Security
• Review of the MSP• Implementation of security on IT infrastructure• Implementation of ICT Governance and policy framework
deliverables• Monitor the Project plan (CGICT) with SITA
• Self-assessment report with gaps (based on interviews conducted) for the twelve COBIT processes developed
• COBIT5 Processes were reviewed as part of the assessment as informed by the approved DEA Corporate Governance of ICT Policy/Governance and Management of Information Communications Technology (ICT) Framework (APO13: Manage security)
• Report developed for the status of the Corporate Governance of Information Communications Technology (ICT) Framework
Inadequate and ineffectiveness of interventions to protect the Environment
• Identification of priority non-regulatory interventions aims at protecting the environment (protected areas, waste services, OC)
• Advocacy and awareness in respect of interventions
• Assessment of interventions
• Assist Competent Authorities in the implementation of Environmental Legislation
The following illustrates the Department of Environmental Affairs (DEA)’s commitment to Public Participation and a sustainable environment
• Events held to raise awareness and increase community benefits on Biodiversity:
• Tri-nation’s camp for school children facilitated at Mapungubwe
• CITES Training conducted in North West and Free State Provinces
• TOPS Training conducted at Walter Sisulu University
• 2 BESU Workshops held in Northern Cape and Mpumalanga

DEPARTMENT OF ENVIRONMENTAL AFFAIRS ANNUAL REPORT 2015/1695
risk risk MiTigaTiOn prOgrEss againsT plannEd MiTigaTiOnCompromised health, and safety of Employees (Voyages to the Islands, Facilities, Operational, etc.)
• Conduct audits in respect of applicable OHSA compliance
• Monthly induction awareness on OHS matters
• Implement recommendations of audits
• Training and awareness sessions
• Monitoring of the OHS quarterly meetings
• Monitoring of the Schedule 5 Part B of the PPP agreement
• Inspections conducted and Environment House and at new regional offices
• OHS Awareness Training and HIRA (Hazard Identification and Risk Assessment) Training session 1 took place
• Orientation programme awareness sessions conducted
• Clarification of roles (Appointment of SHE Reps & Incident Investigator, Fire Fighter & Evacuation Warden and First Aider) took place
• PPP agreement monitored
Ineffective regulatory compliance monitoring and enforcement system
• Implement year 1 targets as set out in the Strategy implementation plans
• All planned targets implemented as per the Implementation Plan
Inadequate internal alignment of functions
• Implementation of the DDG Clusters and assess effectiveness
• Business Process Review
• Implementation of the Departmental Knowledge and Information Management Forum
• DDG cluster meetings held throughout the year
• Business processes reviewed and mapped to enhance the departments’ efficiency
Inadequate prevention and detection of Fraud, corruption and misconduct
• Create 10 awareness sessions on fraud & corruption
• Investigate, finalise and report on (publication of outcomes) all fraud and corruption allegations received through all available channels
• Follow up and monitoring of recommendations implemented
• All allegations of fraud and corruption reported were dealt with efficiently and disciplinary action taken where necessary
• 10 awareness sessions on fraud & corruption conducted
• Articles published in DEA Lekgotla newsletter, and presentations at inductions conducted
3 fraud and COrrupTiOnThe department has an approved fraud prevention policy which is implemented effectively through awareness campaigns. The department supports the National Anti-Corruption Hotline (NACH) which is administered by the Public Service Commission and employees are encouraged to make confidential disclosures in relation to suspected fraud and corruption to the Hotline as an alternative to the internal reporting facilities. The Environmental Hotline, administered by the department, is used for the reporting of allegations of environmental crimes.
Extensive awareness drives to communicate the various mechanisms to report allegations of fraud and corruption have been conducted with employees and other stakeholders including the installation of posters at strategic entry points to the department display the whistle blowing process and the inclusion of the NACH number on Supply Chain Management Order Forms. All allegations of fraud and corruption are either investigated, or have been referred to the external organisations responsible for further investigation. The department has created internal investigative capacity and has investigated allegations, with some assistance from external service providers in complex cases. In order to provide assurance on the handling of allegations, the outcomes of investigations are communicated to the Public Service Commission, where applicable, and information regarding the outcomes of the investigations are appropriately disseminated, subject to legal constraints.
The table below provide details on the 2015/16 strategic risks, mitigation plans and progress. (continued)

96
4 MiniMising COnfliCT Of inTErEsTThe Department submitted 100% of its financial disclosures again this year, which are then analysed by the Public Service Commission. In addition, in the Bid Evaluation Committee proceedings members of the committee are required to sign disclosure s of interest. As part of Human Resource Management practice during the recruitment and selection process, members of the selection panel are also required to declare their relationship or any potential conflict of interest, which may arise from knowing or previous association with candidates being assessed.
Furthermore, the Department has established a relationship with CIPRO and signed an agreement to be granted permission to access their database and verify information contained in disclosure forms on directorship in companies.
5 COdE Of COnduCTThe Department has adopted the Public Service Code of Conduct for implementation. Newly recruited employees in the Department are made aware of the Code during their induction sessions with the aim of enhancing awareness and compliance by all employees. Normal disciplinary measures and procuress are followed in accordance with the disciplinary code to address any contravention of the Code of Conduct and any other policies. Ethical behaviour under all circumstances and at all times is also underpinned by the Department’s Values and recognised in the Departmental Batho Pele Awards Scheme.
6 hEalTh safETy and EnVirOnMEnTal issuEsThe Department Occupational Health and Safety policy and procedure on how to report an injury on duty and occupational diseases is under review to also cover other parts of the Department. Health and Safety awareness sessions/presentations for regional offices and Local Government Support officials are being facilitated on a continuous basis on Occupational Health and Safety and COID service offerings in a form of presentations and posters. In all areas where required, safety clothing and equipment is procured for use by employees in carrying out their duties. Health and safety inspections are conducted on a continuous basis and corrective measures implemented.
Health and Safety representatives for both the Head office and regional offices were trained and legally appointed to assist in ensuring compliance in the department and to serve as emergency teams. Emergency preparedness plan was also done for Head office.
Health and Safety procedures were also developed, and Health and safety committees were established and coordinated on lower level and higher level to ensure proper implementation of OHS Management System in the Department.
Emergency evacuation drill was also conducted for Head Office (Environment House) to ensure compliance and also as a requirement to Occupational Health and Safety Act 85 of 1993.
Occupational Health and Safety site Inspections and HIRA (Hazardous Identification and Risk Assessment) are conducted to ensure compliance and recommendations on corrective measures. Establishment of OHS and appointment of practitioners assisted DEA in realising the level of compliance required in terms of the Act and how to minimise the risk to the department. The successful applicants that go to the Antarctica and Islands were given Safety Awareness before they left and on arrival in their respective bases. Procurement of the safety clothing is a continuous exercise. The clothing purchased is also for easy identification of staff during site visits and other excursions relating to the work of Oceans and Coast Branch.
Procurement of Health and Safety related equipment such as First Aid kit and content, high visibility reflector vest for DEA emergency team and OHS Act booklets were done for both Head Office and regional office Safety Health and Environment representative.
7 pOrTfOliO COMMiTTEEsThe Portfolio Committee exercises oversight over the service delivery performance of departments.
• Dates of meetings scheduled with Portfolio Committee on Environmental Affairs in 2015/16 as follows: (A total of all 26 meetings (including Public hearings and Oversight visits) scheduled have been honoured).
pOrTfOliO COMMiTTEE siTTings
firsT TErM sECOnd TErM Third TErM fOurTh TErM
14, 21, 28 April 2015 21-23 July 2015 13, 15, 16, 23, 27 October 2015
16, 23, 26 February 2016
12,26 May 2015 07, 11, 14, 18 August 2015 01, 08, 15 March 2016
02 June 2015 01, 04, (14-15), 18 September 2015
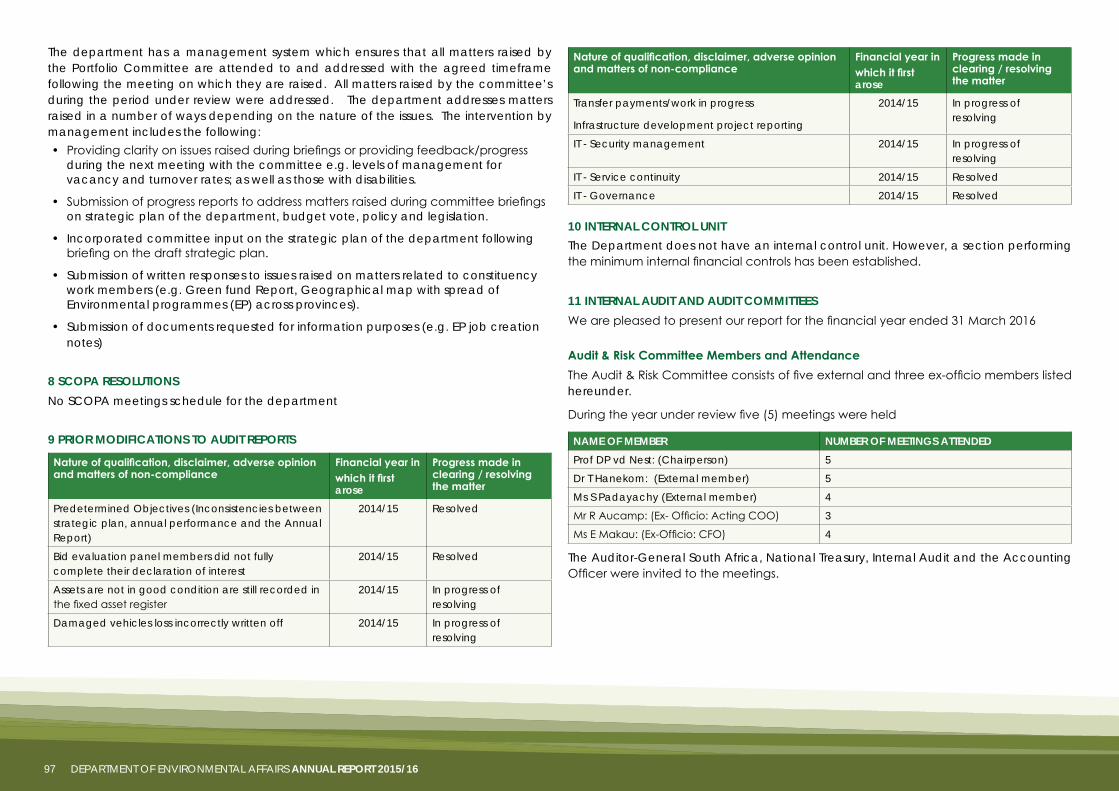
DEPARTMENT OF ENVIRONMENTAL AFFAIRS ANNUAL REPORT 2015/1697
The department has a management system which ensures that all matters raised by the Portfolio Committee are attended to and addressed with the agreed timeframe following the meeting on which they are raised. All matters raised by the committee’s during the period under review were addressed. The department addresses matters raised in a number of ways depending on the nature of the issues. The intervention by management includes the following:• Providing clarity on issues raised during briefings or providing feedback/progress
during the next meeting with the committee e.g. levels of management for vacancy and turnover rates; as well as those with disabilities.
• Submission of progress reports to address matters raised during committee briefings on strategic plan of the department, budget vote, policy and legislation.
• Incorporated committee input on the strategic plan of the department following briefing on the draft strategic plan.
• Submission of written responses to issues raised on matters related to constituency work members (e.g. Green fund Report, Geographical map with spread of Environmental programmes (EP) across provinces).
• Submission of documents requested for information purposes (e.g. EP job creation notes)
8 sCOpa rEsOluTiOnsNo SCOPA meetings schedule for the department
9 priOr MOdifiCaTiOns TO audiT rEpOrTs
Nature of qualification, disclaimer, adverse opinion and matters of non-compliance
Financial year inwhich it first arose
Progress made in clearing / resolving the matter
Predetermined Objectives (Inconsistencies between strategic plan, annual performance and the Annual Report)
2014/15 Resolved
Bid evaluation panel members did not fully complete their declaration of interest
2014/15 Resolved
Assets are not in good condition are still recorded in the fixed asset register
2014/15 In progress of resolving
Damaged vehicles loss incorrectly written off 2014/15 In progress of resolving
Nature of qualification, disclaimer, adverse opinion and matters of non-compliance
Financial year inwhich it first arose
Progress made in clearing / resolving the matter
Transfer payments/work in progress
Infrastructure development project reporting
2014/15 In progress of resolving
IT - Security management 2014/15 In progress of resolving
IT - Service continuity 2014/15 Resolved
IT - Governance 2014/15 Resolved
10 inTErnal COnTrOl uniTThe Department does not have an internal control unit. However, a section performing the minimum internal financial controls has been established.
11 inTErnal audiT and audiT COMMiTTEEsWe are pleased to present our report for the financial year ended 31 March 2016
Audit & Risk Committee Members and AttendanceThe Audit & Risk Committee consists of five external and three ex-officio members listed hereunder.
During the year under review five (5) meetings were held
naME Of MEMbEr nuMbEr Of MEETings aTTEndEdProf DP vd Nest: (Chairperson) 5
Dr T Hanekom: (External member) 5
Ms S Padayachy (External member) 4
Mr R Aucamp: (Ex- Officio: Acting COO) 3
Ms E Makau: (Ex-Officio: CFO) 4
The Auditor-General South Africa, National Treasury, Internal Audit and the Accounting Officer were invited to the meetings.

98
12 audiT and risk COMMiTTEE rEpOrT
Audit & Risk Committee ResponsibilityThe Audit & Risk Committee reports that it has discharged its responsibilities arising from sections 38(1) (a) of the PFMA and Treasury Regulations 3.1.
The Audit & Risk Committee also reports that it has adopted appropriate formal terms of reference as its Audit & Risk Committee Charter, has regulated its affairs in compliance with this charter and has discharged all its responsibilities as contained therein.
The effectiveness of internal controlThe Department’s system of internal control is designed to provide reasonable assurance that, inter-alia, assets are safeguarded and that liabilities and working capital are efficiently managed.
Internal Audit has submitted various internal audit reports based on the work performed in terms of the approved strategic risk-based operational plan, which sets out the scope, period covered and the audit objectives for the testing of controls around the key risks identified.
The Audit and Management report of the Auditor-General South Africa on the Annual Financial Statements was also submitted to the Audit & Risk Committee.
The results of the internal and external audits indicated that controls have been operating as intended in the majority of the areas in the department. Minor areas exist that require attention to strengthen and improve the control environment. The Audit & Risk Committee has considered and evaluated the audit report and is satisfied with management responses and action plans to address the minor internal control matters identified through internal and external audit. The audit report of the Auditor-General was unqualified with no instances of non-compliance with the relevant legislation reported. This is a good indication of the quality of the control environment in the department.
The quality of in-year management and monthly/quarterly reports submitted in terms of the pfMaThe Audit & Risk Committee is satisfied with the content and quality of monthly and quarterly reports prepared and issued by the Department during the year under review. The performance information of the Department was of a good quality and received an unqualified opinion from the Auditor-General.
Evaluation of Annual Financial StatementsThe Audit & Risk Committee has:
• Reviewed and discussed the audited annual financial statements to be included in the annual report, with the Auditor-General South Africa and the Accounting Officer.
• Reviewed the Auditor-General South Africa’s management report and management’s response thereto;
• Reviewed the Department’s compliance with legal and regulatory provisions;
• Noted that the Department is in the process of changing the disclosure of transfers to EPWP projects to be in accordance with the Modified Cash Standards (MCS) of accounting practice;
• Reviewed the information on pre-determined objectives to be included in the annual report; and
• Reviewed the quality and timeliness of the financial information availed to the Audit & Risk Committee for oversight purposes during the year.
The Audit & Risk Committee concurs and accepts the Auditor-General’s conclusion on the annual financial statements, and is of the opinion that the audited annual financial statements read together with the report of the Auditor-General be accepted.
internal audit The Internal Audit Function conducts its affairs in terms of an approved Internal Audit Charter. The function also follows a risk-based audit approach, whereby the Department’s risk strategy and the function’s assessment of the risks drives the internal audit approach and approved internal audit operational plan. The internal audit risk-based operational plan was formally adopted and approved by the Audit & Risk Committee. Progress on the execution of the plan was monitored and reported at each Audit & Risk Committee meeting.
The Audit & Risk Committee is therefore satisfied that the Internal Audit Function is operating effectively and that it has provided reasonable assurance on controls around the risks pertinent to the Department in its final audit reports.

DEPARTMENT OF ENVIRONMENTAL AFFAIRS ANNUAL REPORT 2015/1699
Risk Strategy
The Audit & Risk Committee serves as the risk committee for the Department. The Department has a risk management strategy and fraud prevention plan that is implemented. Risk assessments in the Department are conducted annually and strategies are formulated to mitigate risks, these are reported to the Audit & Risk Committee. The Department has also developed a combined assurance plan to assist in the monitoring of the mitigation of key strategic and operational risks.
Auditor-General South AfricaThe Audit & Risk Committee has met with the Auditor-General South Africa to ensure that there are no unresolved issues. The Auditor-General has made a very positive contribution to the department and has contributed to the control environment and assurance that lead to the “clean” audit report for the year.
ConclusionThe Department has received an unqualified audit opinion on the Annual Financial Statements and there were no material findings on the performance information reported by the Department. The Audit & Risk Committee wishes to congratulate the Director-General, the Chief Operating Officer, Chief Financial Officer, Finance staff, management and all officials who have contributed to the success of the Department and the excellent control environment prevalent. The Committee also wishes to thank the Auditor-General staff for their positive contribution to the Departm
Prof. D.P. van der Nest
CHAIRPERSON OF THE AUDIT & RISK COMMITTEE
DATE: 16 November 2016

100
parT d: huMan rEsOurCE ManagEMEnT PART D: HuMAN REsOuRCE MANAGEMENT

DEPARTMENT OF ENVIRONMENTAL AFFAIRS ANNUAL REPORT 2015/16101
1. IntroductionThe need to attract and retain the best Human Resource talent in the labour market is an important element in enabling DEA to achieve its strategic goals and long term vision of a prosperous and equitable society living in harmony with the natural environment. The Department is committed to implementing effective Human Resources Management strategies and interventions to position itself as an employer of choice and enable us to attract and retain the best available talent in the market. The Department implements a number of key programmes to build capacity and enhances skills development, with a particular focus on the youth. In 2015/16 a total of thirty five (35) deserving youth students received funding for full-time bursaries to study at Universities in various fields of environmental management, and hundred and eleven (111) young graduates were recruited in the Department’s annual internship programme for a period of 12 months. These are important annual interventions aimed at sustaining our talent base.
The Department has a comprehensive Human Resource Plan which is implemented on an ongoing basis and reviewed regularly to ensure alignment with the overall strategy of the organisation and changes in the environment. The key Human Resource Management interventions also include implementation of a Performance Management and Development System (PMDS), which is aimed at the development of our employees and ensuring sustained organisation performance. Monitoring of reports on implementation of the PMDS shows an overall good standing of compliance by employees with key requirements. The Department also has a comprehensive Employee Wellness Programme which offers on-going support to employees in effectively DEAling with the demands of the work environment and other personal/societal factors which may have an impact on their performance. Ethical conduct is also promoted and underpinned by the Department’s Values and the related Batho-Pele Awards Programme.

102
2. huMan rEsOurCEs OVErsighT sTaTisTiCs
2.1. Personnel related expenditureThe following tables summarises the final audited personnel related expenditure by programme and by salary bands. In particular, it provides an indication of the following:
• amount spent on personnel
• amount spent on salaries, overtime, homeowner’s allowances and medical aid.
Table 3.1.1 Personnel expenditure by programme for the period 1 April 2015 and 31 March 2016
prOgraMMETOTal ExpEndiTurE
(r’000) pErsOnnEl
ExpEndiTurE (r’000) Training
ExpEndiTurE (r’000)prOfEssiOnal and
spECial sErViCEs ExpEndiTurE (r’000)
pErsOnnEl ExpEndiTurE as
a% Of TOTal ExpEndiTurE
aVEragE pErsOnnEl COsT pEr EMplOyEE
(r’000)
Administration 832 487 349 623 11 301 36 273 41.7 184Legal,auth and compliance 131 417 91 189 964 3 623 69.6 48Oceans and coasts 368 659 99 917 978 189 892 27 53Climate change & air quality 246 114 53 535 478 13 397 21.8 28Biodiversity & conservation 699 863 63 139 634 43 302 9 33Environmental programmes 3 579 640 202 856 2 879 123 455 5.7 107Chemicals & waste management 79 740 48 918 499 8 511 61.3 26TOTal 5 937 920 909 177 17 733 418 453 15.3 479
Table 3.1.2 Personnel costs by salary band for the period 1 April 2015 and 31 March 2016
salary bandspErsOnnEl ExpEndiTurE
(r’000)% Of TOTal pErsOnnEl COsT nO. Of EMplOyEEs aVEragE pErsOnnEl COsT
pEr EMplOyEE (r’000)
Skilled (Levels 3-5) 13 959 1.5 86 162 314
Highly skilled production (Levels 6-8) 195 511 20.7 686 285 329
Highly skilled supervision (Levels 9-12) 419 252 44.4 761 550 922
Senior management (Levels 13-16) 196 497 20.8 191 1 028 780
Contract (Levels 1-2) 7 559 0.8 32 236 219
Contract (Levels 3-5) 3 790 0.4 4 947 500
Contract (Levels 6-8) 17 683 1.9 79 226 367
Contract (Levels 9-12) 25 811 2.7 46 561 109
Contract (Levels 13-16) 26 656 2.8 19 1 402 947
Abnormal Appointment 2 459 0.3 200 12 295
TOTal 909 177 96.3 2104 432 320

DEPARTMENT OF ENVIRONMENTAL AFFAIRS ANNUAL REPORT 2015/16103
Table 3.1.3 Salaries, Overtime, Home Owners Allowance and Medical Aid by programme for the period 1 April 2015 and 31 March 2016
prOgraMME
salariEs OVErTiME hOME OwnErs allOwanCE MEdiCal aidaMOunT (r’000) salariEs as a%
Of pErsOnnEl COsTs
aMOunT (r’000) OVErTiME as a% Of pErsOnnEl
COsTs
aMOunT (r’000) hOa as a% Of pErsOnnEl
COsTs
aMOunT (r’000) MEdiCal aid as a% Of
pErsOnnEl COsTs
Administration 326 264 93.3 4 085 1.2 7 479 2.1 11 795 3.4
Legal,auth and compliance 86 290 94.6 143 0.2 1 657 1.8 3 099 91 189
Oceans and coasts 93 151 93.2 2 953 3 1 290 1.3 2 523 2.5
Climate change & air quality 51 169 95.6 0 0 1 046 2 1 320 2.5
Biodiversity & conservation 60 241 95.4 0 0 1 356 2.1 1 542 2.4
Environmental programmes 192 359 94.8 265 0.1 4 101 2 6 131 3
Chemicals & waste management 45 998 94 0 0 1 397 2.9 1 523 3.1
TOTal 855 472 94.1 7 446 0.8 18 326 2 27 933 3.1
Table 3.1.4 Salaries, Overtime, Home Owners Allowance and Medical Aid by salary band for the period 1 April 2015 and 31 March 2016
salary band
salariEs OVErTiME hOME OwnErs allOwanCE MEdiCal aidaMOunT (r’000) salariEs as a%
Of pErsOnnEl COsTs
aMOunT (r’000) OVErTiME as a% Of pErsOnnEl
COsTs
aMOunT (r’000) hOa as a% Of pErsOnnEl
COsTs
aMOunT (r’000) MEdiCal aid as a% Of
pErsOnnEl COsTs
Skilled (Levels 3-5) 9204 82.9 219 2 878 7.9 2 218 20
Highly skilled production (Levels 6-8) 189 704 93.9 3 627 1.8 7 014 3.5 9 469 4.7
Highly skilled supervision (Levels 9-12) 354 280 84.6 3 015 0.7 6 875 1.6 12 295 2.9
Senior management (Levels 13-16) 209 343 104.4 88 0 3 400 1.7 3 280 1.6
Contract (Levels 1-2) 7 327 131.7 231 4.2 0 0 0 0
Contract (Levels 3-5) 3386 89.2 141 3.7 0 0 0 0
Contract (Levels 6-8) 17 004 106 19 0.1 38 0.2 15 0.1
Contract (Levels 9-12) 38 268 164.5 106 0.5 53 0.2 354 1.5Contract (Levels 13-16) 24 369 95.3 0 0 68 0.3 302 1.2Abnormal Appointment 2 587 111.8 0 0 0 0 0 0TOTal 855 472 94.1 7 446 0.8 18 326 2 27 933 3.1

104
3.2. Employment and Vacancies
Table 3.2.1 Employment and vacancies by programme as on 31 March 2016
prOgraMMEnuMbEr Of pOsTs On
apprOVEd EsTablishMEnTnuMbEr Of pOsTs fillEd VaCanCy raTE nuMbEr Of EMplOyEEs
addiTiOnal TO ThE EsTablishMEnT
Prog1/admin, Permanent 752 711 5.4 15
Prog2/lace, Permanent 185 167 9.7 2
Prog3/oc, Permanent 167 153 8.4 67
Prog4/cc&aq, Permanent 81 76 6.2 14
Prog5/b&c, Permanent 118 114 3.4 9
Prog6/envprog, Permanent 497 457 8. 40
Prog7/chem&waste mng, Permanent 95 87 8.4 0
TOTal 1 895 1 765 6.8 147
Notes• Permanent post and excluding Minster and Deputy Minister.
Table 3.2.2 Employment and vacancies by salary band as on 31 March 2016
salary bandnuMbEr Of pOsTs On
apprOVEd EsTablishMEnTnuMbEr Of pOsTs fillEd VaCanCy raTE nuMbEr Of EMplOyEEs
addiTiOnal TO ThE EsTablishMEnT
Lower skilled ( 1-2) 2 2 0 32
Skilled(3-5) 89 85 4.5 2
Highly skilled production (6-8) 786 727 7.5 53
Highly skilled supervision (9-12) 838 780 6.9 44
Senior management (13-16) 180 171 5 16
TOTal 1 895 1 765 6.8 147
Note: Permanent Posts
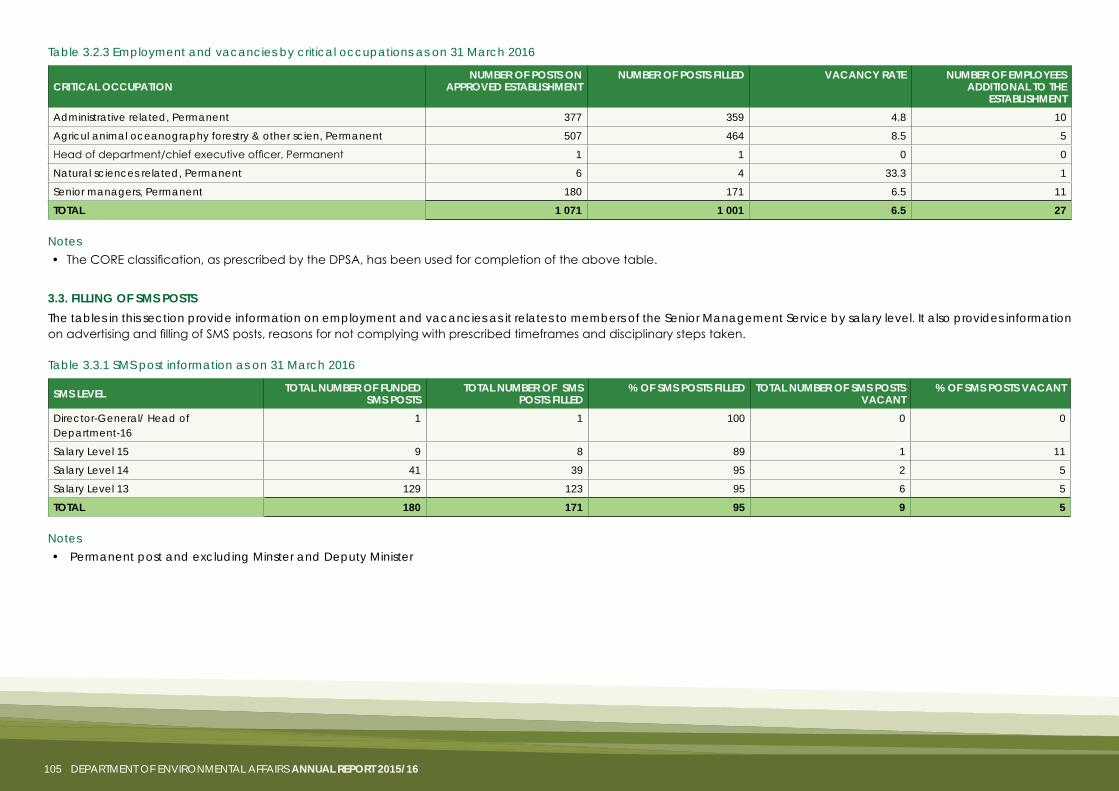
DEPARTMENT OF ENVIRONMENTAL AFFAIRS ANNUAL REPORT 2015/16105
Table 3.2.3 Employment and vacancies by critical occupations as on 31 March 2016
CriTiCal OCCupaTiOnnuMbEr Of pOsTs On
apprOVEd EsTablishMEnTnuMbEr Of pOsTs fillEd VaCanCy raTE nuMbEr Of EMplOyEEs
addiTiOnal TO ThE EsTablishMEnT
Administrative related, Permanent 377 359 4.8 10
Agricul animal oceanography forestry & other scien, Permanent 507 464 8.5 5
Head of department/chief executive officer, Permanent 1 1 0 0
Natural sciences related, Permanent 6 4 33.3 1
Senior managers, Permanent 180 171 6.5 11
TOTal 1 071 1 001 6.5 27
Notes• The CORE classification, as prescribed by the DPSA, has been used for completion of the above table.
3.3. filling Of sMs pOsTsThe tables in this section provide information on employment and vacancies as it relates to members of the Senior Management Service by salary level. It also provides information on advertising and filling of SMS posts, reasons for not complying with prescribed timeframes and disciplinary steps taken.
Table 3.3.1 SMS post information as on 31 March 2016
sMs lEVEl TOTal nuMbEr Of fundEd sMs pOsTs
TOTal nuMbEr Of sMs pOsTs fillEd
% Of sMs pOsTs fillEd TOTal nuMbEr Of sMs pOsTs VaCanT
% Of sMs pOsTs VaCanT
Director-General/ Head of Department-16
1 1 100 0 0
Salary Level 15 9 8 89 1 11
Salary Level 14 41 39 95 2 5
Salary Level 13 129 123 95 6 5
TOTal 180 171 95 9 5
Notes• Permanent post and excluding Minster and Deputy Minister

106
Table 3.3.2 SMS post information as on 30 September 2015
sMs lEVEl TOTal nuMbEr Of fundEd sMs pOsTs
TOTal nuMbEr Of sMs pOsTs fillEd
% Of sMs pOsTs fillEd TOTal nuMbEr Of sMs pOsTs VaCanT
% Of sMs pOsTs VaCanT
Director-General/ Head of Department-16
1 1 100 0 0
Salary Level 15 9 7 78 2 22
Salary Level 14 41 39 95 2 5
Salary Level 13 128 122 95 6 5
TOTal 179 169 94 10 6
Notes• Permanent post and excluding Minster and Deputy Minister
Table 3.3.3 Advertising and filling of SMS posts for the period 1 April 2015 and 31 March 2016
sMs lEVEl
adVErTising filling Of pOsTsnuMbEr Of VaCanCiEs pEr lEVEl
adVErTisEd in 6 MOnThs Of bECOMing VaCanT
nuMbEr Of VaCanCiEs pEr lEVEl fillEd in 6 MOnThs Of bECOMing
VaCanT
nuMbEr Of VaCanCiEs pEr lEVEl nOT fillEd in 6 MOnThs buT fillEd in 12
MOnThs Director-General/ Head of Department-16 0 0 0
Salary Level 15 1 0 1
Salary Level 14 3 1 1
Salary Level 13 7 4 3
TOTal 11 5 5

DEPARTMENT OF ENVIRONMENTAL AFFAIRS ANNUAL REPORT 2015/16107
Table 3.3.4 Reasons for not having complied with the filling of funded vacant SMS posts - Advertised within 6 months and filled within 12 months after becoming vacant for the period 1 April 2015 and 31 March 2016
rEasOns fOr VaCanCiEs nOT adVErTisEd wiThin six MOnThs Not applicable
rEasOns fOr VaCanCiEs nOT fillEd wiThin TwElVE MOnThsMoratorium on the filling of posts due to cost cutting measures and evaluation of human resource demands
Notes• In terms of the Public Service Regulations Chapter 1, Part VII C.1A.3, departments must indicate good cause or reason for not having complied with the filling of SMS posts
within the prescribed timeframes
Table 3.3.5 Disciplinary steps taken for not complying with the prescribed timeframes for filling SMS posts within 12 months for the period 1 April 2015 and 31 March 2016
disCiplinary sTEps TakEn None
Notes• In terms of the Public Service Regulations Chapter 1, Part VII C.1A.2, departments must indicate good cause or reason for not having complied with the filling of SMS posts
within the prescribed timeframes. In the event of non-compliance with this regulation, the relevant executive authority or head of department must take appropriate disciplinary steps in terms of section 16A(1) or (2) of the Public Service Act.

108
3.4. jOb EValuaTiOn
Table 3.4.1 Job Evaluation by Salary band for the period 1 April 2015 and 31 March 2016
salary bandnuMbEr Of pOsTs
On apprOVEd EsTablishMEnT
nuMbEr Of jObs EValuaTEd
% Of pOsTs EValuaTEd by
salary bands
pOsTs upgradEd pOsTs dOwngradEdnuMbEr % Of pOsTs
EValuaTEdnuMbEr % Of pOsTs
EValuaTEdLower Skilled (Levels1-2) 2 0 0 0 0
Skilled (Levels 3-5) 89 4 4.4 1 25 0 0
Highly skilled production (Levels 6-8) 786 319 40.6 1 0.3 0 0
Highly skilled supervision - - - - - - -
(Levels 9-12) 838 53 6.3 0 0 0 0
Senior Management Service Band A 129 109 84.5 0 0 0 0
Senior Management Service Band B 41 36 87.8 0 0 0 0
Senior Management Service Band C 9 7 77.7 0 0 0 0Senior Management Service Band D 1 1 100 0 0 0 0TOTal 1 895 529 27.9 2 0.37 0 0
Notes• Permanent post and excluding Minster and Deputy Minister
• Posts not evaluated during this year did not require evaluation as they were still within the 3 year validity period since the previous evaluation.
Table 3.4.2 Profile of employees whose positions were upgraded due to their posts being upgraded for the period 1 April 2015 and 31 March 2016
gEndEr afriCan asian COlOurEd whiTE TOTalFemale
Male 2 0 0 0 2
TOTal 0 0 0 0 2
Employees with a disability

DEPARTMENT OF ENVIRONMENTAL AFFAIRS ANNUAL REPORT 2015/16109
Table 3.4.3 Employees with salary levels higher than those determined by job evaluation by occupation for the period 1 April 2015 and 31 March 2016
OCCupaTiOn nuMbEr Of EMplOyEEs jOb EValuaTiOn lEVEl rEMunEraTiOn lEVEl rEasOn fOr dEViaTiOnAdministration: deputy director l12 5 12 13 Retention
Provisioning administration clerk iii: senior l6 1 6 7 Retention
Accounting clerk iii: senior l6 1 6 7 Retention
Head: specialist advisor l15 1 15 16 Retention
Policy advisor:chief l14 1 14 15 Retention
Chief director l14 4 14 15 Retention
Administrative officer l7 5 7 8 Retention
Telecom operator: principal l7 1 7 8 Retention
Security officer: chief l7 1 7 8 Grade Progression
Edms content manager: deputy director l11 1 11 12 Retention
Edms administrator l11 1 11 12 Retention
Human resource officer: senior l6 1 6 7 Grade Progression
Hrm: assistant director l10 1 10 11 Retention
Director l13 2 13 14 Retention
Office administrator i l6 3 6 7 Retention
Asd:regional planning & operations support l10 1 10 11 Retention
Accounting clerk: chief l7 1 7 8 Retention
Dd:budget finance planning & control mngt. L11 1 11 12 Retention
Deputy director: strategic partners l12 1 12 13 Retention
Secretary / receptionist l6 1 6 9 Retention
Hr practitioner l7 1 7 8 Grade Progression
Asd: operations and logistics l10 1 10 12 Retention
Policy analyst l11 1 11 12 Retention
Control environmental officer grade b 1 11 13 Retention
Office administrator i l6 1 6 8 Retention
Dd: financial & contract management l11 1 11 12 Retention
Office administrator ii l7 1 7 8 Retention
Special advisor l13 1 13 14 Retention
It project mananer l11 1 11 12 Retention
TOTal nuMbEr Of EMplOyEEs whOsE salariEs ExCEEdEd ThE lEVEl dETErMinEd by jOb EValuaTiOn 43pErCEnTagE Of TOTal EMplOyEd 2.4

110
Table 3.4.4 Profile of employees who have salary levels higher than those determined by job evaluation for the period 1 April 2015 and 31 March 2016
gEndEr afriCan asian COlOurEd whiTE TOTalFemale 10 2 3 7 22
Male 9 2 5 5 21
TOTal 19 4 8 12 43
Employees with a disability
Notes• If there were no cases where the salary levels were higher than those determined by job evaluation, keep the heading and replace the table with the following:
Total number of Employees whose salaries exceeded the grades determine by job evaluation 43
3.5. EMplOyMEnT ChangEsThis section provides information on changes in employment over the financial year. Turnover rates provide an indication of trends in the employment profile of the department.
Table 3.5.1 Annual turnover rates by salary band for the period 1 April 2015 and 31 March 2016
salary bandnuMbEr Of EMplOyEEs aT
bEginning Of pEriOd-april 2015
appOinTMEnTs and TransfErs inTO ThE
dEparTMEnT
TErMinaTiOns and TransfErs OuT Of ThE
dEparTMEnT
TurnOVEr raTE
Lower skilled ( Levels 1-2) 2 0 0 0
Skilled (Levels3-5) 78 1 3 3.8
Highly skilled production (Levels 6-8) 651 48 39 5.9
Highly skilled supervision (Levels 9-12) 78 45 23 3
Senior Management Service Bands A 126 8 4 3
Senior Management Service Bands B 38 4 3 7.9
Senior Management Service Bands C 8 1 1 12.5
Senior Management Service Bands D 1 0 0 0TOTal 1 652 107 73 4.4
Note: Permanent Posts

DEPARTMENT OF ENVIRONMENTAL AFFAIRS ANNUAL REPORT 2015/16111
Table 3.5.2 Annual turnover rates by critical occupation for the period 1 April 2015 and 31 March 2016
CriTiCal OCCupaTiOnnuMbEr Of EMplOyEEs aT
bEginning Of pEriOd-april 2015
appOinTMEnTs and TransfErs inTO ThE
dEparTMEnT
TErMinaTiOns and TransfErs OuT Of ThE
dEparTMEnT
TurnOVEr raTE
Administrative related, Permanent 409 35 28 6.8
Agricul animal oceanography forestry & other scien, Permanent 180 31 14 7.8
Head of department/chief executive officer, Permanent 1 0 0 0
Natural sciences related, Permanent 13 0 0 0
Senior managers, Permanent 173 13 8 4.6
TOTal 776 79 59 7.65%
Notes• The CORE classification, as prescribed by the DPSA, has been used for completion of this table.
Table 3.5.3 Reasons why staff left the department for the period 1 April 2015 and 31 March 2016
TErMinaTiOn TypE nuMbEr % Of TOTal rEsignaTiOnsDeath 3 0.18
Resignation 44 2.6
Dismissal – operational changes 0 0
Dismissal – misconduct 1 0.06
Dismissal – inefficiency 0 0
Discharged due to ill-health 1 0.06
Retirement 3 0.18
Transfer to other Public Service Departments 21 1.27
TOTal 73 4.4TOTal nuMbEr Of EMplOyEEs whO lEfT as a% Of TOTal EMplOyMEnT 73 4.4%

112
Table 3.5.4 Promotions by critical occupation for the period 1 April 2015 and 31 March 2016
OCCupaTiOnEMplOyEEs 1 april
2015prOMOTiOns TO
anOThEr salary lEVEl
salary lEVEl prOMOTiOns as a%
Of EMplOyEEs by OCCupaTiOn
prOgrEssiOns TO anOThEr nOTCh wiThin a salary
lEVEl
nOTCh prOgrEssiOn as a% Of EMplOyEEs
by OCCupaTiOn
Administrative related, Permanent 409 17 4.1 228 55.7
Agricul animal oceanography forestry & other scien, Permanent 180 22 1.2 142 78.8
Head of department/chief executive officer, Permanent 1 0 0 1 100
Natural sciences related, Permanent 13 1 7.7 2 15.4
Senior managers, Permanent 173 5 2.8 160 92.5
TOTal 603 45 5.7 533 67%
Table 3.5.5 Promotions by salary band for the period 1 April 2015 and 31 March 2016
salary bandEMplOyEEs 1 april
2015prOMOTiOns TO
anOThEr salary lEVEl
salary bands prOMOTiOns as a%
Of EMplOyEEs by salary lEVEl
prOgrEssiOns TO anOThEr nOTCh wiThin a salary
lEVEl
nOTCh prOgrEssiOn as a% OfEMplOyEEs
by salary bands
Lower skilled ( Levels 1-2) 2 0 0 0 0
Skilled (Levels3-5) 78 1 1.3 60 76.9
Highly skilled production (Levels 6-8) 651 24 3.7 427 65.6
Highly skilled supervision (Levels 9-12) 748 33 4.4 431 57.6
Senior Management (Level 13-16) 173 5 2.9 157 90.7
TOTal 1 652 63 3.8 1 075 65.1

DEPARTMENT OF ENVIRONMENTAL AFFAIRS ANNUAL REPORT 2015/16113
3.6. EMplOyMEnT EQuiTy
Table 3.6.1 Total number of employees (including employees with disabilities) in each of the following occupational categories as on 31 March 2016
OCCupaTiOnal bandMalE fEMalE
TOTalafriCan COlOurEd indian whiTE afriCan COlOurEd indian whiTE
Legislators, senior officials and managers 62 13 14 11 50 3 8 13 174
Professionals 237 26 6 27 293 19 19 34 661
Technicians and associate professionals 189 18 5 31 232 21 6 26 528
Clerks 76 4 0 3 200 21 2 11 317
Service and sales workers 28 1 0 0 8 0 0 0 37
Skilled agriculture and fishery workers 0 0 0 0 0 0 0 0 0
Craft and related trades workers 1 1 0 0 0 0 0 0 2
Plant and machine operators and assemblers 0 0 0 0 0 0 0 0 0
Elementary occupations
sub-TOTal 593 63 25 72 783 64 35 84 1 719EMplOyEEs wiTh disabiliTiEs 8 1 1 5 18 2 1 12 48grand TOTal 601 64 26 77 801 66 36 96 1 767
Table 3.6.2 Total number of employees (including employees with disabilities) in each of the following occupational bands as on 31 March 2016
OCCupaTiOnal bandMalE fEMalE
TOTalafriCan COlOurEd indian whiTE afriCan COlOurEd indian whiTE
Top Management 2 1 1 1 4 0 0 1 10
Senior Management 58 12 13 10 48 3 8 12 164
Professionally qualified and experienced specialists and mid-management
275 23 8 49 334 25 21 45 780
Skilled technical and academically qualified workers, junior management, supervisors, foreman and superintendents
237 27 3 12 380 35 6 26 726
Semi-skilled and discretionary decision making 37 6 0 0 38 4 0 0 85
Unskilled and defined decision making 1 0 0 0 1 0 0 0 2
TOTal 610 69 25 72 805 67 35 84 1 767

114
Table 3.6.3 Recruitment for the period 1 April 2015 to 31 March 2016
OCCupaTiOnal bandMalE fEMalE
TOTalafriCan COlOurEd indian whiTE afriCan COlOurEd indian whiTE
Top Management 1 0 0 0 0 0 0 0 1
Senior Management 2 1 0 0 7 0 2 0 12
Professionally qualified and experienced specialists and mid-management
17 0 1 1 25 0 0 1 45
Skilled technical and academically qualified workers, junior management, supervisors, foreman and superintendents
18 1 0 0 25 3 0 1 48
Semi-skilled and discretionary decision making 0 0 0 0 0 1 0 0 1
Unskilled and defined decision making 0 0 0 0 0 0 0 0 0
TOTal 38 2 1 1 57 4 2 2 107EMplOyEEs wiTh disabiliTiEs 2 0 0 0 0 0 0 0 2
Table 3.6.4 Promotions for the period 1 April 2015 to 31 March 2016
OCCupaTiOnal bandMalE fEMalE
TOTalafriCan COlOurEd indian whiTE afriCan COlOurEd indian whiTE
Top Management (15-16) 1 0 0 0 0 0 0 0 1
Senior Management (13-14 2 1 0 0 7 0 2 0 12
Professionally qualified and experienced specialists and mid-management (9-12)
17 0 1 1 25 0 0 1 45
Skilled technical and academically qualified workers, junior management, supervisors, foreman and superintendents (6-8)
18 1 0 0 25 3 0 1 48
Semi-skilled and discretionary decision making (3-5) 0 0 0 0 0 1 0 0 1
Unskilled and defined decision making (1-2) 0 0 0 0 0 0 0 0 0
TOTal 38 2 1 1 57 4 2 2 107EMplOyEEs wiTh disabiliTiEs 2 0 0 0 0 0 0 0 2

DEPARTMENT OF ENVIRONMENTAL AFFAIRS ANNUAL REPORT 2015/16115
Table 3.6.5 Terminations for the period 1 April 2015 to 31 March 2016
OCCupaTiOnal bandMalE fEMalE
TOTalafriCan COlOurEd indian whiTE afriCan COlOurEd indian whiTE
Top Management 0 0 0 0 0 0 0 1 1
Senior Management 2 1 0 0 2 0 0 1 6
Professionally qualified and experienced specialists and mid-management
7 1 0 1 6 0 0 2 17
Skilled technical and academically qualified workers, junior management, supervisors, foreman and superintendents
9 2 0 1 12 0 0 1 25
Semi-skilled and discretionary decision making 1 0 0 0 1 0 0 0 2
Unskilled and defined decision making 0 0 0 0 0 0 0 0 0
TOTal 19 4 0 2 21 0 0 5 51EMplOyEEs wiTh disabiliTiEs 0 0 0 0 0 0 0 0 0
Table 3.6.6 Disciplinary action for the period 1 April 2015 to 31 March 2016
disCiplinary aCTiOnMalE fEMalE
TOTalafriCan COlOurEd indian whiTE afriCan COlOurEd indian whiTE
Verbal Warning 2 0 0 1 2 0 0 0 5
Written Warning 2 0 0 1 0 0 0 0 3
Final Written Warning 2 0 0 2 4 0 0 0 8
Suspension Without pay 2 0 0 0 1 0 0 0 3
Demotion 1 0 0 0 1 0 0 0 2
Dismissal 1 0 0 0 0 0 0 0 1
Resignation 2 1 0 2 1 0 0 0 6
TOTal 12 1 0 6 9 0 0 0 28

116
Table 3.6.7 Skills development for the period 1 April 2015 to 31 March 2016
OCCupaTiOnal CaTEgOryMalE fEMalE
TOTalafriCan COlOurEd indian whiTE afriCan COlOurEd indian whiTE
Legislators, senior officials and managers 23 7 12 4 34 2 3 9 94
Professionals 132 21 3 11 185 16 9 19 396
Technicians and associate professionals 42 1 4 4 80 1 1 4 137
Clerks 170 8 0 0 274 15 5 7 479
Service and sales workers 5 0 0 0 0 0 0 0 5
Skilled agriculture and fishery workers 0 0 0 0 0 0 0 0 0
Craft and related trades workers 0 0 0 0 0 0 0 0 0
Plant and machine operators and assemblers 0 0 0 0 0 0 0 0 0
Elementary occupations 0 0 0 0 0 0 0 0 0
TOTal 372 37 19 19 573 34 18 39 1 111EMplOyEEs wiTh disabiliTiEs 0 0 0 0 0 0 0 0 0
3.7. signing Of pErfOrManCE agrEEMEnTs by sMs MEMbErsAll members of the SMS must conclude and sign performance agreements within specific timeframes. Information regarding the signing of performance agreements by SMS members, the reasons for not complying within the prescribed timeframes and disciplinary steps taken is presented here.
Table 3.7.1 Signing of Performance Agreements by SMS members as on 31 May 2015
sMs lEVEl TOTal nuMbEr Of fundEd sMs pOsTs
TOTal nuMbEr Of sMs MEMbErs
TOTal nuMbEr Of signEd pErfOrManCE agrEEMEnTs
signEd pErfOrManCE agrEEMEnTs as% Of TOTal nuMbEr Of sMs MEMbErs
Director-General/ Head of Department-16 1 1 1 100
Salary Level 15 9 8 8 100
Salary Level 14 41 39 38 97
Salary Level 13 129 123 122 99
TOTal 180 171 169 98.8
Table 3.7.2 Reasons for not having concluded Performance agreements for all SMS members as on 31 May 2015
rEasOns Performance agreements for 2 SMS members were not signed by 31 may 2015 because the officials joined the department after the 1st of April 2015 and they were given a 2 months grace period to finalise and sign their agreements. The outstanding agreements were subsequently submitted.

DEPARTMENT OF ENVIRONMENTAL AFFAIRS ANNUAL REPORT 2015/16117
Table 3.7.3 Disciplinary steps taken against SMS members for not having concluded Performance agreements as on 31 March 2015
rEasOns No disciplinary steps taken. Performance agreements of all SMS members were finalised and signed within time frame
3.8. pErfOrManCE rEwardsTo encourage good performance, the department has granted the following performance rewards during the year under review. The information is presented in terms of race, gender, disability, salary bands and critical occupations (see definition in notes below).
Table 3.8.1 Performance Rewards by race, gender and disability for the period 1 April 2015 to 31 March 2016
raCE and gEndEr bEnEfiCiary prOfilE COsTnuMbEr Of
bEnEfiCiariEsnuMbEr Of EMplOyEEs
% Of TOTal wiThin grOup
COsT (r’000) aVEragE COsT pEr EMplOyEE
African Male 485 653 74.3 6 379 13 153
Female 649 828 78.4 7 547 11 629
asian Male 21 27 77.8 461 21 942
Female 24 35 68.6 378 15 755
Coloured Male 61 71 85.9 1 003 16 443 Female 57 66 86.4 694 12 184white Male 58 88 65.9 970 16 716 Female 63 87 72.4 889 14 106EMplOyEEs wiTh a disabiliTy 43 49 87.8 506 11 761TOTal 1 461 1 904 76.7 18 827 12 886
Note: The financial information provided above is for the payment of bonuses implemented in the 2015-16 financial year for the 2014-15 performance cycle

118
Table 3.8.2 Performance Rewards by salary band for personnel below Senior Management Service for the period 1 April 2015 to 31 March 2016
salary band bEnEfiCiary prOfilE COsT TOTal COsT as a% Of ThE TOTal
pErsOnnEl ExpEndiTurE
nuMbEr Of bEnEfiCiariEs
nuMbEr Of EMplOyEEs
% Of TOTal wiThin salary bands
TOTal COsT (r’000) aVEragE COsT pEr EMplOyEE
Lower Skilled (Levels 1-2) 0 32 0 0 0 0
Skilled (level 3-5) 73 90 81.1 520 7123 73
Highly skilled production (level 6-8) 591 765 77.25 5371 9087 591
Highly skilled supervision (level 9-12) 607 807 75.2 8049 13260 607
TOTal 1 271 1 894 67.1 13 940 10 968 1 271
Note: The financial information provided above is for the payment of bonuses implemented in the 2015-16 financial year for the 2014-15 performance cycle
Table 3.8.3 Performance Rewards by critical occupation for the period 1 April 2015 to 31 March 2016
CriTiCal OCCupaTiOn bEnEfiCiary prOfilE COsTnuMbEr Of
bEnEfiCiariEsnuMbEr Of EMplOyEEs
% Of TOTal wiThin OCCupaTiOn
TOTal COsT (r’000) aVEragE COsT pEr EMplOyEE
Administrative related, Permanent 281 359 78.3 3 505 12 473
Agricul animal oceanography forestry & other scien, Permanent 341 464 73.5 4 518 13 249
Head of department/chief executive officer, Permanent 0 1 0 0 0
Natural sciences related, Permanent 4 4 100 48 12 000
Senior managers, Permanent 171 185 92.4 4 490 26 257
TOTal 797 1 013 78.6 12 561 12 796
Note: The financial information provided above is for the payment of bonuses implemented in the 2015-16 financial year for the 2014-15 performance cycle

DEPARTMENT OF ENVIRONMENTAL AFFAIRS ANNUAL REPORT 2015/16119
Table 3.8.4 Performance related rewards (cash bonus), by salary band for Senior Management Service for the period 1 April 2015 to 31 March 2016
salary band bEnEfiCiary prOfilE COsT TOTal COsT as a% Of ThE TOTal
pErsOnnEl ExpEndiTurE
nuMbEr Of bEnEfiCiariEs
nuMbEr Of EMplOyEEs
% Of TOTal wiThin salary bands
TOTal COsT (r’000) aVEragE COsT pEr EMplOyEE
Band A 137 150 91.3 3 561 25 993 2.3
Band B 41 43 95.3 983 23 976 1.9
Band C 12 14 85.7 343 28 583 1.5
Band D 0 3 0 0 0 0
TOTal 190 210 90.5 4 887 25 721.1 2.2
Note:The financial information provided above is for the payment of bonuses implemented in the 2015-16 financial year for the 2014-15 performance cycle
Note: This stats is for 2014/15 financial year. The 2015/16 statistics will appear in the next financial year annual report. Assessment for 15/16 are not yet finalised
3.9. fOrEign wOrkErsThe tables below summarise the employment of foreign nationals in the department in terms of salary band and major occupation.
Table 3.9.1 Foreign workers by salary band for the period 1 April 2015 and 31 March 2016
salary band 01 april 2015 31 MarCh 2016 ChangE
nuMbEr % Of TOTal nuMbEr % Of TOTal nuMbEr % ChangE
Highly skilled supervision (Levels 9-12) 3 27.3 5 38.5 2 100
Senior management (Levels 13-16) 3 27.3 3 23.1 0 0
Contract (Levels 9-12) 4 36.4 4 30.8 0 0
Contract (Levels 13-16) 1 9.1 1 7.7 0 0
TOTal 11 100 13 100 2 100

120
Table 3.9.2 Foreign workers by major occupation for the period 1 April 2015 and 31 March 2016
salary band 01 april 2015 31 MarCh 2016 ChangE
nuMbEr % Of TOTal nuMbEr % Of TOTal nuMbEr % ChangE
Professionals and managers 10 90.9 12 92.3 2 100
Technicians and associated professionals 1 9.1 1 7.7 0 0
TOTal 11 100 13 100 2 100
3.10. lEaVE uTilisaTiOn 2The Public Service Commission identified the need for careful monitoring of sick leave within the public service. The following tables provide an indication of the use of sick leave and disability leave. In both cases, the estimated cost of the leave is also provided.
Table 3.10.1 Sick leave for the period 1 January 2015 to 31 December 2015
salary band TOTal days % days wiTh MEdiCal
CErTifiCaTiOn
nuMbEr Of EMplOyEEs using
siCk lEaVE
% Of TOTal EMplOyEEs using
siCk lEaVE
aVEragE days pEr EMplOyEE
EsTiMaTEd COsT (r’000)
Lower Skills (Level 1-2) 121 63.6 38 3.1 3 34
Skilled (levels 3-5) 335 141 59 4.8 9 203
Highly skilled production (levels 6-8) 2 951 139.5 485 39.5 10 3 024
Highly skilled supervision (levels 9 -12) 3 076 144.5 511 41.7 12 6 420
Top and Senior management (levels 13-16) 782 151.8 133 10.9 13 2 774TOTal 7 265 69.2 1 226 100 6 12 455
Note: Includes contracts

DEPARTMENT OF ENVIRONMENTAL AFFAIRS ANNUAL REPORT 2015/16121
Table 3.10.2 Disability leave (temporary and permanent) for the period 1 January 2015 to 31 December 2015
salary band TOTal days % days wiTh MEdiCal
CErTifiCaTiOn
nuMbEr Of EMplOyEEs using disabiliTy lEaVE
% Of TOTal EMplOyEEs using disabiliTy lEaVE
aVEragE days pEr EMplOyEE
EsTiMaTEd COsT (r’000)
Lower skilled (Levels 1-2) 0 0 0 0 0 0
Skilled (Levels 3-5) 35 100 2 2.4 18 21
Highly skilled production (Levels 6-8) 129 100 11 17.8 12 138
Highly skilled supervision (Levels 9-12) 301 100 12 1.5 25 612
Senior management (Levels 13-16) 46 100 3 1.7 15 158
TOTal 511 100 28 100 18.25 929
The table below summarises the utilisation of annual leave. The wage agreement concluded with trade unions in the PSCBC in 2000 requires management of annual leave to prevent high levels of accrued leave being paid at the time of termination of service.
Table 3.10.3 Annual Leave for the period 1 January 2015 to 31 December 2015
salary band TOTal days TakEn nuMbEr Of EMplOyEEs using annual lEaVE
aVEragE pEr EMplOyEE
Lower skilled (Levels 1-2) 761 253 3
Skilled Levels 3-5) 1 604 88 28
Highly skilled production (Levels 6-8) 14 111 757 31
Highly skilled supervision(Levels 9-12) 16 231.64 797 37
Senior management (Levels 13-16) 4986 224 41
TOTal 37 693.64 2 119 18
Note: Includes Contracts

122
Table 3.10.4 Capped leave for the period 1 January 2015 to 31 December 2015
salary band TOTal days Of CappEd lEaVE TakEn
nuMbEr Of EMplOyEEs using CappEd lEaVE
aVEragE nuMbEr Of days TakEn pEr EMplOyEE
aVEragE CappEd lEaVE pEr EMplOyEE as aT 31
MarCh 2016Lower skilled (Levels 1-2) 0 0 0 0
Skilled Levels 3-5) 0 0 0 0
Highly skilled production (Levels 6-8) 17 4 4 31
Highly skilled supervision(Levels 9-12) 16 3 5 42
Senior management (Levels 13-16) 11 3 4 32
Contract (Level 13-16) 6 1 6 11
TOTal 50 11 5 36
The following table summarise payments made to employees as a result of leave that was not taken.
Table 3.10.5 Leave payouts for the period 1 April 2015 and 31 March 2016
rEasOn TOTal aMOunT (r’000) nuMbEr Of EMplOyEEs aVEragE pEr EMplOyEE (r’000)
Leave payout for 2015/16 due to non-utilisation of leave for the previous cycle 0 0 0
Capped leave payouts on termination of service for 2015/16 2 301 71 32 408
Current leave payout on termination of service for 2015/16 1 318 74 17 811
TOTal 3 619 145 24 959
3.11. hiV/aids & hEalTh prOMOTiOn prOgraMMEs
Table 3.11.1 Steps taken to reduce the risk of occupational exposure
Units/categories of employees identified to be at high risk of contracting HIV & related diseases (if any) Key steps taken to reduce the risk
None Conduct HTC quarterly distribution of condoms and information pamphlets
Conduct gender dialogues on HIV issues
Observe HIV awareness and provide counselling

DEPARTMENT OF ENVIRONMENTAL AFFAIRS ANNUAL REPORT 2015/16123
Table 3.11.2 Details of Health Promotion and HIV/AIDS Programmes (tick the applicable boxes and provide the required information)
QuEsTiOn yEs nO dETails, if yEs1. Has the department designated a member of the SMS to implement the provisions contained in Part VI E of Chapter 1 of the Public Service Regulations, 2001? If so, provide her/his name and position
x Mr Sandy Nyathi -Dir: Transformation, Employee Health and Wellness
2. Does the department have a dedicated unit or has it designated specific staff members to promote the health and well-being of your employees? If so, indicate the number of employees who are involved in this task and the annual budget that is available for this purpose
x There are five (5) dedicated staff members to promote Health and Wellbeing of Employees. The annual budget available is R919 000
3. Has the department introduced an Employee Assistance or Health Promotion Programme for your employees? If so, indicate the key elements/services of this Programme
x • Wellness management
• Health and Productivity Management
• HIV and TB Management
• Occupational Health and Safety Management
4. Has the department established (a) committee(s) as contemplated in Part VI E.5 (e) of Chapter 1 of the Public Service Regulations, 2001? If so, please provide the names of the members of the committee and the stakeholder(s) that they represent
x OHS committee and Wellness Champions
5. Has the department reviewed its employment policies and practices to ensure that these do not unfairly discriminate against employees on the basis of their HIV status? If so, list the employment policies/practices so reviewed
x THE Department has 3 approved Wellness policies Namely: HIV and TB Management Policy; Health and Productivity Management Policy and Wellness Management Policy. The OHS policy is in the process of being reviewed
6. Has the department introduced measures to protect HIV-positive employees or those perceived to be HIV-positive from discrimination? If so, list the key elements of these measures
x • Care and support services for HIV infected and affected employees are available
• Counselling services are in place, and condoms are distributed in bathrooms on a regular bases
7. Does the department encourage its employees to undergo Voluntary Counselling and Testing? If so, list the results that you have you achieved
x • 157 employees tested for HIV in the previous financial year
• HCT done on quarterly basis
8. Has the department developed measures/indicators to monitor & evaluate the impact of its health promotion programme? If so, list these measures/indicators
x • Operational plans on the 4 pillars of EHW programmes are submitted to DPSA annually
• Monthly and quarterly reports are provided to management on the implementation of EHW programmes
• Quarterly implementation reports on HCT and EHW submitted to DPSA for MPAT purposes

124
3.12. labOur rElaTiOns
Table 3.12.1 Collective agreements for the period 1 April 2015 and 31 March 2016
subjECT MaTTEr daTENone None
Notes• If there were no agreements, keep the heading and replace the table with the following:
Total number of Collective agreements None
The following table summarises the outcome of disciplinary hearings conducted within the department for the year under review.
Table 3.12.2 Misconduct and disciplinary hearings finalised for the period 1 April 2015 and 31 March 2016
OuTCOMEs Of disCiplinary hEarings nuMbEr % Of TOTalCorrectional counselling 0 0
Verbal warning 3 11
Written warning 5 18
Final written warning 8 28.5
Suspended without pay 3 11
Fine 0 0
Demotion 2 7
Dismissal 1 3.5
Not guilty 0 0
Case withdrawn 0 0
Resignation 6 21
TOTal 28 100
Notes• If there were no agreements, keep the heading and replace the table with the following:
Total number of Disciplinary hearings finalised 28

DEPARTMENT OF ENVIRONMENTAL AFFAIRS ANNUAL REPORT 2015/16125
Table 3.12.3 Types of misconduct addressed at disciplinary hearings for the period 1 April 2015 and 31 March 2016
TypE Of MisCOnduCT nuMbEr % Of TOTalUnauthorized removal of trees at the Vaal Dam 1 3.4
Incapacity: Poor Work performance 2 7.1
Misrepresentation 16 57.1
Unlawful removal of state property 3 10.7
Misuse of state funds 3 10.7
Failure to fulfil contractual obligations 3 10.7
TOTal 28 100
Table 3.12.4 Grievances logged for the period 1 April 2015 and 31 March 2016
griEVanCEs nuMbEr % Of TOTalNumber of grievances resolved 20 21
Number of grievances not resolved 23 24
Number or grievances pending 53 55
TOTal nuMbEr Of griEVanCEs lOdgEd 96 100
Table 3.12.5 Disputes logged with Councils for the period 1 April 2015 and 31 March 2016
dispuTEs nuMbEr % Of TOTalNumber of disputes upheld 1 17
Number of disputes dismissed 5 83
TOTal nuMbEr Of dispuTEs lOdgEd 6 100
Table 3.12.6 Strike actions for the period 1 April 2015 and 31 March 2016
Total number of persons working days lost 0
Total costs working days lost 0
Amount recovered as a result of no work no pay (R’000) 0

126
Table 3.12.7 Precautionary suspensions for the period 1 April 2015 and 31 March 2016
Number of people suspended 0
Number of people who’s suspension exceeded 30 days 0
Average number of days suspended 0
Cost of suspension (R’000) 0

DEPARTMENT OF ENVIRONMENTAL AFFAIRS ANNUAL REPORT 2015/16127
3.13. skills dEVElOpMEnTThis section highlights the efforts of the department with regard to skills development.
Table 3.13.1 Training needs identified for the period 1 April 2015 and 31 March 2016
OCCupaTiOnal CaTEgOry gEndEr nuMbEr Of EMplOyEEs as aT 1
april 2015
Training nEEds idEnTifiEd aT sTarT Of ThE rEpOrTing pEriOd
lEarnErships skills prOgraMMEs & OThEr shOrT
COursEs
OThEr fOrMs Of Training
TOTal
Legislators, senior officials and managers Female 68 0 65 0 65
Male 97 0 94 0 94
Professionals Female 323 0 154 0 154
Male 281 0 116 0 116
Technicians and associate professionals Female 278 0 165 0 165
Male 229 0 137 0 137
Clerks Female 222 0 114 0 114
Male 79 0 32 0 32
Service and sales workers Female 2 0 4 0 4
Male 17 0 2 0 2
Skilled agriculture and fishery workers Female 0 0 0 0 0
Male 0 0 0 0 0
Craft and related trades workers Female 0 0 3 0 3
Male 2 0 3 0 3
Plant and machine operators and assemblers Female 0 0 0
Male 2 0 1 0 1
Elementary occupations Female 2 56 4 0 60
Male 49 44 3 0 47
SUB TOTAL FEMALE 895 56 509 0 565
MALE 757 44 481 0 525
TOTal 1 652 100 990 0 1 090

128
Table 3.13.2 Training provided for the period 1 April 2015 and 31 March 2016
OCCupaTiOnal CaTEgOry gEndEr nuMbEr Of EMplOyEEs as aT 1
april 2015
Training nEEds idEnTifiEd aT sTarT Of ThE rEpOrTing pEriOd
lEarnErships skills prOgraMMEs & OThEr shOrT
COursEs
OThEr fOrMs Of Training
TOTal
Legislators, senior officials and managers Female 68 0 48 0 0
Male 97 0 46 0 0
Professionals Female 323 0 229 0 0
Male 281 0 167 0 0
Technicians and associate professionals Female 278 0 86 0 0
Male 229 0 51 0 0
Clerks Female 222 0 301 0 0
Male 79 0 178 0 0
Service and sales workers Female 2 0 0 0
Male 17 0 5 0 0
Skilled agriculture and fishery workers Female 0 0 0 0 0
Male 0 0 0 0 0
Craft and related trades workers Female 0 0 0 0 0
Male 2 0 0 0 0
Plant and machine operators and assemblers Female 0 0 0 0 0
Male 2 0 0 0 0
Elementary occupations Female 2 56 0 0 0
Male 49 44 0 0 0
SUB TOTAL Female 895 56 664 0 720
Male 757 44 447 0 491
TOTal 1 652 100 1 111 0 1 211

DEPARTMENT OF ENVIRONMENTAL AFFAIRS ANNUAL REPORT 2015/16129
3.14. injury On duTyThe following tables provide basic information on injury on duty.
Table 3.14.1 Injury on duty for the period 1 April 2015 and 31 March 2016
OuTCOMEs Of disCiplinary hEarings nuMbEr % Of TOTalRequired basic medical attention only 6 100
Temporary Total Disablement 0 0
Permanent Disablement 0 0
Fatal 0 0
TOTal 6 100
3.15. uTilisaTiOn Of COnsulTanTs
The following tables relates information on the utilisation of consultants in the department.
In terms of the Public Service Regulations “consultant’ means a natural or juristic person or a partnership who or which provides in terms of a specific contract on an ad hoc basis any of the following professional services to a department against remuneration received from any source:
(a) The rendering of expert advice;
(b) The drafting of proposals for the execution of specific tasks; and
(c) The execution of a specific task which is of a technical or intellectual nature, but excludes an employee of a department.

130
Table 3.15.1 Report on consultant appointments using appropriated funds for the period 1 April 2015 and 31 March 2016
prOjECT TiTlE TOTal nuMbEr Of COnsulTanTs ThaT wOrkEd On
prOjECT
duraTiOn (wOrk days)
COnTraCT ValuE in rand
Apr-15 No orders for consultant for April month No orders to report about
May-15Agriculture Research Council 1 6 r 1 492 214.40 OR-040968
BIO DIR BIODIV RISK MNG
Request for approval to re-advertise and appoint a service provider to conduct research and develop a report on phase 1 of DLDD Land Cover Mapping on UNCCD impact indicators in the country for the Drylands research programme
jun-15 The Vuvuzela Hotline 1 36 r 122 576.64 OR-041176
LACE DIR CAP DEV & SUPP
Appointment of a professional service provider to manage the environmental crime and incident hotline
Csir 1 24 r 14 320 277.00 Or-040698 Appointment of a consultancy to assist the Department with the development of a strategic Environmental Assessment (SEA)
ADM DIR EIM DEV SUPP (NEMA 40)
jul-15 Ekhaya Coaching not indicated 2 R 247 676.00
OR-041350
To appoint Ekhaya Executive and Business Coaching as a single source service provider to conduct work for the Culture Shaping process
ADM Dir Transformation
Urban Econ Development Economists 1 7 r 499 411.88

DEPARTMENT OF ENVIRONMENTAL AFFAIRS ANNUAL REPORT 2015/16131
prOjECT TiTlE TOTal nuMbEr Of COnsulTanTs ThaT wOrkEd On
prOjECT
duraTiOn (wOrk days)
COnTraCT ValuE in rand
OR-041640
Request to increase the funds from R400 000.00 to R499 411.88 and appointment of a sevice provider to conduct a Longitudinal review of Local Government supports Programmes within the Environmental sector
ADM Dir Local Gov Supp
Seninhle Occupational Health Services 2 12 r 478 786.32 OR-041515
Quote Ref no: Q-047-14/15
The appointment of a service provider for the development of an Occupational Health and Safety Programme for the Environmental Management Inspectors at the Department of Environmental Affairs
LACE Dir Cap Dev & supp
Tshiqi Zebediala 1 20 r 500 000.00 OR-041623
Approval for Tshiqi & Zebediela Attorneys to finalize pending Arbitrations of Mesdames Jhupsee and Mayoli
ADM Dir Employee Development
nurturing-growth trading 1 6 r 133 900.00 OR-041750
Request to appoint Nurturing-Growth Trading as a single source service provider for to conduct Team Coaching
ADM DG
Aug-15
AGA General Contractors 1 1 r 85 763.00 OR-041784
Table 3.15.1 Report on consultant appointments using appropriated funds for the period 1 April 2015 and 31 March 2016 (Continued)

132
prOjECT TiTlE TOTal nuMbEr Of COnsulTanTs ThaT wOrkEd On
prOjECT
duraTiOn (wOrk days)
COnTraCT ValuE in rand
Development of a Business Plan for Aloe Ferox Harvesting and Processing in Umzimkhulu area, Kwazulu Natal
BIO DIR BIOPROS & BIO ECON
Csir 1 1 r 99 180.00 Or-041807 Signature of a service level agreement with the Council for Scientific and Industrial Research (CSIR) for the purpose of providing expert advice to the Minister in relation to appeals Lodged against the Environmental Authorisation issued to Appeals Lodged against the Environmental Authorisation issued to Boegoeberg Hydro Electric power station (PTY) ltd and its Associated Infrastructure at Boegoeberg Dam near Groblershoop, Northern Cape
LACE DIR APP & LEG REVIEW
Linlos Investment 2 trading name (Ikamva Consulting) 1 12 r 813 960.00 OR-041863
Request to appoint Ikamva Consulting to provide Technical Support for the UNFCCC Negotiations as asingle source service provider. (To assist the Department with the negotiations under the UNFCCC in the run-up to COP21/CMP11 in Paris, France)
CCAQ CD INT CC REL& NEG
Change Partners Coaching 2 8 r 98 178.00 OR-041789
To request approval to participate in Executive Coaching Ms Reitumetse Molotsoane
CCAQ CD CC MON & EVAL
Sep-15 John Tibane Consulting Service 1 1 r 28 500.00 OR-042140
Facilitation: Emotional Intelligence
Table 3.15.1 Report on consultant appointments using appropriated funds for the period 1 April 2015 and 31 March 2016 (Continued)

DEPARTMENT OF ENVIRONMENTAL AFFAIRS ANNUAL REPORT 2015/16133
prOjECT TiTlE TOTal nuMbEr Of COnsulTanTs ThaT wOrkEd On
prOjECT
duraTiOn (wOrk days)
COnTraCT ValuE in rand
LACE DDG
R Pillay
Landelahni Leadership Development 1 10 r 102 600.00 Request for approval to participate in executive coaching for Mr Nhlanhla Sithole
OR-042309
EP DIR Monitoring & Eval
Nhlanhla Sithole
John Tibane Consulting Service 1 1 r 29 580.00 OR-042157
Facilitation: Emotional Intelligence
LACE DDG
R Pillay
Oct-15
Pricewaterhouse Coopers 4 5 r 308 527.01 OR-042424
Appointmentof a qualified assessor or assessment team to perform the external quality assessment for the Directorate:Internal Audit
ADM DIR INTERNAL AUDIT
Alinah Hlubi
RFP no: Q-049-14/15
Endangered wild life Trust 1 17 r 493 602.40 OR-042417
Assessment of the Socio-Economic Status of rural Communities neighbouring protected areas, the impacts of Rhino Poaching and opportunities for the development of Wildlife-based Economies
Table 3.15.1 Report on consultant appointments using appropriated funds for the period 1 April 2015 and 31 March 2016 (Continued)

134
prOjECT TiTlE TOTal nuMbEr Of COnsulTanTs ThaT wOrkEd On
prOjECT
duraTiOn (wOrk days)
COnTraCT ValuE in rand
BIO Dir Threat or Prot Spec & cit
S Mancotywa
Quotation no:Q-058-15/16
landElahni lEadErship dEVElOpMEnT 1 10 r 102 600.00 OR-042309
Request for approval to participate in executive coaching of Mr Nhlanhla Sithole
EP DIR Monitoring & Evaluation
Nhlanhla Sithole
nov-15 Change pertners 1 1 r 88 000.00 OR-042765
Facilitation of a workshop :Team Coaching for strat Plan
LACE DDG
R Pillay
Deloitte & Touche 1 9 r 64 392.00 OR-041119
To appoint a service provider to perform Senior Management service (SMS) Competency Assessments in the Public service
ADM DIR HUMANRESOURCE MNG
Mr D Vukela
Vuvuzela Hotline Or-041176 Not indicated 12 r 38 484.00 Appointment of a professional service provider tp manage the Environmental Crime and Incident Hotline
LACE
Table 3.15.1 Report on consultant appointments using appropriated funds for the period 1 April 2015 and 31 March 2016 (Continued)

DEPARTMENT OF ENVIRONMENTAL AFFAIRS ANNUAL REPORT 2015/16135
prOjECT TiTlE TOTal nuMbEr Of COnsulTanTs ThaT wOrkEd On
prOjECT
duraTiOn (wOrk days)
COnTraCT ValuE in rand
Mark Jardine
kay ann COnsulTing & adVisOry 1 1 r 268 367.40 OR-042601
National Dialogue on the intensive and selective breeding of color variants in South Africa
BIO & CONS
Thea Carrol
Dec-15 aiMEE ginsburg/bEnEfiTs sE Not indicated 4 r 198 000.00 OR-042901
Request to appoint Benefits SE as a single source service provider for root cause analysis of positive and negative trends in Biodiversity
BIO & CONS
Muleso Kharica
jan-15 No orders for consultant for January month
feb-15 Ekhaya Coaching
Or-043144 Not indicated 2 r 65 508.96 Extention for SMS coaching contract of Ms Hanlie Schoeman with Ekhaya Business Coaching for 16 coaching sessions over a period of 12 months
ADM CD Special Projects
Hanlie Schoeman
Tshiqi Zebediela 1 10 r 100 000.00 OR-043121
To preside at a disciplinary hearing
ADM DDG COO
Table 3.15.1 Report on consultant appointments using appropriated funds for the period 1 April 2015 and 31 March 2016 (Continued)

136
prOjECT TiTlE TOTal nuMbEr Of COnsulTanTs ThaT wOrkEd On
prOjECT
duraTiOn (wOrk days)
COnTraCT ValuE in rand
Riaan Aucamp
Nexus Forensic Services Not indicated 1 r 281 266.02 OR-043123
Request to appoint Nexus Forensic Services to provide services for the Investigation into an allegation in the Environmental Programmes project for Chueni, Maja and Molepo cluster on an urgent basis
ADM Dir Risk MNG
Kevin Manda
Mar-15 No orders for consultant March month
Table 3.15.1 Report on consultant appointments using appropriated funds for the period 1 April 2015 and 31 March 2016 (Continued)

DEPARTMENT OF ENVIRONMENTAL AFFAIRS ANNUAL REPORT 2015/16137
Table 3.15.2 Analysis of consultant appointments using appropriated funds, in terms of Historically Disadvantaged Individuals (HDIs) for the period 1 April 2015 and 31 March 2016
Project title Percentage ownership by HDI groups Percentage management by
HDI groups
Number of consultants from HDI groups that work on the project
Apr-15 No orders for consultant for April month No orders to report about
May-15 E1282:appointment of a service provider to implement an online asset management system for all government-owned air quality monitoring stations in south africa over a period of two(2) years
5 24 months R6 484 204.09
E1289: the appointment of a service provider to supply, install and maintain seven (7) bio-security inspection x-ray scanners on a lease basis for a period of thirty six (36) months to the department of environmental affairs for placement at or tambo international airport
3 36 months R9 837 252.50
E1291: appointment ofservice providers to manage waste management license applications for unlicensed municipal waste disposal facilities in various provinces (south africa)
41 36 months R10 830 696.62
E1300: appointment of a service provider/s to place job advertisement and notices/bids in the print media on behalf of the department for a period of two years
24 months R5 000 000.00
jun-15 No orders to report about
jul-15 No orders to report about
aug-15 No orders to report about
Sep-15 E1301: The appointment of a credible and suitable service provider to assist the department of environmental affairs in compiling the third chapter (chapter 3) of the third national communication (TNC) report that complies with the united nations framework convention on climate change (UNFCCC) reporting guidelines on national communications
7 12 months R4 282 723.50

138
Project title Percentage ownership by HDI groups Percentage management by
HDI groups
Number of consultants from HDI groups that work on the project
E1302:The appointment of a credible and suitable service provider to assist the department of environmental affairs in compiling the fourth chapter (chapter4)(measures to mitigate climate change) of the third national communication (TNC) report that complies with the united nations framework convention on climate change (UNFCCC) reporting guidelines on national communications
5 10 months R 900 507.00
E1303:The appointment of a credible and experienced service provider to assist the Department of Environmental Affairs in integrating all drafted chapters into a Third National Communication (TNC) report that complies with the United Nation Framework Convention on Climate Change (UNFCCC) reporting guidelines on national communications
4 15 months R1 078 918.80
E1292:Appointment of the service provider to develop a mercury inventory in South Africa using United Nations Environment Programme (UNEP) level two toolkits for the identification and quantification of mercury, and a cost-benefit analysis of the implications of South Africa ratifying the MINAMATA convention on mercury for relevant affected sectors and industries
24 months R5 466 252.11
E1298:Appointment of the service provider to undertake a cost-benefit study for air quality management
6 18 months R1 888 980.009
E1308:Appointment of the service provider to manage the pre - feasibility investigation process in relation to the establishment of beach infrastructure within the port st johns local municipality beach areas.
7 12 months R450 000.00
E1311:The appointment of the service provider to support the National Department of Environmental Affairs (DEA) in assisting the Regulating Committee for Meteorological Services (RCMS) in verifying the South African Weather Service (SAWS) aviation tariff proposal and the basis thereof before the new tariffs are approved and promulgated
3 36 months R2 954 105.57
E1306:The appointment of the service provider to develop a national guideline for the preparing and review of Environmental Impact Assessments for mining activities that require environmental authorisations
2 18 months R 535 207.20
Table 3.15.2 Analysis of consultant appointments using appropriated funds, in terms of Historically Disadvantaged Individuals (HDIs) for the period 1 April 2015 and 31 March 2016 (continued)

DEPARTMENT OF ENVIRONMENTAL AFFAIRS ANNUAL REPORT 2015/16139
Project title Percentage ownership by HDI groups Percentage management by
HDI groups
Number of consultants from HDI groups that work on the project
Oct-15 E1317:The appointment of a service provider to develop the national framework for climate services and its associated implementation plan with a programme of action
4 6 months R 2 135 847.00
E1314: The appointment of a service provider for the development of a national GHG inventory system (NGHGIS) to compile sustainable national greenhouse gas emissions inventories.
4 24 months R 3 289 128.00
E1313: The appointment of the service provider to train case officers from the 11 competent authorities in IEM with a focus on the review of applications submitted in terms of the environmental impact assessment (EIA) regulations of 2014 promulgated in terms of the National Environmental Management Act (NEMA)
4 36 months R 4 521 641.91
E1309: The appointment of the service provider to automate the Travel Management and payment processes for the DEA for a period of two (2) years with an option to extend for another year
6 6 months Transactional fees apply
nov-15 No orders to report about
Dec-15 No orders to report about
jan-15 E1319: To appoint a qualified service provider to develop a country-specific CO2 emissions factor for the estimation of Greenhouse Gas (GHG) emissions for ferroalloy production in the metal industry
2 7 months R 1 587 615.30
E1320:The appointment of a service provider to perform a survey on HFC consumption, application and production in South Africa
5 8 months R 1 104 250.00
E1321:The appointment of a service provider to update the South African technology needs assessment as prescribed by the United Nations Framework Convention On Climate Change (UNFCCC)
6 24 months R 1 751 006.94
feb-15 No orders to report about
Mar-15
Table 3.15.2 Analysis of consultant appointments using appropriated funds, in terms of Historically Disadvantaged Individuals (HDIs) for the period 1 April 2015 and 31 March 2016 (Continued)

140
Table 3.15.3 Report on consultant appointments using Donor funds for the period 1 April 2015 and 31 March 2016
prOjECT TiTlE TOTal nuMbEr Of COnsulTanTs ThaT wOrkEd On prOjECT
duraTiOn (wOrk days) dOnOr and COnTraCT ValuE in rand
None None None None
Table 3.15.4 Analysis of consultant appointments using Donor funds, in terms of Historically Disadvantaged Individuals (HDIs) for the period 1 April 2015 and 31 March 2016
prOjECT TiTlE TOTal nuMbEr Of COnsulTanTs ThaT wOrkEd On prOjECT
TOTal duraTiOn (wOrk days) dOnOr and COnTraCT ValuE in rand
None None None None
prOjECT TiTlE TOTal nuMbEr Of COnsulTanTs ThaT wOrkEd On prOjECT
TOTal duraTiOn (wOrk days) dOnOr and COnTraCT ValuE in rand
None None None None
3.16. sEVEranCE paCkagEs
Table 3.16.1 Granting of employee initiated severance packages for the period 1 April 2015 and 31 March 2016
salary band nuMbEr Of appliCaTiOns rECEiVEd
nuMbEr Of appliCaTiOns rEfErrEd TO ThE Mpsa
nuMbEr Of appliCaTiOns suppOrTEd by Mpsa
nuMbEr Of paCkagEs apprOVEd by dEparTMEnT
Lower skilled (Levels 1-2) 0 0 0 0Skilled Levels 3-5) 0 0 0 0
Highly skilled production (Levels 6-8) 0 0 0 0
Highly skilled supervision(Levels 9-12) 0 0 0 0
Senior management (Levels 13-16) 0 0 0 0
TOTal 0 0 0 0

DEPARTMENT OF ENVIRONMENTAL AFFAIRS ANNUAL REPORT 2015/16141
parT E finanCial infOrMaTiOnPART E: FINANCIAL INFORMATION

142
rEpOrT Of ThE audiTOr-gEnEral TO parliaMEnT On VOTE nO. 27: dEparTMEnT Of EnVirOnMEnTal affairs
rEpOrT On ThE finanCial sTaTEMEnTs
Introduction
1. I have audited the financial statements of the Department of Environmental Affairs set out on pages 146 to 231, which comprise the appropriation statement, the statement of financial position as at 31 March 2016, the statement of financial performance, statement of changes in net assets and cash flow statement for the year then ended, as well as the notes, comprising a summary of significant accounting policies and other explanatory information.
Accounting officer’s responsibility for the financial statements
2. The accounting officer is responsible for the preparation and fair presentation of these financial statements in accordance with the Modified Cash Standard and the requirements of the Public Finance Management Act of South Africa, 1999 (Act No. 1 of 1999) (PFMA), and for such internal control as the accounting officer determines is necessary to enable the preparation of financial statements that are free from material misstatement, whether due to fraud or error.
Auditor-general’s responsibility
3. My responsibility is to express an opinion on these financial statements based on my audit. I conducted my audit in accordance with International Standards on Auditing. Those standards require that I comply with ethical requirements, and plan and perform the audit to obtain reasonable assurance about whether the financial statements are free from material misstatement.
4. An audit involves performing procedures to obtain audit evidence about the amounts and disclosures in the financial statements. The procedures selected depend on the auditor’s judgement, including the assessment of the risks of material misstatement of the financial statements, whether due to fraud or error. In making those risk assessments, the auditor considers internal control relevant to the entity’s preparation

DEPARTMENT OF ENVIRONMENTAL AFFAIRS ANNUAL REPORT 2015/16143
and fair presentation of the financial statements in order to design audit procedures that are appropriate in the circumstances, but not for the purpose of expressing an opinion on the effectiveness of the entity’s internal control. An audit also includes evaluating the appropriateness of accounting policies used and the reasonableness of accounting estimates made by management, as well as evaluating the overall presentation of the financial statements.
Opinion
5. In my opinion, the financial statements present fairly, in all material respects, the financial position of the Department of Environmental Affairs as at 31March 2016 and its finan-cial performance and cash flows for the year then ended, in accordance with Modified Cash Standard and the requirements of the PFMA.
Emphasis of matter
6. I draw attention to the matter below. My opinion is not modified in respect of this matter.
Restatement of corresponding figures
7. As disclosed in note 31 to the financial statements, the corresponding figures for 31 March 2015 have been restated as a result of an error discovered during 2016 in the financial statements of the Department of Environmental Affairs at, and for the year ended, 31 March 2015.
Additional matter8. I draw attention to the matter below. My opinion is not modified in respect of this
matter.
Unaudited supplementary schedules9. The supplementary information set out on pages 220 to 231 does not form part of the
financial statements and is presented as additionalinformation.1 have not audited these schedules and, accordingly, I do not express an opinion thereon.
Report on other legal and regulatory requirements
10. In accordance with the Public Audit Act of South Africa, 2004 (Act No. 25 of 2004) and the general notice issued in terms thereof, I have a responsibility to report findings on the reported performance information against predetermined objectives of selected programmes presented in the annual performance report, compliance with legislation and internal control. The objective of my tests was to identify reportable findings as described under each subheading but not to gather evidence to express assurance on these matters. Accordingly, I do not express an opinion or conclusion on these matters.
Predetermined objectives
11. I performed procedures to obtain evidence about the usefulness and reliability of the reported performance information of the following selected programmes presented in the annual performance report of the department for the year ended 31 March 2016:
• Programme 3: Oceans and Coasts on pages 49 to 54• Programme 4: Climate Change and Air Quality on pages 55 to 62
• Programme 6: Environmental Programmes on pages 67 to 72
12. I evaluated the usefulness of the reported performance information to determine whether it was presented in accordance with the National Treasury’s annual reporting principles and whether the reported performance was consistent with the planned programmes. I further performed tests to determine whether indicators and targets were well defined, verifiable, specific, measurable, time bound and relevant, as required by the National Treasury’s Framework for managing programme performance information (FMPPI).
13. I assessed the reliability of the reported performance information to determine whether it was valid, accurate and complete.
14. I did not identify any material findings on the usefulness and reliability of the reported performance information for any of the programmes assessed as indicated in paragraph 11 above.

144
additional Matter
15. Although I identified no material findings on the usefulness and reliability of the reported performance information for the selected programmes, I draw attention to the following matter:
Achievement of planned targets
16. Refer to the annual performance report on page(s) 25 to 76 for information on the achievement of the planned targets for the year.
Compliance with legislation
17. I performed procedures to obtain evidence that the department had complied with applicable legislation regarding financial matters, financial management and other related matters. I did not identify any instances of material non-compliance with specific matters in key legislation, as set out in the general notice issued in terms of the PAA.
Internal control
18. I considered internal control relevant to my audit of the financial statements, annual performance report and compliance with legislation. I did not identify any significant deficiencies in internal control.
Pretoria
16 November 2016

DEPARTMENT OF ENVIRONMENTAL AFFAIRS ANNUAL REPORT 2015/16145
2015/16 annual finanCial sTaTEMEnTsdEparTMEnT Of EnVirOnMEnTal affairs

146
apprOpriaTiOn sTaTEMEnTfor the year ended 31 March 2016
apprOpriaTiOn pEr prOgraMME2015/16 2014/15
VOTEd funds
adjusTEd apprOpriaTiOn
shifTing Of funds
VirEMEnT final apprOpriaTiOn
aCTual ExpEndiTurE
VarianCE ExpEndiTurEas% Of
final apprOpriaTiOn
finalapprOpriaTiOn
aCTualExpEndiTurE
r'000 r'000 r'000 r'000 r'000 r'000 % r'000 r'000prOgraMME1. Administration 870 184 (14 859) (22 838) 832 487 832 487 - 100.0% 731 335 731 335
2. Legal, Authorisations and Compliance
133 921 (5 661) 3 457 131 717 131 417 300 99.8% 102 123 100 621
3. Oceans and Coasts 399 529 4 454 (31 962) 372 021 368 659 3 362 99.1% 349 257 349 257
4. Climate Change and Air Quality
240 149 2 287 3 678 246 114 246 114 - 100.0% 229 292 229 292
5. Biodiversity and Conservation
730 600 (1 544) (28 408) 700 648 699 863 785 99.9% 643 068 643 068
6. Environmental Programmes 3 489 633 18 483 72 454 3 580 570 3 579 640 930 100.0% 3 553 433 3 549 608
7. Chemicals and Waste Management
79 281 (3 160) 3 619 79 740 79 740 - 100.0% 71 878 71 878
TOTal 5 943 297 - - 5 943 297 5 937 920 5 377 99.9% 5 680 386 5 675 059Reconciliation with statement of financial performanceadd: Departmental receipts 11 486 32 022
Aid assistance - 6 690
Actual amounts per statement of financial performance (total revenue)
5 954 783 5 719 098
add: Aid assistance 12 200 12 225
Actual amounts per statement of financial performance (total expenditure)
5 950 120 5 687 284

DEPARTMENT OF ENVIRONMENTAL AFFAIRS ANNUAL REPORT 2015/16147
APPROPRIATION STATEMENTfor the year ended 31 March 2016
Appropriation per economic classification2015/16 2014/15
ECOnOMiC ClassifiCaTiOn
adjusTEd apprOpriaTiOn
shifTing Of funds
VirEMEnT final apprOpriaTiOn
aCTual ExpEndiTurE
VarianCE ExpEndiTurEas% Of
final apprOpriaTiOn
finalapprOpriaTiOn
aCTualExpEndiTurE
r'000 r'000 r'000 r'000 r'000 r'000 % r'000 r'000Current payments 2 000 480 (2 643) (82 376) 1 915 461 1 912 643 2 818 99.9% 1 647 535 1 642 307Compensation of employees 930 681 (1 731) (19 473) 909 477 909 177 300 100.0% 790 801 787 791
Salaries and wages 882 594 (59 406) (19 473) 803 715 803 415 300 100.0% 703 381 700 371
Social contributions 48 087 57 675 - 105 762 105 762 - 100.0% 87 420 87 420
Goods and services 1 069 799 (912) (62 903) 1 005 984 1 003 466 2 518 99.7% 856 734 854 516
Administrative fees 4 498 (3 062) - 1 436 1 436 - 100.0% 1 429 1 429
Advertising 25 167 (10 865) - 14 302 14 302 - 100.0% 14 414 14 414
Minor assets 13 892 (10 808) - 3 084 3 084 - 100.0% 1 616 1 616
Audit costs: External 6 519 2 356 - 8 875 8 875 - 100.0% 5 861 5 861
Bursaries: Employees 2 304 (928) - 1 376 1 376 - 100.0% 1 312 1 312
Catering: Departmental activities
5 698 1 722 - 7 420 7 420 - 100.0% 5 080 5 080
Communication (G&S) 65 909 (16 931) (28 408) 20 570 20 570 - 100.0% 17 328 17 328
Computer services 35 219 36 871 3 457 75 547 75 547 - 100.0% 38 151 35 933
Consultants: Business and advisory services
169 440 (14 220) (27 133) 128 087 126 354 1 733 98.6% 82 295 82 295
Infrastructure and planning services
25 708 (22 703) (3 005) - - - - - -
Laboratory services 1 372 (1 259) - 113 113 - 100.0% 45 45
Scientific and technological services
2 226 (2 226) - - - - - - -
Legal services - 4 093 - 4 093 4 093 - 100.0% 3 528 3 528
Contractors 84 020 71 158 (11 492) 143 686 143 686 - 100.0% 97 507 97 507

148
APPROPRIATION STATEMENTfor the year ended 31 March 2016
Appropriation per economic classification2015/16 2014/15
ECOnOMiC ClassifiCaTiOn
adjusTEd apprOpriaTiOn
shifTing Of funds
VirEMEnT final apprOpriaTiOn
aCTual ExpEndiTurE
VarianCE ExpEndiTurEas% Of
final apprOpriaTiOn
finalapprOpriaTiOn
aCTualExpEndiTurE
r'000 r'000 r'000 r'000 r'000 r'000 % r'000 r'000Agency and support / outsourced services
222 867 (78 660) - 144 207 144 207 - 100.0% 177 013 177 013
Entertainment 676 (548) - 128 128 - 100.0% 85 85
Fleet services (Including Government motor transport)
- 8 466 - 8 466 8 466 - 100.0% 9 199 9 199
Inventory: Food and food supplies
2 039 (1 086) - 953 953 - 100.0% 27 27
Inventory: Fuel, oil and gas 15 079 18 342 - 33 421 33 421 - 100.0% 15 594 15 594
Inventory: Learner and teacher support material
1 156 (1 156) - - - - - - -
Inventory: Materials and supplies
5 239 (4 763) - 476 476 - 100.0% 8 8
Inventory: Medical supplies 930 (906) - 24 24 - 100.0% 1 1
Inventory: Medicine 314 (314) - - - - - - -
Inventory: Other supplies 18 698 (18 698) - - - - - 2 2
Consumable supplies 255 15 836 - 16 091 16 091 - 100.0% 12 985 12 985
Consumable: Stationery, printing and office supplies
12 991 (4 482) - 8 509 8 509 - 100.0% 8 313 8 313
Operating leases 83 727 (12 843) - 70 884 70 884 - 100.0% 76 663 76 663
Property payments 360 12 350 - 12 710 12 710 - 100.0% 15 932 15 932
Transport provided: Departmental activity
11 413 (10 858) - 555 555 - 100.0% 352 352
Travel and subsistence 48 176 560 3 678 180 286 179 501 785 99.6% 169 884 169 884

DEPARTMENT OF ENVIRONMENTAL AFFAIRS ANNUAL REPORT 2015/16149
Appropriation per economic classification2015/16 2014/15
ECOnOMiC ClassifiCaTiOn
adjusTEd apprOpriaTiOn
shifTing Of funds
VirEMEnT final apprOpriaTiOn
aCTual ExpEndiTurE
VarianCE ExpEndiTurEas% Of
final apprOpriaTiOn
finalapprOpriaTiOn
aCTualExpEndiTurE
r'000 r'000 r'000 r'000 r'000 r'000 % r'000 r'000Training and development 102 999 (85 266) - 17 733 17 733 - 100.0% 15 301 15 301
Operating payments 26 756 38 521 - 65 277 65 277 - 100.0% 50 066 50 066
Venues and facilities 63 827 (29 169) - 34 658 34 658 - 100.0% 34 468 34 468
Rental and hiring 58 453 (55 436) - 3 017 3 017 - 100.0% 2 275 2 275
Transfers and subsidies 3 759 775 4 641 100 024 3 864 440 3 863 510 930 100.0% 3 895 367 3 895 268Provinces and municipalities - 42 - 42 42 - 100.0% 23 23
Provinces - - - - - - - 23 23
Provincial agencies and funds
- - - - - - - 23 23
Municipalities - 42 - 42 42 - 100.0% - -
Municipal agencies and funds
- 42 - 42 42 - 100.0% - -
Departmental agencies and accounts (non-business entities)
1 111 415 1 046 - 1 112 461 1 112 461 - 100.0% 1 210 257 1 210 257
Social security funds - 1 044 - 1 044 1 044 - 100.0% 3 861 3 861
Departmental agencies and accounts
1 111 415 2 - 1 111 417 1 111 417 - 100.0% 1 206 396 1 206 396
Foreign governments and international organisations
16 000 - - 16 000 16 000 - 100.0% 16 000 16 000
Public corporations and private enterprises
300 000 - - 300 000 300 000 - 100.0% 250 000 250 000
Public corporations 300 000 - - 300 000 300 000 - 100.0% 250 000 250 000
Other transfers to public corporations
300 000 - - 300 000 300 000 - 100.0% 250 000 250 000
APPROPRIATION STATEMENTfor the year ended 31 March 2016

150
Appropriation per economic classification2015/16 2014/15
ECOnOMiC ClassifiCaTiOn
adjusTEd apprOpriaTiOn
shifTing Of funds
VirEMEnT final apprOpriaTiOn
aCTual ExpEndiTurE
VarianCE ExpEndiTurEas% Of
final apprOpriaTiOn
finalapprOpriaTiOn
aCTualExpEndiTurE
r'000 r'000 r'000 r'000 r'000 r'000 % r'000 r'000Non-profit institutions 3 687 - - 3 687 3 687 - 100.0% 3 687 3 687
Households 2 328 673 3 553 100 024 2 432 250 2 431 320 930 100.0% 2 415 400 2 415 301
Social benefits - 2 623 - 2 623 2 623 - 100.0% 2 331 2 331
Other transfers to households 2 328 673 930 100 024 2 429 627 2 428 697 930 100.0% 2 413 069 2 412 970
Payments for capital assets 183 042 (2 906) (17 648) 162 488 160 859 1 629 99.0% 137 083 137 083Buildings and other fixed structures
135 516 (6 160) - 129 356 129 356 - 100.0% 103 191 103 191
Buildings 135 516 (6 163) - 129 353 129 353 - 100.0% 103 191 103 191
Other fixed structures - 3 - 3 3 - 100.0% - -
Machinery and equipment 47 526 1 430 (17 648) 31 308 29 679 1 629 94.8% 23 573 23 573
Transport equipment 1 177 4 763 - 5 940 5 940 - 100.0% 5 857 5 857
Other machinery and equipment
46 349 (3 333) (17 648) 25 368 23 739 1 629 93.6% 17 716 17 716
Software and other intangible assets
- 1 824 - 1 824 1 824 - 100.0% 10 319 10 319
Payments for financial assets - 908 - 908 908 - 100.0% 401 401TOTal 5 943 297 - - 5 943 297 5 937 920 5 377 99.9% 5 680 386 5 675 059
APPROPRIATION STATEMENTfor the year ended 31 March 2016

DEPARTMENT OF ENVIRONMENTAL AFFAIRS ANNUAL REPORT 2015/16151
APPROPRIATION STATEMENTfor the year ended 31 March 2016
Programme 1: ADMINISTRATION2015/16 2014/15
sub prOgraMME
adjusTEd apprOpriaTiOn
shifTing Of funds
VirEMEnT final apprOpriaTiOn
aCTual ExpEndiTurE
VarianCE ExpEndiTurEas% Of
final apprOpriaTiOn
finalapprOpriaTiOn
aCTualExpEndiTurE
r'000 r'000 r'000 r'000 r'000 r'000 % r'000 r'0001. Management 138 375 39 369 - 177 744 177 744 - 100.0% 130 661 130 661
2. Corporate Affairs 289 425 (58 725) (22 838) 207 862 207 862 - 100.0% 185 749 185 749
3. Environmental Advisory Services
105 523 7 861 - 113 384 113 384 - 100.0% 111 326 111 326
4. Financial Management 61 348 5 291 - 66 639 66 639 - 100.0% 60 017 60 017
5. Office Accommodation 215 606 (14 371) - 201 235 201 235 - 100.0% 186 947 186 947
6. Environmental Sector Coordination
59 907 5 716 - 65 623 65 623 - 100.0% 56 635 56 635
TOTal fOr sub prOgraMME 870 184 (14 859) (22 838) 832 487 832 487 - 100.0% 731 335 731 335
ECOnOMiC ClassifiCaTiOn r'000 r'000 r'000 r'000 r'000 r'000 % r'000 r'000Current payments 710 445 (19 989) (22 838) 667 618 667 618 - 100.0% 589 855 589 855Compensation of employees 369 611 (19 989) - 349 622 349 622 - 100.0% 316 217 316 217
Salaries and wages 353 945 (45 565) - 308 380 308 380 - 100.0% 279 753 279 753
Social contributions 15 666 25 576 - 41 242 41 242 - 100.0% 36 464 36 464
Goods and services 340 834 - (22 838) 317 996 317 996 - 100.0% 273 638 273 638
Administrative fees 2 362 (1 520) - 842 842 - 100.0% 661 661
Advertising 17 704 (8 053) - 9 651 9 651 - 100.0% 8 490 8 490
Minor assets 7 251 (6 162) - 1 089 1 089 - 100.0% 636 636
Audit costs: External 6 498 2 142 - 8 640 8 640 - 100.0% 5 861 5 861
Bursaries: Employees 1 533 (359) - 1 174 1 174 - 100.0% 1 252 1 252
Catering: Departmental activities
1 896 2 127 - 4 023 4 023 - 100.0% 2 730 2 730

152
Programme 1: ADMINISTRATION2015/16 2014/15
sub prOgraMME
adjusTEd apprOpriaTiOn
shifTing Of funds
VirEMEnT final apprOpriaTiOn
aCTual ExpEndiTurE
VarianCE ExpEndiTurEas% Of
final apprOpriaTiOn
finalapprOpriaTiOn
aCTualExpEndiTurE
r'000 r'000 r'000 r'000 r'000 r'000 % r'000 r'000Communication (G&S) 7 360 8 - 7 368 7 368 - 100.0% 5 122 5 122
Computer services 20 148 43 178 - 63 326 63 326 - 100.0% 29 698 29 698
Consultants: Business and advisory services
32 072 8 593 (8 341) 32 324 32 324 - 100.0% 17 319 17 319
Infrastructure and planning services
14 300 (11 295) (3 005) - - - - - -
Scientific and technological services
464 (464) - - - - - - -
Legal services - 318 - 318 318 - 100.0% 732 732
Contractors 19 122 (4 341) (11 492) 3 289 3 289 - 100.0% 4 834 4 834
Agency and support / outsourced services
73 205 (72 860) - 345 345 - 100.0% 638 638
Entertainment 95 (60) - 35 35 - 100.0% 41 41
Fleet services (Including government motor transport)
- 694 - 694 694 - 100.0% 502 502
Inventory: Food and food supplies
32 1 - 33 33 - 100.0% - -
Inventory: Fuel, oil and gas 836 (822) - 14 14 - 100.0% - -
Inventory: Materials and supplies
968 (953) - 15 15 - 100.0% 6 6
Inventory: Other supplies 6 133 (6 133) - - - - - - -
Consumable supplies 25 5 983 - 6 008 6 008 - 100.0% 3 709 3 709
Consumable: Stationery, printing and office supplies
4 183 593 - 4 776 4 776 - 100.0% 3 409 3 409
APPROPRIATION STATEMENTfor the year ended 31 March 2016

DEPARTMENT OF ENVIRONMENTAL AFFAIRS ANNUAL REPORT 2015/16153
Programme 1: ADMINISTRATION2015/16 2014/15
sub prOgraMME
adjusTEd apprOpriaTiOn
shifTing Of funds
VirEMEnT final apprOpriaTiOn
aCTual ExpEndiTurE
VarianCE ExpEndiTurEas% Of
final apprOpriaTiOn
finalapprOpriaTiOn
aCTualExpEndiTurE
r'000 r'000 r'000 r'000 r'000 r'000 % r'000 r'000Operating leases 70 105 (4 870) - 65 235 65 235 - 100.0% 74 940 74 940
Property payments 201 10 771 - 10 972 10 972 - 100.0% 15 560 15 560
Transport provided: Departmental activity
6 310 (5 755) - 555 555 - 100.0% 352 352
Travel and subsistence - 58 259 - 58 259 58 259 - 100.0% 53 387 53 387
Training and development 20 028 (8 727) - 11 301 11 301 - 100.0% 10 546 10 546
Operating payments 5 615 3 284 - 8 899 8 899 - 100.0% 18 726 18 726
Venues and facilities 13 393 3 327 - 16 720 16 720 - 100.0% 13 606 13 606
Rental and hiring 8 995 (6 904) - 2 091 2 091 - 100.0% 881 881
Transfers and subsidies 16 000 1 388 - 17 388 17 388 - 100.0% 17 225 17 225Provinces and municipalities - 34 - 34 34 - 100.0% 16 16
Provinces - - - - - - - 16 16
Provincial agencies and funds
- - - - - - - 16 16
Municipalities - 34 - 34 34 - 100.0% - -
Municipal agencies and funds - 34 - 34 34 - 100.0% - -
Departmental agencies and accounts
- 7 - 7 7 - 100.0% 22 22
Social security funds - 5 - 5 5 - 100.0% 20 20
Departmental agencies - 2 - 2 2 - 100.0% 2 2
Foreign governments and international organisations
16 000 - - 16 000 16 000 - 100.0% 16 000 16 000
Households - 1 347 - 1 347 1 347 - 100.0% 1 187 1 187
APPROPRIATION STATEMENTfor the year ended 31 March 2016

154
Programme 1: ADMINISTRATION2015/16 2014/15
sub prOgraMME
adjusTEd apprOpriaTiOn
shifTing Of funds
VirEMEnT final apprOpriaTiOn
aCTual ExpEndiTurE
VarianCE ExpEndiTurEas% Of
final apprOpriaTiOn
finalapprOpriaTiOn
aCTualExpEndiTurE
r'000 r'000 r'000 r'000 r'000 r'000 % r'000 r'000Social benefits - 425 - 425 425 - 100.0% 1 187 1 187
Other transfers to households - 922 - 922 922 - 100.0% - -
Payments for capital assets 143 739 3 435 - 147 174 147 174 - 100.0% 124 093 124 093Buildings and other fixed structures
135 516 (6 163) - 129 353 129 353 - 100.0% 103 191 103 191
Buildings 135 516 (6 163) - 129 353 129 353 - 100.0% 103 191 103 191
Machinery and equipment 8 223 8 003 - 16 226 16 226 - 100.0% 10 919 10 919
Transport equipment 1 177 3 107 - 4 284 4 284 - 100.0% 4 039 4 039
Other machinery and equipment
7 046 4 896 - 11 942 11 942 - 10.00% 6 880 6 880
Software and other intangible assets
- 1 595 - 1 595 1 595 - 100.0% 9 983 9 983
Payments for financial assets - 307 - 307 307 - 100.0% 162 162
TOTal 870 184 (14 859) (22 838) 832 487 832 487 - 100.0% 731 335 731 335
APPROPRIATION STATEMENTfor the year ended 31 March 2016

DEPARTMENT OF ENVIRONMENTAL AFFAIRS ANNUAL REPORT 2015/16155
APPROPRIATION STATEMENTfor the year ended 31 March 2016
Programme 2: LEGAL, AUTHORISATIONS AND COMPLIANCE2015/16 2014/15
sub prOgraMME
adjusTEd apprOpriaTiOn
shifTing Of funds
VirEMEnT final apprOpriaTiOn
aCTual ExpEndiTurE
VarianCE ExpEndiTurEas% Of
final apprOpriaTiOn
finalapprOpriaTiOn
aCTualExpEndiTurE
r'000 r'000 r'000 r'000 r'000 r'000 % r'000 r'0001. Legal, Authorisations and
Compliance Management6 133 5 524 3 457 15 114 15 114 - 100.0% 7 040 7 040
2. Compliance Monitoring 20 313 4 462 - 24 775 24 775 - 100.0% 19 966 19 966
3. Integrated Environmental Authorisations
50 653 (20 187) - 30 466 30 166 300 99.0% 27 363 25 861
4. Enforcement 32 428 3 466 - 35 894 35 894 - 100.0% 26 970 26 970
5. Corporate Legal Support and Litigation
9 342 1 424 - 10 766 10 766 - 100.0% 8 821 8 821
6. Law Reform and Appeals 15 052 (350) - 14 702 14 702 - 100.0% 11 963 11 963
TOTal fOr sub prOgraMME 133 921 (5 661) 3 457 131 717 131 417 300 99.8% 102 123 100 621
ECOnOMiC ClassifiCaTiOn r'000 r'000 r'000 r'000 r'000 r'000 % r'000 r'000Current payments 133 004 (7 526) 3 457 128 935 128 635 300 99.8% 99 501 97 999Compensation of employees 98 825 (7 336) - 91 489 91 189 300 99.7% 76 465 74 963
Salaries and wages 92 015 (12 662) - 79 353 79 053 300 99.6% 67 459 65 957
Social contributions 6 810 5 326 - 12 136 12 136 - 100.0% 9 006 9 006
Goods and services 34 179 (190) 3 457 37 446 37 446 - 100.0% 23 036 23 036
Administrative fees 39 20 - 59 59 - 100.0% 93 93
Advertising 873 (501) - 372 372 - 100.0% 292 292
Minor assets 842 (456) - 386 386 - 100.0% 148 148
Bursaries: Employees 72 (36) - 36 36 - 100.0% - -
Catering: Departmental activities
440 64 - 504 504 - 100.0% 296 296

156
Programme 2: LEGAL, AUTHORISATIONS AND COMPLIANCE2015/16 2014/15
sub prOgraMME
adjusTEd apprOpriaTiOn
shifTing Of funds
VirEMEnT final apprOpriaTiOn
aCTual ExpEndiTurE
VarianCE ExpEndiTurEas% Of
final apprOpriaTiOn
finalapprOpriaTiOn
aCTualExpEndiTurE
r'000 r'000 r'000 r'000 r'000 r'000 % r'000 r'000Communication (G&S) 1 402 (622) - 780 780 - 100.0% 596 596
Computer services 644 5 800 3 457 9 901 9 901 - 100.0% 1 188 1 188
Consultants: Business and advisory services
4 210 (3 225) - 985 985 - 100.0% 1 154 1 154
Laboratory services 250 (141) - 109 109 - 100.0% 45 45
Scientific and technological services
1 186 (1 186) - - - - - - -
Legal services - 1 893 - 1 893 1 893 - 100.0% 1 677 1 677
Contractors 533 102 - 635 635 - 100.0% 218 218
Entertainment 41 (35) - 6 6 - 100.0% 4 4
Fleet services - 16 - 16 16 - 100.0% 2 2
Inventory: Food and food supplies
5 (5) - - - - - - -
Inventory: Medical supplies - 1 - 1 1 - 100.0% - -
Inventory: Other supplies 706 (706) - - - - - - -
Consumable supplies 230 706 - 936 936 - 100.0% 397 397
Consumable: Stationery, printing and office supplies
1 165 (105) - 1 060 1 060 - 100.0% 1 085 1 085
Operating leases 247 3 - 250 250 - 100.0% 98 98
Travel and subsistence - 13 555 - 13 555 13 555 - 100.0% 11 058 11 058
Training and development 14 056 (13 091) - 965 965 - 100.0% 1 467 1 467
Operating payments 1 403 (436) - 967 967 - 100.0% 1 291 1 291
Venues and facilities 2 412 1 618 - 4 030 4 030 - 100.0% 1 926 1 926
APPROPRIATION STATEMENTfor the year ended 31 March 2016

DEPARTMENT OF ENVIRONMENTAL AFFAIRS ANNUAL REPORT 2015/16157
Programme 2: LEGAL, AUTHORISATIONS AND COMPLIANCE2015/16 2014/15
sub prOgraMME
adjusTEd apprOpriaTiOn
shifTing Of funds
VirEMEnT final apprOpriaTiOn
aCTual ExpEndiTurE
VarianCE ExpEndiTurEas% Of
final apprOpriaTiOn
finalapprOpriaTiOn
aCTualExpEndiTurE
r'000 r'000 r'000 r'000 r'000 r'000 % r'000 r'000Rental and hiring 3 423 (3 423) - - - - - 1 1
Transfers and subsidies - 185 - 185 185 - 100.0% 204 204Provinces and municipalities - 2 - 2 2 - 100.0% - -
Municipalities - 2 - 2 2 - 100.0% - -
Municipal agencies and funds
- 2 - 2 2 - 100.0% - -
Households - 183 - 183 183 - 100.0% 204 204
Social benefits - 183 - 183 183 - 100.0% 204 204
Payments for capital assets 917 1 675 - 2 592 2 592 - 100.0% 2 345 2 345Buildings and other fixed structures
- 3 - 3 3 - 100.0% - -
Other fixed structures - 3 - 3 3 - 100.0% - -
Machinery and equipment 917 1 672 - 2 589 2 589 - 100.0% 2 009 2 009
Transport equipment - 448 - 448 448 - 100.0% 333 333
Other machinery and equipment
917 1 224 - 2 141 2 141 - 100.0% 1 676 1 676
Software and other intangible assets
- - - - - - - 336 336
Payments for financial assets - 5 - 5 5 - 100.0% 73 73TOTal 133 921 (5 661) 3 457 131 717 131 417 300 99.8% 102 123 100 621
APPROPRIATION STATEMENTfor the year ended 31 March 2016

158
APPROPRIATION STATEMENTfor the year ended 31 March 2016
Programme 3: OCEANS AND COASTS2015/16 2014/15
sub prOgraMME
adjusTEd apprOpriaTiOn
shifTing Of funds
VirEMEnT final apprOpriaTiOn
aCTual ExpEndiTurE
VarianCE ExpEndiTurEas% Of
final apprOpriaTiOn
finalapprOpriaTiOn
aCTualExpEndiTurE
r'000 r'000 r'000 r'000 r'000 r'000 % r'000 r'0001. Oceans and Coasts
Management7 898 3 335 - 11 233 11 233 - 100.0% 5 290 5 290
2. Integrated Coastal Management
61 043 4 974 - 66 017 66 017 - 100.0% 88 595 88 595
3. Oceans and Coastal Research
117 941 (2 276) - 115 665 115 665 - 100.0% 92 956 92 956
4. Oceans Conservation 206 667 (2 656) (31 962) 172 049 168 687 3 362 98.0% 157 932 157 932
5. Specialist Monitoring Services 5 980 1 077 - 7 057 7 057 - 100.0% 4 484 4 484
TOTal fOr sub prOgraMME 399 529 4 454 (31 962) 372 021 368 659 3 362 99.1% 349 257 349 257
ECOnOMiC ClassifiCaTiOn r'000 r'000 r'000 r'000 r'000 r'000 % r'000 r'000Current payments 385 707 10 089 (31 962) 363 834 362 101 1 733 99.5% 344 550 344 550Compensation of employees 88 333 11 585 - 99 918 99 918 - 100.0% 84 450 84 450
Salaries and wages 83 591 6 665 - 90 256 90 256 - 100.0% 75 906 75 906
Social contributions 4 742 4 920 - 9 662 9 662 - 100.0% 8 544 8 544
Goods and services 297 374 (1 496) (31 962) 263 916 262 183 1 733 99.3% 260 100 260 100
Administrative fees 103 28 - 131 131 - 100.0% 291 291
Advertising 1 141 (530) - 611 611 - 100.0% 1 650 1 650
Minor assets 1 337 (277) - 1 060 1 060 - 100.0% 279 279
Bursaries: Employees 257 (240) - 17 17 - 100.0% - -
Catering: Departmental activities
228 12 - 240 240 - 100.0% 205 205
Communication (G&S) 1 148 1 615 - 2 763 2 763 - 100.0% 3 048 3 048

DEPARTMENT OF ENVIRONMENTAL AFFAIRS ANNUAL REPORT 2015/16159
Programme 3: OCEANS AND COASTS2015/16 2014/15
sub prOgraMME
adjusTEd apprOpriaTiOn
shifTing Of funds
VirEMEnT final apprOpriaTiOn
aCTual ExpEndiTurE
VarianCE ExpEndiTurEas% Of
final apprOpriaTiOn
finalapprOpriaTiOn
aCTualExpEndiTurE
r'000 r'000 r'000 r'000 r'000 r'000 % r'000 r'000Computer services 1 636 (855) - 781 781 - 100.0% 733 733
Consultants: Business and advisory services
74 503 (1 238) (31 962) 41 303 39 570 1 733 95.8% 14 306 14 306
Laboratory services 1 122 (1 118) - 4 4 - 100.0% - -
Legal services - 329 - 329 329 - 100.0% 256 256
Contractors 1 632 8 855 - 10 487 10 487 - 100.0% 3 458 3 458
Agency and support / outsourced services
147 340 (7 841) - 139 499 139 499 - 100.0% 175 452 175 452
Entertainment 444 (439) - 5 5 - 100.0% 1 1
Fleet services - 5 290 - 5 290 5 290 - 100.0% 6 299 6 299
Inventory: Food and food supplies
1 930 (1 010) - 920 920 - 100.0% 27 27
Inventory: Fuel, oil and gas 6 987 (2 695) - 4 292 4 292 - 100.0% 482 482
Inventory: Learner and teacher support material
711 (711) - - - - - - -
Inventory: Materials and supplies
2 833 (2 829) - 4 4 - 100.0% - -
Inventory: Medical supplies 836 (815) - 21 21 - 100.0% 1 1
Inventory: Medicine 314 (314) - - - - - - -
Inventory: Other supplies 1 108 (1 108) - - - - - 2 2
Consumable supplies - 6 299 - 6 299 6 299 - 100.0% 6 487 6 487
Consumable: Stationery, printing and office supplies
1 214 (346) - 868 868 - 100.0% 914 914
Operating leases 584 (296) - 288 288 - 100.0% 206 206
APPROPRIATION STATEMENTfor the year ended 31 March 2016

160
Programme 3: OCEANS AND COASTS2015/16 2014/15
sub prOgraMME
adjusTEd apprOpriaTiOn
shifTing Of funds
VirEMEnT final apprOpriaTiOn
aCTual ExpEndiTurE
VarianCE ExpEndiTurEas% Of
final apprOpriaTiOn
finalapprOpriaTiOn
aCTualExpEndiTurE
r'000 r'000 r'000 r'000 r'000 r'000 % r'000 r'000Property payments - 1 186 - 1 186 1 186 - 100.0% 217 217
Transport provided: Departmental activity
284 (284) - - - - - - -
Travel and subsistence 31 15 170 - 15 201 15 201 - 100.0% 17 050 17 050
Training and development 14 019 (13 041) - 978 978 - 100.0% 420 420
Operating payments 1 004 28 848 - 29 852 29 852 - 100.0% 24 587 24 587
Venues and facilities 33 090 (32 026) - 1 064 1 064 - 100.0% 3 254 3 254
Rental and hiring 1 538 (1 115) - 423 423 - 100.0% 475 475
Transfers and subsidies - 1 491 - 1 491 1 491 - 100.0% 680 680Provinces and municipalities - 5 - 5 5 - 100.0% - -
Municipalities - 5 - 5 5 - 100.0% - -
Municipal agencies and funds - 5 - 5 5 - 100.0% - -
Households - 1 486 - 1 486 1 486 - 100.0% 680 680
Social benefits - 1 486 - 1 486 1 486 - 100.0% 680 680
Payments for capital assets 13 822 (7 134) - 6 688 5 059 1 629 75.6% 4 021 4 021Machinery and equipment 13 822 (7 363) - 6 459 4 830 1 629 74.8% 4 021 4 021
Transport equipment - 926 - 926 926 - 100.0% 1 300 1 300
Other machinery and equipment
13 822 (8 289) - 5 533 3 904 1 629 70.6% 2 721 2 721
Software and other intangible assets
- 229 - 229 229 - 100.0% - -
Payments for financial assets - 8 - 8 8 - 100.0% 6 6
TOTal 399 529 4 454 (31 962) 372 021 368 659 3 362 99.1% 349 257 349 257
APPROPRIATION STATEMENTfor the year ended 31 March 2016

DEPARTMENT OF ENVIRONMENTAL AFFAIRS ANNUAL REPORT 2015/16161
APPROPRIATION STATEMENTfor the year ended 31 March 2016
Programme 4: CLIMATE CHANGE AND AIR QUALITY2015/16 2014/15
sub prOgraMME
adjusTEd apprOpriaTiOn
shifTing Of funds
VirEMEnT final apprOpriaTiOn
aCTual ExpEndiTurE
VarianCE ExpEndiTurEas% Of
final apprOpriaTiOn
finalapprOpriaTiOn
aCTualExpEndiTurE
r'000 r'000 r'000 r'000 r'000 r'000 % r'000 r'0001. Climate Change
Management 7 215 (548) - 6 667 6 667 - 100.0% 7 642 7 642
2. Climate Change Mitigation 8 168 601 - 8 769 8 769 - 100.0% 8 374 8 374
3. Climate Change Adaptation 4 535 2 418 - 6 953 6 953 - 100.0% 6 593 6 593
4. Air Quality Management 39 846 1 255 - 41 101 41 101 - 100.0% 36 597 36 597
5. South African Weather Service
160 423 - - 160 423 160 423 - 100.0% 152 489 152 489
6. International Climate Change Relations and Negotiations
10 357 (989) 3 678 13 046 13 046 - 100.0% 10 207 10 207
7. Climate Change Monitoring and Evaluation
9 605 (450) - 9 155 9 155 - 100.0% 7 390 7 390
TOTal fOr sub prOgraMME 240 149 2 287 3 678 246 114 246 114 - 100.0% 229 292 229 292
ECOnOMiC ClassifiCaTiOn r'000 r'000 r'000 r'000 r'000 r'000 % r'000 r'000Current payments 77 213 2 761 3 678 83 652 83 652 - 100.0% 74 473 74 473Compensation of employees 50 712 2 822 - 53 534 53 534 - 100.0% 46 070 46 070
Salaries and wages 48 233 (388) - 47 845 47 845 - 100.0% 41 037 41 037
Social contributions 2 479 3 210 - 5 689 5 689 - 100.0% 5 033 5 033
Goods and services 26 501 (61) 3 678 30 118 30 118 - 100.0% 28 403 28 403
Administrative fees 255 (232) - 23 23 - 100.0% 45 45
Advertising 784 (88) - 696 696 - 100.0% 574 574
Minor assets 500 (490) - 10 10 - 100.0% 64 64
Audit costs: External 21 (21) - - - - - - -

162
Programme 4: CLIMATE CHANGE AND AIR QUALITY2015/16 2014/15
sub prOgraMME
adjusTEd apprOpriaTiOn
shifTing Of funds
VirEMEnT final apprOpriaTiOn
aCTual ExpEndiTurE
VarianCE ExpEndiTurEas% Of
final apprOpriaTiOn
finalapprOpriaTiOn
aCTualExpEndiTurE
r'000 r'000 r'000 r'000 r'000 r'000 % r'000 r'000Bursaries: Employees 154 (154) - - - - - - -
Catering: Departmental activities
353 7 - 360 360 - 100.0% 263 263
Communication (G&S) 2 181 (1 673) - 508 508 - 100.0% 482 482
Computer services 7 121 (7 121) - - - - - 1 1
Consultants: Business and advisory services
1 186 11 320 - 12 506 12 506 - 100.0% 9 665 9 665
Scientific and technological services
293 (293) - - - - - - -
Legal services - 860 - 860 860 - 100.0% 155 155
Contractors 29 1 - 30 30 - 100.0% 30 30
Agency and support / outsourced services
433 (433) - - - - - - -
Entertainment 20 (11) - 9 9 - 100.0% 11 11
Inventory: Food and food supplies
17 (17) - - - - - - -
Inventory: Other supplies 152 (152) - - - - - - -
Consumable supplies - 91 - 91 91 - 100.0% 67 67
Consumable: Stationery, printing and office supplies
646 (613) - 33 33 - 100.0% 312 312
Operating leases 160 (55) - 105 105 - 100.0% 65 65
Property payments 137 (137) - - - - - - -
Travel and subsistence - 8 465 3 678 12 143 12 143 - 100.0% 10 813 10 813
APPROPRIATION STATEMENTfor the year ended 31 March 2016

DEPARTMENT OF ENVIRONMENTAL AFFAIRS ANNUAL REPORT 2015/16163
Programme 4: CLIMATE CHANGE AND AIR QUALITY2015/16 2014/15
sub prOgraMME
adjusTEd apprOpriaTiOn
shifTing Of funds
VirEMEnT final apprOpriaTiOn
aCTual ExpEndiTurE
VarianCE ExpEndiTurEas% Of
final apprOpriaTiOn
finalapprOpriaTiOn
aCTualExpEndiTurE
r'000 r'000 r'000 r'000 r'000 r'000 % r'000 r'000Training and development 7 740 (7 261) - 479 479 - 100.0% 557 557
Operating payments 724 (593) - 131 131 - 100.0% 580 580
Venues and facilities 1 435 699 - 2 134 2 134 - 100.0% 4 703 4 703
Rental and hiring 2 160 (2 160) - - - - - 16 16
Transfers and subsidies 161 823 54 - 161 877 161 877 - 100.0% 153 910 153 910Departmental agencies and accounts
160 423 - - 160 423 160 423 - 100.0% 152 489 152 489
Departmental agencies (non-business entities)
160 423 - - 160 423 160 423 - 100.0% 152 489 152 489
Non-profit institutions 1 400 - - 1 400 1 400 - 100.0% 1 400 1 400
Households - 54 - 54 54 - 100.0% 21 21
Social benefits - 54 - 54 54 - 100.0% 21 21
Payments for capital assets 1 113 (536) - 577 577 - 100.0% 909 909Machinery and equipment 1 113 (536) - 577 577 - 100.0% 909 909
Other machinery and equipment
1 113 (536) - 577 577 - 100.0% 909 909
Payments for financial assets - 8 - 8 8 - 100.0% - -TOTal 240 149 2 287 3 678 246 114 246 114 - 100.0% 229 292 229 292
APPROPRIATION STATEMENTfor the year ended 31 March 2016

164
APPROPRIATION STATEMENTfor the year ended 31 March 2016
Programme 5: BIODIVERSITY AND CONSERVATION 2015/16 2014/15
sub prOgraMME
adjusTEd apprOpriaTiOn
shifTing Of funds
VirEMEnT final apprOpriaTiOn
aCTual ExpEndiTurE
VarianCE ExpEndiTurEas% Of
final apprOpriaTiOn
finalapprOpriaTiOn
aCTualExpEndiTurE
r'000 r'000 r'000 r'000 r'000 r'000 % r'000 r'0001. Biodiversity and
Conservation Management17 019 1 159 - 18 178 18 178 - 100.0% 15 801 15 801
2. Biodiversity Planning and Management
26 025 164 - 26 189 26 189 - 100.0% 19 954 19 954
3. Protected Areas Systems Management
47 280 (5 093) - 42 187 42 187 - 100.0% 44 537 44 537
4. iSimangaliso Wetland Park Authority
31 628 - - 31 628 31 628 - 100.0% 30 610 30 610
5. South African National Parks 278 675 - - 278 675 278 675 - 100.0% 275 068 275 068
6. South African National Biodiversity Institute
232 149 - - 232 149 232 149 - 100.0% 223 447 223 447
7. Biodiversity Monitoring and Evaluation
6 206 3 538 - 9 744 8 959 785 91.9% 8 642 8 642
8. Biodiversity Economy and Sustainable Use
91 618 (1 312) (28 408) 61 898 61 898 - 100.0% 25 009 25 009
TOTal fOr sub prOgraMME 730 600 (1 544) (28 408) 700 648 699 863 785 99.9% 643 068 643 068
ECOnOMiC ClassifiCaTiOn r'000 r'000 r'000 r'000 r'000 r'000 % r'000 r'000Current payments 185 178 (2 070) (28 408) 154 700 153 915 785 99.5% 110 631 110 631Compensation of employees 65 096 (1 956) - 63 140 63 140 - 100.0% 55 783 55 783
Salaries and wages 62 355 (5 986) - 56 369 56 369 - 100.0% 49 854 49 854
Social contributions 2 741 4 030 - 6 771 6 771 - 100.0% 5 929 5 929
Goods and services 120 082 (114) (28 408) 91 560 90 775 785 99.1% 54 848 54 848
Administrative fees 15 53 - 68 68 - 100.0% 145 145

DEPARTMENT OF ENVIRONMENTAL AFFAIRS ANNUAL REPORT 2015/16165
Programme 5: BIODIVERSITY AND CONSERVATION 2015/16 2014/15
sub prOgraMME
adjusTEd apprOpriaTiOn
shifTing Of funds
VirEMEnT final apprOpriaTiOn
aCTual ExpEndiTurE
VarianCE ExpEndiTurEas% Of
final apprOpriaTiOn
finalapprOpriaTiOn
aCTualExpEndiTurE
r'000 r'000 r'000 r'000 r'000 r'000 % r'000 r'000Advertising 1 122 1 042 - 2 164 2 164 - 100.0% 1 961 1 961
Minor assets 368 (294) - 74 74 - 100.0% 66 66
Bursaries: Employees - 15 - 15 15 - 100.0% - -
Catering: Departmental activities
524 428 - 952 952 - 100.0% 659 659
Communication (G&S) 47 624 (18 603) (28 408) 613 613 - 100.0% 903 903
Computer services 47 351 - 398 398 - 100.0% 1 606 1 606
Consultants: Business and advisory services
14 475 (6 014) - 8 461 8 461 - 100.0% 19 319 19 319
Scientific and technological services
73 (73) - - - - - - -
Legal services - 72 - 72 72 - 100.0% 156 156
Contractors 3 168 31 600 - 34 768 34 768 - 100.0% 535 535
Agency and support / outsourced services
1 889 (1 889) - - - - - - -
Entertainment 31 (23) - 8 8 - 100.0% 3 3
Fleet services - - - - - - - 2 2
Inventory: Food and food supplies
15 (15) - - - - - - -
Inventory: Fuel, oil and gas - - - - - - - 1 1
Inventory: Materials and supplies
6 451 - 457 457 - 100.0% - -
Inventory: Medical supplies - 2 - 2 2 - 100.0% - -
Inventory: Other supplies 31 (31) - - - - - - -
Consumable supplies - 122 - 122 122 - 100.0% 182 182
APPROPRIATION STATEMENTfor the year ended 31 March 2016

166
Programme 5: BIODIVERSITY AND CONSERVATION 2015/16 2014/15
sub prOgraMME
adjusTEd apprOpriaTiOn
shifTing Of funds
VirEMEnT final apprOpriaTiOn
aCTual ExpEndiTurE
VarianCE ExpEndiTurEas% Of
final apprOpriaTiOn
finalapprOpriaTiOn
aCTualExpEndiTurE
r'000 r'000 r'000 r'000 r'000 r'000 % r'000 r'000Consumable: Stationery, printing and office supplies
866 (616) - 250 250 - 100.0% 422 422
Operating leases 488 (329) - 159 159 - 100.0% 94 94
Property payments - 447 - 447 447 - 100.0% 108 108
Travel and subsistence - 21 246 - 21 246 20 461 785 96.3% 22 410 22 410
Training and development 15 727 (15 094) - 633 633 - 100.0% 111 111
Operating payments 454 16 064 - 16 518 16 518 - 100.0% 956 956
Venues and facilities 2 324 1 456 - 3 780 3 780 - 100.0% 4 753 4 753
Rental and hiring 30 835 (30 482) - 353 353 - 100.0% 456 456
Transfers and subsidies 544 739 91 - 544 830 544 830 - 100.0% 531 460 531 460Departmental agencies and accounts
542 452 - - 542 452 542 452 - 100.0% 529 125 529 125
Departmental agencies (non-business entities)
542 452 - - 542 452 542 452 - 100.0% 529 125 529 125
Non-profit institutions 2 287 - - 2 287 2 287 - 100.0% 2 287 2 287
Households - 91 - 91 91 - 100.0% 48 48
Social benefits - 91 - 91 91 - 100.0% 48 48
Payments for capital assets 683 412 - 1 095 1 095 - 100.0% 966 966Machinery and equipment 683 412 - 1 095 1 095 - 100.0% 966 966
Transport equipment - 8 - 8 8 - 100.0% 88 88
Other machinery and equipment
683 404 - 1 087 1 087 - 100.0% 878 878
Payments for financial assets - 23 - 23 23 - 100.0% 11 11TOTal 730 600 (1 544) (28 408) 700 648 699 863 785 99.9% 643 068 643 068
APPROPRIATION STATEMENTfor the year ended 31 March 2016

DEPARTMENT OF ENVIRONMENTAL AFFAIRS ANNUAL REPORT 2015/16167
APPROPRIATION STATEMENTfor the year ended 31 March 2016
Programme 6: ENVIRONMENTAL PROGRAMMES 2015/16 2014/15
sub prOgraMME
adjusTEd apprOpriaTiOn
shifTing Of funds
VirEMEnT final apprOpriaTiOn
aCTual ExpEndiTurE
VarianCE ExpEndiTurEas% Of
final apprOpriaTiOn
finalapprOpriaTiOn
aCTualExpEndiTurE
r'000 r'000 r'000 r'000 r'000 r'000 % r'000 r'0001. Environmental Protection
and Infrastructure Programme
1 268 951 60 550 100 024 1 429 525 1 429 525 - 100.0% 1 481 104 1 481 104
2. Working for Water and Working on Fire
1 866 690 (44 514) (27 570) 1 794 606 1 793 676 930 99.9% 1 775 337 1 771 512
3. Green Fund 300 000 - - 300 000 300 000 - 100.0% 250 000 250 000
4. Environmental Programmes Management
6 462 143 - 6 605 6 605 - 100.0% 7 273 7 273
5. Information Management and Sector Coordination
47 530 2 304 - 49 834 49 834 - 100.0% 39 719 39 719
TOTal fOr sub prOgraMME 3 489 633 18 483 72 454 3 580 570 3 579 640 930 100.0% 3 553 433 3 549 608
ECOnOMiC ClassifiCaTiOn r'000 r'000 r'000 r'000 r'000 r'000 % r'000 r'000Current payments 437 056 17 359 (9 922) 444 493 444 493 - 100.0% 368 699 364 973 Compensation of employees 206 044 16 285 (19 473) 202 856 202 856 - 100.0% 171 486 169 978
Salaries and wages 194 077 3 929 (19 473) 178 533 178 533 - 100.0% 153 560 152 052
Social contributions 11 967 12 356 - 24 323 24 323 - 100.0% 17 926 17 926
Goods and services 231 012 1 074 9 551 241 637 241 637 - 100.0% 197 213 194 995
Administrative fees 1 464 (1 184) - 280 280 - 100.0% 74 74
Advertising 3 242 (2 796) - 446 446 - 100.0% 1 147 1 147
Minor assets 2 825 (2 376) - 449 449 - 100.0% 327 327
Audit costs: External - 235 - 235 235 - 100.0% - -
Bursaries: Employees 146 (33) - 113 113 - 100.0% 60 60

168
Programme 6: ENVIRONMENTAL PROGRAMMES 2015/16 2014/15
sub prOgraMME
adjusTEd apprOpriaTiOn
shifTing Of funds
VirEMEnT final apprOpriaTiOn
aCTual ExpEndiTurE
VarianCE ExpEndiTurEas% Of
final apprOpriaTiOn
finalapprOpriaTiOn
aCTualExpEndiTurE
r'000 r'000 r'000 r'000 r'000 r'000 % r'000 r'000Catering: Departmental activities
2 167 (1 212) - 955 955 - 100.0% 640 640
Communication (G&S) 5 699 2 414 - 8 113 8 113 - 100.0% 6 840 6 840
Computer services 5 187 (4 046) - 1 141 1 141 - 100.0% 4 893 2 675
Consultants: Business and advisory services
36 017 (21 283) 9 551 24 285 24 285 - 100.0% 11 371 11 371
Infrastructure and planning services
11 408 (11 408) - - - - - - -
Scientific and technological services
210 (210) - - - - - - -
Legal services - 368 - 368 368 - 100.0% 333 333
Contractors 59 536 34 906 - 94 442 94 442 - 100.0% 88 432 88 432
Agency and support / outsourced services
- 4 363 - 4 363 4 363 - 100.0% 923 923
Entertainment 45 (40) - 5 5 - 100.0% 24 24
Fleet services (including government motor transport)
- 2 466 - 2 466 2 466 - 100.0% 2 394 2 394
Inventory: Food and food supplies
40 (40) - - - - - - -
Inventory: Fuel, oil and gas 7 256 21 859 - 29 115 29 115 - 100.0% 15 111 15 111
Inventory: Learner and teacher support material
445 (445) - - - - - - -
Inventory: Materials and supplies
1 432 (1 432) - - - - - 2 2
APPROPRIATION STATEMENTfor the year ended 31 March 2016
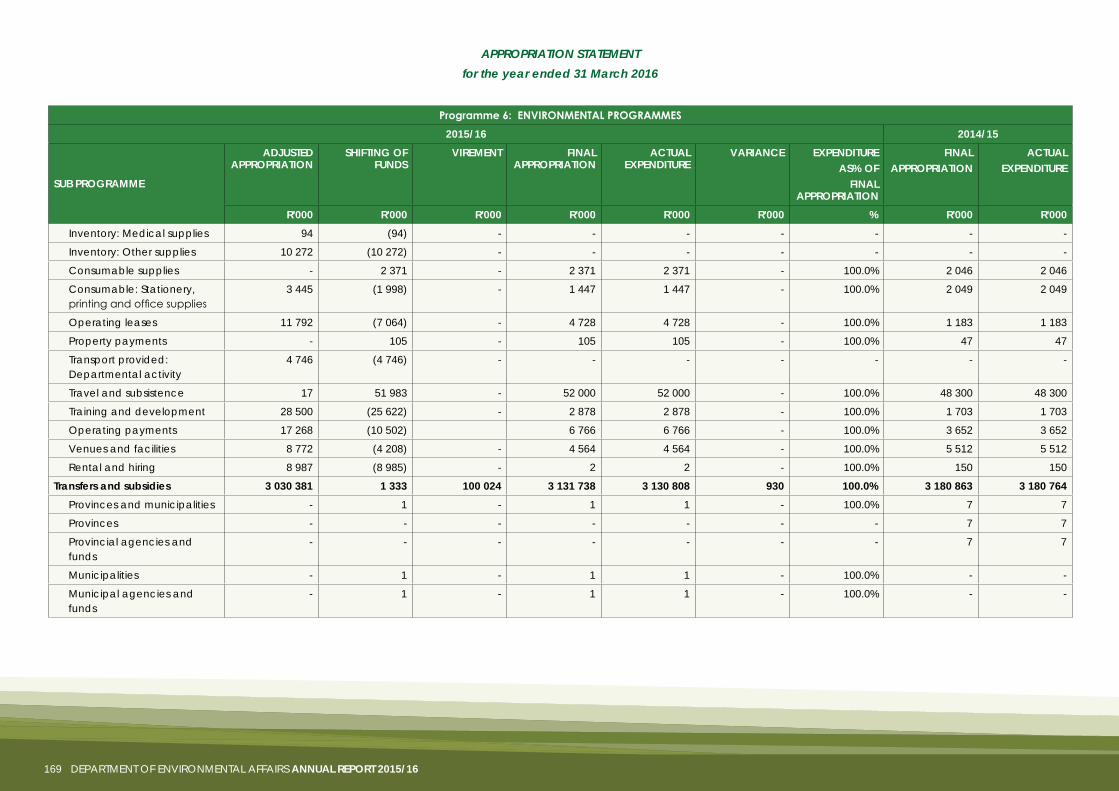
DEPARTMENT OF ENVIRONMENTAL AFFAIRS ANNUAL REPORT 2015/16169
Programme 6: ENVIRONMENTAL PROGRAMMES 2015/16 2014/15
sub prOgraMME
adjusTEd apprOpriaTiOn
shifTing Of funds
VirEMEnT final apprOpriaTiOn
aCTual ExpEndiTurE
VarianCE ExpEndiTurEas% Of
final apprOpriaTiOn
finalapprOpriaTiOn
aCTualExpEndiTurE
r'000 r'000 r'000 r'000 r'000 r'000 % r'000 r'000Inventory: Medical supplies 94 (94) - - - - - - -
Inventory: Other supplies 10 272 (10 272) - - - - - - -
Consumable supplies - 2 371 - 2 371 2 371 - 100.0% 2 046 2 046
Consumable: Stationery, printing and office supplies
3 445 (1 998) - 1 447 1 447 - 100.0% 2 049 2 049
Operating leases 11 792 (7 064) - 4 728 4 728 - 100.0% 1 183 1 183
Property payments - 105 - 105 105 - 100.0% 47 47
Transport provided: Departmental activity
4 746 (4 746) - - - - - - -
Travel and subsistence 17 51 983 - 52 000 52 000 - 100.0% 48 300 48 300
Training and development 28 500 (25 622) - 2 878 2 878 - 100.0% 1 703 1 703
Operating payments 17 268 (10 502) 6 766 6 766 - 100.0% 3 652 3 652
Venues and facilities 8 772 (4 208) - 4 564 4 564 - 100.0% 5 512 5 512
Rental and hiring 8 987 (8 985) - 2 2 - 100.0% 150 150
Transfers and subsidies 3 030 381 1 333 100 024 3 131 738 3 130 808 930 100.0% 3 180 863 3 180 764Provinces and municipalities - 1 - 1 1 - 100.0% 7 7
Provinces - - - - - - - 7 7
Provincial agencies and funds
- - - - - - - 7 7
Municipalities - 1 - 1 1 - 100.0% - -
Municipal agencies and funds
- 1 - 1 1 - 100.0% - -
APPROPRIATION STATEMENTfor the year ended 31 March 2016

170
Programme 6: ENVIRONMENTAL PROGRAMMES 2015/16 2014/15
sub prOgraMME
adjusTEd apprOpriaTiOn
shifTing Of funds
VirEMEnT final apprOpriaTiOn
aCTual ExpEndiTurE
VarianCE ExpEndiTurEas% Of
final apprOpriaTiOn
finalapprOpriaTiOn
aCTualExpEndiTurE
r'000 r'000 r'000 r'000 r'000 r'000 % r'000 r'000Departmental agencies and accounts
401 708 1 039 - 402 747 402 747 - 100.0% 517 596 517 596
Social security funds - 1 039 - 1 039 1 039 - 100.0% 3 841 3 841
Departmental agencies (non-business entities)
401 708 - - 401 708 401 708 - 100.0% 513 755 513 755
Public corporations and private enterprises
300 000 - - 300 000 300 000 - 100.0% 250 000 250 000
Public corporations 300 000 - - 300 000 300 000 - 100.0% 250 000 250 000
Other transfers to public corporations
300 000 - - 300 000 300 000 - 100.0% 250 000 250 000
Households 2 328 673 293 100 024 2 428 990 2 428 060 930 100.0% 2 413 260 2 413 161
Social benefits - 285 - 285 285 - 100.0% 191 191
Other transfers to households
2 328 673 8 100 024 2 428 705 2 427 775 930 100.0% 2 413 069 2 412 970
Payments for capital assets 22 196 (740) (17 648) 3 808 3 808 - 100.0% 3 727 3 727Machinery and equipment 22 196 (740) (17 648) 3 808 3 808 - 100.0% 3 727 3 727
Transport equipment - 274 - 274 274 - 100.0% 97 97
Other machinery and equipment
22 196 (1 014) (17 648) 3 534 3 534 - 100.0% 3 630 3 630
Payment for financial assets - 531 - 531 531 - 100.0% 144 144TOTal 3 489 633 18 483 72 454 3 580 570 3 579 640 930 100.0% 3 553 433 3 549 608
APPROPRIATION STATEMENTfor the year ended 31 March 2016

DEPARTMENT OF ENVIRONMENTAL AFFAIRS ANNUAL REPORT 2015/16171
APPROPRIATION STATEMENTfor the year ended 31 March 2016
Programme 7: CHEMICALS AND WASTE MANAGEMENT2015/16 2014/15
sub prOgraMME
adjusTEd apprOpriaTiOn
shifTing Of funds
VirEMEnT final apprOpriaTiOn
aCTual ExpEndiTurE
VarianCE ExpEndiTurEas% Of
final apprOpriaTiOn
finalapprOpriaTiOn
aCTualExpEndiTurE
r'000 r'000 r'000 r'000 r'000 r'000 % r'000 r'0001. Chemicals and Waste
Management6 904 3 047 - 9 951 9 951 - 100.0% 5 992 5 992
2. Hazardous Waste Management and Licencing
22 005 2 316 3 619 27 940 27 940 - 100.0% 22 514 22 514
3. General Waste & Municipal Support
28 978 (9 766) - 19 212 19 212 - 100.0% 25 240 25 240
4. Chemicals and Waste Policy, Evaluation and Monitoring
11 353 (1 997) - 9 356 9 356 - 100.0% 6 682 6 682
5. Chemicals Management 10 041 3 240 - 13 281 13 281 - 100.0% 11 450 11 450
TOTal fOr sub prOgraMME 79 281 (3 160) 3 619 79 740 79 740 - 100.0% 71 878 71 878
ECOnOMiC ClassifiCaTiOn r'000 r'000 r'000 r'000 r'000 r'000 % r'000 r'000Current payments 71 877 (3 267) 3 619 72 229 72 229 - 100.0% 59 826 59 826Compensation of employees 52 060 (3 142) - 48 918 48 918 - 100.0% 40 330 40 330
Salaries and wages 48 378 (5 399) - 42 979 42 979 - 100.0% 35 812 35 812
Social contributions 3 682 2 257 - 5 939 5 939 - 100.0% 4 518 4 518
Goods and services 19 817 (125) 3 619 23 311 23 311 - 100.0% 19 496 19 496
Administrative fees 260 (227) - 33 33 - 100.0% 120 120
Advertising 301 61 - 362 362 - 100.0% 300 300
Minor assets 769 (753) - 16 16 - 100.0% 96 96
Bursaries: Employees 142 (121) - 21 21 - 100.0% - -
Catering: Departmental activities
90 296 - 386 386 - 100.0% 287 287

172
Programme 7: CHEMICALS AND WASTE MANAGEMENT2015/16 2014/15
sub prOgraMME
adjusTEd apprOpriaTiOn
shifTing Of funds
VirEMEnT final apprOpriaTiOn
aCTual ExpEndiTurE
VarianCE ExpEndiTurEas% Of
final apprOpriaTiOn
finalapprOpriaTiOn
aCTualExpEndiTurE
r'000 r'000 r'000 r'000 r'000 r'000 % r'000 r'000Communication (G&S) 495 (70) - 425 425 - 100.0% 337 337
Computer services 436 (436) - - - - - 32 32
Consultants: Business and advisory services
6 977 (2 373) 3 619 8 223 8 223 - 100.0% 9 161 9 161
Legal services - 253 - 253 253 - 100.0% 219 219
Contractors - 35 - 35 35 - 100.0% - -
Entertainment - 60 - 60 60 - 100.0% 1 1
Inventory: Other supplies 296 (296) - - - - - - -
Consumable supplies - 264 - 264 264 - 100.0% 97 97
Consumable: Stationery, printing and office supplies
1 472 (1 397) - 75 75 - 100.0% 122 122
Operating leases 351 (232) - 119 119 - 100.0% 77 77
Property payments 22 (22) - - - - - - -
Transport provided: Departmental activity
73 (73) - - - - - - -
Travel and subsistence - 7 882 - 7 882 7 882 - 100.0% 6 866 6 866
Training and development 2 929 (2 430) - 499 499 - 100.0% 497 497
Operating payments 288 1 856 - 2 144 2 144 - 100.0% 274 274
Venues and facilities 2 401 (35) - 2 366 2 366 - 100.0% 714 714
Rental and hiring 2 515 (2 367) - 148 148 - 100.0% 296 296
APPROPRIATION STATEMENTfor the year ended 31 March 2016
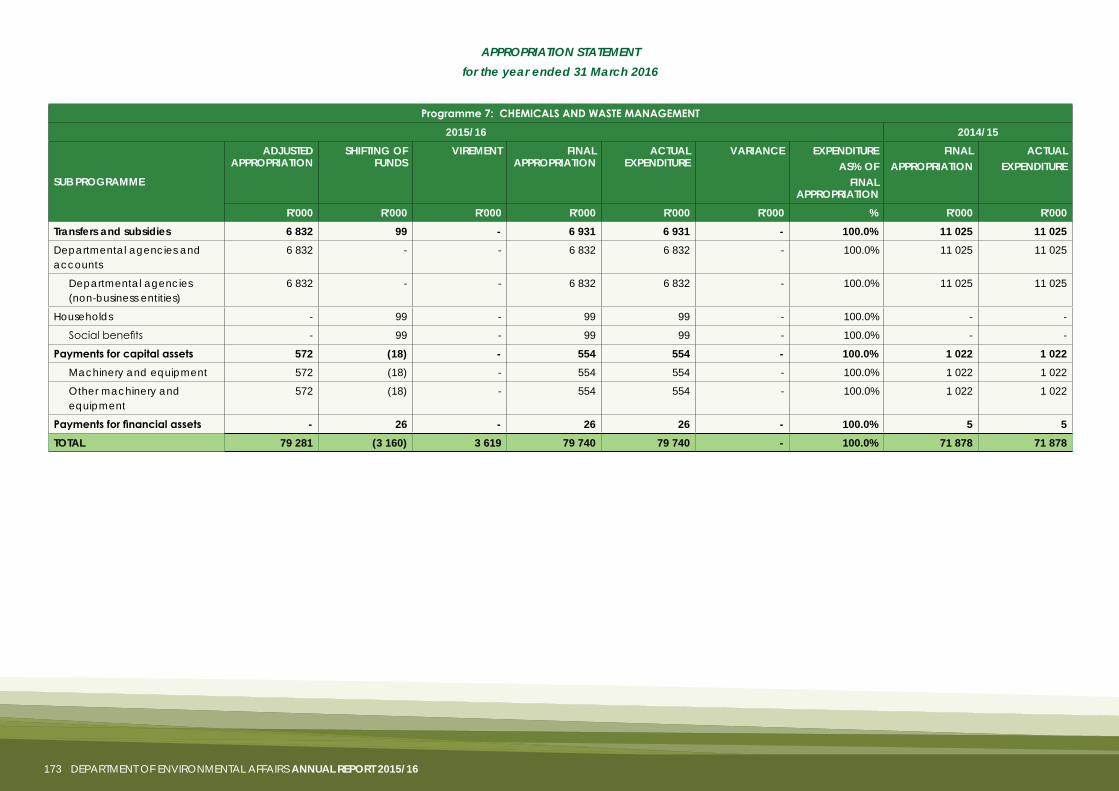
DEPARTMENT OF ENVIRONMENTAL AFFAIRS ANNUAL REPORT 2015/16173
Programme 7: CHEMICALS AND WASTE MANAGEMENT2015/16 2014/15
sub prOgraMME
adjusTEd apprOpriaTiOn
shifTing Of funds
VirEMEnT final apprOpriaTiOn
aCTual ExpEndiTurE
VarianCE ExpEndiTurEas% Of
final apprOpriaTiOn
finalapprOpriaTiOn
aCTualExpEndiTurE
r'000 r'000 r'000 r'000 r'000 r'000 % r'000 r'000Transfers and subsidies 6 832 99 - 6 931 6 931 - 100.0% 11 025 11 025Departmental agencies and accounts
6 832 - - 6 832 6 832 - 100.0% 11 025 11 025
Departmental agencies (non-business entities)
6 832 - - 6 832 6 832 - 100.0% 11 025 11 025
Households - 99 - 99 99 - 100.0% - -
Social benefits - 99 - 99 99 - 100.0% - -
Payments for capital assets 572 (18) - 554 554 - 100.0% 1 022 1 022Machinery and equipment 572 (18) - 554 554 - 100.0% 1 022 1 022
Other machinery and equipment
572 (18) - 554 554 - 100.0% 1 022 1 022
Payments for financial assets - 26 - 26 26 - 100.0% 5 5TOTal 79 281 (3 160) 3 619 79 740 79 740 - 100.0% 71 878 71 878
APPROPRIATION STATEMENTfor the year ended 31 March 2016

174
1. dETail Of TransfErs and subsidiEs as pEr apprOpriaTiOn aCT (afTEr VirEMEnT):Detail of these transactions can be viewed in the note on Transfers and subsidies, disclosure notes and Annexure 1 (A-E) to the Annual Financial Statements.
2. dETail Of spECifiCally and ExClusiVEly apprOpriaTEd aMOunTs VOTEd (afTEr VirEMEnT):Detail of these transactions can be viewed in note 1 (Annual Appropriation) to the Annual Financial Statements.
3. dETail On payMEnTs fOr finanCial assETsDetail of these transactions per programme can be viewed in the note on Payments for financial assets to the Annual Financial Statements.
4. ExplanaTiOns Of MaTErial VarianCEs frOM aMOunTs VOTEd (afTEr VirEMEnT):
4.1 pEr prOgraMME final apprOpriaTiOnr’000
aCTual ExpEndiTurE r’000
VarianCE r’000
VarianCE as a% Of final apprOpriaTiOn
1. Administration 832 487 832 487 - -
2. Legal, Authorisations and Compliance 131 717 131 417 300 0.23
3. Oceans and Coasts 372 021 368 659 3 362 0.9
4. Climate Change and Air Quality 246 114 246 114 - -
5. Biodiversity and Conservation 700 648 699 863 785 0.11
6. Environmental Programmes 3 580 570 3 579 640 930 0.03
7. Chemicals and Waste Management 79 740 79 740 - -
TOTal 5 943 297 5 937 920 5 377 0.09
NOTES TO THE APPROPRIATION STATEMENTS for the year ended 31 March 2016

DEPARTMENT OF ENVIRONMENTAL AFFAIRS ANNUAL REPORT 2015/16175
4.2 pEr ECOnOMiCal ClassifiCaTiOn final apprOpriaTiOnr’000
aCTual ExpEndiTurE r’000
VarianCE r’000
VarianCE as a% Of final apprOpriaTiOn
R’000 R’000 R’000 R’000
Current payments 1 915 461 1 912 643 2 818 0.15Compensation of employees 909 477 909 177 300 0.03
Goods and services 1 005 984 1 003 466 2 518 0.25
Interest and rent on land
Transfers and subsidies 3 864 440 3 863 510 930 0.02Provinces and municipalities 42 42 - -
Departmental agencies and accounts 1 112 461 1 112 461 - -
Public corporations and private enterprises 300 000 300 000 - -
Foreign governments and international organisations 16 000 16 000 - -
Non-profit institutions 3 687 3 687 - -
Households 2 432 250 2 431 320 930 0.04
Payments for capital assets 162 488 160 859 1 629 1Buildings and other fixed structures 129 356 129 356 - -
Machinery and equipment 31 308 29 679 1 629 5.2
Intangible assets 1 824 1 824 - -
Payments for financial assets 908 908 - -TOTal 5 943 297 5 937 920 5 377 0.09
The appropriation statement includes an amount of R3, 864 billion under Transfers and Subsidies. The Modified Cash Standard requires that all expenditure be recorded for their use.
The transfers to Households to the amount of R2, 431 billion (R2, 415 billion) includes transfers to Implementation Agents for EPWP projects to the amount of R2, 428 billion (R2, 413 billion) R2, 203 billion (R2, 210 billion) and R225 million (R202 million) respectively reclassified as Goods & Services and Expenditure for Capital Assets due to their use per the Modified Cash Standard.
NOTES TO THE APPROPRIATION STATEMENTS for the year ended 31 March 2016

176
note 2015/16 2014/15r'000 r'000
rEVEnuEAnnual appropriation 1 5 943 297 5 680 386
Departmental revenue 2 11 486 32 022
Aid assistance 3 - 6 690
TOTal rEVEnuE 5 954 783 5 719 098ExpEndiTurECurrent expenditureCompensation of employees 4 909 177 787 791
Goods and services 5 3 206 752 3 065 037
Aid assistance 3 11 921 11 861
Total current expenditure 4 127 850 3 864 689Transfers and subsidiesTransfers and subsidies 7 1 435 743 1 482 298
Total transfers and subsidies 1 435 743 1 482 298Expenditure for capital assetsTangible assets 8 383 795 329 577
Intangible assets 8 1 824 10 319
Total expenditure for capital assets 385 619 339 896Payments for financial assets 6 908 401
TOTal ExpEndiTurE 5 950 120 5 687 284surplus fOr ThE yEar 4 663 31 814Reconciliation of Net Surplus for the yearVoted funds 5 377 5 327
Annual appropriation 5 377 5 327
Departmental revenue and NRF Receipts 13 11 486 32 022
Aid assistance 3 (12 200) (5 535)
surplus fOr ThE yEar 4 663 31 814
STATEMENT OF FINANCIAL PERFORMANCE for the year ended 31 March 2016

DEPARTMENT OF ENVIRONMENTAL AFFAIRS ANNUAL REPORT 2015/16177
note 2015/16 2014/15r'000 r'000
assETsCurrent assets 26 099 65 355Cash and cash equivalents 9 1 488 31 164
Prepayments and advances 10 475 577
Receivables 11 4 205 25 883
Aid assistance receivable 3 19 931 7 731
Non-current assets 21 773 8 027Receivables 11 21 773 8 027
Current expenditure
TOTal assETs 47 872 73 382
liabiliTiEs
Current liabilities 36 469 66 251Voted funds to be surrendered to the Revenue Fund 12 5 377 5 327
Departmental revenue and NRF Receipts to be surrendered to the Revenue Fund 13 247 6 217
Payables 14 30 845 54 707
TOTal liabiliTiEs 36 469 66 251
nET assETs 11 403 7 131Represented by:
Recoverable revenue 11 403 7 131
TOTal TransfErs and subsidiEs 11 403 7 131
STATEMENT OF FINANCIAL POSITION as at 31 March 2016

178
note 2015/16 2014/15r'000 r'000
Recoverable revenue
Opening balance 7 131 638
Transfers: 4 272 6 493Irrecoverable amounts written off 6.2 (3) (58)
Debts recovered (included in departmental receipts) (1 155) (164)
Debts raised 5 430 6 715
Closing balance 11 403 7 131
TOTal 11 403 7 131
STATEMENT OF CHANGE IN NET ASSETfor the year ended 31 March 2016

DEPARTMENT OF ENVIRONMENTAL AFFAIRS ANNUAL REPORT 2015/16179
CASH FLOW STATEMENTfor the year ended 31 March 2016
Note 2015/16 2014/15r'000 r’000
Cash flOws frOM OpEraTing aCTiViTiEsReceipts 5 954 669 5 717 655
Annual appropriated funds received 1.1 5 943 297 5 680 386
Departmental revenue received 2 11 248 30 481
Interest received 2.3 124 98
Aid assistance received 3 - 6 690
Net (increase)/decrease in working capital (15 828) 9 015
Surrendered to Revenue Fund (22 783) (36 217)
Current payments (4 127 850) (3 864 689)
Payments for financial assets (908) (401)
Transfers and subsidies paid (1 435 743) (1 482 298)
Net cash flow available from operating activities 15 351 557 343 065
Cash flOws frOM inVEsTing aCTiViTiEsPayments for capital assets 8 (385 619) (339 896)
Proceeds from sale of capital assets 2.4 114 1 443
Net cash flows from investing activities (385 505) (338 453)
Increase in net assets 4 272 6 493
Net cash flows from financing activities 4 272 6 493
Net increase/(decrease) in cash and cash equivalents (29 676) 11 105
Cash and cash equivalents at beginning of period 31 164 20 059
Cash and cash equivalents at end of period 16 1 488 31 164

180
suMMary Of signifiCanT aCCOunTing pOliCiEs
The financial statements have been prepared in accordance with the following policies, which have been applied consistently in all material aspects, unless otherwise indicated. Management has concluded that the financial statements present fairly the department’s primary and secondary information. The historical cost convention has been used, except where otherwise indicated. Management has used assessments and estimates in preparing the annual financial statements. These are based on the best information available at the time of preparation.Where appropriate and meaningful, additional information has been disclosed to enhance the usefulness of the financial statements and to comply with the statutory requirements of the Public Finance Management Act (PFMA), Act 1 of 1999 (as amended by Act 29 of 1999), and the Treasury Regulations issued in terms of the PFMA and the annual Division of Revenue Act. 1 Basis of preparation
The financial statements have been prepared in accordance with the Modified Cash Standard.
2 Going concernThe financial statements have been prepared on a going concern basis.
3 Presentation currencyAmounts have been presented in the currency of the South African Rand (R) which is also the functional currency of the department.
4 roundingUnless otherwise stated financial figures have been rounded to the nearest one thousand Rand (R’000).
5 Foreign currency translationCash flows arising from foreign currency transactions are translated into South African Rand using the exchange rates prevailing at the date of payment / receipt.
6 Comparative information6.1 Prior period comparative information
Prior period comparative information has been presented in the current year’s financial statements.
Where necessary figures included in the prior period financial statements have been reclassified to ensure that the format in which the information is presented is consistent with the format of the current year’s financial statements.
6.2 Current year comparison with budget
A comparison between the approved, final budget and actual amounts for each programme and economic classification is included in the appropriation statement.
7 revenue7.1 Appropriated funds
Appropriated funds comprises of departmental allocations as well as direct charges against the revenue fund (i.e. statutory appropriation). Appropriated funds are recognised in the statement of financial performance on the date the appropriation becomes effective. Adjustments made in terms of the adjustments budget process are recognised in the statement of financial performance on the date the adjustments become effective. The net amount of any appropriated funds due to / from the relevant revenue fund at the reporting date is recognised as a payable / receivable in the statement of financial position.
ACCOUNTING POLICIESfor the year ended 31 March 2016

DEPARTMENT OF ENVIRONMENTAL AFFAIRS ANNUAL REPORT 2015/16181
7.2 Departmental revenue Departmental revenue is recognised in the statement of financial performance when received and is subsequently paid into the relevant revenue fund, unless stated otherwise. Any amount owing to the relevant revenue fund at the reporting date is recognised as a payable in the statement of financial position.
7.3 Accrued departmental revenueAccruals in respect of departmental revenue (excluding tax revenue) are recorded in the notes to the financial statements when:
• it is probable that the economic benefits or service potential associated with the transaction will flow to the department; and • the amount of revenue can be measured reliably.
The accrued revenue is measured at the fair value of the consideration receivable. Accrued tax revenue (and related interest and / penalties) is measured at amounts receivable from collecting agents.
8 Expenditure8.1 Compensation of employees8.1.1 salaries and wages
Salaries and wages are recognised in the statement of financial performance on the date of payment.
8.1.2 Social contributionsSocial contributions made by the department in respect of current employees are recognised in the statement of financial performance on the date of payment. Social contributions made by the department in respect of ex-employees are classified as transfers to households in the statement of financial performance on the date of payment.
8.2 Other expenditureOther expenditure (such as goods and services, transfers and subsidies and payments for capital assets) is recognised in the statement of financial performance on the date of payment. The expense is classified as a capital expense if the total consideration paid is more than the capitalisation threshold.
8.3 Accrued expenditure payableAccrued expenditure payable is recorded in the notes to the financial statements when the goods are received or, in the case of services, when they are rendered to the department. Accrued expenditure payable is measured at cost.
8.4 leases8.4.1 Operating leases
Operating lease payments made during the reporting period are recognised as current expenditure in the statement of financial performance on the date of payment. The operating lease commitments are recorded in the notes to the financial statements.
ACCOUNTING POLICIESfor the year ended 31 March 2016

182
8.4.2 Finance leasesFinance lease payments made during the reporting period are recognised as capital expenditure in the statement of financial performance on the date of payment. The finance lease commitments are recorded in the notes to the financial statements and are not apportioned between the capital and interest portions. Finance lease assets acquired at the end of the lease term are recorded and measured at the lower of:
• cost, being the fair value of the asset; or • the sum of the minimum lease payments made, including any payments made to acquire ownership at the end of the lease term, excluding interest.
9 Aid Assistance9.1 Aid assistance received
Aid assistance received in cash is recognised in the statement of financial performance when received. In-kind aid assistance is recorded in the notes to the financial statements on the date of receipt and is measured at fair value. Aid assistance not spent for the intended purpose and any unutilised funds from aid assistance that are required to be refunded to the donor are recognised as a payable in the statement of financial position.
9.2 Aid assistance paidAid assistance paid is recognised in the statement of financial performance on the date of payment. Aid assistance payments made prior to the receipt of funds are recognised as a receivable in the statement of financial position.
10 Cash and cash equivalentsCash and cash equivalents are stated at cost in the statement of financial position. Bank overdrafts are shown separately on the face of the statement of financial position. For the purposes of the cash flow statement, cash and cash equivalents comprise cash on hand, deposits held, other short-term highly liquid investments and bank overdrafts.
11 Prepayments and advancesPrepayments and advances are recognised in the statement of financial position when the department receives or disburses the cash. Prepayments and advances are initially and subsequently measured at cost.
12 Loans and receivablesLoans and receivables are recognised in the statement of financial position at cost plus accrued interest, where interest is charged, less amounts already settled or written-off.
13 InvestmentsInvestments are recognised in the statement of financial position at cost.
14 Financial assets
ACCOUNTING POLICIESfor the year ended 31 March 2016

DEPARTMENT OF ENVIRONMENTAL AFFAIRS ANNUAL REPORT 2015/16183
14.1 Financial assets (not covered elsewhere)A financial asset is recognised initially at its cost plus transaction costs that are directly attributable to the acquisition or issue of the financial. At the reporting date, a department shall measure its financial assets at cost, less amounts already settled or written-off, except for recognised loans and receivables, which are measured at cost plus accrued interest, where interest is charged, less amounts already settled or written-off.
14 Impairment of financial assetsWhere there is an indication of impairment of a financial asset, an estimation of the reduction in the recorded carrying value, to reflect the best estimate of the amount of the future economic benefits expected to be received from that asset, is recorded in the notes to the financial statements.
15 PayablesLoans and payables are recognised in the statement of financial position at cost.
16 Capital Assets16.1 Immovable capital assets
Immovable capital assets are initially recorded in the notes to the financial statements at cost. Immovable capital assets acquired through a non-exchange transaction is measured at fair value as at the date of acquisition. Where the cost of immovable capital assets cannot be determined accurately, the immovable capital assets are measured at R1 unless the fair value of the asset has been reliably estimated, in which case the fair value is used. All assets acquired prior to 1 April 2002 (or a later date as approved by the OAG) may be recorded at R1. Immovable capital assets are subsequently carried at cost and are not subject to depreciation or impairment. Subsequent expenditure that is of a capital nature is added to the cost of the asset at the end of the capital project unless the immovable asset is recorded by another department in which case the completed project costs are transferred to that department. The relevant Expanded Public Works Programme expenditure under the economical classification transfers and subsidies has been reclassified as Expenditure for Capital Assets per the Modified Cash Standard requirement. The created assets and work in progress has been included in the immovable asset and annexure for work in progress respectively.
16.2 Movable capital assetsMovable capital assets are initially recorded in the notes to the financial statements at cost. Movable capital assets acquired through a non-exchange transaction is measured at fair value as at the date of acquisition. Where the cost of movable capital assets cannot be determined accurately, the movable capital assets are measured at fair value and where fair value cannot be determined; the movable assets are measured at R1. All assets acquired prior to 1 April 2002 (or a later date as approved by the OAG) may be recorded at R1. Movable capital assets are subsequently carried at cost and are not subject to depreciation or impairment. Biological assets are subsequently carried at fair value. Subsequent expenditure that is of a capital nature is added to the cost of the asset at the end of the capital project unless the movable asset is recorded by another department/entity in which case the completed project costs are transferred to that department.
ACCOUNTING POLICIESfor the year ended 31 March 2016

184
16.3 intangible assets Intangible assets are initially recorded in the notes to the financial statements at cost. Intangible assets acquired through a non-exchange transaction are measured at fair value as at the date of acquisition. Internally generated intangible assets are recorded in the notes to the financial statements when the department commences the development phase of the project. Where the cost of intangible assets cannot be determined accurately, the intangible capital assets are measured at fair value and where fair value cannot be determined; the intangible assets are measured at R1. All assets acquired prior to 1 April 2002 (or a later date as approved by the OAG) may be recorded at R1. Intangible assets are subsequently carried at cost and are not subject to depreciation or impairment. Subsequent expenditure that is of a capital nature is added to the cost of the asset at the end of the capital project unless the intangible asset is recorded by another department/entity in which case the completed project costs are transferred to that department.
17 provisions and Contingents17.1 provisions:
Provisions are recorded in the notes to the financial statements when there is a present legal or constructive obligation to forfeit economic benefits as a result of events in the past and it is probable that an outflow of resources embodying economic benefits or service potential will be required to settle the obligation and a reliable estimate of the obligation can be made. The provision is measured as the best estimate of the funds required to settle the present obligation at the reporting date.
17.2 Contingent liabilities Contingent liabilities are recorded in the notes to the financial statements when there is a possible obligation that arises from past events, and whose existence will be confirmed only by the occurrence or non-occurrence of one or more uncertain future events not within the control of the department or when there is a present obligation that is not recognised because it is not probable that an outflow of resources will be required to settle the obligation or the amount of the obligation cannot be measured reliably
17.3 Contingent assets Contingent assets are recorded in the notes to the financial statements when a possible asset arises from past events, and whose existence will be confirmed by the occurrence or non-occurrence of one or more uncertain future events not within the control of the department
17.4 Commitments Commitments are recorded at cost in the notes to the financial statements when there is a contractual arrangement or an approval by management in a manner that raises a valid expectation that the department will discharge its responsibilities thereby incurring future expenditure that will result in the outflow of cash
18 Unauthorised expenditure Unauthorised expenditure is recognised in the statement of financial position until such time as the expenditure is either:
• approved by Parliament with funding and the related funds are received; or • approved by Parliament without funding and is written off against the appropriation in the statement of financial performance; or • transferred to receivables for recovery.
Unauthorised expenditure is measured at the amount of the confirmed unauthorised expenditure.
ACCOUNTING POLICIESfor the year ended 31 March 2016

DEPARTMENT OF ENVIRONMENTAL AFFAIRS ANNUAL REPORT 2015/16185
19 Fruitless and wasteful expenditure Fruitless and wasteful expenditure is recorded in the notes to the financial statements when confirmed. The amount recorded is equal to the total value of the fruitless and or wasteful expenditure incurred.
Fruitless and wasteful expenditure is removed from the notes to the financial statements when it is resolved or transferred to receivables for recovery.
Fruitless and wasteful expenditure receivables are measured at the amount that is expected to be recoverable and are de-recognised when settled or subsequently written-off as irrecoverable.
20 Irregular expenditure
Irregular expenditure is recorded in the notes to the financial statements when confirmed. The amount recorded is equal to the value of the irregular expenditure incurred unless it is impracticable to determine, in which case reasons therefor are provided in the note. Irregular expenditure is removed from the note when it is either condoned by the relevant authority, transferred to receivables for recovery or not condoned and is not recoverable. Irregular expenditure receivables are measured at the amount that is expected to be recoverable and are de-recognised when settled or subsequently written-off as irrecoverable.
21 Changes in accounting policies, accounting estimates and errorsChanges in accounting policies that are effected by management have been applied retrospectively in accordance with MCS requirements, except to the extent that it is impracticable to determine the period-specific effects or the cumulative effect of the change in policy. In such instances the department shall restate the opening balances of assets, liabilities and net assets for the earliest period for which retrospective restatement is practicable.
Changes in accounting estimates are applied prospectively in accordance with MCS requirements.
Correction of errors is applied retrospectively in the period in which the error has occurred in accordance with MCS requirements, except to the extent that it is impracticable to determine the period-specific effects or the cumulative effect of the error. In such cases the department shall restate the opening balances of assets, liabilities and net assets for the earliest period for which retrospective restatement is practicable.
22 Events after the reporting date Events after the reporting date that are classified as adjusting events have been accounted for in the financial statements. The events after the reporting date that are classified as non-adjusting events after the reporting date have been disclosed in the notes to the financial statements.
23 Departures from the MCS requirementsNational Treasury was requested to clarify the outstanding matter on disclosure of work in progress related to Economic Classification: Transfers and subsidies raised during 2013/14 and 2014/15 financial years. No conclusive decision could be reached before communication on 10 March 2016 and letter indicating the process going forward with the related departure approval dated 6 May 2016. The details of the departure is as follows:
i. For projects completed and handed over to owning agents before 31 March 2016 and projects completed during the 2015/16 financial year or previous financial years but not yet handed over to the owning agents by 31 March 2016 and projects commenced and implementing agents appointed before 31 March 2016: The department shall continue with the classification of the expenditure and budget as currently prepared with additional disclosure under the transfer payments note to the financial statements according to the nature that the money was spent, until the finalisation of these relevant projects.
ACCOUNTING POLICIESfor the year ended 31 March 2016

186
However, as per agreement reached between the Auditor-General, National Treasury (OAG), the department reported and disclosed the relevant expenditure as goods and services and capital expenditure. Assets and work in progress have been disclosed accordingly.
ii. For all new projects which commence on or after 1 April 2016 the department shall follow the new process as agreed between the Auditor-General, National Treasury (OAG) and the department to ensure that it complies with the responsibilities in terms of the PFMA Section 38(1)(a) and (b).
The financial statements present fairly the department’s primary and secondary information in that the department complied with the Standard and included additional disclosures to indicate the amount of work in progress related to the infrastructure development as part of transfer payments. The template for preparation of the financial statements does not yet provide for specific disclosure on capital expenditure included in transfer payments.
24 Capitalisation reserve The capitalisation reserve comprises of financial assets and/or liabilities originating in a prior reporting period but which are recognised in the statement of financial position for the first time in the current reporting period. Amounts are recognised in the capitalisation reserves when identified in the current period and are transferred to the National Fund when the underlying asset is disposed and the related funds are received
25 Recoverable revenue Amounts are recognised as recoverable revenue when a payment made in a previous financial year becomes recoverable from a debtor in the current financial year. Amounts are either transferred to the National Revenue Fund when recovered or are transferred to the statement of financial performance when written-off.
26 Related party transactions A related party transaction is a transfer of resources, services or obligations between the reporting entity and a related party. Related party transactions are recorded in the notes to the financial statements when the transaction is not at arm’s length.
27 inventories At the date of acquisition, inventories are recorded at cost price in the notes to the financial statements. Where inventories are acquired as part of a non-exchange transaction, the cost of inventory is its fair value at the date of acquisition. Inventories are subsequently measured at the lower of cost and net realisable value or the lower of cost and replacement value.
28 Public-Private PartnershipsPublic Private Partnerships are accounted for based on the nature and or the substance of the partnership. The transaction is accounted for in accordance with the relevant accounting policies. A summary of the significant terms of the PPP agreement, the parties to the agreement, and the date of commencement thereof together with the description and nature of the concession fees received, the unitary fees paid, rights and obligations of the department are recorded in the notes to the financial statements.
ACCOUNTING POLICIESfor the year ended 31 March 2016

DEPARTMENT OF ENVIRONMENTAL AFFAIRS ANNUAL REPORT 2015/16187
1. annual apprOpriaTiOn
1.1 Annual AppropriationIncluded are funds appropriated in terms of the Appropriation Act (and the Adjustments Appropriation Act) for National Departments (Voted funds) and Provincial Departments:
prOgraMMEs
2015/16 2014/15Final Appropriation Actual Funds
Receivedfunds not
requested/ not received
Final Appropriation Appropriation received
r’000 r’000 r’000 r’000 r’000Administration 832 487 832 487 - 731 335 731 335
Legal, Authorisations and Compliance 131 717 131 717 - 102 123 102 123
Oceans and Coasts 372 021 372 021 - 349 257 349 257
Climate Change and Air Quality 246 114 246 114 - 229 292 229 292
Biodiversity and Conservation 700 648 700 648 - 643 068 643 068
Environmental Programmes 3 580 570 3 580 570 - 3 553 433 3 553 433
Chemicals and Waste Management 79 740 79 740 - 71 878 71 878
TOTal 5 943 297 5 943 297 - 5 680 386 5 680 386
2. dEparTMEnTal rEVEnuEnote 2015/16 2014/15
r’000 r’000Sales of goods and services other than capital assets 2.1 3 790 3 793
Fines, penalties and forfeits 2.2 2 080 1 742
Interest, dividends and rent on land 2.3 124 98
Sales of capital assets 2.4 114 1 443
Transactions in financial assets and liabilities 2.5 5 378 24 946
dEparTMEnTal rEVEnuE COllECTEd 11 486 32 022
NOTES TO THE ANNUAL FINANCIAL STATEMENTS for the year ended 31 March 2016

188
2.1 Sales of goods and services other than capital assets
note 2015/16 2014/15r’000 r’000
Sales of goods and services produced by the department 2 3 790 3 792Sales by market establishment 224 181
Administrative fees 3 268 3 342
Other sales 298 269
Sales of scrap, waste and other used current goods - 1
TOTal 3 790 3 793
2.2 Fines, penalties and forfeits
note 2015/16 2014/15r’000 r’000
Fines 2 2 080 1 742
TOTal 2 080 1 742
2.3 interest, dividends and rent on land
note 2015/16 2014/15r’000 r’000
Interest 2 124 98
TOTal 124 98
2.4 Sale of capital assets
note 2015/16 2014/15r’000 r’000
Tangible assets 2 114 1 443Machinery and equipment 28 114 1 443
TOTal 114 1 443
NOTES TO THE ANNUAL FINANCIAL STATEMENTS for the year ended 31 March 2016

DEPARTMENT OF ENVIRONMENTAL AFFAIRS ANNUAL REPORT 2015/16189
2.5 Transactions in financial assets and liabilities
note 2015/16 2014/15r’000 r’000
Receivables 2 371 302
Other Receipts including Recoverable Revenue 5 007 24 644
TOTal 5 378 24 946
Included in the 2014/15 financial year are refunds on unspent funds from Implementing agents (R13,4m) and suitcase cruise grant and voyage for the Algoa joint research (R10,6m)
3. aid assisTanCE
note 2015/16 2014/15r’000 r’000
Opening Balance (7 731) (2 196)
Transferred from statement of financial performances (12 200) (5 535)
Paid during the year - -
ClOsing balanCE (19 931) (7 731)
Included in the expenditure of R12,200m is R279 thousand capital expenditure and R11,921m current expenditure
3.1 Analysis of balance by source
Note 2015/16 2014/15r’000 r’000
Aid assistance from RDP 3 (19 931) (7 731)
ClOsing balanCE (19 931) (7 731)
3.2 Analysis of balance
note 2015/16 2014/15r’000 r’000
Aid assistance receivable 3 (19 931) (7 731)
ClOsing balanCE (19 931) (7 731)
NOTES TO THE ANNUAL FINANCIAL STATEMENTS for the year ended 31 March 2016

190
4. COMpEnsaTiOn Of EMplOyEEs4.1 salaries and wages
note 2015/16 2014/15r’000 r’000
Basic salary 630 206 549 116
Performance award 19 044 17 866
Service Based 272 376
Compensative/circumstantial 10 824 9 951
Other non-pensionable allowances 143 069 123 061
TOTal 803 415 700 370
4.2 Social contributions
note 2015/16 2014/15r’000 r’000
Employer contributionsPension 77 700 66 378
Medical 27 933 20 929
Bargaining council 129 114
TOTal 105 762 87 421
TOTal COMpEnsaTiOn Of EMplOyEEs 909 177 787 791Average number of employees 1 896 1 945
The average number of employees declined due to the re-classification of interns as extra ordinary employees to the establishment
NOTES TO THE ANNUAL FINANCIAL STATEMENTS for the year ended 31 March 2016

DEPARTMENT OF ENVIRONMENTAL AFFAIRS ANNUAL REPORT 2015/16191
5. gOOds and sErViCEs note 2015/16 2014/15
r’000 r’000Administrative fees 1 436 1 431
Advertising 14 302 14 415
Minor assets 5.1 3 084 1 616
Bursaries (employees) 1 376 1 312
Catering 7 420 5 081
Communication 20 570 17 330
Computer services 5.2 75 547 35 933
Consultants: Business and advisory services 126 354 82 295
Laboratory services 113 45
Legal services 4 093 3 528
Contractors 143 686 97 503
Agency and support / outsourced services 2 347 493 2 387 534
Entertainment 128 85
Audit cost – external 5.3 8 875 5 862
Fleet services 8 466 9 198
Inventory 5.4 34 874 15 632
Consumables 5.5 24 600 21 294
Operating leases 70 884 76 663
Property payments 5.6 12 710 15 932
Rental and hiring 3 017 2 275
Transport provided as part of the departmental activities 555 352
Travel and subsistence 5.7 179 501 169 884
Venues and facilities 34 658 34 470
Training and development 17 733 15 300
Other operating expenditure 5.8 65 277 50 067
TOTal 3 206 752 3 065 037
Agency and support/outsourced services has been restated to include the amount of R2, 203 billion (R2, 210 billion) from transfers to households per the Modified Cash Standard requirement. These amounts include expenditure items such as wages, transport, fuel, training, building materials, safety clothes, management fees, etcetera.
NOTES TO THE ANNUAL FINANCIAL STATEMENTS for the year ended 31 March 2016

192
5.1 Minor assets
note 2015/16 2014/155 r’000 r’000
Tangible assets 3 071 1 611Machinery and equipment 2 994 1 611
Transport assets 77 -
intangible assets 13 5Software 13 5
TOTal 3 084 1 616
Increase mainly due to the purchase of 236 signage boards for the control of vehicle use on coastal areas and office furniture for Cape Town Office
5.2 Computer services
note 2015/16 2014/155 r’000 r’000
SITA computer services 53 275 22 204
External computer service providers 22 272 13 729
TOTal 75 547 35 933
Increase mainly due to system development and implementation at the DEA Head Office (R20,1m), the migration to Microsoft and business intelligence analysis and a data assurance solution (R17,3m)
5.3 Audit cost – External
note 2015/16 2014/155 r’000 r’000
Regularity audits 7 212 5 297
Investigations 1 663 565
TOTal 8 875 5 862
Increase mainly due to tariff increases, visits to regional offices and the payment of the March 2015 audit cost in April 2015 as well as the cost related to fraud hotline investigation by external service providers.
NOTES TO THE ANNUAL FINANCIAL STATEMENTS for the year ended 31 March 2016

DEPARTMENT OF ENVIRONMENTAL AFFAIRS ANNUAL REPORT 2015/16193
5.4 Inventory
note 2015/16 2014/155 r’000 r’000
Food and food supplies 953 27
Fuel, oil and gas 33 421 15 595
Materials and supplies 476 8
Medical supplies 24 -
Other supplies 5.4.1 - 2
TOTal 34 874 15 632
The increase is mainly due to the central purchase of herbicides for use by Environmental Programmes (R29,2m) included under the item fuel, oil and gas.
5.4.1 Other supplies
note 2015/16 2014/155 r’000 r’000
Ammunition and security supplies - 2
TOTal - 2
5.5 Consumables
note 2015/16 2014/155 r’000 r’000
Consumable supplies 16 091 12 984Uniform and clothing 4 016 3 538
Household supplies 4 987 3 959
Building material and supplies 2 488 1 206
Communication accessories 38 26
IT consumables 1 451 1 404
Other consumables 3 111 2 851
Stationery, printing and office supplies 8 509 8 310
TOTal 24 600 21 294
NOTES TO THE ANNUAL FINANCIAL STATEMENTS for the year ended 31 March 2016

194
5.6 Property payments
note 2015/16 2014/155 r’000 r’000
Municipal services 7 986 9 493
Property management fees 524 455
Property maintenance and repairs 2 275 4 770
Other 1 925 1 214
TOTal 12 710 15 932
5.7 Travel and subsistence
note 2015/16 2014/155 r’000 r’000
Local 132 408 123 734
Foreign 47 093 46 150
TOTal 179 501 169 884
5.8 Other operating expenditure
note 2015/16 2014/155 r’000 r’000
Professional bodies, membership and subscription fees 25 124 11 409
Resettlement costs 1 336 4 171
Other 38 817 34 487
TOTal 65 277 50 067
NOTES TO THE ANNUAL FINANCIAL STATEMENTS for the year ended 31 March 2016

DEPARTMENT OF ENVIRONMENTAL AFFAIRS ANNUAL REPORT 2015/16195
6. payMEnTs fOr finanCial assETs
note 2015/16 2014/15r’000 r’000
Other material losses written off 6.1 905 343
Debts written off 6.2 3 58
TOTal 908 401
6.1 Other material losses written off
note 2015/16 2014/156 r’000 r’000
Vehicle losses – damaged due to accidents 902 343
Inventory Losses – Lost stock 3 -
TOTal 905 343
Increase is mainly due to the increase in own vehicle fleet and progress with the investigation into accident and loss cases by Legal Services. Written off as irrecoverable loss in accordance with TR12.5.2
6.2 debts written off
note 2015/16 2014/156 r’000 r’000
Debtors 3 58
TOTal dEbT wriTTEn Off 3 58
Debt written off in accordance with TR 11.4.1 (B)
NOTES TO THE ANNUAL FINANCIAL STATEMENTS for the year ended 31 March 2016

196
7. TransfErs and subsidiEs
note 2015/16 2014/15r’000 r’000
Provinces and municipalities 32 42 23
Departmental agencies and accounts Annex 1A 1 112 461 1 210 257
Foreign governments and international organisations Annex 1B 16 000 16 000
Public corporations and private enterprises Annex 1C 300 000 250 000
Non-profit institutions Annex 1D 3 687 3 687
Households Annex 1E 3 553 2 331
TOTal 1 435 743 1 482 298
The total expenditure as per the Appropriation Statement related to Transfers and Subsidies amounts to R3, 864 billion (R3, 895 billion). According to the Modified Cash Standard, expenditure should be disclosed per their use. As a result of Expanded Public Works transfers to implementing agents the under-mentioned amounts included in other transfers to households (Poverty Relief) is reclassified to:
2015/16 2014/15r’000 r’000
Goods & Services 2 203 287 2 210 521 Working For Water 857 838 1 077 058
Working On Fire 615 684 440 451
EPIP 729 765 693 012
Capital 224 481 202 449
EPIP 224 481 202 449
TOTal gOOds & sErViCEs and CapiTal 2 427 768 2 412 970 (Notes 5, 8 and 30 has reference)
NOTES TO THE ANNUAL FINANCIAL STATEMENTS for the year ended 31 March 2016

DEPARTMENT OF ENVIRONMENTAL AFFAIRS ANNUAL REPORT 2015/16197
8. ExpEndiTurE fOr CapiTal
note 2015/16 2014/15r’000 r’000
Tangible assets 383 795 329 577Buildings and other fixed structures 30 353 834 305 640
Machinery and equipment 28 29 961 23 937
intangible assets 1 824 10 319Software 29 1 824 10 319
TOTal 385 619 339 896
Included under Buildings and other fixed structures is R129,346 million (R103,191 million) for Unitary payments, DEA’s wendy house of R7 thousand plus R224,481 million (R202,449 million) EPWP transfers to households (reclassified per Modified Cash Standard requirements). Included in the reclassified amount are expenditure items such as wages, transport, fuel, training, building materials, safety clothes, management fees, etcetera.
8.1 Analysis of funds utilised to acquire capital assets – 2015/16
Voted funds Aid assistance Totalr’000 r’000 r’000
Tangible assets 383 516 279 389 795Buildings and other fixed structures 353 834 - 353 834
Machinery and equipment 29 682 279 29 961
intangible assets 1 824 - 1 824Software 1 824 - 1 824
TOTal 385 340 279 385 619
NOTES TO THE ANNUAL FINANCIAL STATEMENTS for the year ended 31 March 2016

198
8.2 Analysis of funds utilised to acquire capital assets – 2014/15
Voted funds Aid assistance Totalr’000 r’000 r’000
Tangible assets 329 213 364 329 577Buildings and other fixed structures 305 640 - 305 640
Machinery and equipment 23 573 364 23 937
intangible assets 10 319 - 10 319Software 10 319 - 10 319
TOTal 339 532 364 339 896
8.3 Finance lease expenditure included in Expenditure for capital assets
note 2015/16 2014/15r’000 r’000
Tangible assetsBuildings and other fixed structures 129 346 82 376
Machinery and equipment 1 312 2 008
TOTal 130 658 84 384
In terms of the PPP contract for the DEA building, the unitary payment related to the building increases annually with March CPI. Invoice for March 2014/15 services has been paid during the 2013/14 financial year thus 2014/15 only includes 11 payments.
9. Cash and Cash EQuiValEnTs
note 2015/16 2014/15r’000 r’000
Consolidated Paymaster General Account 1 266 31 022
Cash on hand 222 142
TOTal 1 488 31 164
NOTES TO THE ANNUAL FINANCIAL STATEMENTS for the year ended 31 March 2016

DEPARTMENT OF ENVIRONMENTAL AFFAIRS ANNUAL REPORT 2015/16199
10. prEpayMEnTs and adVanCEs
note 2015/16 2014/15r’000 r’000
Travel and subsistence 475 577
TOTal 475 577
10.1 prEpayMEnTs (ExpEnsEd)
note 2015/16 2014/1510 r’000 r’000
Goods and services 116 160 235 734
Capital assets 24 566 49 837
TOTal 140 726 285 571
The expensed prepayments relate to the EPWP transfers to households reclassified as expenditure to Goods & Services and Capital Assets per Modified Cash Standard requirements. These prepayments translates to 5.81% (11.64%) of the total EPWP transfers for the year and to 878 projects of which 279 are for EPWP accredited training.
11. rECEiVablEs
note 2015/16 2014/15Current Non-current Total Current Non-current Total
r’000 r’000 r’000 r’000 r’000 r’000Claims recoverable 11.1 212 9488 9 700 22 806 - 22 806
Trade recoverable 11.2 2 277 8 420 10 697 1 023 5 405 6 428
Recoverable expenditure 11.3 1 431 2 567 3 998 1 452 1 914 3 366
Staff debt 11.4 285 1 298 1 583 602 708 1 310
TOTal 4 205 21 773 25 978 25 883 8 027 33 910
NOTES TO THE ANNUAL FINANCIAL STATEMENTS for the year ended 31 March 2016

200
11.1 Claims recoverable
note 2015/16 2014/1511 r’000 r’000
National departments 212 22 788
Provincial departments - 18
Public entities 9 488 -
TOTal 9 700 22 806
11.2 Trade receivables
note 2015/16 2014/1511 r’000 r’000
Implementation Projects 10 697 6 428
TOTal 10 697 6 428
11.3 Recoverable expenditure (disallowance accounts)
note 2015/16 2014/1511 r’000 r’000
Department Suspense Account 3 959 3 366
Salary Reversal Control Account 39 -
TOTal 3 998 3 366
11.4 staff debt
note 2015/16 2014/1511 r’000 r’000
Debt Accounts 1 583 1 310
TOTal 1 583 1 310
NOTES TO THE ANNUAL FINANCIAL STATEMENTS for the year ended 31 March 2016

DEPARTMENT OF ENVIRONMENTAL AFFAIRS ANNUAL REPORT 2015/16201
12. VOTEd funds TO bE surrEndErEd TO ThE rEVEnuE fund
note 2015/16 2014/15r’000 r’000
Opening balance 5 327 6 535
Transfer from statement of financial performance (as restated) 5 377 5 327
Paid during the year (5 327) (6 535)
ClOsing balanCE 5 377 5 327
13. dEparTMEnTal rEVEnuE and nrf rECEipTs TO bE surrEndErEd TO ThE rEVEnuE fund
note 2015/16 2014/15r’000 r’000
Opening balance 6 217 3 877
Transfer from Statement of Financial Performance (as restated) 11 486 32 022
Paid during the year (17 456) (29 682)
ClOsing balanCE 247 6 217
14. PAYABLES – CURRENT
note 2015/16 2014/15r’000 r’000
Other payables 14.1 30 845 54 707
TOTal 30 845 54 707
NOTES TO THE ANNUAL FINANCIAL STATEMENTS for the year ended 31 March 2016

202
14.1 Other payables
note 2015/16 2014/1514 r’000 r’000
Salary related payables 188 205
Department suspense accounts 30 645 54 453
Control account 12 49
TOTal 30 845 54 707
Included in the 2014/15 financial year, was a deposit from the Jobs Fund to be utilised in the 2015/16 financial year (R43, 9 m). The amount outstanding for 2015/16 will be mainly utilised during April 2016.
15. nET Cash flOw aVailablE frOM OpEraTing aCTiViTiEs
note 2015/16 2014/15r’000 r’000
Net surplus/(deficit) as per Statement of Financial Performance 4 663 31 814
Add back non cash/cash movements not deemed operating activities 346 894 311 251(Increase)/decrease in receivables – current 7 932 (19 374)
(Increase)/decrease in prepayments and advances 102 (258)
Increase/(decrease) in payables – current (23 862) 28 647
Proceeds from sale of capital assets (114) (1 443)
Expenditure on capital assets 385 619 339 896
Surrenders to Revenue Fund (22 783) (36 217)
nET Cash flOw gEnEraTEd by OpEraTing aCTiViTiEs 351 557 343 065
16. rECOnCiliaTiOn Of Cash and Cash EQuiValEnTs fOr Cash flOw purpOsEs
note 2015/16 2014/15r’000 r’000
Consolidated Paymaster General account 1 266 31 022
Cash on hand 222 142
TOTal 1 488 31 164
NOTES TO THE ANNUAL FINANCIAL STATEMENTS for the year ended 31 March 2016

DEPARTMENT OF ENVIRONMENTAL AFFAIRS ANNUAL REPORT 2015/16203
17. COnTingEnT liabiliTiEs and COnTingEnT assETs
17.1 Contingent liabilities
note 2015/16 2014/15r’000 r’000
liable to natureHousing loan guarantees Employees Annex 3A 463 463
Claims against the department Annex 3B 7 860 7 908
Intergovernmental payables (unconfirmed balances) Annex 5 - 674
TOTal 8 323 9 045
Housing loan guarantee settlements are reliant on staff’s ability to pay-off the guarantee amount and confirmation from the bank via staff member.
Claims against the department are discussed in the annexure and until a legal decision is reached the liability remains uncertain.
Claims received from other departments are paid as soon as acceptable documents of proof has been received and verified, normally within 30 days.
No indication on reimbursements on any of the above mentioned amounts yet.
7.2 Contingent assets
note 2015/16 2014/15r’000 r’000
Nature of contingent assetSection 24G Administration fines 1 025 3 340
Claims against a service provider 88 72
TOTal 1 113 3 412
Included in 2014/15 is an amount of R2,3m from Dube Trade port (the Quantum appeal administrative fine reduced by the Minister to R1,3m and was paid during the year under review).
NOTES TO THE ANNUAL FINANCIAL STATEMENTS for the year ended 31 March 2016

204
18. COMMiTMEnTs
note 2015/16 2014/15r’000 r’000
Current expenditureApproved and contracted 7 038 655 7 457 357
Approved but not yet contracted 198 738 14 662
7 237 393 7 472 019Capital expenditureApproved and contracted 1 268 828 1 717 766
1 268 828 1 717 766TOTal COMMiTMEnTs 8 506 221 9 189 785
Approved and contracted for 2014/15 includes (R3, 437b) for Forest Fire Association for aerial fire fighting and dispatch and coordination components for Working on Fire Programme. 2015/16 amount includes (R89, 9m) for IDT to implement Invasive Alien Plant, Bush-encroachment control and Donga Reclamation and R23m for Flauna Consortium for an integrated, comprehensive marketing and communication campaign for the upcoming 17th Conference of Parties to CITES.
Commitment amounts are based on the outstanding value of the full remaining contract period which may be more than 12 months.
19. aCCruals and payablEs nOT rECOgnisEd
Listed by economic classification 2015/16 2014/15r’000 r’000
30 Days 30+ Days Total TotalGoods and services 57 217 - 57 217 67 095
Capital assets 8 450 - 8 450 2 318
Other 5 367 - 5 367 1 217
TOTal 71 034 - 71 034 70 630
NOTES TO THE ANNUAL FINANCIAL STATEMENTS for the year ended 31 March 2016

DEPARTMENT OF ENVIRONMENTAL AFFAIRS ANNUAL REPORT 2015/16205
Listed by programme level note 2015/16 2014/15r’000 r’000
Administration 13 742 14 715
Legal, Authorisations and Compliance 305 1 566
Oceans and Coasts 31 989 11 513
Climate Change and Air Quality 1 280 1 004
Biodiversity and Conservation 5 287 2 374
Environmental Programmes 12 734 35 742
Chemicals and Waste Management 330 2 499
Other (Assets & Liabilities) 5 367 1 217
TOTal 71 034 70 630
Included in the above totals are the following:Confirmed balances with other departments Annex 5 7 035 2 416
TOTal 7 035 2 416
Oceans and Coasts - Includes invoices from Nelson Mandela Metropolitan/Walter Sisulu University (R16m) for Operation Phakisa: (Hosting and managing National Ocean and Coasts Pollution Monitoring Laboratory)
Biodiversity and Conservation - Includes invoice from McKinsey & CO (R4,4m) for Tourism Biodiversity project (Technical support for the development of detailed delivery plans for enhancing the Biodiversity based economy of South Africa)
Environmental Programmes - Includes invoices to Independent Development Trust (IDT) (R1,7m) to implement Invasive Alien Plant, Bush-encroachment control and Donga Reclamation, and Agricultural Research Council (ARC) (R4,9m) for Repeat and Refinement National Invasive Alien Plant Survey
Other (assets and liabilities) - Include invoice to University of Cape Town (R1,2m) for Analytical Support on Climate Change Mitigation at National and International Scale.
NOTES TO THE ANNUAL FINANCIAL STATEMENTS for the year ended 31 March 2016

206
20. EMplOyEE bEnEfiTs
note 2015/16 2014/15r’000 r’000
*Leave entitlement 17 776 9 230
Service bonus (Thirteenth cheque) 24 962 21 942
Performance awards 13 960 11 283
Capped leave commitments 11 836 11 130
**Other 331 240
TOTal 68 865 53 825
*A negative amount of R685 thousand was offset against leave entitlement. The amount was as a result of pro-rata calculation of leave taken by employees as at 31 March 2016.
If an employee takes more leave than what is entitled, it results in a negative leave balance. This situation is automatically rectified during the following leave period.
**Other (Long service recognition is as follow):
1. 17 employees qualified for 20 years continued service cash award of R9 291 (R157 947)
2. 8 employees qualified for 30 years continued service cash award of R18 582 (R148 656)
3. 1 employee qualified for 40 years continued service cash award of R24 776
21 lEasE COMMiTMEnTs
21.1 Operating leases expenditure
2015/16spECialisEd MiliTary
EQuipMEnT land buildings and OThEr fixEd sTruCTurEs
MaChinEry and EQuipMEnT TOTal
r’000 r’000 r’000 r’000 r’000Not later than 1 year - - 32 658 3 363 36 021
Later than 1 year and not later than 5 years - - 18 203 3 447 21 650
Later than five years - - - - -
TOTal lEasE COMMiTMEnTs - - 50 861 6 810 57 671
The escalation clauses of the 25 buildings leased by the department range from 5.5% to 10%. The department occupies 3 buildings where leases have expired and the process of renewing the leases has not begun. The potential commitment amounts to R344 thousand per year.
NOTES TO THE ANNUAL FINANCIAL STATEMENTS for the year ended 31 March 2016

DEPARTMENT OF ENVIRONMENTAL AFFAIRS ANNUAL REPORT 2015/16207
2014/15spECialisEd MiliTary
EQuipMEnT land buildings and OThEr fixEd sTruCTurEs
MaChinEry and EQuipMEnT TOTal
r’000 r’000 r’000 r’000 r’000Not later than 1 year - - 43 876 2 111 45 987
Later than 1 year and not later than 5 years - - 39 329 2 700 42 029
Later than five years - - - 86 86
TOTal lEasE COMMiTMEnTs - - 83 205 4 897 88 102
21.2 Finance leases expenditure
2015/16spECialisEd MiliTary
EQuipMEnT land buildings and OThEr fixEd sTruCTurEs
MaChinEry and EQuipMEnT TOTal
r’000 r’000 r’000 r’000 r’000Not later than 1 year - - - 103 103
Later than 1 year and not later than 5 years - - - 41 41
TOTal lEasE COMMiTMEnTs - - - 144 144
2014/15spECialisEd MiliTary
EQuipMEnT land buildings and OThEr fixEd sTruCTurEs
MaChinEry and EQuipMEnT TOTal
r’000 r’000 r’000 r’000 r’000Not later than 1 year - - - 950 950
Later than 1 year and not later than 5 years - - - 8 8
TOTal lEasE COMMiTMEnTs - - - 958 958
This note excludes leases relating to public private partnership as they are separately disclosed in note no. 26.
Included in the amount for 2014/15 is four (4) green cars leased from Nissan SA by the department, the lease of these vehicles expired in February 2016.
The 2015/16 lease amount consist of photocopies leased through transversal contracts that qualify as finance leases.
NOTES TO THE ANNUAL FINANCIAL STATEMENTS for the year ended 31 March 2016

208
22. aCCruEd dEparTMEnTal rEVEnuE
note 2015/16 2014/15r’000 r’000
Fines, penalties and forfeits 1 150 150
TOTal 1 150 150
Included in the current year is an amount of R1m from Transnet for the unlawful construction and upgrade of the Transnet service road or the rail line from Tankatara level crossing to Coega station, Eastern Cape province
22.1 Analysis of accrued departmental revenue
note 2015/16 2014/15r’000 r’000
Opening balance 150 1 881
Less: amounts received - (1 631)
Add: amounts recognised 1 000 -
Less: amounts written-off/reversed as irrecoverable - (100)
ClOsing balanCE 1 150 150
23. fruiTlEss and wasTEful ExpEndiTurE
23.1 Reconciliation of fruitless and wasteful expenditure
note 2015/16 2014/15r’000 r’000
Opening balance - 25 865
Prior period error - (25 865)
ClOsing balanCE - -
NOTES TO THE ANNUAL FINANCIAL STATEMENTS for the year ended 31 March 2016

DEPARTMENT OF ENVIRONMENTAL AFFAIRS ANNUAL REPORT 2015/16209
23.2 Prior period error
2014/15r’000
Relating to 2013/14 (affecting the opening balance) (25 865)(25 865)
TOTal (25 865)
24. rElaTEd parTy TransaCTiOns
note 2015/16 2014/15Payments made r’000 r’000Goods and services 299 568
TOTal 299 568
List of related party relationships:
Schedule 3A: South African Biodiversity Institute (SANBI) – Usage of conference facilities & accommodation
Schedule 3A: South African National Parks (SANParks) – None
Schedule 3A: South African Weather Service (SAWS) – None
Schedule 3A: iSimangaliso Wetland Park Authority - None
25. kEy ManagEMEnT pErsOnnEl
no. of individuals
2015/16 2014/15
r’000 r’000Political office bearers (provide detail below) 2 4 213 3 391
Level 15 to 16 12 16 301 14 894
Level 14 (incl. CFO if at a lower level) 54 52 598 46 203
TOTal 73 112 64 488
NOTES TO THE ANNUAL FINANCIAL STATEMENTS for the year ended 31 March 2016

210
26. publiC priVaTE parTnErship
note 2015/16 2014/15r’000 r’000
Unitary fee paid 134 529 84 252Fixed component 129 346 82 376
Indexed component 5 183 1 876
Analysis of indexed component 5 183 1 876Goods and services (excluding lease payments) 5 183 1 876
The Department entered into a Public Private Partnership with Imvelo Concession Company (Pty) Ltd (RF) (the company) to erect a DEA Green Building Campus over a two year period, ending June 2014, where after the company will manage the operations, maintenance and financing of the facility for a period of 25 years.
In terms of the PPP agreement, DEA has to contribute R366 million to reduce the unitary payment for the 2012/13 and 2013/14 financial year. Over the remaining 25 years the unitary payment of approximately R124 million per year is payable by DEA from the 2014/15 financial year, increasing with CPI on an annual basis. The commencement of the PPP accounting term is the 1 August 2014, the date from which DEA is entitled to exercise its right to use the asset.
Gross unitary monthly instalment per clause 2.3 has been paid amounting to R129,346m, Pass-through costs and additional payment amounting to R5, 183m as per Clause 6.24 of Schedule 6 of the PPP Agreement as at 31 March’16.
The Imvelo Concession Company (Pty) Ltd consists of the following concessionaires:
Grinakar/Aveng LTD 30%
Old Mutual PLC 30%
Wiphold LTD 20% , and
Kagiso/Tiso Holdings 20%
NOTES TO THE ANNUAL FINANCIAL STATEMENTS for the year ended 31 March 2016

DEPARTMENT OF ENVIRONMENTAL AFFAIRS ANNUAL REPORT 2015/16211
27. iMpairMEnT (OThEr Than rECEiVablEs, aCCruEd dEparTMEnTal rEVEnuE, lOans and inVEsTMEnTs)
note 2015/16 2014/15r’000 r’000
Debtors 66 122
TOTal 66 122
28. MOVablE TangiblE CapiTal assETs
MOVEMEnT in MOVablE TangiblE CapiTal assETs pEr assET rEgisTEr fOr ThE yEar EndEd 31 MarCh 2016
OpEning balanCE ValuE adjusTMEnTs addiTiOns dispOsals ClOsing balanCEr’000 r’000 r’000 r’000 r’000
MaChinEry and EQuipMEnT 1 642 037 - 33 679 13 732 1 661 984Transport assets 1 464 358 - 5 343 196 1 469 505
Computer equipment 72 186 - 20 719 11 904 81 001
Furniture and office equipment 11 972 - 2 385 1 222 13 135
Other machinery and equipment 93 521 - 5 232 410 98 343
TOTal MOVablE TangiblE CapiTal assETs 1 642 037 - 33 679 13 732 1 661 984
NOTES TO THE ANNUAL FINANCIAL STATEMENTS for the year ended 31 March 2016

212
28.1 additions
addiTiOns TO MOVablE TangiblE CapiTal assETs pEr assET rEgisTEr fOr ThE yEar EndEd 31 MarCh 2016
Cash nOn-Cash (CapiTal wOrk in prOgrEss CurrEnT
COsTs and finanCE lEasE payMEnTs)
rECEiVEd CurrEnT, nOT paid
(paid CurrEnT yEar, rECEiVEd priOr yEar)
TOTal
r’000 r’000 r’000 r’000 r’000MaChinEry and EQuipMEnT 29 961 3 584 (1 312) 1 446 33 679Transport assets 6 156 99 (912) - 5 343
Computer equipment 17 860 2 371 - 488 20 719
Furniture and office equipment 819 734 - 832 2 385
Other machinery and equipment 5 126 380 (400) 126 5 232
TOTal addiTiOns TO MOVablE TangiblE CapiTal assETs 29 961 3 584 (1 312) 1 446 33 679
28.2 Disposals
dispOsals Of MOVablE TangiblE CapiTal assETs pEr assET rEgisTEr fOr ThE yEar EndEd 31 MarCh 2016
sOld fOr Cash nOn-Cash dispOsal TOTal dispOsals Cash rECEiVEd aCTual
r’000 r’000 r’000 r’000MaChinEry and EQuipMEnT 5 010 8 722 13 732 99Transport assets - 196 196 -
Computer equipment 5 001 6 903 11 904 99
Furniture and office equipment - 1 222 1 222 -
Other machinery and equipment 9 401 410 -
TOTal dispOsal Of MOVablE TangiblE CapiTal assETs 5 010 8 722 13 732 99
NOTES TO THE ANNUAL FINANCIAL STATEMENTS for the year ended 31 March 2016

DEPARTMENT OF ENVIRONMENTAL AFFAIRS ANNUAL REPORT 2015/16213
28.3 Movement for 2014/15
MOVEMEnT in TangiblE CapiTal assETs pEr assET rEgisTEr fOr ThE yEar EndEd 31 MarCh 2015
OpEning balanCE priOr pEriOd ErrOr addiTiOns dispOsals ClOsing balanCEr’000 r’000 r’000 r’000 r’000
MaChinEry and EQuipMEnT 1 651 458 - 49 807 59 228 1 642 037Transport assets 1 456 672 - 8 648 962 1 464 358
Computer equipment 65 891 - 36 235 29 940 72 186
Furniture and office equipment 31 447 - 439 19 914 11 972
Other machinery and equipment 97 448 - 4 485 8 412 93 521
TOTal MOVablE TangiblE CapiTal assETs 1 651 458 - 49 807 59 228 1 642 037
28.4 Minor assets
MOVEMEnT in MinOr assETs pEr ThE assET rEgisTEr fOr ThE yEar EndEd as aT 31 MarCh 2016
spECialisEd MiliTary assETs
inTangiblE assETs hEriTagE assETs MaChinEry and EQuipMEnT
biOlOgiCal assETs TOTal
r’000 r’000 r’000 r’000 r’000 r’000Opening balance - 1 212 - 21 165 - 22 377
Additions - 11 - 2 272 - 2 283
Disposals - (612) - (1 337) - (1 949)
TOTal MinOr assETs - 611 - 22 100 - 22 711
NOTES TO THE ANNUAL FINANCIAL STATEMENTS for the year ended 31 March 2016

214
spECialisEd MiliTary assETs
inTangiblE assETs hEriTagE assETs MaChinEry and EQuipMEnT
biOlOgiCal assETs TOTal
r’000 r’000 r’000 r’000 r’000 r’000Number of R1 minor assets 268 - 268
Number of minor assets at cost - 283 - 14 520 - 14 803
TOTal nuMbEr Of MinOr assETs - 283 - 14 788 - 15 071
MOVEMEnT in MinOr assETs pEr ThE assET rEgisTEr fOr ThE yEar EndEd as aT 31 MarCh 2015
spECialisEd MiliTary assETs
inTangiblE assETs hEriTagE assETs MaChinEry and EQuipMEnT
biOlOgiCal assETs TOTal
r’000 r’000 r’000 r’000 r’000 r’000Opening balance - 4 208 147 37 954 - 42 309
Additions - 5 - 4 467 - 4 472
Disposals - (3 001) (147) (21 256) - (24 404)
TOTal MinOr assETs - 1 212 - 21 165 - 22 377
spECialisEd MiliTary assETs
inTangiblE assETs hEriTagE assETs MaChinEry and EQuipMEnT
biOlOgiCal assETs TOTal
r’000 r’000 r’000 r’000 r’000 r’000Number of R1 minor assets - - 1 561 - 562
Number of minor assets at cost - 474 2 9 458 - 9 934
TOTal nuMbEr Of MinOr assETs - 474 3 10 019 - 10 496
NOTES TO THE ANNUAL FINANCIAL STATEMENTS for the year ended 31 March 2016

DEPARTMENT OF ENVIRONMENTAL AFFAIRS ANNUAL REPORT 2015/16215
28.5 Movable assets written off
MOVablE assETs wriTTEn Off fOr ThE yEar EndEd 31 MarCh 2016
spECialisEd MiliTary assETs
inTangiblE assETs hEriTagE assETs MaChinEry and EQuipMEnT
biOlOgiCal assETs TOTal
r’000 r’000 r’000 r’000 r’000 r’000Assets written off - - - 585 - 585
TOTal MOVablEs - - - 585 - 585
MOVablE assETs wriTTEn Off fOr ThE yEar EndEd 31 MarCh 2015
spECialisEd MiliTary assETs
inTangiblE assETs hEriTagE assETs MaChinEry and EQuipMEnT
biOlOgiCal assETs TOTal
r’000 r’000 r’000 r’000 r’000 r’000Assets written off - - - 86 - 86
TOTal MOVablEs - - - 86 - 86
29. inTangiblE CapiTal assETs
MOVEMEnT in inTangiblE CapiTal assETs pEr assET rEgisTEr fOr ThE yEar EndEd 31 MarCh 2016
OpEning balanCE ValuE adjusTMEnTs addiTiOns dispOsals ClOsing balanCEr’000 r’000 r’000 r’000 r’000
Software 12 296 - 1 601 891 13 006
TOTal inTangiblE CapiTal assETs 12 296 - 1 601 891 13 006
NOTES TO THE ANNUAL FINANCIAL STATEMENTS for the year ended 31 March 2016

216
29.1 additions
addiTiOns TO inTangiblE CapiTal assETs pEr assET rEgisTEr fOr ThE yEar EndEd 31 MarCh 2016
Cash nOn-Cash (dEVElOp-MEnT wOrk in prOgrEss
– CURRENT COSTS)
rECEiVEd CurrEnT yEar, nOT paid (paid CurrEnT
yEar, rECEiVEd priOr yEar)
TOTal
r’000 r’000 r’000 r’000 r’000
Software 1 601 - - - 1 601
TOTal addiTiOns TO inTangiblE CapiTal assETs 1 601 - - - 1 601
29.2 Disposals
dispOsals Of inTangiblE CapiTal assETs pEr assET rEgisTEr fOr ThE yEar EndEd 31 MarCh 2016
sOld fOr Cash TransfEr OuT Or dEsTrOyEd Or
sCrappEd
TOTal dispOsals Cash rECEiVEd aCTual
r’000 r’000 r’000 r’000
Software 727 164 891 -
TOTal dispOsals Of inTangiblE CapiTal assETs 727 164 891 -
29.3 Movement for 2014/15
MOVEMEnT in inTangiblE CapiTal assETs pEr assET rEgisTEr fOr ThE yEar EndEd 31 MarCh 2015
OpEning balanCE priOr pEriOd ErrOr addiTiOns dispOsals ClOsing balanCEr’000 r’000 r’000 r’000 r’000
Software 6 732 - 19 119 13 555 12 296
TOTal inTangiblE CapiTal assETs 6 732 - 19 119 13 555 12 296
NOTES TO THE ANNUAL FINANCIAL STATEMENTS for the year ended 31 March 2016

DEPARTMENT OF ENVIRONMENTAL AFFAIRS ANNUAL REPORT 2015/16217
30. iMMOVablE TangiblE CapiTal assETs
MOVEMEnT in iMMOVablE TangiblE CapiTal assETs pEr assET rEgisTEr fOr ThE yEar EndEd 31 MarCh 2016
OpEning balanCE ValuE adjusTMEnTs addiTiOns dispOsals ClOsing balanCEr’000 r’000 r’000 r’000 r’000
buildings and OThEr fixEd sTruCTurEs 33 - 69 301 28 750 40 584Dwellings - - 7 - 7
Non-residential buildings 33 - - - 33
Other fixed structures - - 69 294 28 750 40 544
TOTal iMMOVablE TangiblE CapiTal assETs 33 - 69 301 28 750 40 584
Included under Buildings and Other Fixed Structures is other fixed structure assets to the amount of R69, 301 million completed during the year. Assets to the amount of R28, 750 million has been transferred and remaining with assets to the amount of R40.5 million. Included as Other Fixed Structure as per Note 30.1 are cash transfers to the amount of R224, 481 million (R202, 449 million), which are reclassified from EPWP transfers to households to capital expenditure as per Modified Cash Standard requirements (refer Note 8).
30.1 additions
addiTiOns TO iMMOVablE TangiblE CapiTal assETs pEr assET rEgisTEr fOr ThE yEar EndEd 31 MarCh 2016
Cash nOn-Cash (CapiTal wOrk in prOgrEss
CurrEnT COsTs and finanCE lEasE
payMEnTs)
rECEiVEd CurrEnT, nOT paid (paid CurrEnT yEar,
rECEiVEd priOr yEar)
TOTal
r’000 r’000 r’000 r’000 r’000
building and OThEr fixEd sTruCTurEs 224 488 - (155 187) - 69 301Dwellings 7 - - - 7
Other fixed structures 224 481 - (155 187) - 69 294
TOTal addiTiOns TO iMMOVablE TangiblE CapiTal assETs 224 488 - (155 187) - 69 301
NOTES TO THE ANNUAL FINANCIAL STATEMENTS for the year ended 31 March 2016

218
30.2 Disposals
dispOsals Of iMMOVablE TangiblE CapiTal assETs pEr assET rEgisTEr fOr ThE yEar EndEd 31 MarCh 2016
sOld fOr Cash nOn-Cash dispOsal
TOTal dispOsal Cash rECEiVEd aCTual
r’000 r’000 r’000 r’000
buildings and OThEr fixEd sTruCTurEs - 28 750 28 750 -Other fixed structures - 28 750 28 750 -
TOTal dispOsal Of iMMOVablE - 28 750 28 750 -
30.3 Movement for 2014/15
MOVEMEnT in iMMOVablE TangiblE CapiTal assETs pEr assET rEgisTEr fOr ThE yEar EndEd 31 MarCh 2015
OpEning balanCE priOr pEriOd ErrOr addiTiOns dispOsals ClOsing balanCEr’000 r’000 r’000 r’000 r’000
buildings and OThEr fixEd sTruCTurEs 33 - 161 161 33Other fixed structures 33 - 161 161 33
TOTal iMMOVablE TangiblE CapiTal assETs 33 - 161 161 33
NOTES TO THE ANNUAL FINANCIAL STATEMENTS for the year ended 31 March 2016

DEPARTMENT OF ENVIRONMENTAL AFFAIRS ANNUAL REPORT 2015/16219
31. priOr pEriOd ErrOr
31.1 Correction of prior period error
Corrected reporting of payments appropriated as transfers according to their use2014/15
note r’000
Increase: Goods and services: Agency and support/outsourced services 5 2 210 521
Increase: Tangible assets: Buildings and other fixed structures 8 202 449
Decrease: Transfers and subsidies: Households 7 (2 412 970)
Net effect -According to the MCS expenditure must be reported per use irrespective of how it was budgeted for. The amounts indicated above has been appropriated as transfers and subsidies but the expenditure were made to implementing agents appointed as contractors instead of transferring funds directly to the beneficiaries. This was done as additional control measures taken in accordance with Treasury regulation 8.4.1(e) to ensure compliance to transfer payment control requirements. However, this principle which has been implemented and accepted long before the implementation of the MCS has not been accepted by the Office of the Accountant-General and the Auditor-General, hence the requirement to reclassify.
32. inVEnTOry (EffECTiVE 1 april 2017)nOTE 2015/16 2014/15
inVEnTOry annExurE 6 r’000 r’000Opening balance 6 094 162
Add/(Less): Adjustments to prior year balances (1 144) 3 788
Add: Additions/Purchases - Cash 32 001 10 234
(Less): Issues (26 954) (5 287)
Add/(Less): Adjustments 4 534 (2 803)
ClOsing balanCE 14 531 6 094
33. sTaTEMEnT Of COndiTiOnal/unCOndiTiOnal granTs paid TO MuniCipaliTiEsgranT allOCaTiOn TransfEr
diVisiOn Of rEVEnuE aCT rOll OVErs adjusTMEns TOTal aVailablE aCTual TransfEr funds wiThhEld rE-allOCaTiOns by naTiOnal TrEasury Or naTiOnal dEparTMEnT
naME Of MuniCipaliTy r’000 r’000 r'000 r'000 r'000 %Various Municipalities - - 42 42 42 - -
TOTal - - 42 42 42 - -
NOTES TO THE ANNUAL FINANCIAL STATEMENTS for the year ended 31 March 2016

220
annExurE 1a
sTaTEMEnT Of TransfErs TO dEparTMEnTal agEnCiEs and aCCOunTs
TransfEr allOCaTiOn TransfEr 2014/15
adjusTEd apprOpriaTiOn
rOll OVErs adjusTMEns TOTal aVailablE aCTual TransfEr % Of aVailablE funds
TransfErrd
apprOpriaTiOn aCT
dEparTMEnT/ agEnCy/ aCCOunT r’000 r’000 r'000 r'000 r'000 %South African Weather Service 160 423 - - 160 423 160 423 100% 182 489
iSimangaliso Wetland Park Authority 92 769 - - 92 769 92 769 100% 132 007
South African National Parks 546 979 - - 546 979 546 979 100% 590 922
South African National Biodiversity Institute 304 412 - - 304 412 304 412 100% 289 951
National Regulator for Compulsory Specifications 6 832 - - 6 832 6 832 100% 11 025
SABC: Radio and TV Licences - - 2 2 2 100% 2
Compensation fund - - 1 044 1 044 1 044 100% 3 861
TOTal 1 111 415 - 1 046 1 112 461 1 112 461 1 210 257
ANNEXURE TO THE FINANCIAL STATEMENTS for the year ended 31 March 2016

DEPARTMENT OF ENVIRONMENTAL AFFAIRS ANNUAL REPORT 2015/16221
annExurE 1b
sTaTEMEnT Of TransfErs TO fOrEign gOVErnMEnTs and inTErnaTiOnal OrganisaTiOns
TransfEr allOCaTiOn ExpEndiTurE 2014/15adjusTEd
apprOpriaTiOn aCT
rOll OVErs adjusTMEnTs TOTal aVailablE
aCTual TransfEr
% Of aVailablE
fundsTransfErrd
AppropriationAct
naME Of publiC COrpOraTiOn/priVaTE EnTErprisE r'000 r'000 r'000 r'000 r'000 % r'000TransfersGlobal Environmental Fund (GEF) 16 000 - - 16 000 16 000 100% 16 000
TOTal 16 000 - - 16 000 16 000 16 000
annExurE 1C
sTaTEMEnT Of TransfErs/subsidiEs TO publiC COrpOraTiOns and priVaTE EnTErprisEs
TransfEr allOCaTiOn ExpEndiTurE 2014/15
adjusTEd apprOpriaTiOn
rOll OVErs adjusTMEns TOTal aVailablE aCTual TransfEr % ofavailable funds
Transferred
Capital Current apprOpriaTiOn aCT
fOrEign gOVErnMEnT/ inTErnaTiOnal OrganisaTiOn
r'000 r'000 r'000 r'000 r'000 % r'000 r'000 r'000
Public CorporationsTransfersGreen Fund DBSA 300 000 - - 300 000 300 000 100.0% - - 250 000
TOTal 300 000 - - 300 000 300 000 100.0% - - 250 000
ANNEXURE TO THE FINANCIAL STATEMENTS for the year ended 31 March 2016

222
annExurE 1d
sTaTEMEnT Of TransfErs TO nOn-prOfiT insTiTuTiOns
TransfEr allOCaTiOn ExpEndiTurE 2014/15
adjusTEd apprOpriaTiOn rOll OVErs adjusTMEns TOTal aVailablE aCTual TransfEr
% Of aVailablE funds
TransfErrd
apprOpriaTiOn aCT
nOn-prOfiT insTiTuTiOns r’000 r’000 r'000 r'000 r'000 %TransfersNational Association for Clear Air 1 400 - - 1 400 1 400 100% 1 400
KwaZulu-Natal Conservation Board 1 287 - - 1 287 1 287 100% 1 287
African world Heritage Fund 1 000 - - 1 000 1 000 100% 1 000
TOTal 3 687 - - 3 687 3 687 3 687
annExurE 1E
sTaTEMEnT Of TransfErs TO hOusEhOlds
TransfEr allOCaTiOn ExpEndiTurE 2014/15
adjusTEd apprOpriaTiOn rOll OVErs adjusTMEns TOTal aVailablE aCTual TransfEr
% Of aVailablE funds
TransfErrd
apprOpriaTiOn aCT
hOusEhOlds r’000 r’000 r'000 r'000 r'000 %TransfersSocial Benefit - - 3 553 3 553 3 553 100% 2 331
TOTal - - 3 553 3 553 3 553 2 331
ANNEXURE TO THE FINANCIAL STATEMENTS for the year ended 31 March 2016

DEPARTMENT OF ENVIRONMENTAL AFFAIRS ANNUAL REPORT 2015/16223
annExurE 1f
sTaTEMEnT Of aid assisTanCE rECEiVEd
naME Of dOnOr purpOsEOpEning balanCE
r'000 rEVEnuE
r'000 ExpEndiTurE
r'000ClOsing balanCE
r'000Received in cashBotswana Transfrontier Conservation Areas (TFCA Strategy) - - 376 (376)
Germany Promethium Carbon Programme (1 254) - - (1 254)
Australia Funding Agreement in relation to South Africa Land Sector Measurement
(1 245) - 2 252 (3 497)
United Nations (UNEP) Hazardous Material Management Programme (654) - - (654)
United Nations (UNEP) Strengthening Law Enforcement Capabilities to Combat Wildlife Crime for Conservation and Sustainable Use of Species in South Africa: target: Rhinoceros
(2 223) - 7 725 (9 948)
United Nations (UNEP) Benguela Current Large Marine ecosystem Programme (1 142) - - (1 142)
United Nations (UNEP) Payment for Watershed Services 23 - - 23
United Nations (UNEP) Synergies Workshop among the Basel, Stockholm and Rotterdam Conventions
(790) - - (790)
United Nations (UNEP) South Africa: Enabling Activities for the Preparation of Third National Communication (TNC) and Bienniel Update Report (BUR)
(446) - 554 (1 000)
United Nations (UNEP) 6TH Session of the AEWA Meeting of Parties - - 1 293 (1 293)
TOTal (7 731) - 12 200 (19 931)
ANNEXURE TO THE FINANCIAL STATEMENTS for the year ended 31 March 2016

224
annExurE 1g
sTaTEMEnT Of gifTs, dOnaTiOns and spOnsOrships MadE and rEMissiOns, rEfunds and payMEnTs MadE as an aCT Of graCE
naTurE Of gifT, dOnaTiOn Or spOnsOrship(Group major categories but list material items including name of organisation
2015/16 2014/15r’000 r’000
Made in kind
Act of grace payment on loss of private property on official duty 8 -
TOTal 8 -
annExurE 3a
STATEMENT OF FINANCIAL GUARANTEES ISSUED AS AT 31 MARCH 2016 – LOCAL
guaranTEE in rEspECT Of
Original guaranTEEd
CapiTal aMOunT
OpEning balanCE
1 april 2015
guaranTEEsdraw
dOwnsduring ThE
yEar
guaranTEEsrEpayMEnTs/ CanCEllEd/
rEduCEd/ rElEasEd
during ThE yEar
rEValua-TiOns
ClOsing balanCE
31 MarCh 2016
guaranTEEd inTErEsT fOr yEar EndEd
31 MarCh 2016
rEalisEdlOssEs nOT
rECOVErablE i.E. ClaiMs
paid OuT
guaranTOr insTiTuTiOn r’000 r'000 r’000 r'000 r'000 % r’000 r’000housingStandard Bank - 131 - - - 131 - -
Firstrand Bank: FNB - 57 - - - 57 - -
ABSA Bank - 207 - - - 207 - -
Nedb/Perm - 33 - - - 33 - -
Green Start H/Loans - 35 - - - 35 - -
TOTal - 463 - - - 463 - -
ANNEXURE TO THE FINANCIAL STATEMENTS for the year ended 31 March 2016

DEPARTMENT OF ENVIRONMENTAL AFFAIRS ANNUAL REPORT 2015/16225
annExurE 3b
sTaTEMEnT Of COnTingEnT liabiliTiEs as aT 31 MarCh 2016
OpEning balanCE 1 April 2015
liabiliTiEs inCurrEd during ThE yEar
liabiliTiEs paid/CanCEllEd/
rEduCEd during ThE yEar
liabiliTiEs rECOVErablE
(prOVidE dETails hErEundEr)
ClOsing balanCE 31 MarCh 2016
naTurE Of liabiliTy r’000 r’000 r’000 r’000 r’000
Claims against the department
Bhekinstsha Business Enterprises 3 990 - - - 3 990
Bhekinstsha Business Enterprises 2 198 - - - 2 198
Amathole Forestry Co 978 - - - 978
Naledi Office Automation 53 - - - 53
Bhyat Motors 119 - - - 119
Penviro CC 371 - - - 371
Mr Shaun Fairhurst 28 - 28 - -
Mrs SJ Bolger 32 - 32 - -
C Vermeulen 22 - - - 22
Mkati/Siyangaphi 8 - 8 - -
Motoradio Air Touch Cellular 95 - - - 95
JM Skhosana 14 - 14 - -
H Kuhn - 32 - - 32
Morton and Partners - 2 - - 2
TOTal 7 908 34 82 - 7 860
ANNEXURE TO THE FINANCIAL STATEMENTS for the year ended 31 March 2016

226
annExurE 3b (COnTinuEd)
naTurE Of liabiliTiEs rECOVErablE
OpEning balanCE 1 april 2015 dETails Of liabiliTy and rECOVErabiliTy
MOVEMEnT during yEar
ClOsing balanCE 31 MarCh 2016
r’000 r’000 r’000 Bhekinstsha Business Enterprises 3 990 Summons for loss of income due to alleged dishonest/negligent/irregular conduct in respect
of the award of a Tender. The plaintiff appointed new attorney, followed up at state attorney on 11/5/2016 on further progress and feedback is awaited.
- 3 990
Bhekinstsha Business Enterprises 2 198 Claimant is claiming damages in respect of lost income due to alleged tender irregularities. The plaintiff appointed new attorney, followed up at state attorney on 11/5/2016 on further progress and feedback is awaited.
- 2 198
Amathole Forestry Co 978 Claimant is claiming damages due to alleged negligent acts or omissions in relation to veldfire. Counsel briefed and filed an exception. State attorney has advised that Plaintiff’s Attorneys can still not be traced and has suggested we close our file. The matter is thus deemed finalised as at the 30/3/2016.
- 978
Naledi Office Automation 53 A claim for outstanding rental on various Photostat machines.
We have provided them with a reconciliation statement. It appears that most of the machines were not rented to the Department. Liability reduced during the year.
- 53
Bhyat Motors 119 Claim for outstanding rental. Plaintiff’s Attorney acknowledged receipt of the settlement offer; however no response has been forthcoming regarding either acceptance or rejection of offer. Matter has been dormant with no new developments.
- 119
Penviro CC 371 Claim for monies due in terms of a contract. Plaintiff intended to invoke mediation and arbitration clause of the agreement, no steps taken to further the matter against the Department. State attorney has advised their file is closed as at 31/3/2016.
- 371
Mr Shaun Fairhurst 28 Claim for damages resulting from collision between a stationary Honda and an inflatable tube. DG approval received for settlement of the matter. Payment has subsequently been made and at a meeting held at State Attorney offices on 22 February 2016, we were advised the matter is settled.
(28) -
Mrs SJ Bolger 32 Claim for damage sustained to Mercedes-Benz E200 as a result of an oil prevention slick boom which was placed in the lagoon at and blew across Otto Du Plessis Drive. DG approval received for settlement of the matter. Payment has subsequently been made and at a meeting held at State Attorney offices on 22 February 2016, we were advised the matter is settled and finalised.
(32) -
ANNEXURE TO THE FINANCIAL STATEMENTS for the year ended 31 March 2016

DEPARTMENT OF ENVIRONMENTAL AFFAIRS ANNUAL REPORT 2015/16227
naTurE Of liabiliTiEs rECOVErablE
OpEning balanCE 1 april 2015 dETails Of liabiliTy and rECOVErabiliTy
MOVEMEnT during yEar
ClOsing balanCE 31 MarCh 2016
r’000 r’000 r’000C Vermuelen 22 Claim for damages resulting from motor collision. Combined summonses have been issued
against Mr C Vermeulen (defendant) on 23 September 2014. Email was sent to State Attorney on 26 January 2016 to follow up and feedback has not been received.
22
Mkati/Siyangaphi 8 Claim for damages resulting from motor vehicle accident between Mkati and a government official. Matter settled and finalised.
(8) -
Motoradio Air Touch Cellular 95 The plea was drafted and served on the 12 October 2015. The Department’s defence is that the driver of the motor vehicle is not an employee of the Department and the vehicle is also not a part of the Department’s fleet. A follow up was done to establish the outcome of the special plea and we are awaiting feedback.
95
JM Skhosana 14 Claim for damages resulting from motor collision between Mr Skhosana and a government official. Matter settled and finalised.
(14) -
H Kuhn - Claim for damages resulting from motor vehicle accident between H.Kuhn and Government official. A consultation with the official was held and her written statement furnished. A memo is being prepared for the payment of the claim
32 32
Morton and Partners - Payment of unpaid accounts for medical tests rendered by Morton and Partners for DEA employees. Extension granted until 4 April 2016. The issue of legal costs has not yet been canvassed by Plaintiff’s attorneys
2 2
TOTal 7 908 (48) 7 860
ANNEXURE TO THE FINANCIAL STATEMENTS for the year ended 31 March 2016
annExurE 3b (COnTinuEd)

228
annExurE 4
ClaiMs rECOVErablE
COnfirMEd balanCE OuTsTanding
unCOnfirMEd balanCE OuTsTanding TOTal Cash in transit at year end
2015/16*
31/03/2016 31/03/2015 31/03/2016 31/03/2015 31/03/2016 31/03/2015Receipt date
up to six (6) working days
after year endAmount
gOVErnMEnT EnTiTy r’000 r’000 r’000 r’000 r’000 r’000 r’000
dEparTMEnTDepartment of Water Affairs - - - 13 300 - 13 300 -
Gauteng: Provincial Treasury - - - 18 - 18 -
Department of Science and Technology - - - 9 488 - 9 488
Department of Agriculture, Forestry and Fisheries - - 212 - 212 - -
National Research Foundation - - 9 488 - 9 488 - -
TOTal - - 9 700 22 806 9 700 22 806 -
ANNEXURE TO THE FINANCIAL STATEMENTS for the year ended 31 March 2016

DEPARTMENT OF ENVIRONMENTAL AFFAIRS ANNUAL REPORT 2015/16229
annExurE 5
inTEr-gOVErnMEnT payablEs
gOVErnMEnT EnTiTy
COnfirMEd balanCE OuTsTanding
unCOnfirMEd balanCE OuTsTanding TOTal Cash in TransiT aT yEar End
2015/16 *
31/03/2016 31/03/2015 31/03/2016 31/03/2015 31/03/2016 31/03/2015
payMEnT daTE up
TO six (6) wOrking
days bEfOrE yEar End.
aMOunT
r’000 r’000 r’000 r’000 r’000 r’000 r’000dEparTMEnTsCurrent Department of Water & Sanitation - - - 232 - 232
Department of Justice and Constitutional Development 7 013 1 980 - - 7 013 1 980
Department: Government Printing Works 22 62 - - 22 62
South African Police Service (SAPS) - - - 18 - 18
National Prosecuting Authority (NPA) - - - 10 - 10
Department: Performance Monitoring & Evaluation - 266 - - - 266
Gauteng Government (Agriculture & Rural Development) - 26 - - - 26
Western Cape Government (Transport & Public Works) - 82 - - - 82
Department of International Relations and Cooperation - - - 414 - 414
TOTal 7 035 2 416 - 674 7 035 3 090
ANNEXURE TO THE FINANCIAL STATEMENTS for the year ended 31 March 2016

230
annExurE 6
inVEnTOriEs
inVEnTOry [pEr MajOr CaTEgOry]QuanTiTy 2015/16 QuanTiTy 2014/15
note r’000 r’000
Opening balance 30 612 6 094 1 025 162
Add/(Less): Adjustments to prior year balance (9 129) (1 144) 8 256 3 788
Add: Additions/Purchases - Cash 80 154 32 001 33 878 10 234
(Less): Issues (51 268) (26 954) (12 497) (5 287)
Add/(Less): Adjustments 2 379 4 534 (50) (2 803)
ClOsing balanCE 52 748 14 531 30 612 6 094
ANNEXURE TO THE FINANCIAL STATEMENTS for the year ended 31 March 2016

DEPARTMENT OF ENVIRONMENTAL AFFAIRS ANNUAL REPORT 2015/16231
annExurE 7
MOVEMEnT in CapiTal wOrk in prOgrEss
MOVEMEnT in CapiTal wOrk in prOgrEss fOr ThE yEar EndEd 31 MarCh 2016
OpEning balanCE CurrEnT yEar CapiTal wip COMplETEd assETs ClOsing balanCE
r’000 r’000 r’000 r’000
buildings and OThEr fixEd sTruCTurEs 628 318 224 481 (69 294) 783 505Other fixed structures 628 318 224 481 (69 294) 783 505
TOTal 628 318 224 481 (69 294) 783 505
Other fixed structures relate to the EPWP WIP included in transfers to households reclassified as Capital expenditure per Modified Cash Standard requirements.
MOVEMEnT in CapiTal wOrk in prOgrEss fOr ThE yEar EndEd 31 MarCh 2015
OpEning balanCE priOr pEriOd ErrOr
CurrEnT yEar CapiTal wip COMplETEd assETs ClOsing balanCE
r’000 r’000 r’000 r’000 r’000
buildings and OThEr fixEd sTruCTurEs 547 731 (67 963) 202 449 (53 899) 628 318Other fixed structures 547 731 (67 963) 202 449 (53 899) 628 318
TOTal 547 731 (67 963) 202 449 (53 899) 628 318


Call centre: 086 111 2468
E-mail: [email protected]
website: www.environment.gov.za
Private Bag X447
Pretoria
0001
Department of Environmental Affairs
Environment House
473 Steve Biko
Arcadia
Pretoria, 0083
South Africa