Department of Economic Statistics Documents Kristin … · 1 Abstract It is important for the...
20
Documents Kristin Rypdal CO 2 Emission Estimates for Norway. Methodological Difficulties Statistics Norway Department of Economic Statistics 2001/14 November 2001 Documents
Transcript of Department of Economic Statistics Documents Kristin … · 1 Abstract It is important for the...

DocumentsKristin Rypdal
CO2 Emission Estimates forNorway. MethodologicalDifficulties
Statistics NorwayDepartment of Economic Statistics
2001/14 November 2001 Documents

1
Abstract
It is important for the control of greenhouse gas emissions in Europe that countries report accurate and timely statistics on CO2 emissions and that the same data are reported to different international organisations. Norway, as a non-EU member does not report emissions under the EU monitoring mechanism. Norway reports consistent data to the UNFCCC (United Nation Framework Convention on Climate Change) and Eurostat/OECD. However, data reported using the Reference Approach, based on energy inflow, gives very different results from the Sectorial Approach, based on end use of energy. This report reveals that Norway's reporting using the Reference Approach has been based on other energy data than reported by Norway to the IEA (International Energy Agency). In this work the IEA data are used as an input to the Reference Approach. Also key input parameters have been reviewed. After these changes the difference in CO2 estimates between the Reference and Sectorial Approach is reduced, but is still large. Norway has a large upstream oil and gas industry, and small errors in input parameters may have a large effect on the CO2 emission estimates using the Reference Approach. Also the statistical error in the energy balance is rather large for Norway. On the other hand, the statistics on end use of energy is considered to be of high quality, so the confidence in CO2 emissions estimated using the Sectorial Approach is high. Live Tanum Pasnin and Trond Sandmo at Statistics Norway have contributed to this report. The work has been initiated and funded by Eurostat.

2
Contents 1. Introduction ......................................................................................................................... 3 2. Methodology used in Norway............................................................................................ 3 2.1. Administrative system ...................................................................................................................... 3 2.2. Sectorial Approach........................................................................................................................... 4 2.2.1. Methodology................................................................................................................................ 4 2.2.2. Data sources for energy related emissions...................................................................................... 4 2.3. Reference Approach ........................................................................................................................ 5 2.3.1. Methodology................................................................................................................................ 5 2.3.2. Sources of data............................................................................................................................. 6 3. Comparison of various CO2 estimates................................................................................ 8 4. Suggestions for improvements........................................................................................ 10 4.1. Data.............................................................................................................................................. 10 4.2. Reference Approach ...................................................................................................................... 11 4.3. Final conclusions ............................................................................................................................ 11 References.............................................................................................................................. 12 Appendix A. CO2 estimates by the Reference approach 1990, 1998 and 1999. ......................... 13 Recent publications in the series Documents ..................................................................... 19

3
1. Introduction High quality emission data is important for the implementation of the Kyoto protocol and monitoring of emissions in general. CO2 is the most important greenhouse gas. In Norway it accounts for about 75 per cent of the total GWP weighted emissions. Also the growth is high compared to other gases, 20 per cent from 1990 to 1999 (Statistics Norway 2000a). The aim of this report is to demonstrate the consistency of official Norwegian reporting, to explain possible differences and suggest improvements in the statistical system. This report is based on official data reported by Norway in 2000 for the years 1990, 1995 and 1998. Reporting in 2001 is slightly different due to some minor methodological improvements. This does, however, not alter the conclusions made in this report. This report has been prepared as a request from Eurostat.
2. Methodology used in Norway
2.1. Administrative system The national emission inventory is prepared in collaboration between the Norwegian Pollution Control Authority (SFT) and Statistics Norway. Statistics Norway is responsible for the emission inventory system and activity data, while SFT is responsible for emission factors, reported emissions from large plants and inventory improvements in general. The national emission inventory is a multi-pollutant system used for estimating emissions of greenhouse gases, acidifying pollutants and toxic substances. The system is documented in Flugsrud et al. (2000). This system forms the basis for reporting of emissions to air to all international organisations. Statistics Norway has the formal responsibility for reporting to the OECD/Eurostat Joint questionnaire. Statistics Norway also has the responsibility for reporting energy data to Eurostat and the International Energy Agency (IEA). The Ministry of Environment has the responsibility for reporting to the UNFCCC (United Nations Framework Convention on Climate Change). However, Statistics Norway is filling in the CRF (Common Reporting Format). This system ensures that the same data are reported to all international organisations. Norway, as a non-EU member, does not report to the EU Monitoring Mechanism Decision. Differences in published emission data may, however, still occur. This is because reported data often are recalculated at a later stage, due to improvements in data and methodologies. For example is the total CO2 emission estimate for 1998 as reported in 2001 41.4 Gg, compared to 41.7 reported in 2000. The difference is due to methodological improvements. This means that discrepancies between emission figures apparently can be present when data from different publications are compared. The basic methodology used in the national inventory system equals the IPCC Sectorial Approach (IPCC = Intergovernmental Panel on Climate Change). The methodology is described below (Section 2.2). Countries are in addition required to use the Reference Approach for reporting to UNFCCC. This methodology is explained in Section 2.3.

4
2.2. Sectorial Approach
2.2.1. Methodology The Sectorial Approach is recommended in IPCC (1997) for estimating emissions of CO2. The Norwegian national methodology is in accordance with this methodology at level 2/level 3. The starting point is the total consumption of various types of energy commodities. This consumption is distributed between sectors (end users) and appliances. Note that this distribution is not actually necessary for estimating emissions of CO2. Such distribution is, however, necessary for estimating emissions of other pollutants. It is also crucial in order to analyse emissions (e.g. why they are changing and possible measures). Consumption of fuels where carbon is stored is subtracted. The most important example is fractions of gas used as a feedstock in the production of plastic and methanol. Emissions are estimated by multiplying the fuel use with appropriate emission factors reflecting the carbon content. Also indirect emissions of CO2 are estimated. These are from oxidation of NMVOCs and methane (CH4). This is also according to the Revised 1996 Guidelines which state that gross emissions should be counted, not "end of pipe". Net CO2 emissions from use of biomass are not counted (according to the Revised 1996 Guidelines). Norway has a large metallurgical industry. Emissions from use of coal and coke as reducing agents are accounted for as process emissions and not energy. This is according to IPCC Good Practice (IPCC 2000). CO2 emissions from non-energy sources are added. Most important is CO2 from cement production. This estimate is based on the production of clinker and national emission factors. Again this is according to the Revised 1996 Guidelines. Also emissions from use of lime in agriculture and industry are estimated.
2.2.2. Data sources for energy related emissions The data sources used to determine the consumption differs between the various energy commodities. The data are shown in Table 1 and the CO2 emission factors (with source of information) in Table 2.
Natural gas Consumption of natural gas as a fuel gas in the extraction sector is reported from the Norwegian Petroleum Directorate. These data are based on reports from each field operator and is reviewed in detail as the CO2 taxation is based on the same data. Consumption in the manufacturing industries is reported to Statistics Norway by the plants. In addition some minor figures for use outside the manufacturing industries are reported from a distributor.
Petroleum products Statistics Norway, in co-operation with the Norwegian Petroleum Industry Association, produces an annual sales statistics for petroleum products, based on reports from the oil companies. The statistics is corrected for direct import by consumers. Due to the rather small market in Norway, the statistics is considered accurate.
Coal and coke Coal and coke in Norway are almost entirely used by large industrial plants, and mostly as reducing agents. The total consumption is based on reports to Statistics Norway from the plants using coal and coke. Consumption in residences and agriculture (a small amount only) is based on information from importers, users and sales figures from Norway's only coal producing company. As the main consumers are well identified and report high quality data, the final consumption is considered to be rather accurately determined.

5
Table 1. Energy used in emission calculations and in the energy accounts in 1998. PJ. Explanation of discrepancies
Total Combustion Non-energy use Emission Energy Emission Energy Emission Energy
calculations accounts calculations accounts calculations accounts Total 1194.4 1301.4 548.8 554.0 645.6 747.5 Coal/coke 47.2 60.5 7.5 8.2 39.7 52.3 Wood, waste etc. 53.6 54.0 53.6 54.0 - 0.0 Petroleum products 1) 281.6 329.1 281.6 286.6 - 42.6 Gas 2) 213.8 259.6 206.1 205.2 7.7 54.4 Crude oil 598.2 598.2 - - 598.2 598.2 1) Gasoline, kerosene, middle distillates, heavy fuel oil, waste oil 2) Including LPG COMMENTS: Combustion: Coal/coke: Deviation because coal coke used at one metal plant has been registered as non-energy use in the emission calculations Wood, waste etc.: Deviation because of different figures for waste in district heating production Petroleum products: Deviation because of different figures for air transport (differences in definition of what is included) Gas: Deviation because flaring at one plant is not included in the energy accounts Non-energy use: Coal/coke: In addition comes 175002 tons prebaked anodes and 313420 tons coal electrodes used for the emission calculations. Table 2. CO2 emission factors used in the national emission inventory Energy commodity Emission factor
(tonne CO2/tonne energy)
Emission factor (tonne CO2/TJ
energy)
Source of information
Coal1 2.422 86.1 Contact with main consumers Coke 3.19 111.9 Based on typical carbon content Petrol coke 3.59 102.6 Based on typical carbon content Wood 0.0 0.0 Renewable Gasoline 3.13 71.3 Information from oil distribution companies on typical carbon content Kerosene 3.15 73.1 Information from oil distribution companies on typical carbon content Diesel 3.17 73.5 Information from oil distribution companies on typical carbon content Light fuel oil 3.17 73.5 Information from oil distribution companies on typical carbon content Heavy distillates 3.17 73.5 Information from oil distribution companies on typical carbon content Heavy fuel oil 3.20 78.8 Information from oil distribution companies on typical carbon content Waste oil 3.20 78.8 Assumed equal to heavy fuel oil LPG 3.00 65.1 Information from oil distribution companies on typical carbon content Natural gas/LNG 2.753 57.34 Based on typical carbon content 1 Hard coal only is in use in Norway 2 Emission factor is revised to 2.52 tonnes/tonne for use in the 2002 reporting. Individual factors for use in the cement industry. 3 2.34 tonnes/kSm3 4 Value is updated annually according to annual average energy content.
2.3. Reference Approach
2.3.1. Methodology The Sectorial Approach is based on the end use of energy. The Reference Approach is, on the other hand, based on primary use of energy (import and export of all energy and production of primary energy). If energy statistics were without errors, the corresponding CO2 estimates would have been equal. The Reference Approach does not follow the fuels to the actual end use and makes general assumptions about storage etc. The Reference Approach is based on the apparent consumption of fuels (IPCC 1997). The apparent consumption is defined as import-export + production (primary energy only) of all fuels that may generate CO2 emissions. The fuels to consider are specified in the methodology. The calculation is based on energy data in PJ, while the

6
national Sectorial Approach is using consumption data in tonnes1. The methodology takes into account the carbon content of the fuels and fraction oxidised. The long-term storage is taken into account by using general factors.
2.3.2. Sources of data The Reference Approach is designed to use data reported to the IEA. While Norway formerly has used other sources of data, the IEA data are described here. The IEA data are, however, national data reported by Norway. The data sources used when reporting to IEA differs between the types of energy commodities. For use in the energy balance there is a slightly different grouping.
Crude oil and NGL Production data are data collected by Statistics Norway, except for the fields Teesside and Murchison, where data collected by the Norwegian Petroleum Directorate are used. Export data for crude oil are data produced by Statistics Norway. They are based on the amount of oil loaded from each field. For Teesside, Murchison and the gas terminal at Kårstø2, data from the Norwegian Petroleum Directorate are used. For NGL export data are collected from the Norwegian Petroleum Directorate. Import data are collected from the refineries. Stock change data are estimated from data on production, export, consumption and import. This makes the statistical difference zero by definition3.
Natural gas Production data are based on data collected by Statistics Norway. The production reported to IEA is the saleable amount. Fuel gas is included, but gas flared, injected and vented (and losses) excluded. Dry gas and NGL are excluded. Export data are from the Norwegian Petroleum Directorate.
Other petroleum products Production data are reported to Statistics Norway from the refineries. Export data are data reported to Statistics Norway. Export of LPG from the gas terminal at Kårstø is subtracted as this is accounted for as NGL. It is difficult to identify the correct amount to subtract, and this is a potential source of error. Export of naphtha from the gas terminal at Kårstø is also subtracted, as this is accounted for as crude oil. Import data are taken form the foreign trade statistics. Import of LPG is corrected for export of NGL from Teesside to Norway. Stock change is reported monthly to Statistics Norway from the most important stock holders (refineries and oil companies with terminals for storage).
Coal and coal coke Production of coal is reported from the only producer at Spitsbergen. Coking coal is not produced in Norway. Import and export data of coal and coking coal are taken from the foreign trade statistics in Statistics Norway (based on data from the customs authorities). Stock change is based on data reported from the main consumers and the only producer at Spitsbergen. 1 IPCC (1997) recommends using data in PJ also here, but we consider data in physical units to be more accurate. 2 Kårstø exports condensate in addition to natural gas liquids. 3 Other data are used in the energy balance, giving a quite large statistical error.

7
Figure 1. Production and net export/import of crude oil, natural gas, coal and coke for selected years
Feedstock data Some data are reported to IEA, but the quality of these data can be poor. Consequently, we have used the data from the energy balance (also used in the emission inventory) in the CRF.
0
10000
20000
30000
40000
50000
60000
1990
1991
1992
1993
1994
1995
1996
1997
1998
1999
2000
Mill
. Sm
3
Natural gas Production
Natural gas Net export
0
20000
40000
60000
80000
100000
120000
140000
160000
180000
1990
1991
1992
1993
1994
1995
1996
1997
1998
1999
2000
1000
tonn
es
Crude oil Production
Crude oil Net export
0
100
200
300
400
500
600
700
800
900
1000
1990
1991
1992
1993
1994
1995
1996
1997
1998
1999
2000
1000
tonn
es Coal Produkction
Coal Net import
Coke Production
Coke Net import

8
Other Data on aircraft bunkers reported to IEA is not correct, as it covers the total sales, not sales to international air transport as supposed. The correct data is estimated as total sale subtracted the amount used for domestic air transport (based on surveys).
3. Comparison of various CO2 estimates Various estimates reported from Norway in 2000 are shown in Table 3. As a comparison also data estimated by the IEA are shown. Table 3. CO2 emissions in Norway reported to various international organisations for 1990. Total energy Sectorial Approach and Reference Approach. Million tonnes (Gg). 1990 1995 1998 Change 1990-1998 % Total emissions CRF 35.1 38.2 41.7 18.6 JQ 35.1 38.2 41.7 18.6 Total energy1 CRF 34.1 36.9 40.4 18.5 JQ 34.1 36.9 40.4 18.5 IEA 28.5 32.7 36.9 29.4 Reference Approach CRF2 24.3 (28.7) .. 32.4 (37.6) 33 (31) IEA 28.5 30.4 34.3 20.6 1 Includes emissions from coal and coke used as reducing agents and fraction of gas used as feedstock that is oxidised during the process. 2 Figures in brackets include emissions from metallurgical industry. These were originally subtracted from the Reference Approach to make the output comparable with fuel combustion in the Sectorial Approach. The reported figures of total emissions to UNFCCC (CRF) and Eurostat/OECD (JQ) are exactly the same. The IEA figures for energy are systematically lower than the national figures officially reported. The difference was about 5.6 Gg in 1990 and 3.5 in 1998. This is a quite large discrepancy (about 10 per cent of total emissions). The difference can be explained by items not included in the IEA central estimate (waste combustion (0.1 Gg), indirect emissions from oil and gas (1.9 Gg in 1998) and, perhaps, also the fact that IEA has made general assumptions about the storage that are less exact than those that can be made with exact knowledge. There are also large differences between the Reference Approach and Sectorial Approach for energy. These differences seem to have increased from 1990 to 1998 and may have different explanations as reviewed below.
Statistical errors The statistical errors in the energy balance show the difference between the import, export and production (including transformation) and final consumption. There will in practice always be a statistical error. However, it should be random. If not, it indicates a systematic error in one or more parts of the energy balance. The statistical errors in the Norwegian energy balance (excluding electricity and biomass) are shown in table 4.

9
Table 4. Statistical errors in the Norwegian energy balance. 1990, 1995 and 1998 1990 1995 1998 Total (TJ) -11 34 61 Total (ktonnes) (excluding natural gas) -449 578 498 Coal and coke (ktonnes) -16 1 9 Petroleum products (ktonnes) -11 750 -88 LPG and other gas (ktonnes) 4 85 417 Crude oil (ktonnes) -426 -259 149 Natural gas (mill. Sm3) 225 191 924 * A negative statistical error indicates that the final consumption is larger than the input and vice versa. The statistical error in 1998 is high, corresponding to more than 3.5 million tonnes of CO2. This difference will remain as a difference between the Reference Approach and Sectorial Approach. Note that in the CO2 emissions data from IEA, the statistical error has been distributed between the approaches. That makes them more comparable, but such a distribution is not according to the IPCC 1996 Revised Guidelines (IPCC 1997).
Level of comparison The Reference Approach gives an estimate of CO2 emissions that is not straightforward to compare with the Sectorial Approach. Use of fossil fuels in Norway will end up as CO2 emissions in three main source categories: Combustion (IPCC 1A) fugitive, venting and flaring (IPCC 1B) and reducing agents (IPCC 2C) as illustrated in figure 2. This is in principle the case in all countries, but is more important for Norway than for other countries, due to the large oil and gas sector and the many metal producing plants. For this reason, the amount of gas vented and flared and coal used as a reducing agent is subtracted from the Reference Approach. IEA data includes coal used as a reducing agent, but does that also in the Sectorial Approach. There are some fuels not directly included in the Reference Approach. One is municipal waste combustion (fossil part) emitting about 0.16 million tonnes CO2. Another is use of special types of waste, where waste oil is most important (0.2 million tonnes of CO2). These are accounted for in the energy sector as they are used as fuels. Figure 2. Overview of reporting of emissions from use of fossil fuels
Estimation of storage The Reference Approach methodology has a module where amount of fuels used as a feedstock is entered. The fraction stored is estimated by using factors. These factors as proposed in IPCC (1997) are quite general and may for some products vary from year to year. In Table 5 we have made proposals for changes in "fractions stored" based on the actual use of these products in Norway. Note that for natural gas and LPG these factors are not applicable to the total amount used, but to the fractions used as feedstock. This way of book-keeping is necessary in order to increase the comparability with the Sectorial Approach.
Fossil fuels
Combustion(IPCC 1A)
Flaring, venting, fugitive
(IPCC 1B)
Reducing agents(IPCC 2C)

10
Also note that in order to make the Reference Approach comparable to the Sectorial Approach as they are compared in the CRF, fuels oxidised during industrial processes are assumed "stored". Due to the industrial structure of Norway these are large amounts of coal, coke and gas. The new values in Table 5 are, consequently, not directly comparable with those initially used, as the latter values are applicable to the total consumption. Due to the large amount of fuel used for industrial processes in Norway, use of such general factors gives misleading results. Table 5. Fractions stored Initially
assumed stored
New value
Naphta 0.8 1.00 Lubricants 0.5 1.00 Bitumen 1.00 1.00 Natural gas 1.00 1.00 LPG 0.77 1.00 Other bituminous coal 1.00 1.00 Coke oven coke 1.00 1.00 Petroleum coke 1.00 1.00
Crude oil emission factor The apparent consumption of crude oil was more than 44 Gg in 1998, this is more than the total emissions. The corresponding emission factor is however of poor quality as it does not enter the estimation in the Sectorial Approach. We have now reviewed this factor by contacting the main refinery in Norway. The refineries do not monitor the carbon content of crude oil, but they have some literature values. The carbon content can vary from 83 to 87 %, a typical value for North Sea oil can be about 86 %4. With a lower heating value of 42.3 MJ/kg this gives a carbon emission factor of 20.33 tonnes C/TJ oil. This is only 1.6 % different from the IPCC default, but with the high apparent consumption of crude oil in Norway this corresponds to about 0.7 million tonnes of CO2.
The energy data used In general we have more confidence in the energy data used for the Sectorial Approach. The data on production, import and export are probably of high quality, but obviously small uncertainties in these data can have large effects in a country exporting most of its production of oil and gas. The complexity of the oil and gas industry in Norway also indicates a high risk of some double counting of products.
Other There may be confusion whether the natural gas figures given are based on net or gross calorific values. We have used the gross calorific value, while IEA is using the net. However, as long as the national emission factors is converted from its original unit using the same reference value for energy content, this should not be problematic.
4. Suggestions for improvements Improvements can mainly be found concerning the Reference Approach. It is a goal to identify discrepancies both with the IEA data and the Reference Approach.
4.1. Data Statistics Norway has recently worked to improve the reporting of energy data to IEA. Revisions have mainly been made for the primary petroleum products (crude oil, NGL and natural gas).
4 Kjartan Sletten, Statoil, personal communication based on J.G. Speight: "The Chemistry and Technology of Petroleum").

11
Crude oil and NGL Production data will from 2001 be based on data collected by the Norwegian Petroleum Directorate. These are accurate data based on the amount sold from each field, corrected for stock change. Stock change data are from 2000 based on data from the Norwegian Petroleum Directorate. The stock is measured at the terminals each month. This means that the statistical difference can be estimated independently. This difference will occur due to delay in loading to ships, re-loading at the terminals at the end of the month and uncertainties in the stock estimates. It should, however, be averaged to zero from year to year.
Natural gas From 2001 production data are taken from the Norwegian Petroleum Directorate. Fuel gas consumption is added to the net production, and is also based on reports from each field.
4.2. Reference Approach Some suggested changes in the Reference Approach were mentioned in chapter 3. These include • changes in crude oil emission factor • consequent use of IEA energy data • use of the same feedstock data as in the Sectorial Approach, rather then using the IPCC (1996) default
fractions for storage The changes suggested in this report have lead to changes in the national implementation of the Reference Approach, and consequently also the results. The new results are displayed in Table 6. The Reference Approach has also been updated to 1999. The difference between the national Sectorial and Reference Approaches is still rather high, especially in 1999. However, the estimates are based on a consistent methodology and assumptions. The large difference in 1999 can have been caused by revisions in statistics as explained above. Table 6. Comparison between various approaches. Updated Reference Approach. 1990, 1998 and 1999. Gg. Change in %. Deviation in % 1990 1998 1999 90-98 90-99 National Sectorial Approach 26.4 31.6 31.7 20 20 National Reference Approach 25.9 31.7 34.1 22 32 Deviation (%) -3 +0.3 +7.6 -4 pp -13 pp IEA Sectorial Approach 28.5 36.9 38.2 29 34 IEA Reference Approach 28.5 34.3 37.1 21 30 Deviation - -7 -3 8 pp 4 pp
4.3. Final conclusions The Reference Approach is proposed as verification of national estimates based on the Sectorial Approach. Norway meets larger difficulties using the Reference Approach than most other countries. The main reason for this is the large oil and gas sector. Small errors in data and conversion factors may have large effects on the output. Norway also has large amounts of fuel used for industrial processes. This causes problems for comparisons with the Sectorial Approach. There are also notable differences between CO2 estimates made by IEA and Statistics Norway. This can be explained by the fact that IEA is using the default IPCC emission factors and assumptions about carbon stored while Statistics Norway is utilising more actual information. IEA is also distributing the statistical error between the Sectorial and Reference Approach. Also estimated growth rates differ between the approaches. This can be
12
due to the fact that energy data have been revised throughout the period. In the national Sectorial Approach such changes are always made back to 1990 for the reason of consistency. This project has allowed us to harmonise energy data used in the Reference Approach with those used by the IEA. However, the large statistical error in the energy data reported by Norway indicates that there are still potential for improvements.
References Flugsrud, K., E. Gjerald, G. Haakonsen, S. Holtskog, H. Høie, K. Rypdal, B. Tornsjø and F. Weidemann (2000): The Norwegian Emission Inventory. Documentation of methodology and data for estimating emissions of greenhouse gases and long-range transboundary air pollutants. Reports 2000/1. Statistics Norway.
IPCC (1997): Greenhouse gas inventories. Revised 1996 Guidelines for National Greenhouse Gas Inventories. Intergovernmental Panel on Climate Change.
IPCC (2000): Good Practice Guidance and Uncertainty Management in National Greenhouse Gas Inventories (J. Penman et al., eds.). IPCC National Greenhouse Gas Inventories Programme, Technical Support Unit, Hayama, Japan.
SFT (2000): Greenhouse Gas Emissions in Norway. 1990-1998. Report 1742. Norwegian Pollution Control Authority.
SFT (2001): Greenhouse Gas Emissions in Norway. 1990-1999. Report 1801. Norwegian Pollution Control Authority.
Statistics Norway (2000a): Natural resources and the environment 2000. Norway. Statistical analyses 37. Statistics Norway.
Statistics Norway (2000b): Energy statistics (Energistatistikk) 1998. NOS C 595. Statistics Norway.

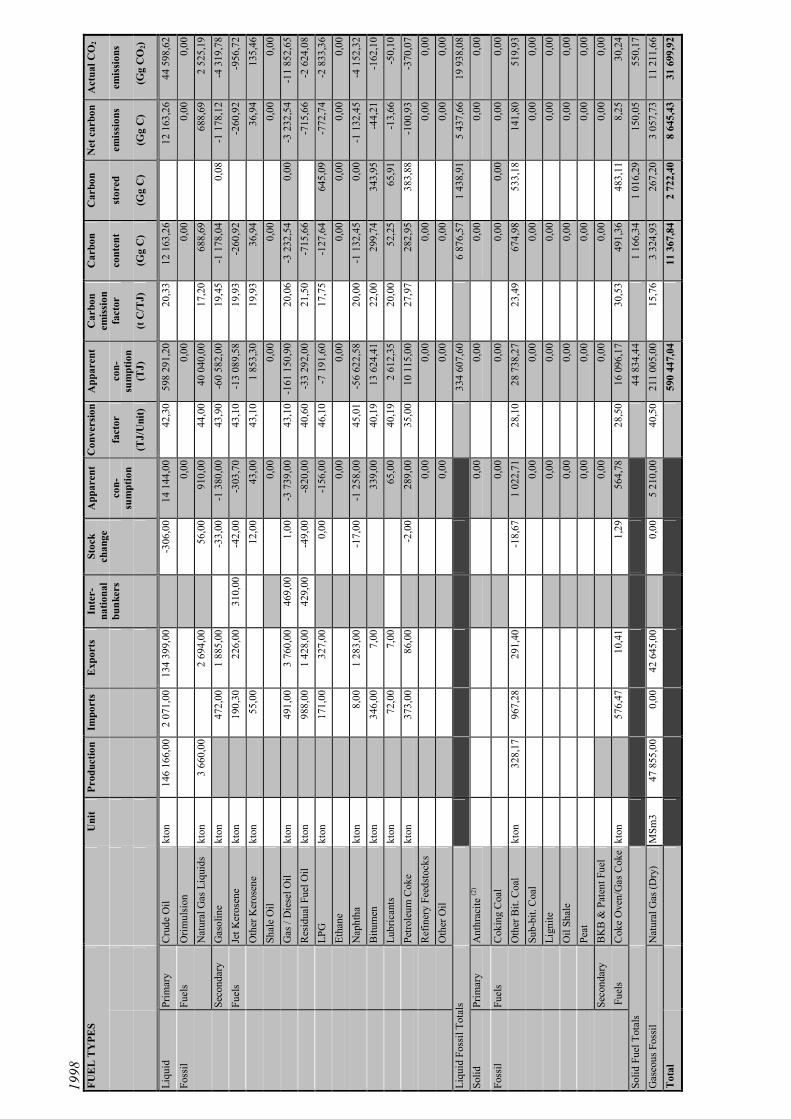
App
endi
x A
. CO
CO
CO
CO
2 222 e
stim
ates
by
the
Re
est
imat
es b
y th
e R
e e
stim
ates
by
the
Re
est
imat
es b
y th
e R
efe
ren
ce a
pp
roac
h 1
990, 1
998 a
nd
1999.
fere
nce
ap
pro
ach
1990, 1
998 a
nd
1999.
fere
nce
ap
pro
ach
1990, 1
998 a
nd
1999.
fere
nce
ap
pro
ach
1990, 1
998 a
nd
1999.
Feed
stock
and
non
-ene
rgy
use
of fu
els
1990
A
CTI
VIT
Y D
ATA
AN
D R
ELA
TED
IN
FOR
MA
TIO
N
IMPL
IED
EM
ISSI
ON
FA
CTO
R
EST
IMA
TE
FUE
L T
YPE
Fu
el q
uant
ity
Fr
actio
n of
ca
rbon
stor
ed
Car
bon
emis
sion
fact
or
of
car
bon
stor
ed in
no
n-en
ergy
use
of f
uels
(T
J)
(t
C/T
J)
(Gg
C)
Nap
htha
(2)
5 79
4,80
1,
00
20,0
0 11
5,90
Lubr
ican
ts
4 40
4,74
1,
00
20,0
0 88
,09
Bitu
men
14
815
,20
1,00
22
,00
325,
93C
oal O
ils a
nd T
ars
0,00
0,00
N
atur
al G
as(2
) 0,
00
1,00
0,
00
0,00
Gas
/Die
sel O
il (2
) 0,
00
0,00
0,
00
0,00
LPG
(2)
47 1
14,2
0 1,
00
12,9
4 60
9,55
But
ane
(2)
0,00
0,00
Et
hane
(2)
0,00
0,00
O
ther
(ple
ase
spec
ify)*
Oth
er b
it. c
oal
16 7
13,6
0 1,
00
23,4
9 39
2,56
Cok
e O
ven
13 8
75,4
0 1,
00
30,5
3 42
3,57
Petro
leum
Cok
e 14
122
,43
1,00
27
,97
395,
06G
asol
ine
0,00
1,
00
0,00
0,
00
13

1998
A
CTI
VIT
Y D
ATA
AN
D R
ELA
TED
IN
FOR
MA
TIO
N
IMPL
IED
EM
ISSI
ON
FA
CTO
R
EST
IMA
TE
FUE
L T
YPE
Fu
el q
uant
ity
Frac
tion
of
ca
rbon
stor
ed
Car
bon
emis
sion
fact
or
of
car
bon
stor
ed in
no
n-en
ergy
use
of f
uels
(T
J)
(t
C/T
J)
(Gg
C)
Nap
htha
(2)
0,00
1,
000,
000,
00Lu
bric
ants
3
295,
58
1,00
20,0
065
,91
Bitu
men
15
633
,91
1,00
22,0
034
3,95
Coa
l Oils
and
Tar
s 0,
00
0,00
Nat
ural
Gas
(2)
16 9
57,0
0 1,
0015
,76
267,
20G
as/D
iese
l Oil
(2)
125,
00
1,00
0,00
0,00
LPG
(2)
36 3
45,0
0 1,
0017
,75
645,
09B
utan
e (2
) 0,
00
0,00
Etha
ne (2
) 14
8,00
1,
000,
000,
00O
ther
(ple
ase
spec
ify)*
whi
te sp
irit
20,0
0 0,
000,
00O
ther
bit.
coa
l 22
701
,00
1,00
23,4
953
3,18
Cok
e O
ven
15 8
26,0
0 1,
0030
,53
483,
11Pe
trole
um C
oke
13 7
23,0
0 1,
0027
,97
383,
88R
esid
ual F
uel O
il 65
0,00
1,
0021
,50
13,9
7263
636
Ker
osen
e 28
3,00
1,
0019
,93
5,64
Gas
olin
e 4,
00
1,00
19,4
50,
08
14

1999
A
CTI
VIT
Y D
ATA
AN
D R
ELA
TED
IN
FOR
MA
TIO
N
IMPL
IED
EM
ISSI
ON
FA
CTO
R
EST
IMA
TE
FUE
L T
YPE
Fu
el q
uant
ity
Frac
tion
of
ca
rbon
stor
ed
Car
bon
emis
sion
fact
or
of
car
bon
stor
ed in
no
n-en
ergy
use
of f
uels
(T
J)
(t
C/T
J)
(Gg
C)
Nap
htha
(2)
0,00
1,
000,
000,
00Lu
bric
ants
3
295,
58
1,00
20,0
065
,91
Bitu
men
14
508
,59
1,00
22,0
031
9,19
Coa
l Oils
and
Tar
s 0,
00
0,00
Nat
ural
Gas
(2)
18 7
11,0
0 1,
0015
,76
294,
84G
as/D
iese
l Oil
(2)
125,
00
1,00
20,0
62,
51LP
G (2
) 33
560
,80
1,00
17,7
559
5,67
But
ane
(2)
0,00
0,
00Et
hane
(2)
111,
00
1,00
0,00
0,00
Oth
er (p
leas
e sp
ecify
)*
R
esid
ual f
uel o
il 65
0,00
1,
0021
,50
13,9
7K
eros
ene
272,
00
1,00
19,9
35,
42W
hite
spiri
t 19
,00
1,00
0,00
0,00
Oth
er b
it. c
oal
22 2
27,0
0 1,
0023
,49
522,
05C
oke
Ove
n 14
718
,00
1,00
30,5
344
9,29
Petro
leum
Cok
e 13
880
,00
1,00
27,9
738
8,27
Gas
olin
e 13
,00
1,00
19,4
50,
25
15

Est
imat
es o
f CO
2 em
issio
ns
1
990
FUE
L T
YPE
S
Uni
t Pr
od-
uctio
n Im
port
s E
xpor
ts
Inte
r-na
tiona
l St
ock
chan
ge
App
aren
t C
onve
rsio
n A
ppar
ent
Car
bon
emis
sion
C
arbo
n
Car
bon
N
et c
arbo
n A
ctua
l CO
2
bu
nker
s
cons
umpt
ion
fact
or
cons
umpt
ion
fact
or
cont
ent
stor
ed
emis
sion
s em
issi
ons
(TJ/
Uni
t) (T
J)
(t C
/TJ)
(G
g C
) (G
g C
) (G
g C
)
(Gg
CO
2)
Liqu
id
Prim
ary
C
rude
Oil
kton
79
663
,00
1 44
4,00
66 6
02,0
0
1 78
6,00
12
719
,00
42,3
0 53
8 01
3,70
20,4
4 10
997
,00
10
997
,00
40 3
22,3
3
Foss
il Fu
els
Orim
ulsi
on
0,
00
0,
00
0,00
0,
00
0,00
Nat
ural
Gas
Liq
uids
kt
on
2 42
5,00
1
464,
00
38
,00
923,
00
44,0
0 40
612
,00
17,2
0 69
8,53
69
8,53
2
561,
26
Se
cond
ary
G
asol
ine
kton
501,
001
717,
00
20
,00
-1 2
36,0
0 43
,90
-54
260,
4019
,45
-1 0
55,1
20,
00
-1 0
55,1
2 -3
868
,77
Fue
ls Je
t Ker
osen
e kt
on
86
,00
412,
00
192,
00
8,00
-5
26,0
0 43
,10
-22
670,
6019
,93
-451
,91
-4
51,9
1 -1
656
,99
O
ther
Ker
osen
e kt
on
15
,00
0,00
4,00
11
,00
43,1
0 47
4,10
19,9
3 9,
45
9,45
34
,65
S
hale
Oil
0,
00
0,
00
0,00
0,
00
0,00
Gas
/ D
iese
l Oil
kton
827,
003
609,
00
218,
00
4,00
-3
004
,00
43,1
0 -1
29 4
72,4
020
,06
-2 5
97,1
00,
00
-2 5
97,1
0 -9
522
,70
R
esid
ual F
uel O
il kt
on
59
2,00
972,
00
232,
00
-39,
00
-573
,00
40,6
0 -2
3 26
3,80
21,5
0 -5
00,0
9
-500
,09
-1 8
33,6
5
LPG
kt
on
12
9,00
226,
00
-6
,00
-91,
00
46,1
0 -4
195
,10
17,7
5 -7
4,46
609,
55
-684
,00
-2 5
08,0
2
Eth
ane
0,
00
0,
00
0,00
0,00
0,
00
0,00
Nap
htha
kt
on
13
2,00
677,
00
-3
2,00
-5
13,0
0 45
,01
-23
090,
1320
,00
-461
,80
115,
90
-577
,70
-2 1
18,2
3
Bitu
men
kt
on
22
8,00
9,00
20,0
0 19
9,00
40
,19
7 99
7,81
22,0
0 17
5,95
325,
93
-149
,98
-549
,94
L
ubric
ants
kt
on
75
,00
3,00
7,00
65
,00
40,1
9 2
612,
3520
,00
52,2
588
,09
-35,
85
-131
,44
P
etro
leum
Cok
e kt
on
36
6,00
114,
00
3,
00
249,
00
35,0
0 8
715,
0027
,97
243,
7939
5,06
-1
51,2
7 -5
54,6
4
Ref
iner
y Fe
edst
ocks
0,00
0,00
0,
00
0,00
0,
00
O
ther
Oil
37,0
013
,00
-3
,00
27,0
0
0,00
0,
00
0,00
0,
00
Liqu
id F
ossi
l Tot
als
341
472,
53
7 03
6,49
1 53
4,53
5
501,
97
20 1
73,8
8 So
lid
Prim
ary
A
nthr
acite
(2)
0,
00
0,
00
0,00
0,
00
0,00
Foss
il Fu
els
Cok
ing
Coa
l
0,00
0,00
0,
000,
00
0,00
0,
00
O
ther
Bit.
Coa
l kt
on
303,
00
713,
0025
4,00
13,0
0 74
9,00
28
,10
21 0
46,9
023
,49
494,
3339
2,56
10
1,78
37
3,18
Sub
-bit.
Coa
l
0,00
0,00
0,
00
0,00
0,
00
L
igni
te
0,
00
0,
00
0,00
0,
00
0,00
Oil
Shal
e
0,00
0,00
0,
00
0,00
0,
00
P
eat
0,
00
0,
00
0,00
0,
00
0,00
S
econ
dary
B
KB
& P
aten
t Fue
l
0,00
0,00
0,
00
0,00
0,
00
Fue
ls C
oke
Ove
n/G
as C
oke
kton
534,
005,
00
15
,00
514,
00
28,5
0 14
649
,00
30,5
3 44
7,18
423,
57
23,6
2 86
,59
Solid
Fue
l Tot
als
35 6
95,9
0
941,
5181
6,12
12
5,39
45
9,77
G
aseo
us F
ossi
l N
atur
al G
as (D
ry)
MSm
3 27
642
,00
25 3
80,0
0
0,00
2
262,
00
40,5
0 91
611
,00
15,7
6 1
443,
570,
00
1 44
3,57
5
293,
08
Tot
al
46
8 77
9,43
9
421,
582
350,
65
7 07
0,93
25
926
,73
1998
FU
EL
TY
PES
U
nit
Prod
uctio
nIm
port
s E
xpor
ts
Inte
r-na
tiona
l St
ock
chan
ge
App
aren
t C
onve
rsio
n A
ppar
ent
Car
bon
emis
sion
C
arbo
n
Car
bon
N
et c
arbo
n A
ctua
l CO
2
bu
nker
s
con-
sum
ptio
n fa
ctor
co
n-su
mpt
ion
fact
or
cont
ent
stor
ed
emis
sion
s em
issi
ons
(TJ/
Uni
t) (T
J)
(t C
/TJ)
(G
g C
) (G
g C
) (G
g C
)
(Gg
CO
2)
Liqu
id
Prim
ary
C
rude
Oil
kton
14
6 16
6,00
2
071,
00
134
399,
00
-3
06,0
014
144
,00
42,3
0 59
8 29
1,20
20,3
3 12
163
,26
12 1
63,2
6 44
598
,62
Foss
il Fu
els
Orim
ulsi
on
0,
00
0,
00
0,00
0,
00
0,00
Nat
ural
Gas
Liq
uids
kt
on
3 66
0,00
2 69
4,00
56,0
091
0,00
44
,00
40 0
40,0
017
,20
688,
69
688,
69
2 52
5,19
Seco
ndar
y
Gas
olin
e kt
on
47
2,00
1
885,
00
-3
3,00
-1 3
80,0
0 43
,90
-60
582,
0019
,45
-1 1
78,0
4 0,
08-1
178
,12
-4 3
19,7
8 F
uels
Jet K
eros
ene
kton
190,
30
226,
00
310,
00
-42,
00-3
03,7
0 43
,10
-13
089,
5819
,93
-260
,92
-260
,92
-956
,72
O
ther
Ker
osen
e kt
on
55
,00
12,0
043
,00
43,1
0 1
853,
3019
,93
36,9
4 36
,94
135,
46
S
hale
Oil
0,
00
0,
00
0,00
0,
00
0,00
Gas
/ D
iese
l Oil
kton
491,
00
3 76
0,00
46
9,00
1,
00-3
739
,00
43,1
0 -1
61 1
50,9
020
,06
-3 2
32,5
4 0,
00-3
232
,54
-11
852,
65
R
esid
ual F
uel O
il kt
on
98
8,00
1
428,
00
429,
00
-49,
00-8
20,0
0 40
,60
-33
292,
0021
,50
-715
,66
-715
,66
-2 6
24,0
8
LPG
kt
on
17
1,00
32
7,00
0,00
-156
,00
46,1
0 -7
191
,60
17,7
5 -1
27,6
4 64
5,09
-772
,74
-2 8
33,3
6
Eth
ane
0,
00
0,
00
0,00
0,
000,
00
0,00
Nap
htha
kt
on
8,
00
1 28
3,00
-17,
00-1
258
,00
45,0
1 -5
6 62
2,58
20,0
0 -1
132
,45
0,00
-1 1
32,4
5 -4
152
,32
B
itum
en
kton
346,
00
7,00
339,
00
40,1
9 13
624
,41
22,0
0 29
9,74
34
3,95
-44,
21
-162
,10
L
ubric
ants
kt
on
72
,00
7,00
65,0
0 40
,19
2 61
2,35
20,0
0 52
,25
65,9
1-1
3,66
-5
0,10
Pet
role
um C
oke
kton
373,
00
86,0
0
-2,0
028
9,00
35
,00
10 1
15,0
027
,97
282,
95
383,
88-1
00,9
3 -3
70,0
7
Ref
iner
y Fe
edst
ocks
0,00
0,00
0,
00
0,00
0,
00
O
ther
Oil
0,
00
0,
00
0,00
0,
00
0,00
Li
quid
Fos
sil T
otal
s
33
4 60
7,60
6
876,
57
1 43
8,91
5 43
7,66
19
938
,08
Solid
Pr
imar
y
Ant
hrac
ite (2
)
0,00
0,00
0,
00
0,00
0,
00
Foss
il Fu
els
Cok
ing
Coa
l
0,00
0,00
0,
00
0,00
0,00
0,
00
O
ther
Bit.
Coa
l kt
on
328,
17
967,
28
291,
40
-1
8,67
1 02
2,71
28
,10
28 7
38,2
723
,49
674,
98
533,
1814
1,80
51
9,93
Sub
-bit.
Coa
l
0,00
0,00
0,
00
0,00
0,
00
L
igni
te
0,
00
0,
00
0,00
0,
00
0,00
Oil
Shal
e
0,00
0,00
0,
00
0,00
0,
00
P
eat
0,
00
0,
00
0,00
0,
00
0,00
S
econ
dary
B
KB
& P
aten
t Fue
l
0,00
0,00
0,
00
0,00
0,
00
Fue
ls C
oke
Ove
n/G
as C
oke
kton
576,
47
10,4
1
1,29
564,
78
28,5
0 16
096
,17
30,5
3 49
1,36
48
3,11
8,25
30
,24
Solid
Fue
l Tot
als
44 8
34,4
4
1 16
6,34
1
016,
2915
0,05
55
0,17
G
aseo
us F
ossi
l N
atur
al G
as (D
ry)
MSm
3 47
855
,00
0,00
42
645
,00
0,
005
210,
00
40,5
0 21
1 00
5,00
15,7
6 3
324,
93
267,
203
057,
73
11 2
11,6
6 T
otal
590
447,
04
11 3
67,8
4 2
722,
408
645,
43
31 6
99,9
2

199
9 FU
EL
TY
PES
U
nit
Prod
uctio
nIm
port
s E
xpor
ts
Inte
r-na
tiona
l St
ock
chan
ge
App
aren
t C
onve
rsio
n A
ppar
ent
Car
bon
emis
sion
C
arbo
n
Car
bon
N
et c
arbo
n A
ctua
l CO
2
bu
nker
s
con-
sum
ptio
n fa
ctor
co
nsum
ptio
n fa
ctor
co
nten
t st
ored
em
issi
ons
emis
sion
s
(TJ/
Uni
t) (T
J)
(t C
/TJ)
(G
g C
) (G
g C
) (G
g C
)
(Gg
CO
2)
Liqu
id
Prim
ary
C
rude
Oil
kton
14
5 84
3,00
2
085,
00
133
520,
00
80
,00
14 3
28,0
0 42
,30
606
074,
40
20,3
3 12
321
,49
12
321
,49
45 1
78,8
1
Foss
il Fu
els
Orim
ulsi
on
0,
00
0,00
0,00
0,
000,
00
Nat
ural
Gas
Liq
uids
kt
on
3 50
7,00
2 80
3,00
-25,
0072
9,00
44
,00
32 0
76,0
0 17
,20
551,
71
551,
712
022,
93
Seco
ndar
y
Gas
olin
e kt
on
34
1,00
1
840,
00
15
,00
-1 5
14,0
0 43
,90
-66
464,
60
19,4
5 -1
292
,43
0,25
-1
292
,69
-4 7
39,8
5 F
uels
Jet K
eros
ene
kton
216,
00
200,
00
310,
00
18,0
0-3
12,0
0 43
,10
-13
447,
20
19,9
3 -2
68,0
5
-268
,05
-982
,86
O
ther
Ker
osen
e kt
on
67
,00
15,0
052
,00
43,1
02
241,
20
19,9
3 44
,68
44
,68
163,
81
Sha
le O
il
0,00
0,
00
0,
00
0,00
0,00
G
as /
Die
sel O
il kt
on
38
9,00
3
484,
00
467,
00
-153
,00
-3 4
09,0
0 43
,10
-146
927
,90
20,0
6 -2
947
,24
2,51
-2
949
,75
-10
815,
74
Res
idua
l Fue
l Oil
kton
1 16
4,00
1
638,
00
391,
00
26,0
0-8
91,0
0 40
,60
-36
174,
60
21,5
0 -7
77,6
2
-777
,62
-2 8
51,2
8
LPG
kt
on
10
8,00
32
4,00
2,00
-218
,00
46,1
0-1
0 04
9,80
17
,75
-178
,37
595,
67
-774
,05
-2 8
38,1
8
Eth
ane
0,
00
46,0
00,
00
20,0
0 0,
000,
00
0,00
0,00
N
apht
ha
kton
63,0
0 89
2,00
38,0
0-8
67,0
0 45
,01
-39
023,
67
20,0
0 -7
80,4
70,
00
-780
,47
-2 8
61,7
4
Bitu
men
kt
on
30
7,00
30
7,00
40
,19
12 3
38,3
3 22
,00
271,
4431
9,19
-4
7,75
-175
,07
L
ubric
ants
kt
on
80
,00
12,0
0
68,0
0 40
,19
2 73
2,92
20
,00
54,6
665
,91
-11,
25-4
1,26
P
etro
leum
Cok
e kt
on
39
1,00
43
,00
-7
,00
355,
00
35,0
012
425
,00
27,9
7 34
7,57
388,
27
-40,
70-1
49,2
4
Ref
iner
y Fe
edst
ocks
0,00
0,
00
0,
00
0,00
0,00
O
ther
Oil
84,0
0 4,
00
80
,00
0,00
0,00
0,
000,
00Li
quid
Fos
sil T
otal
s
355
800,
08
7
347,
351
371,
81
5 97
5,54
21 9
10,3
3So
lid
Prim
ary
A
nthr
acite
(2)
0,
00
0,00
0,00
0,
000,
00
Foss
il Fu
els
Cok
ing
Coa
l
0,00
0,
00
0,
000,
00
0,00
0,00
O
ther
Bit.
Coa
l kt
on
398,
56
914,
44
287,
71
-1
8,70
1 04
3,98
28
,10
29 3
35,7
2 23
,49
689,
0252
2,05
16
6,96
612,
20
Sub
-bit.
Coa
l
0,00
0,
00
0,
00
0,00
0,00
L
igni
te
0,
00
0,00
0,00
0,
000,
00
Oil
Shal
e
0,00
0,
00
0,
00
0,00
0,00
P
eat
0,
00
0,00
0,00
0,
000,
00 S
econ
dary
B
KB
& P
aten
t Fue
l
0,00
0,
00
0,
00
0,00
0,00
Fue
ls C
oke
Ove
n/G
as C
oke
kton
524,
31
6,31
-7,4
852
5,47
28
,50
14 9
76,0
1 30
,53
457,
1644
9,29
7,
8828
,88
Solid
Fue
l Tot
als
44
311
,73
1
146,
1897
1,34
17
4,84
641,
08G
aseo
us F
ossi
l N
atur
al G
as (D
ry)
MSm
3 50
904
,00
0,00
45
499
,00
0,
005
405,
00
40,3
021
7 82
1,50
15
,84
3 44
9,37
294,
84
3 15
4,53
11 5
66,6
2T
otal
61
7 93
3,31
11 9
42,9
02
637,
99
9 30
4,92
34 1
18,0
3

19
Recent publications in the series Documents
1999/19 K. Flugsrud, W. Irving and K. Rypdal: Methodological Choice in Inventory Prepara-tion. Suggestions for Good Practice Guidance
1999/20 K. Skrede: Gender Equality in the Labour Market - still a Distant Goal?
1999/21 E. Engelien and P. Schøning: Land Use Statis-tics for Urban Settlements: Methods based on the use of administrative registers and digital maps
1999/22 R. Kjeldstad: Lone Parents and the "Work Line": Changing Welfare Schemes and Chang-ing Labour Market
2000/1 J.K. Dagsvik: Probabilistic Models for Qualitative Choice Behavior: An Introduction
2000/2 A. Senhaji: "An Evaluation of some Technology Programs executed by the Norwegian Government in the 80's and the 90's
2000/3 K. Rypdal and B. Tornsjø: Environmental Pressure Information System (EPIS) for the Pulp and Paper Industry in Norway
2000/4 K. Rypdal and B. Tornsjø: Chemicals in Environmental Pressure Information System (EPIS)
2000/5 R. Ragnarsøn: The Role of Subcontracting in the Production System
2000/6 K.E. Rosendahl: Industrial Benefits and Costs of Greenhouse Gas Abatement Strategies: Applications of E3ME: Modelling external secondary benefits in the E3ME model
2000/7 G.A. Ellingsen, K.E. Rosendahl and A. Bruvoll: Industrial Benefits and Costs of Greenhouse Gas Abatement Strategies: Applications of E3ME: Inclusion of 6 greenhouse gases and other pollutants into the E3ME model
2000/8 R. Ragnarsøn and L. Solheim: Industry Statistics in Mozambique: Major Findings and Recommendations
2000/9 R. Johannessen: The Consumer Price Index of Mozambique: A Short Term Mission 13-31 March 2000
2000/10 B.K. Wold: Planned Co-operation with Instituto Nacional de Estatística (INE), Mozambique: Report from Short Term Identification Mission 27th March to 3rd April, 2000 Requested by NORAD/Oslo
2000/11 P. Boug: Modelling Energy Demand in Germany: A Cointegration Approach
2000/12 E. Engelien and P. Schøning: Land use statistics for urban settlements
2000/13 M. Rønsen: Impacts on Women's Work and Child Care Choices of Cash-for-Care Programs
2000/14 H.C. Bjørnland: VAR Models in Macro-economic Research
2000/15 T.L. Andersen: Short-term Statistics in Mozambique: A short-term mission 19 June - 6 July 2000
2000/16 J. Thori Lind: The Use of Household Welfare Functions to Estimate Equivalence Scales
2001/1 T. Bye, R Choudhury, M. Harlarson and P. Hardarson: The ISM model: A CGE model for the Icelandic Economy
2001/2 K.Ø. Sørensen, J.L. Hass, H. Sjølie, P. Tønjum and K. Erlandsen: Norwegian Economic and Environment Accounts (NOREEA) Phase 2
2001/3 G. Haakonsen, K. Rypdal, P. Schøning and S.E. Stave: Towards a National Indicator for Noise Exposure and Annoyance: Part I: Building a Model for Traffic Noise Emissions and Exposure
2001/4 T. Åvitsland: User Costs of Real Capital
2001/5 H.V. Sæbø: Strategic planning and management in Institutio Nacional de Estatίstica, Mozambique: Short Term Mission Report, November 2 - 9, 2000
2001/6 H.V. Sæbø, J. Byfuglien and R. Johannessen: Quality issues in Statistics Norway
2001/7 J. Byfuglien: Comparability of income data: Project report
2001/8 A.S. Abrahamsen,.M.Q. Andersen and R.Ragnarsøn: Project: Quality of Manufacturing Statistics and Evaluation of Methods for Producing Preliminary and Final Figures. Final Report
2001/9 T. Skoglund: Employment in the Norwegian National Accounts
2001/10 O.C. Moen: Nordic Economic Growth in Light of New TheoryL: Overoptimism about R&D and Human Capital?
2001/11 H.V. Sæbø: Strategic Planning and Management in Instituto Nacional de Estatistica, Mozambique: Short Term Mission Report, August 27 - September 6, 2001
2001/12 B. Hoem: Environmental Pressure Information System (EPIS) for the household sector in Norway
2001/13 H. Brunborg, I. Bowler, A.Y. Choudhury and M. Nasreen: Appraisal of the Birth and Death Registration Project in Bangladesh