Department of Defense Comprehensive Selected … Department of Defense (DoD) has released details on...
23
Department of Defense Comprehensive Selected Acquisition Reports (SARs) For the December 31, 2016 Reporting Requirement as Updated by the President’s FY 2018 Budget The Department of Defense (DoD) has released details on major defense acquisition program cost, schedule, and performance changes since the December 2015 reporting period. This information is based on the comprehensive annual Selected Acquisition Reports (SARs) for the first quarter of FY 2017, as updated by the President’s FY 2018 budget submitted to Congress on May 23, 2017. SARs summarize the latest estimates of cost, schedule, and performance status. These reports are prepared annually in conjunction with submission of the President's Budget. Subsequent quarterly exception reports are required only for those programs experiencing unit cost increases of at least 15 percent or schedule delays of at least six months. Quarterly SARs are also submitted for initial reports, final reports, and for programs that are rebaselined at major milestone decisions. The total program cost estimates provided in the SARs include research and development, procurement, military construction, and acquisition-related operations and maintenance. Total program costs reflect actual costs to date as well as future anticipated costs. All estimates are shown in fully inflated then-year dollars. The current estimate of program acquisition costs for programs covered by SARs for the prior reporting period (December 2015) was $1,644,420.5 million. Final reports submitted for the annual December 2015 and for the June 2016 and September 2016 quarterly exception reporting periods were subtracted. Initial reports for the annual December 2015 and for the June 2016 and September 2016 quarterly exception reporting periods were added. Finally, the net cost changes for the June 2016 and September 2016 quarterly exception reporting periods were incorporated. Current Estimate (TY$ in Millions) December 2015 (79 programs) $ 1,644,420.5 Less five final reports on B-2 Extremely High Frequency SATCOM and Computer Increment 1 (B-2 EHF Inc 1), Remote Minehunting System (RMS), Excalibur Precision 155mm Projectiles (Excalibur), the Baseline subprogram of Space Based Infrared System High (SBIRS High), and the Baseline subprogram of the Joint-Air-to-Surface Standoff Missile (JASSM).* -19,601.8 Plus four initial reports on Common Infrared Countermeasure (CIRCM), Next Generation Jammer Increment 1 (NGJ Inc 1), Amphibious Combat Vehicle Phase 1 Increment 1 (ACV 1.1), and B-2 Defensive Management System – Modernization (B-2 DMS-M). +16,131.8 Net cost changes reported as of June 2016 and September 2016 quarterly exception SARs. +777.5 1
Transcript of Department of Defense Comprehensive Selected … Department of Defense (DoD) has released details on...

Department of Defense Comprehensive Selected Acquisition Reports (SARs)
For the December 31, 2016 Reporting Requirement as Updated by the President’s FY 2018 Budget
The Department of Defense (DoD) has released details on major defense acquisition program cost, schedule, and performance changes since the December 2015 reporting period. This information is based on the comprehensive annual Selected Acquisition Reports (SARs) for the first quarter of FY 2017, as updated by the President’s FY 2018 budget submitted to Congress on May 23, 2017. SARs summarize the latest estimates of cost, schedule, and performance status. These reports are prepared annually in conjunction with submission of the President's Budget. Subsequent quarterly exception reports are required only for those programs experiencing unit cost increases of at least 15 percent or schedule delays of at least six months. Quarterly SARs are also submitted for initial reports, final reports, and for programs that are rebaselined at major milestone decisions. The total program cost estimates provided in the SARs include research and development, procurement, military construction, and acquisition-related operations and maintenance. Total program costs reflect actual costs to date as well as future anticipated costs. All estimates are shown in fully inflated then-year dollars. The current estimate of program acquisition costs for programs covered by SARs for the prior reporting period (December 2015) was $1,644,420.5 million. Final reports submitted for the annual December 2015 and for the June 2016 and September 2016 quarterly exception reporting periods were subtracted. Initial reports for the annual December 2015 and for the June 2016 and September 2016 quarterly exception reporting periods were added. Finally, the net cost changes for the June 2016 and September 2016 quarterly exception reporting periods were incorporated.
Current Estimate (TY$ in Millions)
December 2015 (79 programs) $ 1,644,420.5
Less five final reports on B-2 Extremely High Frequency SATCOM and Computer Increment 1 (B-2 EHF Inc 1), Remote Minehunting System (RMS), Excalibur Precision 155mm Projectiles (Excalibur), the Baseline subprogram of Space Based Infrared System High (SBIRS High), and the Baseline subprogram of the Joint-Air-to-Surface Standoff Missile (JASSM).*
-19,601.8
Plus four initial reports on Common Infrared Countermeasure (CIRCM), Next Generation Jammer Increment 1 (NGJ Inc 1), Amphibious Combat Vehicle Phase 1 Increment 1 (ACV 1.1), and B-2 Defensive Management System – Modernization (B-2 DMS-M).
+16,131.8
Net cost changes reported as of June 2016 and September 2016 quarterly exception SARs.
+777.5
1

Adjustment to previously misaligned funding. +78.4
*Note: The dollars for the SBIRS Baseline and JASSM Baseline subprograms were subtracted because final reports for those subprograms were submitted for the December 2015 reporting period. The SBIRS Block Buy and JASSM-Extended Range subprograms continue to report SARs as the SBIRS High and JASSM programs. Changes Since Last Report:
Economic $ +1,748.2 Quantity +70,309.1 Schedule +17,429.5 Engineering +9,134.9 Estimating Other
-6,889.9 +200.9
Support +7,034.0 Net Cost Change $ +98,966.7
Plus Ballistic Missile Defense System (BMDS) development, procurement, and construction funding for Fiscal Year (FY) 2022; previous reports limited total funding through FY 2021
+7,886.2
December 2016 (87 programs)
$1,748,659.3
For the December 2016 reporting period, there is a net cost increase of $98,966.7 million or +5.81 percent for the 80 programs that have reported in previous SARs. This cost increase is due primarily to a net increase in the planned quantities to be purchased (+$70,309.1 million), a net stretch-out of development and procurement schedules (+$17,429.5 million), engineering changes to hardware and software (+$9,134.9 million), increases in support requirements (+$7,034.0 million), and the application of higher escalation rates (+$1,748.2 million). These increases were partially offset by a net decrease in program cost estimates (-$6,889.9 million).
New SARs
DoD is submitting initial SARs for the following programs as of the December 2016 reporting period. These reports do not represent cost growth. The baselines established on these programs will be the point from which future changes will be measured. Program
Current Estimate ($ in Millions)
M88A2 Heavy Equipment Recovery Combat Utility Lift Evacuation System (M88A2 HERCULES)
$2,933.0
F/A-18E/F Infrared Search and Track (IRST) $2,337.9
Offensive Anti-Surface Warfare Increment 1 (Long Range Anti-Ship Missile) (OASuW Inc 1 LRASM))
$1,634.2
2

SSBN 826 COLUMBIA Class Submarine (SSBN 826) $127,036.4
F-15 Eagle Passive Active Warning Survivability System (F-15 EPAWSS) $3,005.2
Military Global Positioning System User Equipment Increment 1 (MGUE Inc 1)
$1,166.4
Advanced Arresting Gear (AAG) $2,050.2
Total $140,163.3
Summary Explanations of Selected SAR Cost Changes
(As of December 31, 2016)
A. Nunn-McCurdy Unit Cost Breaches for 2016 For the December 2016 reporting period, there is one program with a significant Nunn-McCurdy unit cost breach to its current or original Acquisition Program Baseline (APB) (see below). In accordance with the provisions of sections 2433 and 2433a of title 10, United States Code, the Department will notify Congress and provide the required unit cost breach information in the SAR for this program. Significant Breaches: (Unit cost increases of 15 percent, but less than 25 percent, to the current APB or of 30 percent, but less than 50 percent, to the original APB) Chemical Demilitarization-Assembled Chemical Weapons Alternatives (Chem Demil-ACWA) – The Program Acquisition Unit Cost (PAUC) increased 21.80% percent above the current APB, due primarily to increases in required funding as a result of schedule extensions at Pueblo Chemical Agent-Destruction Pilot Plant and Blue Grass Chemical Agent-Destruction Pilot Plant. Chem Demil-ACWA currently has no Procurement requirement and therefore, has no Average Procurement Unit Cost (APUC) value. B. Program Cost Changes Greater than $1 Billion, or 10% Army:
AH-64E Apache New Build (AH-64E New Build) – Program costs decreased $541.4 million (-21.46%) from $2,522.7 million to $1,981.3 million, due primarily to a quantity decrease of four AH-64E New Build aircraft from 63 to 59 (-$235.1 million), which was partially offset by associated schedule and estimating allocations* (+$77.5 million). There were also decreases due to the acceleration of the procurement buy profile from FY 2022-FY 2024 to FY 2017-FY 2021 (-$126.8 million), a revised estimate as a result of unit cost pricing updated to reflect New Build Multi-Year contract pricing (-$174.3 million), and a decrease in Other Support and Initial Spares due to updated estimating methodologies to reflect the most recent actual cost (-$87.8 million). Guided Multiple Launch Rocket System/Guided Multiple Launch Rocket System Alternative Warhead (GMLRS/GMLRS AW) – Program costs increased $734.1 million (+10.74%) from $6,834.0 million to $7,568.1 million, due primarily to increased production capacity (+$386.5
3

million), development of the Extended Range GMLRS (+$372.3 million), a revised estimate to reflect the actual cost of production units (+$82.1 million), support for GMLRS variants (+$20.0 million), and revised escalation indices (+$5.0 million). These increases were partially offset by accelerating the procurement buy profile to meet maximum production capacity of 6,000 rockets in FY 2018 (-$93.3 million) and acceleration of production activities in FY 2022-FY 2029 (-$36.6 million). MQ-1C Gray Eagle Unmanned Aircraft System (MQ-1C Gray Eagle) – Program costs increased $591.5 million (+11.55%) from $5,121.4 million to $5,712.9 million, due primarily to a quantity increase of the Army Acquisition Objective from 167 to 204, as well as procuring the Extended Range configuration (+$562.7 million), which was partially offset by associated estimating, engineering, and schedule allocations* (-$25.9 million). There were also increases in Other Support for Common Sensor Payload and System Engineering, New Equipment Training, and Program Management and System Engineering (+$392.4 million), re-engineering to address software obsolescence issues directly related to the Ground Control Stations (+$20.0 million), and an estimating increase to support Outside Continental United States location (+$30.0 million). These increases were partially offset with a revised estimate for additional War Replacement Aircraft (-$307.7 million), and a decrease in support due to a decrease in Initial Spares due to removal of Ground Control Station funding (-$90.0 million). UH-60M Black Hawk Helicopter (UH-60M Black Hawk) – Program costs increased $1,365.6 million (+5.12%) from $26,660.8 million to $28,026.4 million, due primarily to a revised estimate due to a reduced annual quantity buy causing an increase in unit cost (+$1,143.3 million). There was also an increase due to a stretch-out of the procurement buy profile from FY 2027-FY 2029 (+$226.5 million). Navy: AIM-9X Block II Sidewinder (AIM-9X Blk II) – Program costs decreased $523.0 million (-12.76%) from $4,099.5 million to $3,576.5 million, due primarily to updated hardware based on contract negotiation data (-$467.6 million), revised estimates due to Congressional reductions and rephasing of the Software Improvement Program (-$30.4 million), a revised estimate due to Congressional reductions resulting in the loss of 20 missiles (-$5.3 million), a decrease in Initial Spares due to a change in the procurement profile (-$5.0 million), and the acceleration of the procurement buy profile of 472 missiles from FY 2023 through FY 2026 to FY 2018 through FY 2022 (-$42.4 million). These decreases were partially offset by revised escalation indices (+$9.5 million) and an increase in Initial Spares to reflect initiatives to improve missile availability in the fleet (+$19.7 million). CH-53K Heavy Lift Replacement Helicopter (CH-53K) – Program costs increased $1,953.7 million (+6.69%) from 29,206.1 million to 31,159.8 million, due primarily to a revised estimate for contractor labor rates for the production phase (+$669.0 million). There were also increases due to a stretch-out of a development effort between FY 2015 and FY 2022 due to contractor schedule delays as a result of discoveries during flight test and qualification testing (+$298.7 million), revised escalation indices (+$201.5 million), a stretch-out of the procurement buy profile resulting from moving 11 aircraft from FY 2020-FY 2024 to FY 2028 (+$177.0 million), a revised estimate for Engines, labor hours, material costs and learning and rate curves for the production phase
4

(+$336.2 million), an increase in Other Support due to Depot Capability Establishment for the production phase (+$173.3 million), and an increase in Initial Spares to fully fund requirements for spares shortfall (+$126.8 million). These increases were partially offset by MILCON requirements that moved under a separate Headquarters-Marine Corps budget line item because the New River operation support facility and Kaneohe Bay Hangar 102 are supporting multiple programs (-$31.9 million). CVN 78 Gerald R. Ford Class Nuclear Aircraft Carrier (CVN 78) – Program costs increased $2,215.1 million (+5.44%) from $40,695.5 million to $42,910.6 million, due primarily to a revised estimate for the addition of the second year of Advance Procurement for CVN 81 (+$1,586.1 million). There were also increases from the re-allocation of funds from EMALS to CVN 79 (+$129.4), the re-allocation of funds from EMALS to CVN 80 (+$166.3 million), additional funding for CVN 78 Class Battle Spares (+$74.5 million), a revised estimate for CVN 78 post-delivery (+$26.2 million), a revised estimate for CVN 79 outfitting and post-delivery (+$54.2 million), additional funding for CVN 78 Class Advanced Arresting Gear interim spares (+$30.7 million), a revised estimate for the first year of CVN 81 Advance Procurement (+$35.7 million), revised estimates in the out-years for Operational Test and Evaluation due to CVN 78 delivery shift from September 2016 to May 2017 (+$31.3 million), revised out-year estimates for CVN 78 Class for the identification and development of initiatives to reduce construction costs (+$27.5 million), and a Congressional increase in FY 2017 for CVN 78 Class cost reduction initiatives (+$20.0 million). DDG 51 Arleigh Burke Class Guided Missile Destroyer (DDG 51) – Program costs increased $4,284.6 million (+4.01%) from $106,846.5 million to $111,131.1 million, due primarily to a quantity increase of 3 ships from 86 to 89 (+$3,916.6 million) and associated schedule, engineering, and estimating allocations* (+$1,830.2 million). There were also increases for a revised estimate and rephasing of outfitting and post-delivery and inclusion of three additional ships (+$115.2 million), and a revised estimate for development of future Aegis requirements (+$24.5 million). These increases were partially offset by a revised estimate to reflect the Congressionally-added funding in the FY 2016 enacted budget for a third FY 2016 ship, the balance of which was included in the FY 2017 enacted budget (-$1,245.9 million), schedule variance due to the addition of one ship in FY 2016 (-$211.6 million), revised estimates due to Congressional reductions (-$79.5 million), revised estimates and rephasing to reflect FY 2018-FY 2022 projected savings (-$43.8 million), and revised estimates to reflect application of new outyear inflation indices (-$31.2 million). Littoral Combat Ship (LCS) – Program costs decreased $7,847.8 million (-27.15%) from $28,900.7 million to $21,052.9 million, due primarily to a quantity decrease of 8 ships from 38 to 30 (-$6,422.4). There were also decreases from additional quantity variance resulting from decreased outfitting and post-delivery requirements due to the decrease of ships (-$547.6 million), decreased cost due to removal of engineering support, test and evaluation, and training development requirements in support of Frigate related design enhancements (-$619.0 million), a revised estimate for proper pricing of outfitting and post-delivery requirements from FY 2018-FY 2022 (-$100.1 million), a revised estimate for current acquisition strategy and procurement profile (FY 2018-FY 2025) (-$87.6 million), a revised estimate due to LCS acquisition Congressional reduction in FY 2017 (-$36.9 million), and a revised estimate for proper pricing of trainer and battle spare requirements (FY 2018-FY 2025) (-$29.2 million).
5
LPD 17 San Antonio Class Amphibious Transport Dock (LPD 17) – Program costs increased $1,841.8 million (+8.89%) from 20,711.5 million to 22,553.3 million, due primarily to a quantity increase of one ship from 12 to 13 (+$2,097.5 million). There was also an increase for a revised estimate for the addition of post-delivery and outfitting requirements for LPD 28 (+$72.6 million). These increases were partially offset by a revised estimate for the addition of LPD 29 (-$311.5 million), and miscellaneous adjustments to post-delivery and outfitting (-$16.8 million). MQ-4C Triton Unmanned Aircraft System (MQ-4C Triton) – Program costs increased $2,447.7 million (+16.96%) from $14,434.7 million to $16,882.4 million, due primarily to a revised estimate to include work scope for Modernization (+$1,238.7 million). There were also increases for a revised estimate due to increases to baseline development in the Milestone C Independent Cost Estimate (+$110.6 million), revised escalation indices (+$90.0 million), the stretch-out of the procurement buy profile, which added one Unmanned Aircraft (UA) in FY 2017 and moved UA from FY 2020, FY 2021, and FY 2022 to FY 2032 and FY 2033 (+$119.0 million), additional schedule variance due to an adjustment in the procurement buy profile for both aircraft and ground stations (+$72.5 million), a revised estimate to include Multiple Intelligence (Multi-Int) engineering change proposals (+$441.8 million), a revised estimate to include Multi-Int retrofits (+$91.8 million), and an increase in Other Support for Production Engineering Support for Multi-Int improvements (+$282.3 million). Ship to Shore Connector (SSC) – Program costs increased $905.7 million (+19.86%) from $4,561.4 million to $5,467.1 million, due primarily to a revised estimate which includes greater supplier costs, direct labor costs, manufacturing overhead costs, and lengthened procurement profile (+$628.4M). There were also increases due to the extension of procurement for seven years (FY 2023 - FY 2030) (+$235.7M), and an increase in Initial Spares to align to the Milestone C Service Cost Position (+$35.5 million). SSN 774 VIRGINIA Class Submarine (SSN 774) – Program costs increased $60,061.9 million (+57.61%) from $104,261.5 million to $164,323.4 million, due primarily to a quantity increase of 15 VIRGINIA Class Submarines from 33 to 48 (+$66, 260.5 million), which were partially offset by associated schedule and estimating allocations* (-$8,988.7 million). There were also increases due to revised requirements for additional research and development activities to support the program extension to 48 ships (+$1,252.6 million), an increase in initial outfitting spares to support class extension (Shipbuilding and Conversion, Navy) (+$727.9 million), an increase in initial spares to support class extension (Other Procurement, Navy) (+195.8 million), additional funding for port facilities to support submarines with VIRGINIA Payload Module (+$570.8 million), revised escalation indices (+$21.0 million), and an adjustment for current and prior escalation (+$20.2 million). SSBN 826 COLUMBIA Class Submarine (SSBN 826) – Program costs decreased $1,201.6 million from the Acquisition Program Baseline, due primarily to a revised cost estimate and funds realignment for COLUMBIA Class Integrated Enterprise Plan construction efficiencies (-$1,240.3 million). These decreases were partially offset with an increase in estimating due to additional funding for a Naval Foundry and Propeller Center power upgrades requirement (+$37.7 million). Air Force:
6

Evolved Expendable Launch Vehicle (EELV) – Program costs decreased $3,211.2 million (-5.14%) from $62,438.0 million to $59,226.8 million, due primarily to a change in the program’s procurement strategy to comply with FY 2016 National Defense Authorization Act direction, which will end current EELV Launch Capability funding at the end of FY 2019 (-$13,012.8 million), and revised cost assumptions for the reassignment of missions to different launch providers due to the end of the Delta IV Launch Vehicle (-$270.8 million). These decreases were partially offset by a revised estimate due to a change in estimating methodology for mission pricing to incorporate the efforts previously covered in the annual fixed EELV Launch Capability (+$4,788.7 million), the addition of Launch Support Services to meet the National Security Space mission unique launch requirements previously covered under the annual fixed capability (+$2,917.6 million), a quantity variance resulting from an increase in eight launch services, from 160 to 168, based on increased Satellite Vehicle requirements (+$1,785.0 million) and increased funding to invest in new launch system providers to support National Security Space mission requirements (+$297.6 million), revised escalation indices (+$139.6 million), and a stretch-out of Launch Vehicle procurement profile due to requirements by Satellite Vehicles shifting between years (+$163.2 million). Joint Direct Attack Munition (JDAM) – Program costs increased $1,068.2 million (+11.74%) from $9,098.3 million to $10,166.5 million, due primarily to a quantity increase of 40,087 tailkits from 355,445 to 395,532 (+$1,126.9 million), adjustments for current and prior escalation indices (+$107.0 million), and a revised estimate due to an FY 2015 reprogramming increase received for Laser JDAM (+33.2 million). These increases were partially offset by revisions to the escalation indices (-$128.1 million), acceleration of the procurement buy profile due to increased production capacity based on urgent operational need by the Warfighter (-$32.8 million), rephased funding for Global Positioning System M-Code integration between other platform budgets and between fiscal years (-$22.4 million), and a decrease in other support to align with reduced engineering efforts that were early to need (-$15.6 million). KC-46A Tanker Modernization (KC-46A) – Program costs decreased $3,657.0 million (-7.59%) from 48,212.0 million to 44,555.0 million, due primarily to a revised estimate for an Economic Price Adjustment based on updated analysis of historical escalation and revised index forecasts (-$2076.0 million). There were also decreases for an Engineering Change Order estimate due to fact-of-life execution changes and stable aircraft requirements (-$759.5 million), a decrease in Other Support due to decreases in Aircrew Training Systems, Maintenance Training Systems, Data, Support Equipment, Operational Site Activation, and Depot Stand-Up costs (-$663.4 million), a revised estimate due to Congressional marks in FY 2016 for RDT&E and Procurement (-$573.0 million), a revised estimate to remove Warranty costs based on Cost Benefit Analysis and a program decision not to exercise Warranty options (-$292.4 million), a revised estimate for Large Aircraft Infrared Countermeasures (LAIRCM) Contractor Furnished Equipment (CFE) to reflect updated pricing data (-$247.6 million), a revised LAIRCM estimate to reflect the acquisition strategy transition from CFE to Government Furnished Equipment (-$461.2 million), a revised estimate to reflect the application of new outyear inflation indices (-$250.0 million), and a revised estimate to reflect a decrease in FY 2019-FY 2020 and FY 2022 funding as a result of Main Operating Base #4 projects (-$203.3 million). These decreases were partially offset by an increase in Initial Spares based upon an updated acquisition strategy and an increase in the estimated spares requirement (+$1,753.2 million), and a revised estimate to reflect an updated Aircraft Product Development execution plan (+$116.6 million).
7

F-15 Eagle Passive Active Warning Survivability System (F-15 EPAWSS) – Program costs decreased $2,020.3 million from the Acquisition Program Baseline, due primarily to a quantity decrease of 192 F-15C units from 413 to 221 (-$1,728 million). There were also decreases for a revised estimate due to re-categorization of Flyaway to Support to more accurately reflect the planned program procurement (-$261.8 million), a decrease in Other Support driven by the quantity reduction (-$28.0 million), a decrease in Initial Spares driven by the quantity reduction (-$54.8 million), and a revised estimate to align to the FY 2018 President’s Budget (-$13.1 million). These decreases were partially offset by a stretch-out of the procurement buy profile from FY 2019 to FY 2029 (+$72.8 million). DoD: Ballistic Missile Defense System (BMDS) – Program costs increased $3,226.5 million (+7.22%) from $153,881.4 million to $164,994.1 million, due primarily to additional funds to meet U.S. obligations with Israel on Missile and Rocket Defense Cooperative Programs (+$1,502.0 million), additional funds to accelerate Multi-Object Kill Vehicle risk reduction and product development (+$803.8 million), the establishment of a hypersonic defense program demonstration (+$508.8 million), increased Cyber Security funds in accordance with the DoD Cyber Security Discipline Plan (+$431.0 million), additional funds for discrimination improvements and countermeasures mitigation (+$388.5 million), increased Aegis investments in Aegis 6.1; SM-3 Block 1B modernization; and SM-3 Block IIA software upgrade program (+$273.3 million), provided funding to develop Post Intercept Assessment capability by FY 2022 (+122.3 million), the start of an investment to ensure that no fewer than 44 Ground-Based interceptors are deployed throughout the Future Years Defense Program (+$150.0 million), and an additional 12 Terminal High Altitude Area Defense (THAAD) interceptors and obsolescence upgrades in FY 2017 (+$196.9 million). These increases were partially offset by a reduction in 44 Aegis SM-3 IIA missiles (including canisters, spares) (-$1,109.1 million) and a revised AN/TPY-2 Prime Power Unit acquisition strategy (-$45.6 million). Chemical Demilitarization-Assembled Chemical Weapons Alternatives (Chem Demil-ACWA) – Program costs increased $2,344.3 million (+21.33%) from $10,990.1 million to $13,334.4 million, due primarily to increases in required funding as a result of schedule extensions at the Pueblo Chemical Agent-Destruction Pilot Plant and Blue Grass Chemical Agent-Destruction Pilot Plant facilities (+$1,869.0 million) and funding increases in FY 2017 through FY 2022 as supported by the Director, Cost Assessment and Program Evaluation (+$475.1 million). F-35 Joint Strike Fighter – Overall F-35 program costs increased $27,438.9 million (+6.81%) from $379,042.0 million to $406,480.9 million. The details are provided below by subprogram:
F-35 Aircraft – Subprogram costs increased $23,691.0 million (+7.44%) from $318,390.9 million to $342,081.9 million, due primarily to schedule variance for the U.S. procurement quantity profile for both the Air Force and the Navy (+$10,537.5 million), schedule stretch-out of the Air Force procurement buy profile from FY 2038 to FY 2044 due to a reduction in the peak production rate for aircraft from 80 aircraft per year to 60 aircraft per year (+$6,983.3 million), and a quantity increase of 13 F-35Bs from 680 to 693 (+$1,204.0 million), which were partially offset by associated schedule and estimating allocations* (-$59.2 million). Also, procurement cost increases were realized due to the incorporation of additional Manpower Full-
8

Time Equivalent personnel and associated pay rate increases in the area of Other Support costs for Navy aircraft support (+1,559.3 million), and revised estimates for Non-Recurring costs associated with Diminishing Manufacturing Sources for both the Air Force and the Navy (+$1,619.9 million). Additional procurement cost increases were realized due to added funding for Disruptive Technology Innovation Partnership requirements for the Air Force and Navy (+$770.4 million) and revised estimating assumptions for the Navy (+$581.1 million). Lastly, costs increased due to additional funding for the Air Vehicle and Test program as a result of realignment of Procurement funding to RDT&E for the Air Force and Navy (+$429.1 million). F-35 Engine – Subprogram costs increased $3,747.9 million (+6.18%) from $60,651.1 million to $64,399.0 million, due primarily to the schedule stretch-out of the Air Force and Navy procurement buy profile from FY 2038 to FY 2044 due to a reduction in the peak production rate for engines from 80 engines per year to 60 engines per year (+$1,255.4 million), and additional schedule variance for Air Force and Navy US procurement quantity profile adjustments (+$368.2 million). There was an increase in quantity of 13 F-35Bs from 680 to 693 (+$221.3 million), which were partially offset by associated schedule and estimating allocations* (-$14.5 million). Additional procurement cost increases were realized due to the incorporation of the latest actual costs used in the revised current estimate for both Air Force and Navy engines (+$1,335.0 million). Also, procurement costs were realized with revised escalation indices (+$72.7 million), revised estimating assumptions for the Air Force and Navy (+$62.1 million), and an increase in Initial Spares due to estimating methodology updates to reflect the actual demand data from executed flight hours (+$117.8 million). Lastly, procurement cost increases were realized due to the incorporation of additional Manpower Full-Time Equivalent personnel and associated pay rate increases in the area of Other Support costs for both Air Force and Navy engine support (+$327.4 million).
*Note: Quantity changes are estimated based on the original SAR baseline cost-quantity relationship. Cost changes since the original baseline are separately categorized as schedule, engineering, or estimating "allocations." The total impact of a quantity change is the identified "quantity" change plus all associated "allocations."
9

Program Base Year
Base Year $ Then Year $ Quantity Base Year $ Then Year $ Quantity
ArmyAH-64E New Build 2010 1,709.1 1,981.3 59 -322.8 -541.4 -4
AH-64E Remanufacture 2010 12,401.0 14,333.3 639 -257.6 -263.8 0
AMF JTRS 2008 2,856.1 3,456.9 14,028 -51.0 -36.5 -194
AMPV 2015 10,803.4 13,927.6 2,936 53.6 85.2 0
CH-47F 2005 12,843.1 14,660.2 538 -167.1 -214.0 -7
CIRCM 2015 2,560.7 3,094.2 1,124 -19.1 -12.0 0
GMLRS/GMLRS AW 2003 5,851.1 7,568.1 43,936 570.8 734.1 0
HMS 2011 8,652.7 10,816.8 271,202 -102.9 -90.2 0
IAMD 2009 6,236.0 7,701.3 479 447.3 689.0 36
JAGM 2015 5,663.1 7,139.7 26,437 -19.7 2.8 0
MQ-1C Gray Eagle 2010 5,336.5 5,712.9 45 510.9 591.5 11
PAC-3 MSE 2014 6,478.4 7,114.0 1,185 201.5 213.7 60
PIM 2013 6,950.5 7,995.6 570 -53.6 -37.3 0
UH-60M Black Hawk 2005 22,219.8 28,026.4 1,370 788.4 1,365.6 -5
WIN-T Inc 2 2010 9,857.9 12,311.7 3,730 272.6 650.4 0
WIN-T Inc 3 2009 1,813.7 1,844.9 0 -1.3 -1.3 0
SubTotal 122,233.1 147,684.9 1,850.0 3,135.8
NavyACV 1.1 2014 1,731.0 1,916.9 240 -95.9 -114.9 0
AGM-88E AARGM 2003 2,106.2 2,670.2 2,475 -1.2 6.5 0
AIM-9X Blk II 2011 3,098.2 3,576.5 6,000 -399.8 -523.0 0
AMDR 2013 5,293.5 6,163.7 22 161.4 218.0 0
CEC 2002 4,835.5 5,445.9 283 98.0 146.8 0
CH-53K 2017 27,763.7 31,159.8 200 1,327.6 1,953.7 0
CVN 78 - CVN 78 2000 26,992.6 42,910.6 3 1,163.3 2,215.1 0
CVN 78 - EMALS 2000 1,928.6 2,824.9 3 -164.1 -302.1 0
DDG 1000 2005 19,427.7 22,814.0 3 296.0 413.0 0
DDG 51 1987 68,490.9 111,131.1 89 1,650.0 4,284.6 3
E-2D AHE 2009 19,611.1 22,007.2 75 77.0 117.5 0
EA-18G 2004 12,947.4 15,377.7 160 -239.5 -294.7 0
G/ATOR 2012 2,664.6 2,966.6 45 38.1 53.2 0
H-1 Upgrades 2008 11,317.8 12,072.7 339 -296.9 -353.2 -12
IDECM - IDECM Blocks 2/3 2008 1,607.7 1,971.9 12,805 -2.8 12.3 0
IDECM - IDECM Block 4 2008 1,035.2 1,232.9 324 -13.3 -14.2 0
JPALS 2016 1,826.6 1,861.1 33 -0.5 1.0 0
KC-130J 2010 8,646.2 9,779.8 104 -36.8 -11.9 0
LCS 2010 18,314.4 21,052.9 32 -5,604.4 -7,847.8 -8
LCS MM 2010 6,415.6 7,831.1 64 42.7 242.4 0
LHA 6 2006 8,474.4 11,050.9 3 141.3 223.6 0
LPD 17 1996 16,264.4 22,553.3 13 1,002.2 1,841.8 1
MH-60R 2006 12,140.3 13,092.8 280 -97.1 -115.1 0
MIDS 2003 3,937.7 4,583.1 9,126 65.4 90.4 522
MQ-4C Triton 2016 14,937.6 16,882.4 70 1,958.0 2,447.7 0
MQ-8 Fire Scout 2017 2,903.3 2,772.3 64 -52.7 -32.8 -6
Program Acquisition Cost Summary (Dollars in Millions)As of Date: December 31, 2016
Current Estimate Changes This Quarter
10

Program Base Year
Base Year $ Then Year $ Quantity Base Year $ Then Year $ Quantity
Program Acquisition Cost Summary (Dollars in Millions)As of Date: December 31, 2016
Current Estimate Changes This Quarter
MUOS 2004 5,388.0 6,170.9 5 -438.3 -668.3 -1
NGJ Inc 1 2016 7,476.2 8,475.8 135 12.5 44.9 0
NMT 2002 1,827.2 2,327.2 278 59.6 90.2 0
P-8A 2010 30,836.0 33,378.5 116 790.0 974.4 2
SM-6 2004 7,465.1 10,225.2 1,800 228.7 415.0 0
SSC 2011 4,148.7 5,467.1 73 486.5 905.7 0
SSN 774 1995 93,543.2 164,323.4 48 27,015.9 60,061.9 15
TACTOM 1999 5,406.2 6,830.0 4,439 281.4 439.6 214
Trident II Missile 1983 27,675.2 41,676.0 561 -29.1 -47.4 0
V-22 2005 51,618.7 56,150.4 462 213.7 288.1 1
VH-92A 2014 4,574.1 5,061.9 23 -52.5 -26.3 0
SubTotal 544,670.8 737,788.7 29,584.4 67,135.7
Air ForceAEHF - AEHF SV 1-4 2002 9,355.2 10,584.0 4 -42.6 -38.2 0
AEHF - AEHF SV 5-6 2002 2,087.1 2,707.7 2 -10.0 -10.8 0
AMRAAM 1992 16,138.1 19,958.2 17,312 -4.6 56.2 0
AWACS Blk 40/45 Upgrade 2012 2,712.2 2,690.8 24 57.0 65.9 0
B-2 DMS-M 2016 2,537.5 2,675.4 20 86.0 112.5 0
B61 Mod 12 LEP TKA 2012 1,139.6 1,257.2 890 -54.5 -56.2 0
C-130J 1996 12,175.5 15,803.5 170 -115.0 -140.4 1
C-5 RERP 2008 6,586.1 6,943.0 52 -111.9 -123.6 0
CRH 2014 8,233.4 9,889.5 112 42.3 91.8 0
EELV 2012 52,894.0 59,226.8 169 -2,682.4 -3,211.2 8
EPS 2014 1,376.8 1,331.2 2 -3.5 -3.0 0
F-22 Inc 3.2B Mod 2016 1,474.1 1,465.3 152 -96.0 -77.3 0
FAB-T - FET 2015 2,640.9 2,933.6 158 13.8 17.9 0
FAB-T - CPT 2015 1,794.2 1,754.9 109 34.4 38.0 0
GBS 1997 968.2 1,131.4 2,074 -0.5 -0.5 35
GPS III 2010 5,079.2 5,437.1 10 -101.2 -120.3 0
HC/MC-130 Recap 2009 12,586.6 14,479.1 132 -184.8 -192.4 1
ICBM Fuze Mod 2014 1,813.4 2,053.6 781 -18.9 -16.3 0
JASSM 2010 3,837.6 4,590.0 2,897 137.0 175.9 0
JDAM 1995 7,731.1 10,166.5 396,336 773.4 1,068.2 40,087
KC-46A 2016 39,652.6 44,555.0 179 -3,502.6 -3,657.0 0
MQ-9 Reaper 2008 11,216.9 12,923.1 366 674.6 907.6 16
OCX 2012 5,088.7 5,394.8 1 114.0 147.0 0
SBIRS High 1995 2,363.7 3,457.6 2 80.2 129.4 0
SDB II 2015 4,177.8 4,579.7 17,163 7.4 24.8 0
Space Fence Inc 1 2014 1,478.0 1,488.7 1 -13.3 -14.2 0
WGS 2010 3,675.9 3,622.5 8 -155.4 -179.4 0
SubTotal 220,814.4 253,100.2 -5,077.1 -5,005.6
DoDBMDS 2002 136,234.9 164,994.1 0 2,312.4 3,226.5 0
Chem Demil-ACWA 2011 12,159.0 13,334.4 3,136 1,881.6 2,344.3 0
F-35 - F-35 Engine 2012 53,043.2 64,399.0 2,470 1,543.7 3,747.9 13
11

Program Base Year
Base Year $ Then Year $ Quantity Base Year $ Then Year $ Quantity
Program Acquisition Cost Summary (Dollars in Millions)As of Date: December 31, 2016
Current Estimate Changes This Quarter
F-35 - F-35 Aircraft 2012 271,577.4 342,081.9 2,470 9,816.5 23,691.0 13
JLTV 2015 20,335.4 25,276.1 56,454 527.0 691.1 1,741
SubTotal 493,349.9 610,085.5 16,081.2 33,700.8
Grand Total 1,381,068.2 1,748,659.3 42,438.5 98,966.7
12

Program Base Year
This Qtr To Date This Qtr To Date This Qtr To Date This Qtr To Date This Qtr To Date This Qtr To Date This Qtr To Date
Army:
AH-64E New Build 2010 -177.3 136.2 -29.2 43.6 - - -55.0 -631.3 - - -61.3 -146.4 -322.8 -597.9
AH-64E Remanufacture 2010 - - - -8.9 - - -304.4 2,631.3 - - 46.8 -690.1 -257.6 1,932.3
AMF JTRS 2008 -48.7 -2,326.7 -4.1 -121.0 - 11.0 20.1 -2,073.0 - - -18.3 224.5 -51.0 -4,285.2
AMPV 2015 - - - - - - 43.1 66.7 - - 10.5 11.9 53.6 78.6
CH-47F 2005 -120.6 637.5 8.1 -44.6 -5.0 179.2 -47.3 1,297.8 - - -2.3 158.4 -167.1 2,228.3
CIRCM 2015 - - - - - - -11.3 33.6 - - -7.8 -10.0 -19.1 23.6
GMLRS/GMLRS AW 2003 - -5,770.7 -22.9 213.7 - 8.5 594.3 1,609.9 - - -0.6 9.5 570.8 -3,929.1
HMS 2011 - - -8.9 145.9 - - -150.6 -122.6 - - 56.6 386.8 -102.9 410.1
IAMD 2009 385.3 1,812.7 -5.7 -2.7 - 148.7 127.3 220.2 - - -59.6 -799.5 447.3 1,379.4
JAGM 2015 - - - -13.0 - - -227.1 -215.6 - - 207.4 221.8 -19.7 -6.8
MQ-1C Gray Eagle 2010 494.4 635.2 0.5 0.6 23.9 93.6 -286.1 -818.0 - - 278.2 173.1 510.9 84.5
PAC-3 MSE 2014 237.8 365.2 -30.6 -30.6 - - -1.2 112.7 - - -4.5 -5.9 201.5 441.4
PIM 2013 - 78.4 - - - - -35.9 106.3 - - -17.7 -77.8 -53.6 106.9
UH-60M Black Hawk 2005 -57.7 2,272.3 15.8 918.9 - 538.8 791.8 1,064.2 - - 38.5 623.9 788.4 5,418.1
WIN-T Inc 2 2010 - 3,267.6 - 3.5 - -445.7 148.7 -86.2 - - 123.9 2,432.7 272.6 5,171.9
WIN-T Inc 3 2009 - -10,240.3 - -394.8 - -361.0 -1.3 225.9 - - - -3,224.0 -1.3 -13,994.2
Subtotal 713.2 -9,132.6 -77.0 710.6 18.9 173.1 605.1 3,421.9 - - 589.8 -711.1 1,850.0 -5,538.1
Navy:
ACV 1.1 2014 - - - - - - -124.9 -124.9 - - 29.0 29.0 -95.9 -95.9
AGM-88E AARGM 2003 - 274.7 1.3 72.8 - 64.2 -2.3 145.8 - - -0.2 20.2 -1.2 577.7
AIM-9X Blk II 2011 - - - -407.6 - 266.9 -411.0 -672.7 - - 11.2 -55.7 -399.8 -869.1
AMDR 2013 - - - - 139.1 294.6 143.4 -130.9 - - -121.1 -605.9 161.4 -442.2
CEC 2002 - -95.5 76.8 426.3 - 289.0 26.6 195.4 - - -5.4 -103.0 98.0 712.2
CH-53K 2017 - 3,514.2 384.2 2,245.7 -29.0 2.4 720.4 5,331.0 - - 252.0 316.1 1,327.6 11,409.4
CVN 78 - CVN 78 2000 - - 15.1 135.3 - -164.7 1,131.1 -727.1 - - 17.1 23.5 1,163.3 -733.0
CVN 78 - EMALS 2000 - - - - - - -164.1 953.0 - - - - -164.1 953.0
Distribution of Cost Changes (Base-Year Dollars in Millions)As of December 31, 2016
Cost Changes Between the Baseline and Current Estimate
Quantity Schedule Engineering Estimating Other Support Total
13

Program Base Year
This Qtr To Date This Qtr To Date This Qtr To Date This Qtr To Date This Qtr To Date This Qtr To Date This Qtr To Date
Distribution of Cost Changes (Base-Year Dollars in Millions)As of December 31, 2016
Cost Changes Between the Baseline and Current Estimate
Quantity Schedule Engineering Estimating Other Support Total
DDG 1000 2005 - -14,646.0 -0.6 101.9 - 15.9 296.6 2,408.0 - - - - 296.0 -12,120.2
DDG 51 1987 1,501.3 38,521.0 59.0 651.1 208.8 4,386.9 -119.1 7,978.2 - - - - 1,650.0 51,537.2
E-2D AHE 2009 - - 0.7 1,199.7 8.1 1,162.5 37.3 -697.9 - - 30.9 478.2 77.0 2,142.5
EA-18G 2004 - 4,746.2 - -4.6 - 126.1 -28.0 -319.3 - - -211.5 868.2 -239.5 5,416.6
G/ATOR 2012 - - - -0.1 28.8 28.8 12.1 -83.8 - - -2.8 104.4 38.1 49.3
H-1 Upgrades 2008 -279.1 -313.7 0.6 -23.6 - 83.6 -38.3 384.0 - - 19.9 -15.9 -296.9 114.4
IDECM - IDECM Blocks 2/3
2008 - -10.5 - 92.4 - - -5.2 78.2 - - 2.4 36.7 -2.8 196.8
IDECM - IDECM Block 4 2008 - 167.6 - 165.7 - 57.9 1.0 -60.2 - - -14.3 43.5 -13.3 374.5
JPALS 2016 - - -1.2 -1.2 - - 5.0 5.0 - - -4.3 -4.3 -0.5 -0.5
KC-130J 2010 - - 6.1 345.0 - 177.1 -7.8 -1,014.3 - - -35.1 -95.5 -36.8 -587.7
LCS 2010 -4,892.2 -11,920.9 - 782.2 -503.9 1,163.6 -208.3 -3,721.5 - - - - -5,604.4 -13,696.6
LCS MM 2010 - - 133.6 558.7 - -18.7 -90.9 -503.9 - - - - 42.7 36.1
LHA 6 2006 - 6,142.3 - -33.3 - 49.5 141.3 -811.2 - 249.7 - - 141.3 5,597.0
LPD 17 1996 677.8 -268.4 48.3 514.7 - - 166.5 5,238.7 109.6 1,761.3 - - 1,002.2 7,246.3
MH-60R 2006 - 793.7 -4.8 47.7 - 339.8 -36.1 351.1 - - -56.2 -19.0 -97.1 1,513.3
MIDS 2003 159.3 1,740.9 -3.7 -28.1 -7.5 498.1 -54.6 -118.9 - - -28.1 20.9 65.4 2,112.9
MQ-4C Triton 2016 - 102.9 71.6 822.1 1,573.2 1,542.9 66.5 287.5 - - 246.7 -1,703.6 1,958.0 1,051.8
MQ-8 Fire Scout 2017 -247.9 -1,025.0 97.9 286.7 128.3 869.5 -27.2 -242.4 - - -3.8 157.8 -52.7 46.6
MUOS 2004 -437.1 -437.1 - 0.6 - 144.9 -182.8 -270.9 - - 181.6 181.6 -438.3 -380.9
NGJ Inc 1 2016 - - 9.4 9.4 - - -10.4 -10.4 - - 13.5 13.5 12.5 12.5
NMT 2002 - -55.9 22.0 21.3 - 144.1 37.6 199.8 - - - - 59.6 309.3
P-8A 2010 354.2 -922.2 -109.7 66.9 903.9 788.4 -421.9 -1,328.8 - - 63.5 -114.2 790.0 -1,509.9
SM-6 2004 - 1,761.1 - 20.4 - - 170.2 138.8 - - 58.5 263.7 228.7 2,184.0
SSC 2011 - -4.0 - -3.1 - - 464.0 218.9 - - 22.5 11.3 486.5 223.1
SSN 774 1995 29,603.7 33,418.9 -2,892.9 -3,742.2 2,017.8 3,169.2 -2,124.7 -3,922.4 - - 412.0 266.1 27,015.9 29,189.6
TACTOM 1999 112.7 818.1 -0.6 213.0 1.9 50.2 131.1 1,256.6 - - 36.3 91.0 281.4 2,428.9
Trident II Missile 1983 - -3,970.8 - 35.6 - 55.9 -57.9 3,902.6 - - 28.8 1,095.6 -29.1 1,118.9
14

Program Base Year
This Qtr To Date This Qtr To Date This Qtr To Date This Qtr To Date This Qtr To Date This Qtr To Date This Qtr To Date
Distribution of Cost Changes (Base-Year Dollars in Millions)As of December 31, 2016
Cost Changes Between the Baseline and Current Estimate
Quantity Schedule Engineering Estimating Other Support Total
V-22 2005 58.2 235.4 -23.3 1,261.7 255.8 917.2 40.6 -1,103.2 - - -117.6 57.2 213.7 1,368.3
VH-92A 2014 - - - - - - 123.3 -42.9 - - -175.8 -32.7 -52.5 -75.6
Subtotal 26,610.9 58,567.0 -2,110.2 5,833.1 4,725.3 16,505.8 -400.9 13,165.0 109.6 2,011.0 649.7 1,328.7 29,584.4 97,410.6
Air Force:
AEHF - AEHF SV 1-4 2002 - 784.9 - 1,091.3 - 220.4 -42.6 1,457.9 - - - - -42.6 3,554.5
AEHF - AEHF SV 5-6 2002 - - - - - - -10.0 -628.0 - - - - -10.0 -628.0
AMRAAM 1992 - 879.0 27.7 1,136.2 - 904.5 4.4 649.5 - - -36.7 290.7 -4.6 3,859.9
AWACS Blk 40/45 Upgrade
2012 - -227.1 - -24.3 - - 52.7 141.3 - - 4.3 -0.1 57.0 -110.2
B-2 DMS-M 2016 - - - - - - 62.4 152.6 - - 23.6 -171.3 86.0 -18.7
B61 Mod 12 LEP TKA 2012 - - - -62.9 - - -54.5 -119.1 - - - - -54.5 -182.0
C-130J 1996 56.9 8,705.2 -166.3 -411.6 - 148.5 -15.8 1,058.1 - - 10.2 1,944.6 -115.0 11,444.8
C-5 RERP 2008 - - - - - - -77.3 -382.7 - - -34.6 -177.8 -111.9 -560.5
CRH 2014 - - -17.6 -21.9 - - 77.8 160.7 - - -17.9 3.7 42.3 142.5
EELV 2012 1,264.4 2,217.4 - -9.2 - - -3,946.8 -10,757.6 - - - - -2,682.4 -8,549.4
EPS 2014 - - - - - - -3.5 -12.3 - - - - -3.5 -12.3
F-22 Inc 3.2B Mod 2016 - - - - - - -95.1 -132.6 - - -0.9 -1.2 -96.0 -133.8
FAB-T - FET 2015 - - - - 15.4 15.4 -1.1 -138.8 - - -0.5 -34.8 13.8 -158.2
FAB-T - CPT 2015 - - 16.9 16.9 23.6 23.6 -8.6 -27.7 - - 2.5 38.4 34.4 51.2
GBS 1997 3.4 373.5 1.4 67.2 1.3 119.7 -7.1 -62.3 - - 0.5 18.7 -0.5 516.8
GPS III 2010 - 661.1 - - - - -72.1 -94.7 - - -29.1 369.9 -101.2 936.3
HC/MC-130 Recap 2009 86.4 5,333.6 -1.1 -105.6 15.7 276.8 -345.2 -2,063.2 - - 59.4 1,066.9 -184.8 4,508.5
ICBM Fuze Mod 2014 - - - - - - -18.9 -1.4 - - - - -18.9 -1.4
JASSM 2010 - 322.4 - -13.9 137.4 401.5 -7.2 510.9 - - 6.8 421.7 137.0 1,642.6
JDAM 1995 692.2 4,653.0 - -7.5 - 49.9 87.2 455.0 - - -6.0 280.4 773.4 5,430.8
KC-46A 2016 - - - -57.4 - - -4,405.2 -6,915.8 - - 902.6 -395.4 -3,502.6 -7,368.6
MQ-9 Reaper 2008 219.9 -321.5 62.8 78.9 -68.5 730.7 244.7 -815.7 - - 215.7 793.2 674.6 465.6
OCX 2012 - - - - - - 114.0 1,741.5 - - - - 114.0 1,741.5
15

Program Base Year
This Qtr To Date This Qtr To Date This Qtr To Date This Qtr To Date This Qtr To Date This Qtr To Date This Qtr To Date
Distribution of Cost Changes (Base-Year Dollars in Millions)As of December 31, 2016
Cost Changes Between the Baseline and Current Estimate
Quantity Schedule Engineering Estimating Other Support Total
SBIRS High 1995 - - - - - - 136.0 -150.9 - - -55.8 -167.0 80.2 -317.9
SDB II 2015 - - - - - 107.9 11.0 17.4 - - -3.6 -2.4 7.4 122.9
Space Fence Inc 1 2014 - - - - - - -13.3 -89.7 - - - - -13.3 -89.7
WGS 2010 - 383.0 - - - 124.8 -155.4 -442.3 - - - -0.2 -155.4 65.3
Subtotal 2,323.2 23,764.5 -76.2 1,676.2 124.9 3,123.7 -8,489.5 -16,489.9 - - 1,040.5 4,278.0 -5,077.1 16,352.5
DoD:
BMDS 2002 - 12.8 577.9 -930.6 214.2 42,811.8 1,520.3 -6,325.6 - - - - 2,312.4 35,568.4
Chem Demil-ACWA 2011 - - 1,482.6 1,720.6 - - 399.0 457.6 - - - - 1,881.6 2,178.2
F-35 - F-35 Engine 2012 150.3 150.3 266.3 266.3 - - 781.2 426.9 - - 345.9 -1,828.4 1,543.7 -984.9
F-35 - F-35 Aircraft 2012 817.9 817.9 6,387.1 6,387.1 575.6 1,922.0 -374.6 -8,522.0 - - 2,410.5 -5,510.6 9,816.5 -4,905.6
JLTV 2015 519.3 519.3 93.0 93.0 - - -67.2 -59.5 - - -18.1 83.1 527.0 635.9
Subtotal 1,487.5 1,500.3 8,806.9 7,536.4 789.8 44,733.8 2,258.7 -14,022.6 - - 2,738.3 -7,255.9 16,081.2 32,492.0
Grand Total 31,134.8 74,699.2 6,543.5 15,756.3 5,658.9 64,536.4 -6,026.6 -13,925.6 109.6 2,011.0 5,018.3 -2,360.3 42,438.5 140,717.0
16

Program This Qtr To Date This Qtr To Date This Qtr To Date This Qtr To Date This Qtr To Date This Qtr To Date This Qtr To Date To Date
Army Subtotal:
AH-64E New Build 5.1 13.6 -235.1 196.6 -165.5 127.4 - - -58.1 -710.0 - - -87.8 -156.7 -529.1
AH-64E Remanufacture 21.0 91.9 - - 30.5 -65.3 - - -374.4 3,178.3 - - 59.1 -768.2 2,436.7
AMF JTRS 3.2 -73.5 -77.2 -2,753.9 29.7 217.3 - 12.3 29.0 -2,605.6 - - -21.2 326.3 -4,877.1
AMPV 21.4 -107.0 - - 2.1 2.1 - - 49.6 75.6 - - 12.1 12.1 -17.2
CH-47F 4.0 -90.5 -157.5 780.5 10.6 -358.7 -6.5 220.4 -61.7 1,780.9 - - -2.9 180.2 2,512.8
CIRCM 5.8 5.8 - - - - - - -10.0 35.6 - - -7.8 -10.2 31.2
GMLRS/GMLRS AW 5.0 526.1 - -8,726.7 -129.9 1,381.3 - 10.8 860.0 2,516.8 - - -1.0 10.9 -4,280.8
HMS 13.8 13.7 - - 80.1 1,229.9 - - -249.3 -294.1 - - 65.2 666.3 1,615.8
IAMD 7.3 89.0 539.1 2,538.2 127.3 73.2 - 170.6 88.6 70.7 - - -73.3 -1,032.0 1,909.7
JAGM 12.9 -18.5 - - 38.0 -152.7 - - -338.4 -319.3 - - 290.3 305.7 -184.8
MQ-1C Gray Eagle 1.2 34.4 562.7 723.0 -6.6 -2.2 27.0 114.1 -295.0 -909.3 - - 302.2 203.9 163.9
PAC-3 MSE 8.2 -36.3 301.2 462.3 -88.4 -113.3 - - -1.5 79.8 - - -5.8 -0.8 391.7
PIM 10.8 -96.7 - 100.9 7.5 -8.4 - - -36.4 139.2 - - -19.2 -91.9 43.1
UH-60M Black Hawk 30.6 -334.0 -88.3 3,203.0 226.5 1,516.8 - 655.1 1,138.3 1,340.9 - - 58.5 797.5 7,179.3
WIN-T Inc 2 13.7 -84.0 - 4,156.9 172.2 486.9 - -526.8 179.8 -128.5 - - 284.7 3,410.3 7,314.8
WIN-T Inc 3 0.1 252.8 - -12,963.8 - -112.5 - -310.4 -1.4 360.1 - - - -4,194.5 -16,968.3
Subtotal 164.1 186.8 844.9 -12,283.0 334.1 4,221.8 20.5 346.1 919.1 4,611.1 - - 853.1 -341.1 -3,258.3
Navy Subtotal:
ACV 1.1 -10.6 -10.6 - - -2.5 -2.5 - - -136.1 -136.1 - - 34.3 34.3 -114.9
AGM-88E AARGM 3.7 -32.0 - 407.5 6.1 127.5 - 79.5 -3.4 196.8 - - 0.1 29.5 808.8
AIM-9X Blk II 10.3 111.9 - - -42.4 -815.8 - 300.0 -505.1 -790.7 - - 14.2 -85.0 -1,279.6
AMDR 7.3 16.5 - - 14.9 14.9 159.7 334.7 184.3 -116.4 - - -148.2 -748.6 -498.9
CEC 1.4 72.8 - -62.9 113.9 705.1 - 299.8 38.7 103.4 - - -7.2 17.0 1,135.2
CH-53K 250.9 -149.8 - 3,177.1 475.7 3,738.2 -31.9 -3.8 960.4 5,052.5 - - 298.6 579.3 12,393.5
CVN 78 - CVN 78 22.2 6,458.6 - - 21.0 860.5 - -81.2 2,146.9 738.6 - - 25.0 33.7 8,010.2
CVN 78 - EMALS 1.6 496.5 - - - - - - -303.7 1,146.7 - - - - 1,643.2
This Qtr
-541.4
-263.8
-36.5
Distribution of Cost Changes (Then-Year Dollars in Millions)As of December 31, 2016
Cost Changes Between the Baseline and Current Estimate
Economic Quantity Schedule Engineering Estimating Other Support Total
689.0
2.8
591.5
213.7
-37.3
85.2
-214.0
-12.0
734.1
-90.2
-114.9
6.5
-523.0
218.0
146.8
1,365.6
650.4
-1.3
3,135.8
1,953.7
2,215.1
-302.1
17

Program This Qtr To Date This Qtr To Date This Qtr To Date This Qtr To Date This Qtr To Date This Qtr To Date This Qtr To Date To DateThis Qtr
Distribution of Cost Changes (Then-Year Dollars in Millions)As of December 31, 2016
Cost Changes Between the Baseline and Current Estimate
Economic Quantity Schedule Engineering Estimating Other Support Total
DDG 1000 -1.7 1,827.8 - -19,092.9 - 114.3 - 66.2 414.7 3,602.3 - - - - -13,482.3
DDG 51 25.1 -3,250.1 3,895.2 68,115.2 -58.5 1,899.4 541.7 8,490.9 -118.9 15,758.2 - - - - 91,013.6
E-2D AHE 20.3 -57.9 - - -2.4 1,831.9 10.1 1,357.2 46.8 -822.8 - - 42.7 667.4 2,975.8
EA-18G 3.0 -80.6 - 5,931.7 - -13.1 - 170.0 -25.9 -353.6 - - -271.8 1,086.9 6,741.3
G/ATOR 3.2 -33.1 - - 2.6 -0.7 33.6 33.6 14.9 -78.1 - - -1.1 127.0 48.7
H-1 Upgrades 6.3 -242.8 -342.1 -386.3 1.9 -17.3 - 96.7 -45.6 453.5 - - 26.3 -17.9 -114.1
IDECM - IDECM Blocks 2/3 4.6 -6.3 - -11.2 11.2 280.5 - - -8.1 122.0 - - 4.6 51.7 436.7
IDECM - IDECM Block 4 1.1 -18.6 - 224.4 0.1 223.2 - 63.3 1.2 -70.2 - - -16.6 64.7 486.8
JPALS 1.5 1.5 - - -0.3 -0.3 - - 5.1 5.1 - - -5.3 -5.3 1.0
KC-130J 11.0 132.4 - - 28.6 876.2 - 243.0 -9.1 -1,267.4 - - -42.4 -86.2 -102.0
LCS 15.1 2,634.4 -6,970.0 -16,983.3 - 1,107.9 -619.0 1,585.0 -273.9 -4,729.9 - - - - -16,385.9
LCS MM 8.8 -125.4 - - 333.2 977.8 - -22.0 -99.6 -447.6 - - - - 382.8
LHA 6 2.1 815.7 - 7,886.7 - 9.4 - 58.5 221.5 -1,084.9 - 272.0 - - 7,957.4
LPD 17 -3.1 1,020.6 1,242.2 424.0 88.5 1,098.8 - - 313.3 6,770.6 200.9 2,479.0 - -1.5 11,791.5
MH-60R 1.8 -77.2 - 931.1 -5.7 124.4 - 393.4 -43.6 305.7 - - -67.6 -9.3 1,668.1
MIDS 1.1 18.1 235.6 2,326.0 -14.2 -71.9 -11.2 577.8 -83.4 -110.4 - - -37.5 24.6 2,764.2
MQ-4C Triton 120.5 -385.8 - 121.2 191.5 1,529.0 1,772.3 1,743.8 92.8 303.1 - - 270.6 -1,601.2 1,710.1
MQ-8 Fire Scout 21.0 -2.9 -273.2 -1,335.7 103.8 555.6 146.1 940.2 -27.9 -351.8 - - -2.6 179.8 -14.8
MUOS 2.2 -97.2 -661.5 -661.5 - 70.1 - 206.7 -226.7 -375.5 - - 217.7 217.7 -639.7
NGJ Inc 1 13.7 13.7 - - 26.7 26.7 - - -10.9 -10.9 - - 15.4 15.4 44.9
NMT 0.7 3.0 - -76.3 35.8 45.1 - 211.9 53.7 290.5 - - - - 474.2
P-8A 18.9 243.9 408.3 -1,152.1 -92.1 428.6 1,060.2 936.2 -502.4 -1,551.9 - - 81.5 -26.9 -1,122.2
SM-6 19.3 -69.8 - 2,619.6 78.4 332.9 - - 226.5 316.4 - - 90.8 428.9 3,628.0
SSC 6.1 181.7 - -1.5 235.7 214.5 - - 628.4 320.3 - - 35.5 21.0 736.0
SSN 774 23.2 5,765.6 66,260.5 73,830.4 -6,443.1 -8,100.3 4,494.0 6,459.0 -5,196.4 -7,543.6 - - 923.7 705.0 71,116.1
TACTOM 4.0 108.6 161.3 1,119.9 -8.6 254.3 2.7 69.0 221.2 1,860.8 - - 59.0 127.1 3,539.7
Trident II Missile 14.9 -411.7 - -6,719.1 - 1,896.9 - 100.8 -138.1 8,648.8 - - 75.8 2,641.8 6,157.5
117.5
-294.7
53.2
-353.2
12.3
413.0
4,284.6
223.6
1,841.8
-115.1
90.4
2,447.7
-14.2
1.0
-11.9
-7,847.8
242.4
415.0
905.7
60,061.9
439.6
-47.4
-32.8
-668.3
44.9
90.2
974.4
18

Program This Qtr To Date This Qtr To Date This Qtr To Date This Qtr To Date This Qtr To Date This Qtr To Date This Qtr To Date To DateThis Qtr
Distribution of Cost Changes (Then-Year Dollars in Millions)As of December 31, 2016
Cost Changes Between the Baseline and Current Estimate
Economic Quantity Schedule Engineering Estimating Other Support Total
V-22 26.8 -512.2 75.1 294.6 -46.3 2,495.4 346.1 1,228.1 63.8 -816.1 - - -177.4 207.2 2,897.0
VH-92A 7.6 -80.4 - - - - - - 165.4 -4.4 - - -199.3 -38.0 -122.8
Subtotal 665.9 14,278.9 64,031.4 120,926.6 -4,946.5 12,817.2 7,904.4 25,938.3 -1,959.2 25,333.0 200.9 2,751.0 1,238.8 4,640.1 206,685.1
Air Force Subtotal:
AEHF - AEHF SV 1-4 4.2 163.3 - 946.0 - 1,267.2 - 277.3 -42.4 1,844.5 - - - - 4,498.3
AEHF - AEHF SV 5-6 2.8 57.7 - - - - - - -13.6 -838.2 - - - - -780.5
AMRAAM 22.3 -279.8 - 1,437.1 80.6 2,599.1 - 1,185.7 12.3 1,388.1 - - -59.0 515.6 6,845.8
AWACS Blk 40/45 Upgrade 0.8 -6.6 - -259.0 -1.3 -23.2 - - 62.3 171.8 - - 4.1 0.2 -116.8
B-2 DMS-M 6.4 6.4 - - - - - - 78.4 180.0 - - 27.7 -195.5 -9.1
B61 Mod 12 LEP TKA -5.1 -8.7 - - - -68.4 - - -51.1 -117.5 - - - - -194.6
C-130J 4.8 81.2 96.3 11,331.1 -250.7 -661.1 - 202.2 -9.6 1,610.4 - - 18.8 2,400.0 14,963.8
C-5 RERP 0.4 -128.0 - - - - - - -84.8 -425.6 - - -39.2 -197.5 -751.1
CRH 14.6 -168.6 - - -14.6 -14.6 - - 111.2 208.4 - - -19.4 8.1 33.3
EELV 139.6 363.4 1,785.0 2,996.5 163.2 417.6 - - -5,299.0 -13,880.1 - - - - -10,102.6
EPS 0.2 4.5 - - - - - - -3.2 -11.8 - - - - -7.3
F-22 Inc 3.2B Mod 26.2 20.7 - - - - - - -102.7 -138.0 - - -0.8 -1.5 -118.8
FAB-T - FET 4.0 1.3 - - - 83.8 16.0 16.0 -1.4 -83.4 - - -0.7 0.4 18.1
FAB-T - CPT 1.1 1.3 - - 17.1 17.6 26.0 26.0 -8.8 -27.7 - - 2.6 39.6 56.8
GBS -0.1 -8.1 5.0 453.1 1.9 87.4 1.9 144.5 -9.8 -65.8 - - 0.6 23.2 634.3
GPS III 3.5 34.0 - 754.7 - - - - -87.4 -88.5 - - -36.4 467.1 1,167.3
HC/MC-130 Recap 8.7 126.5 121.1 6,439.1 -3.3 -102.3 19.2 303.1 -424.3 -2,377.3 - - 86.2 1,344.7 5,733.8
ICBM Fuze Mod 4.9 -21.7 - - - - - - -21.2 -0.4 - - - - -22.1
JASSM 18.5 107.9 - 421.7 1.5 -190.2 165.2 533.1 -7.3 865.0 - - -2.0 551.1 2,288.6
JDAM -128.1 88.8 1,126.9 6,813.4 -32.8 -153.7 - 71.5 111.6 367.2 - - -9.4 372.6 7,559.8
KC-46A 416.3 1,108.4 - - - -1.7 - - -5,153.4 -7,809.5 - - 1,080.1 -442.4 -7,145.2
MQ-9 Reaper 8.6 106.3 266.9 -443.0 117.2 195.8 -98.0 960.5 329.1 -775.3 - - 283.8 1,044.0 1,088.3
OCX 8.2 -17.4 - - - - - - 138.8 1,999.2 - - - - 1,981.8
-10.8
56.2
65.9
112.5
-56.2
288.1
-26.3
67,135.7
-38.2
-77.3
17.9
38.0
-0.5
-120.3
-140.4
-123.6
91.8
-3,211.2
-3.0
907.6
147.0
-192.4
-16.3
175.9
1,068.2
-3,657.0
19

Program This Qtr To Date This Qtr To Date This Qtr To Date This Qtr To Date This Qtr To Date This Qtr To Date This Qtr To Date To DateThis Qtr
Distribution of Cost Changes (Then-Year Dollars in Millions)As of December 31, 2016
Cost Changes Between the Baseline and Current Estimate
Economic Quantity Schedule Engineering Estimating Other Support Total
SBIRS High 5.1 57.7 - - - - - - 213.6 -210.4 - - -89.3 -255.1 -407.8
SDB II 11.7 2.1 - - 2.2 0.5 - 115.8 14.6 23.2 - - -3.7 -2.8 138.8
Space Fence Inc 1 0.1 -12.6 - - - - - - -14.3 -92.9 - - - - -105.5
WGS 1.6 23.1 - 406.7 - - - 146.1 -181.0 -492.8 - - - -0.3 82.8
Subtotal 581.3 1,703.1 3,401.2 31,297.4 81.0 3,453.8 130.3 3,981.8 -10,443.4 -18,777.4 - - 1,244.0 5,671.5 27,330.2
DoD Subtotal:
BMDS 12.8 -122.4 - 15.0 803.8 -1,005.2 299.9 50,793.5 2,110.0 -7,506.8 - - - - 42,174.1
Chem Demil-ACWA 9.5 -18.3 - - 1,869.0 2,209.6 - - 465.8 526.0 - - - - 2,717.3
F-35 - F-35 Engine 72.8 205.5 221.3 221.3 1,630.3 2,374.4 - - 1,379.6 149.3 - - 443.9 -2,408.1 542.4
F-35 - F-35 Aircraft 204.8 1,240.6 1,204.0 1,204.0 17,521.7 21,434.4 779.8 2,606.6 708.5 -9,749.2 - - 3,272.2 -6,509.7 10,226.7
JLTV 37.0 -78.0 606.3 606.3 136.1 161.5 - - -70.3 -54.6 - - -18.0 96.9 732.1
Subtotal 336.9 1,227.4 2,031.6 2,046.6 21,960.9 25,174.7 1,079.7 53,400.1 4,593.6 -16,635.3 - - 3,698.1 -8,820.9 56,392.6
Grand Total 1,748.2 17,396.2 70,309.1 141,987.6 17,429.5 45,667.5 9,134.9 83,666.3 -6,889.9 -5,468.6 200.9 2,751.0 7,034.0 1,149.6 287,149.6
129.4
24.8
-14.2
3,747.9
23,691.0
691.1
33,700.8
98,966.7
-179.4
-5,005.6
3,226.5
2,344.3
20
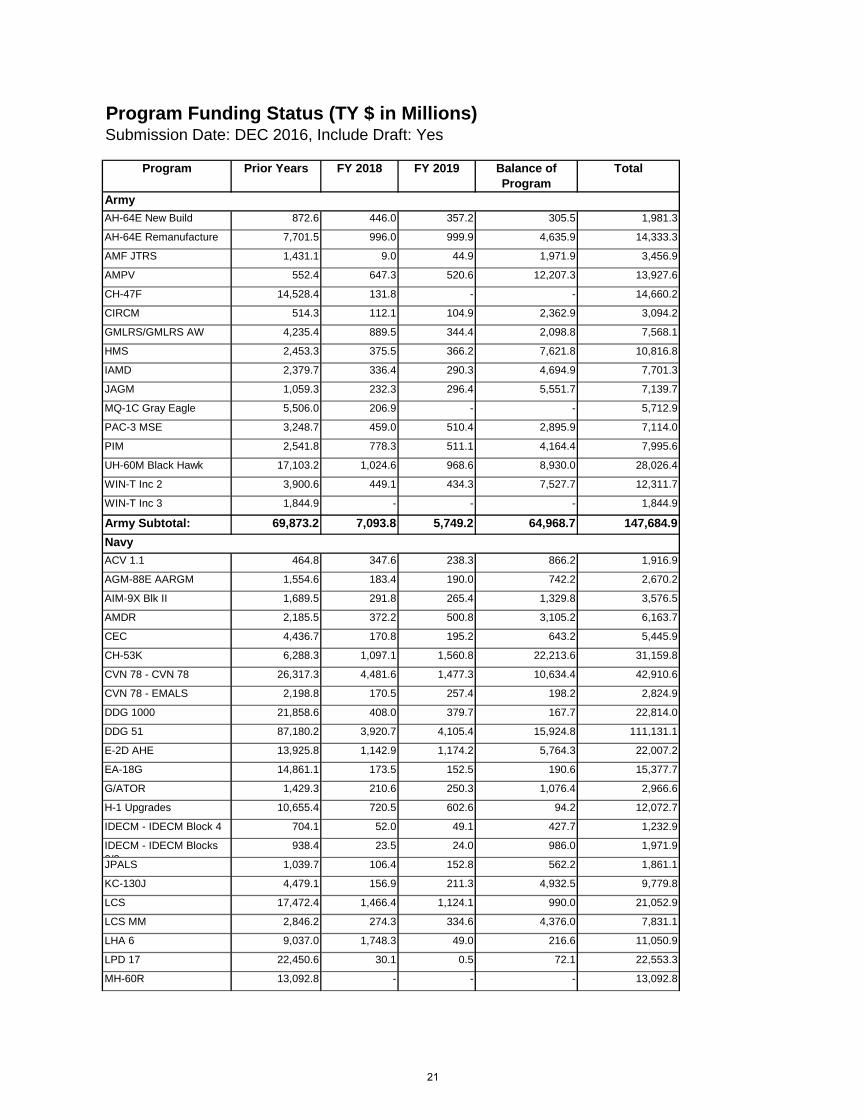
Program Prior Years FY 2018 FY 2019 Balance of Program
Total
ArmyAH-64E New Build 872.6 446.0 357.2 305.5 1,981.3
AH-64E Remanufacture 7,701.5 996.0 999.9 4,635.9 14,333.3
AMF JTRS 1,431.1 9.0 44.9 1,971.9 3,456.9
AMPV 552.4 647.3 520.6 12,207.3 13,927.6
CH-47F 14,528.4 131.8 - - 14,660.2
CIRCM 514.3 112.1 104.9 2,362.9 3,094.2
GMLRS/GMLRS AW 4,235.4 889.5 344.4 2,098.8 7,568.1
HMS 2,453.3 375.5 366.2 7,621.8 10,816.8
IAMD 2,379.7 336.4 290.3 4,694.9 7,701.3
JAGM 1,059.3 232.3 296.4 5,551.7 7,139.7
MQ-1C Gray Eagle 5,506.0 206.9 - - 5,712.9
PAC-3 MSE 3,248.7 459.0 510.4 2,895.9 7,114.0
PIM 2,541.8 778.3 511.1 4,164.4 7,995.6
UH-60M Black Hawk 17,103.2 1,024.6 968.6 8,930.0 28,026.4
WIN-T Inc 2 3,900.6 449.1 434.3 7,527.7 12,311.7
WIN-T Inc 3 1,844.9 - - - 1,844.9
Army Subtotal: 69,873.2 7,093.8 5,749.2 64,968.7 147,684.9NavyACV 1.1 464.8 347.6 238.3 866.2 1,916.9
AGM-88E AARGM 1,554.6 183.4 190.0 742.2 2,670.2
AIM-9X Blk II 1,689.5 291.8 265.4 1,329.8 3,576.5
AMDR 2,185.5 372.2 500.8 3,105.2 6,163.7
CEC 4,436.7 170.8 195.2 643.2 5,445.9
CH-53K 6,288.3 1,097.1 1,560.8 22,213.6 31,159.8
CVN 78 - CVN 78 26,317.3 4,481.6 1,477.3 10,634.4 42,910.6
CVN 78 - EMALS 2,198.8 170.5 257.4 198.2 2,824.9
DDG 1000 21,858.6 408.0 379.7 167.7 22,814.0
DDG 51 87,180.2 3,920.7 4,105.4 15,924.8 111,131.1
E-2D AHE 13,925.8 1,142.9 1,174.2 5,764.3 22,007.2
EA-18G 14,861.1 173.5 152.5 190.6 15,377.7
G/ATOR 1,429.3 210.6 250.3 1,076.4 2,966.6
H-1 Upgrades 10,655.4 720.5 602.6 94.2 12,072.7
IDECM - IDECM Block 4 704.1 52.0 49.1 427.7 1,232.9
IDECM - IDECM Blocks 2/3
938.4 23.5 24.0 986.0 1,971.9
JPALS 1,039.7 106.4 152.8 562.2 1,861.1
KC-130J 4,479.1 156.9 211.3 4,932.5 9,779.8
LCS 17,472.4 1,466.4 1,124.1 990.0 21,052.9
LCS MM 2,846.2 274.3 334.6 4,376.0 7,831.1
LHA 6 9,037.0 1,748.3 49.0 216.6 11,050.9
LPD 17 22,450.6 30.1 0.5 72.1 22,553.3
MH-60R 13,092.8 - - - 13,092.8
Program Funding Status (TY $ in Millions)Submission Date: DEC 2016, Include Draft: Yes
21
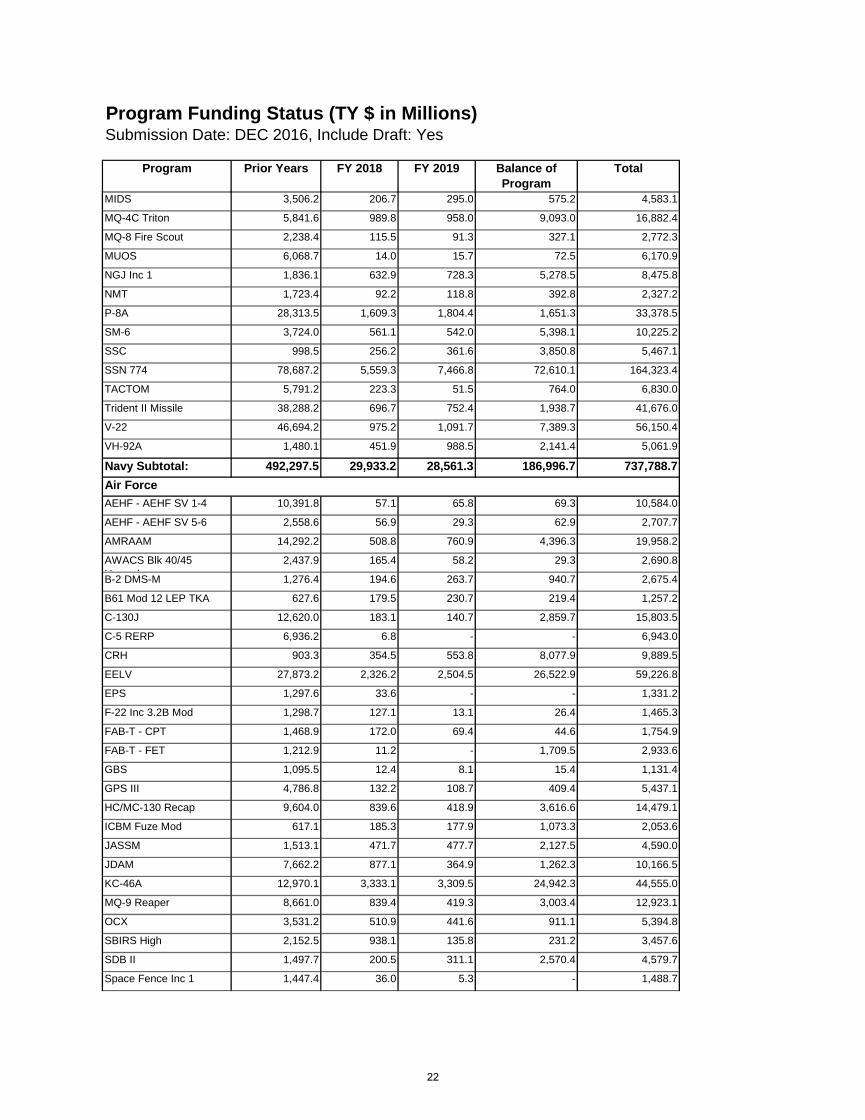
Program Prior Years FY 2018 FY 2019 Balance of Program
Total
Program Funding Status (TY $ in Millions)Submission Date: DEC 2016, Include Draft: Yes
MIDS 3,506.2 206.7 295.0 575.2 4,583.1
MQ-4C Triton 5,841.6 989.8 958.0 9,093.0 16,882.4
MQ-8 Fire Scout 2,238.4 115.5 91.3 327.1 2,772.3
MUOS 6,068.7 14.0 15.7 72.5 6,170.9
NGJ Inc 1 1,836.1 632.9 728.3 5,278.5 8,475.8
NMT 1,723.4 92.2 118.8 392.8 2,327.2
P-8A 28,313.5 1,609.3 1,804.4 1,651.3 33,378.5
SM-6 3,724.0 561.1 542.0 5,398.1 10,225.2
SSC 998.5 256.2 361.6 3,850.8 5,467.1
SSN 774 78,687.2 5,559.3 7,466.8 72,610.1 164,323.4
TACTOM 5,791.2 223.3 51.5 764.0 6,830.0
Trident II Missile 38,288.2 696.7 752.4 1,938.7 41,676.0
V-22 46,694.2 975.2 1,091.7 7,389.3 56,150.4
VH-92A 1,480.1 451.9 988.5 2,141.4 5,061.9
Navy Subtotal: 492,297.5 29,933.2 28,561.3 186,996.7 737,788.7Air ForceAEHF - AEHF SV 1-4 10,391.8 57.1 65.8 69.3 10,584.0
AEHF - AEHF SV 5-6 2,558.6 56.9 29.3 62.9 2,707.7
AMRAAM 14,292.2 508.8 760.9 4,396.3 19,958.2
AWACS Blk 40/45 U d
2,437.9 165.4 58.2 29.3 2,690.8
B-2 DMS-M 1,276.4 194.6 263.7 940.7 2,675.4
B61 Mod 12 LEP TKA 627.6 179.5 230.7 219.4 1,257.2
C-130J 12,620.0 183.1 140.7 2,859.7 15,803.5
C-5 RERP 6,936.2 6.8 - - 6,943.0
CRH 903.3 354.5 553.8 8,077.9 9,889.5
EELV 27,873.2 2,326.2 2,504.5 26,522.9 59,226.8
EPS 1,297.6 33.6 - - 1,331.2
F-22 Inc 3.2B Mod 1,298.7 127.1 13.1 26.4 1,465.3
FAB-T - CPT 1,468.9 172.0 69.4 44.6 1,754.9
FAB-T - FET 1,212.9 11.2 - 1,709.5 2,933.6
GBS 1,095.5 12.4 8.1 15.4 1,131.4
GPS III 4,786.8 132.2 108.7 409.4 5,437.1
HC/MC-130 Recap 9,604.0 839.6 418.9 3,616.6 14,479.1
ICBM Fuze Mod 617.1 185.3 177.9 1,073.3 2,053.6
JASSM 1,513.1 471.7 477.7 2,127.5 4,590.0
JDAM 7,662.2 877.1 364.9 1,262.3 10,166.5
KC-46A 12,970.1 3,333.1 3,309.5 24,942.3 44,555.0
MQ-9 Reaper 8,661.0 839.4 419.3 3,003.4 12,923.1
OCX 3,531.2 510.9 441.6 911.1 5,394.8
SBIRS High 2,152.5 938.1 135.8 231.2 3,457.6
SDB II 1,497.7 200.5 311.1 2,570.4 4,579.7
Space Fence Inc 1 1,447.4 36.0 5.3 - 1,488.7
22
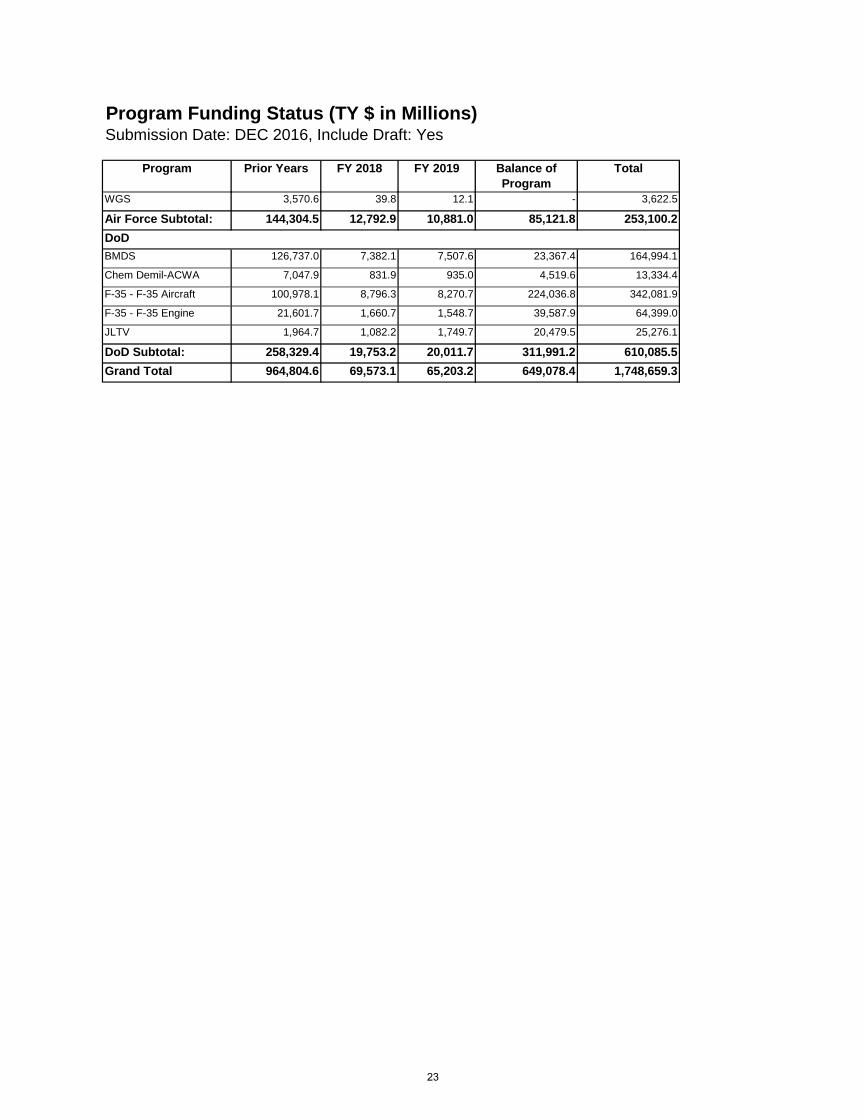
Program Prior Years FY 2018 FY 2019 Balance of Program
Total
Program Funding Status (TY $ in Millions)Submission Date: DEC 2016, Include Draft: Yes
WGS 3,570.6 39.8 12.1 - 3,622.5
Air Force Subtotal: 144,304.5 12,792.9 10,881.0 85,121.8 253,100.2DoDBMDS 126,737.0 7,382.1 7,507.6 23,367.4 164,994.1
Chem Demil-ACWA 7,047.9 831.9 935.0 4,519.6 13,334.4
F-35 - F-35 Aircraft 100,978.1 8,796.3 8,270.7 224,036.8 342,081.9
F-35 - F-35 Engine 21,601.7 1,660.7 1,548.7 39,587.9 64,399.0
JLTV 1,964.7 1,082.2 1,749.7 20,479.5 25,276.1
DoD Subtotal: 258,329.4 19,753.2 20,011.7 311,991.2 610,085.5Grand Total 964,804.6 69,573.1 65,203.2 649,078.4 1,748,659.3
23