Michigan Department of Corrections Institutional and Community Corrections.

Department of Corrections (DOC) Revocation from Post-Prison Supervision
January 2011
By
Research & Evaluation
Governor John Kitzhaber
Director Max Williams
Deputy Director Mitch Morrow

Abstract
Oregonians sentenced for felony convictions and released from jail or prison in 2005 and 2006
were evaluated for revocation risk. Those released from jail, from prison, and those served
through interstate compact were considered in the analysis. The revocation rate is lowest for the
interstate compact population and highest for the jail population; overall, 24% were revoked in
the two years after release.
Revocation risk is influenced by numerous static and demographic variables. Independent
variables common with the three populations include recidivism risk, number of arrests while on
parole or post-prison supervision (PPS), number of prior felony convictions, age, and being a
veteran. Comparing the jail and prison populations, both age and number of prior felony
convictions have similar effects for both populations. The number of arrests while on parole/PPS
has more of an effect with the jail population than those released from prison. The factors that
are important for the prison population yet are not important risk factors for the jail population
include being male, being African American, incarcerated for a violent offense, incarcerated for a
public order offense, and considered high risk at release; all of these factors increase risk for the
prison population yet are not important risk considerations for those released from jail. The
factors that have different effects in each population (i.e. associated with increased risk in one
population and decreased risk in the second population) include veteran status, prior
imprisonment, and incarceration for a property crime.
There are some demographic and static factors that influence revocation risk among the three
populations. Despite numerous similarities, differences do exist. The predictive accuracy of the
models suggests that individuals prone to revocations can be identified with some accuracy.
3

List of Tables and Appendices Chart 1. Offender Flow Through the System……………………………………..….… 6 Table 1. Number of Parole/Post-Prison Offenders Revoked to Jail or Prison…..……... 5 Table 2. Odd ratios, Chi-square estimates, and P-values for Factors Associated
with Revocation for the Interstate Compact Population………….….....11 Table 3. Odd ratios, Chi-square estimates, and P-values for Factors Associated
with Revocation for the Jail Population…………………………...........12 Table 4. Odd ratios, Chi-square estimates, and P-values for Factors Associated
with Revocation for the Prison Population……………………………..14 Table 5. Odd ratios, Chi-square estimates, and P-values for Factors Associated
with Revocation (Interstate Compact, Jail, and Prison Populations)…...16 Table 6. Factors Associated with Revocations – Comparing the Interstate
Compact and Jail Populations with the Prison Population……………...18 Table 7. Factors Associated with Revocations – Comparing the Interstate
Compact and Prison Populations with Jail Population………………….18 Table 8. Factors Associated with Revocations – Comparing the Jail and Prison
Populations with the Interstate Compact Population…………………...19 Table 9. Odds Ratios for Different Statistical Models – Offender Populations by
Themselves, Combined, and with Comparison Populations…………….21
Appendix A: Statistically Significant (P<.05) Independent variables when Estimating Revocation Risk for the Interstate Compact population(N=1062)……………………………………………………..22
Appendix B: Statistically Significant (P<.05) Independent variables when
Estimating Revocation Risk for the Jail Population (N=7324)………….24 Appendix C: Statistically Significant (P<.05) Independent variables when
Estimating Revocation Risk for the Prison Population (N=7874)………26 Appendix D: Statistically Significant (P<.05) Independent variables when
Estimating Revocation Risk for the Three Populations (N=16,262)…….29
4

Justice Research and Statistics Parole/Post-Prison Revocation Study
Introduction
The incarcerated population has increased in the United States in the last decade. Some
of this increase is attributable to sentencing legislation, population growth, adequate
funding of law enforcement and prosecution, and an increasing number of individuals
revoked to jail or prison. Each state’s incarcerated population contains individuals who
have been revoked from probation or post-prison supervision. The number incarcerated
for parole or probation violations varies dramatically among states. Oregon has a
relatively small number of individuals currently imprisoned due to a revocation. This
paper identifies the factors associated with increased risk of being revoked in Oregon.
The analyses consider revocations attributable to both new arrests and technical
violations in the two years post-release from jail or prison.
The Oregon System
The Oregon community corrections system is a partnership between the state and the
counties. The design of the community corrections system reflects 1977 legislation
known as the Community Corrections Act. The act funded programs and gave counties
the option of managing/supervising some or all offenders. Subsequent legislation in 1995
mandated counties to supervise all felons on probation or parole/post-prison supervision.
The 1995 legislation also mandated offenders sentenced to one year or less to serve their
sentences in local jails; those sentenced to more than one year served their sentences in
state prisons. Prior to the 1995 legislation, many offenders serving short prison sentences
had been revoked during supervision. The legislation provided funds to modernize
existing jails and build 1600 new jail beds. The legislation also allowed counties to
sanction offenders to a continuum of sanctions including work centers, electronic
monitoring, home arrest, day reporting, intense supervision, community service,
community work crew, and jail.
5

There are 30,000 to 35,000 offenders supervised by community corrections throughout
Oregon. About 55-60% of these offenders are on parole/post-prison supervision and
about 40% are on probation; less than 5% are incarcerated in a local jail. The Oregon
community corrections system relies on evidence-based practices and principles of risk,
need, and responsivity. The programs are intended to encourage cognitive and behavioral
changes; these programs are balanced with the Structured Sanctions system which holds
offenders accountable for their behavior or poor decisions. Offenders failing to attend
treatment, absconding from supervision, involved with drug use, or failing to complete
conditions of supervision can be sanctioned by a parole/probation officer. These “swift
and sure” sanctions consider severity of the violation, severity of the sentencing crime,
and risk of the offender. The “sanctioning grid” is used to determine the duration of the
sanction. The grid encourages consistency among parole/probation officers and balances
seriousness of the violation with length of sanction. These sanctions are imposed by the
parole/probation officer and intended to make supervision more effective, reduce crime,
minimize cost, minimize victimization, and reduce the number who are revoked to prison
or jail.
A parole officer can impose between 0-30 sanctioning units, an agency hearings officer
can impose between 31-60 units, and a court or parole board can impose between 61-90
units. A unit is considered one night in jail, one night of house arrest, one day of
residential treatment, or 16 hours of community service/work-crew. The intent is to
judiciously use sanctioning to encourage change while being progressive and fair.
According to Oregon Sentencing Guidelines, offenders with presumptive probation
sentences can be revoked for a maximum term of six months. Additionally, recent law
changes limit a probation revocation sentence to 60-days if the violation behavior did not
include a new crime. For an offender whose probationary sentence was either a departure
from a presumptive prison sentence or an optional probation sentence, the revocation
sentence is a prison term up to the maximum presumptive prison term which could have
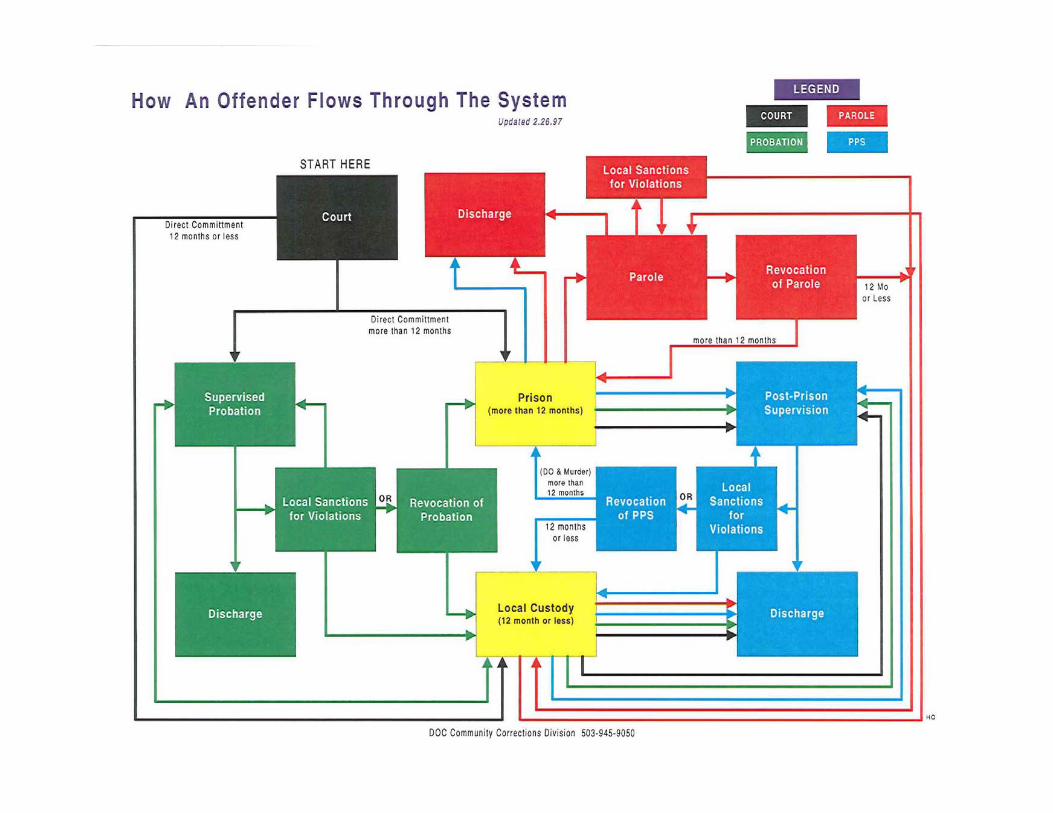
been imposed initially. Chart 1 diagrams the possible movement of offenders through the
correctional system.
6
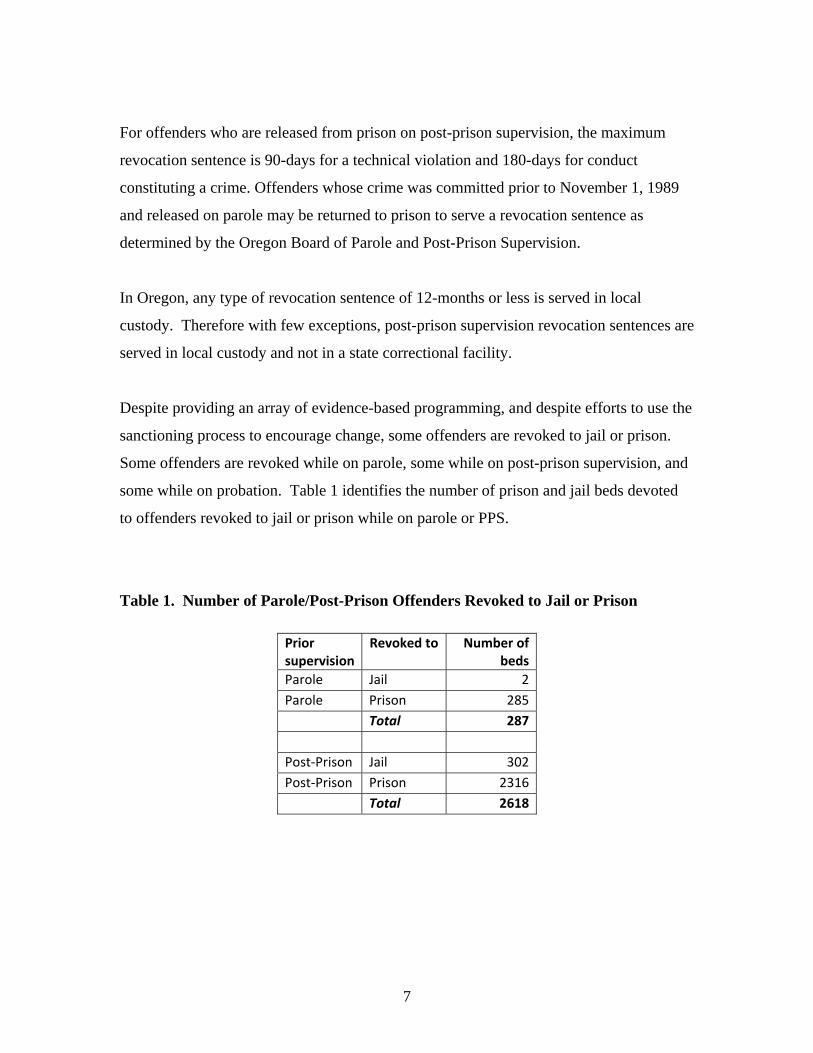
For offenders who are released from prison on post-prison supervision, the maximum
revocation sentence is 90-days for a technical violation and 180-days for conduct
constituting a crime. Offenders whose crime was committed prior to November 1, 1989
and released on parole may be returned to prison to serve a revocation sentence as
determined by the Oregon Board of Parole and Post-Prison Supervision.
In Oregon, any type of revocation sentence of 12-months or less is served in local
custody. Therefore with few exceptions, post-prison supervision revocation sentences are
served in local custody and not in a state correctional facility.
Despite providing an array of evidence-based programming, and despite efforts to use the
sanctioning process to encourage change, some offenders are revoked to jail or prison.
Some offenders are revoked while on parole, some while on post-prison supervision, and
some while on probation. Table 1 identifies the number of prison and jail beds devoted
to offenders revoked to jail or prison while on parole or PPS.
Table 1. Number of Parole/Post-Prison Offenders Revoked to Jail or Prison
7
Prior supervision
Revoked to
Number of beds
Parole Jail 2
Parole Prison 285
Total 287
Post‐Prison Jail 302
Post‐Prison Prison 2316
Total 2618
8

Table 1 identifies those incarcerated after being revoked. The 287 individuals revoked
from parole to prison/jail committed their crimes before November 1989 and are
supervised by Oregon’s Board of Parole and Post-Prison Supervision. The remaining
2618 revoked offenders occupying jail/prison beds have committed new crimes and are in
prison as a result of a new sentence; a small number of these are considered dangerous
offenders and are supervised by Oregon’s Board of Parole and Post-Prison Supervision.
Thus, most Oregon revocations from parole/post-prison supervision to jail/prison are for
new crimes and very few are for technical violations. Only about 2% of the prison beds
in Oregon are occupied by individuals revoked from parole/post-prison supervision to
prison. Conversely, about 19% of prison beds are occupied by offenders revoked from
probation to prison. A companion paper will identify the factors that increase risk of
revocation for offenders on probation.
Data and variables
The dataset includes all individuals sentenced for a felony conviction and released from
prison or jail (i.e. local control) in 2005 or 2006. Each individual is followed for 24
months after release.
All independent variables included in the logistic regression equation were provided to
the Justice Research and Statistics Association in an accompanying dataset. The
independent variables considered in the revocation risk equation include:
Age when released in 2005 or 2006 Gender Type of incarceration (local control, prison, interstate compact) Race (Caucasian, African American, American Indian or Alaskan Native, Asian
or Pacific Islander, and Hispanic) Education (highest grade achieved) Marital status Number of children Veteran status Number of prior felony arrests Number of prior misdemeanor arrests
9
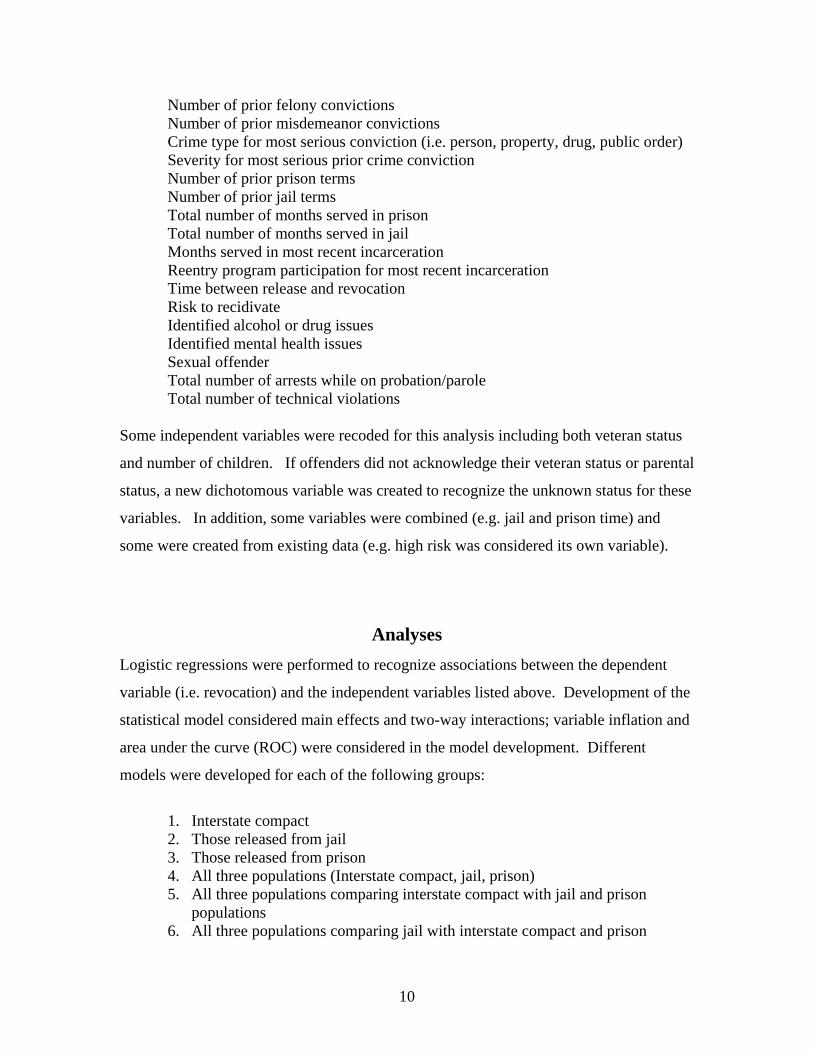
Number of prior felony convictions Number of prior misdemeanor convictions Crime type for most serious conviction (i.e. person, property, drug, public order)
Severity for most serious prior crime conviction Number of prior prison terms Number of prior jail terms Total number of months served in prison Total number of months served in jail Months served in most recent incarceration Reentry program participation for most recent incarceration Time between release and revocation Risk to recidivate Identified alcohol or drug issues Identified mental health issues Sexual offender Total number of arrests while on probation/parole Total number of technical violations
Some independent variables were recoded for this analysis including both veteran status
and number of children. If offenders did not acknowledge their veteran status or parental
status, a new dichotomous variable was created to recognize the unknown status for these
variables. In addition, some variables were combined (e.g. jail and prison time) and
some were created from existing data (e.g. high risk was considered its own variable).
Analyses
Logistic regressions were performed to recognize associations between the dependent
variable (i.e. revocation) and the independent variables listed above. Development of the
statistical model considered main effects and two-way interactions; variable inflation and
area under the curve (ROC) were considered in the model development. Different
models were developed for each of the following groups:
1. Interstate compact 2. Those released from jail 3. Those released from prison 4. All three populations (Interstate compact, jail, prison) 5. All three populations comparing interstate compact with jail and prison
populations 6. All three populations comparing jail with interstate compact and prison
10

7. All three populations comparing prison with interstate compact and jail When the three populations were combined, variance inflation estimates did increase. To
ensure the models and parameter estimates were accurate and stable, additional analyses
were performed. Results from the equation derived when combining all populations (#4
above) were compared to two other methodologies. The first comparison methodology
used stepwise regression and a random sample from all three populations (i.e. interstate
compact, jail, prison); this technique was repeated 1000 times using half the data for each
sampling. Essentially half the observations were randomly sampled and a logistic
regression equation was generated; this effort was repeated 1000 times. This sampling
technique used “sampling with replacement”. From these 1000 logistic regressions,
independent variables were assessed for statistical significance. The independent
variables identified as statistically significant (P<.05) in half the 1000 regressions were
considered for model development. Variance inflation, a correlation matrix, and the
concordance rates were used to determine the final model for these three populations.
The second comparison methodology used these same 1000 logistic regression runs. The
average of the parameter estimates from these 1000 run was used to generate individual
estimates.
To summarize, individual estimates of risk were derived from three models:
1. Traditional model development considering variance inflation and the
Receiver-Operator Characteristic (i.e. ROC or area under the curve).
2. Sample half the observations and resample 1000 times; identify statistically
significant independent variables and generate one equation.
3. Sample half the observation and resample 1000 times; use the average of the
parameter estimates to generate one equation.
Results and discussion
There were 16,262 observations included in the dataset; this included 1064 interstate
compact cases, 7324 individuals released from jail, and 7874 individuals released from
prison. The revocation rates for each group are:
11

Group Revocation rate
Interstate compact 16.7% Released from jail 26.4% Released from prison 22.7% All three populations 24.0%
Interstate Compact Population: Local and state jurisdictions will convict and
incarcerate those who have offended within their jurisdiction. Despite this preference to
incarcerate and convict where the crime was committed, many complete their parole or
post-prison supervision (PPS) where they resided before their incarceration. The
preference to transition near your home improves the likelihood of successful transition.
Those considered as “interstate compact” were convicted in another state but are
transitioning in Oregon. Some of the population recidivate and some do not; some are
revoked and some are not. Of the three populations considered in this analysis, the
interstate compact population has the lowest revocation rate (16.7%). Most are male
(80%), most have prior felony convictions (71%), many are arrested while on parole or
post-prison supervision (42%), most would benefit from drug treatment (68%), but only a
few are veterans (8%) or African Americans (5%). About half are considered low risk,
about ¼ medium risk, and about ¼ are considered high risk to recidivate (Appendix A).
About 58% have two or fewer prior felony convictions and another 24% have five or
more. The age of this population is normally distributed. The most common age
category is 31-35 years (19.1%) and nearly all are between 21 and 45 years. About 13%
are older than 45 and only 3% are less than 21 years.
Particular offender characteristics from the interstate compact population are associated
with higher risk for revocation – higher risk to recidivate, number of arrests while on
parole/post-prison supervision (PPS), being male, number of prior felony convictions,
age, being African American, and being a veteran (Table 2). Factors associated with
reduced risk include those with A&D issues and those who are older. The most
12

important factors associated with revocations are risk level, number of felony
convictions, age, and number of arrests while on parole/PPS. Increasing one level in risk
(i.e. from low to medium or from medium to high risk) increases an offender’s risk by
42%. The number of prior felony convictions does influence the likelihood someone is
revoked. For every prior felony conviction, the likelihood of a revocation increases by
23%. For every arrest while on parole/PPS, the likelihood of a revocation increases by
33%. For each year older, the risk decreases by 4%. Males, African Americans, and
veterans are about twice as likely to be revoked than females, non-African Americans,
and non-veterans, respectively. Interestingly, these same factors except A&D treatment,
are significantly associated with revocation risk for those released from jails or those
released from prison.
Table 2. Odd Ratios, Chi-square estimates, and P-values for Factors Associated
with Revocation for the Interstate Compact Population
Effect Odds ratio Chi-square P-value
Risk level 0.583 26.0 <.0001 Number arrests on parole/PPS 1.334 20.5 <.0001 Gender (male) 2.483 9.3 .0022 Number felony convictions 1.231 22.8 <.0001 Age 0.958 13.6 .0002 Needs drug treatment 0.605 6.1 .0136 African American 2.078 4.7 .0306 Veteran 1.942 4.0 .0445
Jail Population: Revocations can occur for individuals on probation or parole/PPS. For
those on parole/PPS, the individuals were either in a local jail serving a felony sentence
or released from prison. Those incarcerated for a felony conviction are sentenced to jail
if the sentence is one year or less. If the imposed sentenced exceeds one year, the
individual serves their time in an Oregon prison. The recidivism rates and some
demographic variables do differ between the jail and prison populations.
13

Nearly half the jail population is between 18-30 years (Appendix B) and only 11% are
older than 45. The most common age category is 21-25 years (23.1%) followed by 26-30
years (18.5%), 31-35 years (15.5%), and 36-40 years (13.9%). Very few have no prior
felony convictions (7%) and nearly one-quarter have five or more convictions. About
21% have had prior visits to jail and 22% have been to prison. Half are not arrested
while on parole/PPS but 25% are arrested once. Although about one-third of those
released from jail are considered low risk, 43% are categorized as high risk. Of those
leaving jail during 2005 and 2006, about 21% were incarcerated for property crimes. The
final independent variable deemed important when determining revocation risk is
veterans’ status. Considerable assessment and paperwork are completed when entering a
jail or prison. Some individuals fail to respond to particular questions such as veteran
status or parenthood. Failure to answer the parenthood question may reflect an
individual’s concern over child support. Failure to answer one’s veteran status may have
different connotations. Responding to the veteran status questions is associated with
increased risk to be revoked and about 70% do not respond to the veterans’ status
question.
There are eight factors used to assess risk of revocation for those leaving jail (Table 3).
Table 3. Odd Ratios, Chi-square estimates, and P-values for Factors Associated
with Revocation for the Jail Population
Effect Odds ratio Chi-square P-value
Age 0.975 44.8 <.0001 Unknown veteran status 0.126 878.3 <.0001 Number felony convictions 1.100 22.1 <.0001 Previously imprisoned 0.705 16.8 <.0001 Previously jailed 1.173 4.3 .0389 Jailed for property crime 0.842 5.0 .0248 Risk level 0.095 51.0 <.0001 Risk quadratic 1.171 42.9 <.0001 Number arrests on parole/PPS 1.194 62.9 <.0001
14

Those responding to the veterans’ status questions are more likely to be revoked; this
may or may not suggest that being a veteran is associated with increased risk. The other
variables associated with increased revocation risk include the number of arrests while on
parole/PPS, those previously jailed, and the number of prior felony convictions. For each
arrest while on parole/PPS, the revocation risk increased by 19%. For each prior jail
sentence, revocation risk increases by 17%; for every prior felony conviction, risk
increases 10%.
The relationship between risk level and likelihood of revocation is not linear. For
changes between low and medium risk, revocation risk increases dramatically. The
increase from low to medium risk is considerably larger than the increase in risk when
moving from medium to high risk.
Property offenders are a small portion of the jail population. Those serving jail sentences
for property crimes are actually 16% less likely to be revoked. This result could reflect
more about the severity of the crime than anything else. Interestingly, those who have
served prison time are actually less likely (~30%) to be revoked. This could reflect
compliance or other factors not included in the statistical model.
Prison Population: Those released from jail or prison in 2005 and 2006 are all
candidates for being revoked. For those who were released from prison, most tend to be
young (Appendix C). As with the jail population, the most common age category is 21-
25 years (18.7%), followed by 26-30 years (17.8%), 31-35 years (14.9%), 36-40 years
(14.5%), and 41-45 years (13.3%); about 4% are between 16 and 20 years. About 17%
are older than 45 years. Most are male (89%), most identify their parenthood status
(82%), and most identify their veteran status (88%). Many entering a jail do not provide
their veteran or parenthood status; many entering prison are likely to recognize their
parenthood and veteran status. Recognition of parenthood and veteran status could
reflect more about differences in jail and prison intake assessments than an offender’s
willingness to provide information.
15
About 9% of those released from prison in 2005 and 2006 are African Americans, about
23% were incarcerated for violent crimes, about 28% for property crimes, and 12% for
public crimes. About 1/3 have no prior felony convictions and about ¼ have one or two
priors; another 25% have five or more prior felony convictions. After being released
from prison, most offenders are not arrested (56%) in the two years post-release,
however, about 1/3 are arrested once or twice. About 1/3 are considered high risk after
leaving prison. Some of those leaving prison have been in prison before (27%). The
average and median periods of incarceration are 30 and 17 months, respectively. The
difference between the average and median length of stay would suggest most are
incarcerated for short periods although some have long sentences.
The risk of revocation for those leaving prison is influenced by veteran status, number of
arrests while on parole/PPS, risk at release, and age. Knowing the offenders veteran
status is associated with a lower revocation rate. This could reflect compliance with
completing forms or other factors. Risk of revocation increases by 30% for each
additional arrest while on parole/PPS (Table 4); although most are not arrested while on
parole/PPS, nearly one-quarter are arrested multiple times. About 1/3 of the offenders
released from prison are identified as high risk; these offenders are twice as likely to be
revoked as offenders deemed low or medium risk. Age of the offender is associated with
revocation risk. Similar to those released from jail, every year older translates to a 4%
decline in revocation risk. All other independent variables included in the model are
associated with increased risk to be revoked. Males are nearly twice as likely to be
revoked, African Americans are 34% more likely, violent offenders are 24% more likely,
property offenders are 32% more likely, those incarcerated for a public order offense are
18% more likely. In addition, for every month incarcerated, the likelihood of being
revoked increased by 1.1%.
Risk equations generated for particular populations are useful if the populations differ
substantially or if the different types of offenders (i.e. interstate, jail, and prison) are
served by different types of parole or probation officers. Conversely, one equation
16

Table 4. Odd ratios, Chi-square Estimates, and P-values for Factors Associated
with Revocation for the Prison Population
Effect Odds ratio Chi-square P-value
Age 0.964 115.3 <.0001 Gender (male) 1.900 31.8 <.0001 African American 1.344 9.4 .0022 Veteran unknown 0.131 116.9 <.0001 Prior felony convictions 1.093 28.4 <.0001 Incarcerated for violent crime 1.237 9.0 .0027 Prior imprisonment 1.727 54.3 <.0001 Number arrests on parole/PPS 1.300 152.3 <.0001 Imprisoned for property crime 1.317 15.5 <.0001 Imprisoned for public crime 1.182 3.2 .0740 Months incarcerated 1.011 81.1 <.0001 Deemed high risk at release 2.083 140.8 <.0001
may be more useful if offender populations are similar or if revocations are determined
by the same group (e.g. parole/probation officers) using the same criteria. A single
equation was generated for the combination of the three offender populations considered
in this analysis.
Combining the Three Offender Populations: The demographic profile that includes
interstate compact, the jail population, and those leaving prison is in Appendix D. There
were 16,262 individuals who started parole or post-prison supervision in 2005 or 2006.
Only 21% had no prior felony conviction but one-quarter had five or more felony
convictions. About 38% of offenders do not identify their veteran status and about 36%
are deemed high risk at release. About 41% do not provide their parenthood status, and
about 85% are male. About 9% are African American and 9% are married. About 22%
were incarcerated for violent crimes and 22% have been previously jailed. The group
tends to be young including 25% who are less than 26 years and nearly ¾ are age 40 or
less; only 6% are older than 50 years.
17

Table 5. Odd ratios, Chi-square Estimates, and P-values for Factors Associated
with Revocation (Interstate Compact, Jail, and Prison Populations)
Effect Odds ratio Chi-square P-value
Number arrests on parole/PPS 1.267 268.4 <.0001 Unknown veteran 0.326 539.5 <.0001 Deemed high risk at release 2.046 293.2 <.0001 No. prior felony convictions 1.160 179.3 <.0001 Age 0.966 220.3 <.0001 Gender (male) 1.323 20.9 <.0001 African American 1.338 18.5 <.0001 Violent offense 1.186 13.3 .0003 Married 0.776 12.1 .0005 Prior time in jail 1.108 4.4 .0368 The demographic factors associated with revocation include veteran status, those
identified as high risk to recidivate, number of arrests while on parole/PPS, age, and
number of prior felony convictions (Table 5.). The demographic factors associated with
increased risk include the following: considered high risk to recidivate, being male,
number of arrests on parole/PPS, being African American, incarcerated for a violent
offense, and served time in jail. Factors associated with lower risk of revocation include
being married, older, and not identifying their veteran status.
Combining all three offender populations can be useful to identifying particular offenders
who are higher risk to be revoked. This single equation also seems appropriate for the
current parole/PPS system in Oregon. Essentially all three groups of offenders –
interstate compact, those leaving jail, and those leaving prison – are not considered
unique in probation/parole offices. Although each offender population maybe scrutinized
slightly differently, the criteria for revocation are similar among the three groups.
Combining groups can also create some statistical issues. The variable inflation
estimates for some variables are increased when combining the groups. Two additional
methodologies were employed to ensure the association among independent variables did
not provide misleading parameter estimates.
18
The two methodologies use multiple samplings of the 16,262 observations. One
methodology considered only the independent variables recognized as being statistically
significant with 500 of the 1000 samples. The second methodology averaged the
parameter estimates from 1000 sampling runs. Each sample used about half the 16,262
observations from the three offender populations.
The correlations among individual estimates for the three models was high (>.97). The
parameter estimates derived from the original model are very similar to their estimates
that averaged the parameters from the 1000 runs. The parameter estimates generated
from using the statistically significant variables in 500 of the 1000 runs tend to be more
conservative; the effects of each independent variable tends to be lower than those
derived from the other two methodologies.
Comparing Revocation Rates Among the Three Offender Populations: Table 6,
Table 7, and Table 8 consider all three populations simultaneously. Statistical analyses
use comparison populations when quantifying differences among the populations. Table
6 compares the interstate compact and jail populations with those who have been released
from prison. Table 7 compares the interstate and prison population with those released
from jail. Table 8 allows for the comparison of the jail and prison populations by using
the interstate compact population as the standard.
When using the prison population as the comparison group, the interstate compact
population is 31% less likely to be revoked while those released from jail are 185% more
likely to be revoked. Using the jail population as the standard, interstate compact
offenders are 76% less likely to be revoked and the prison population is 65% less likely.
If you use the interstate compact population as the standard, those released from jail and
prison are 313% and 45% more likely to be revoked, respectively.
The revocation rates for the three groups are 16.7% for interstate compact, 26.4% for
those leaving jail, and 22.7% for those leaving prison. The most notable differences are
between jail/prison populations and the interstate compact population. The differences
19

Table 6. Factors Associated with Revocations – Comparing the Interstate Compact
and Jail Populations with the Prison Population
Effect Odds ratio Chi-square P-value
Number arrests on parole/PPS 1.260 247.8 <.0001 Veteran status unknown 0.158 950.2 <.0001 Deemed high risk at release 1.877 216.9 <.0001 Prior felony convictions 1.121 98.1 <.0001 Age 0.972 140.6 <.0001 Gender (male) 1.370 25.5 <.0001 Race (African /American) 1.313 15.3 .0001 Incarcerated for violent crime 1.143 7.8 .0052 Married 0.790 10.0 .0016 Prior jail incarceration 1.128 5.8 .0157 Interstate compact 0.691 16.8 .0001 Jail 2.853 402.3 <.0001 between the prison and jail populations are relatively small, yet the odds ratio that
compares the prison and jail populations is 2.91. If you include only the jail and prison
populations, the odds ratios range between 2.86 and 3.63. The 2.86 reflects only the
Table 7. Factors Associated with Revocations – Comparing the Interstate Compact
and Prison Populations with Jail Population
Effect Odds ratio Chi-square P-value
Number arrests on parole/PPS 1.260 247.8 <.0001 Veteran status unknown 0.158 950.2 <.0001 Deemed high risk at release 1.877 216.9 <.0001 Prior felony convictions 1.121 98.1 <.0001 Age 0.972 140.6 <.0001 Gender (male) 1.370 25.5 <.0001 Race (African /American) 1.313 15.3 .0001 Incarcerated for violent crime 1.143 7.8 .0052 Married 0.790 10.0 .0016 Prior jail incarceration 1.128 5.8 .0157 Interstate compact 0.242 216.4 .0001 Prison 0.350 402.3 <.0001
20

comparison between jail and prison populations; the higher odds ratio considers time
since release. Thus the initial risk after release approximates 3 and that difference
increases as time is considered in the model.
Table 8. Factors Associated with Revocations – Comparing the Jail and Prison
Populations with the Interstate Compact Population
Effect Odds ratio Chi-square P-value
Number arrests on parole/PPS 1.260 247.8 <.0001 Veteran status unknown 0.158 950.2 <.0001 Deemed high risk at release 1.877 216.9 <.0001 Prior felony convictions 1.121 98.1 <.0001 Age 0.972 140.6 <.0001 Gender (male) 1.370 25.5 <.0001 Race (African /American) 1.313 15.3 .0001 Incarcerated for violent crime 1.143 7.8 .0052 Married 0.790 10.0 .0016 Prior jail incarceration 1.128 5.8 .0157 Jail 4.130 216.4 .0001 Prison 1.448 16.8 <.0001
Table 9 provides the statistically significant odds ratios from the seven different statistical
models. The seven models are:
1. Interstate compact 2. Those released from jail 3. Those released from prison 4. All three populations (Interstate compact, jail, prison) 5. All three populations comparing interstate compact with jail and prison
populations 6. All three populations comparing jail with interstate compact and prison 7. All three populations comparing prison with interstate compact and jail
The first four models use different datasets to generate the estimates. The final three
models use the same dataset to compare the three offender populations; the estimates will
be identical for all models except those for jail, prison, and interstate compact. Empty
21

cells in Table 9 identify non-significant (P>.05) parameters for that model. When
comparing models, readers should consider ~1000 observations were used to generate
estimates for the compact population, 7000-8000 observations were used to generate
estimates for the jail and prison populations, and ~16000 observations were used to
generate estimates for models including all offender populations.
Estimates from these models would suggest the following:
Revocation risk is approximately 3 times more likely for those released from jail
versus those released from prison Risk of recidivism is an important variable for estimating revocation risk in
Oregon; most offenders “revoked” from parole or PPS are incarcerated as a result of being sentenced for a new crime
Older offenders are less likely to be revoked (~3% lower per year) For each additional arrest while on parole/PPS, revocation risk increases 25-30% African Americans are ~30% more likely to be revoked Time in prison may increase the likelihood of revocation (~1.1% per month
incarcerated) Prior time in jail increases revocation risk by 10-15% Males are more likely to be revoked (>30% more likely) Married offenders are 15-20% less likely to be revoked Violent offenders are 10-15% more likely to be revoked; the risk could be higher
for those released from prison For each prior felony conviction, revocation risk increases by 15% High risk offenders are twice as likely to be revoked Recognition of veteran and parenthood status maybe useful for assessing revocation risk.
22

Table 9. Odds Ratios for Different Statistical Models – Offender Populations by Themselves, Combined, and with Comparison Populations
Compared with Effect Compact Jail Prison All Compact Jail Prison
Age 0.96 0.98 0.96 0.97 0.97 0.97 0.97 No. arrests on parole/PPS 1.33 1.19 1.30 1.27 1.26 1.26 1.26 African American 2.08 1.34 1.34 1.31 1.31 1.31 Interstate compact 0.24 0.69 Jail 4.13 2.85 Prison 1.45 0.35 Time incarcerated 1.01 Incarcerated for drugs 0.61 Incarcerated for property 0.84 1.32 Incarcerated for public 1.18 Prior jail time 1.17 1.11 1.13 1.13 1.13 Gender (male) 2.48 1.90 1.32 1.37 1.37 1.37 Married 0.78 0.79 0.79 0.79 Incarcerated for violence 1.24 1.19 1.14 1.14 1.14 Prior felony conviction. 1.23 1.10 1.09 1.16 1.12 1.12 1.12 Prior prison time 0.70 1.73 Deemed high risk 2.08 2.05 1.88 1.88 1.88 Risk level (1=high, 3=low) 0.58 0.10 Risk quadratic 1.72 Veteran status unknown 1.94 0.13 0.13 0.33 0.16 0.16 0.16
Area under the curve .775 .804 .770 .758 .781 Note: Hazard ratios for the Compact column refer to the analysis with only compact offenders Hazard ratios for the Jail column refer to the analysis with offenders released from jail Hazard ratios for the Prison column refer to the analysis with offenders released from prison Hazard ratios for the All column refer to the analysis with all offenders Hazard ratios for the column Compared to Compact refer to all offenders Hazard ratios for the column Compared to Jail refer to all offenders Hazard ratios for the column Compared to Prison refer to all offenders
23

Appendix A: Statistically Significant (P<.05) Independent Variables
when Estimating Revocation Risk for the Interstate Compact Population (N=1062)
Risk level Percentage of Population
High (1) 24.1 Medium (2) 22.5 Low (3) 53.4
Number arrests on parole/PPS Percentage of Population
0 58.0 1 22.8 2 9.0 3 4.2 4 3.2 5 2.7
Gender Percentage of Population Female 19.6 Male 80.4 Number of Prior Felony Convictions Percentage of Population 0 29.0 1 14.7 2 14.5 3 9.2 4 8.7 5 9.4 5+ 14.6
24

Appendix A (cont.): Statistically Significant (P< .05) Independent Variables when Estimating Revocation Risk for the Interstate Compact
Population (N=1062) Age Percentage of population Cumulative Percent 18-20 3.2 3.2 21-25 15.2 18.4 26-30 18.8 37.2 31-35 19.1 56.3 36-40 15.1 71.4 41-45 15.1 86.5 46-50 7.8 94.7 51-64 5.3 100.0
Would benefit from drug treatment Percentage of Population No 67.5 Yes 32.5 African American Percentage of Population African American 5.0 Other race 95.0 Veteran Percentage of Population Yes 8.0 No 92.0
25
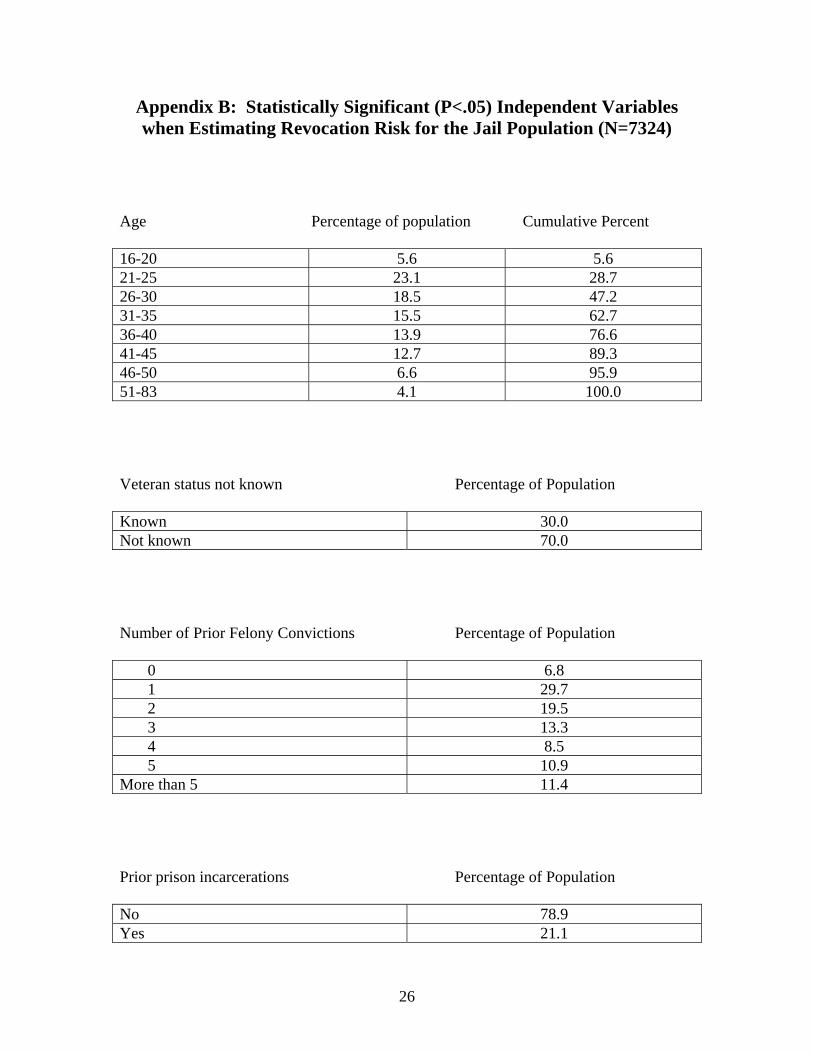
Appendix B: Statistically Significant (P<.05) Independent Variables when Estimating Revocation Risk for the Jail Population (N=7324)
Age Percentage of population Cumulative Percent 16-20 5.6 5.6 21-25 23.1 28.7 26-30 18.5 47.2 31-35 15.5 62.7 36-40 13.9 76.6 41-45 12.7 89.3 46-50 6.6 95.9 51-83 4.1 100.0 Veteran status not known Percentage of Population Known 30.0 Not known 70.0 Number of Prior Felony Convictions Percentage of Population 0 6.8 1 29.7 2 19.5 3 13.3 4 8.5 5 10.9 More than 5 11.4 Prior prison incarcerations Percentage of Population No 78.9 Yes 21.1
26

Appendix B (cont.): Statistically Significant (P<.05) Independent Variables when Estimating Revocation Risk for the Jail Population
(N=7324) Prior jail visit Percentage of Population No 78.3 Yes 21.7 Incarcerated for property crime Percentage of Population No 79.3 Yes 20.7 Risk Level Percentage of Population High (1) 43.2 Medium (2) 23.1 Low (3) 33.7 Number of arrests on parole/PPS Percentage of Population 0 49.3 1 25.0 2 12.8 3 6.1 4 3.3 5 3.6
27
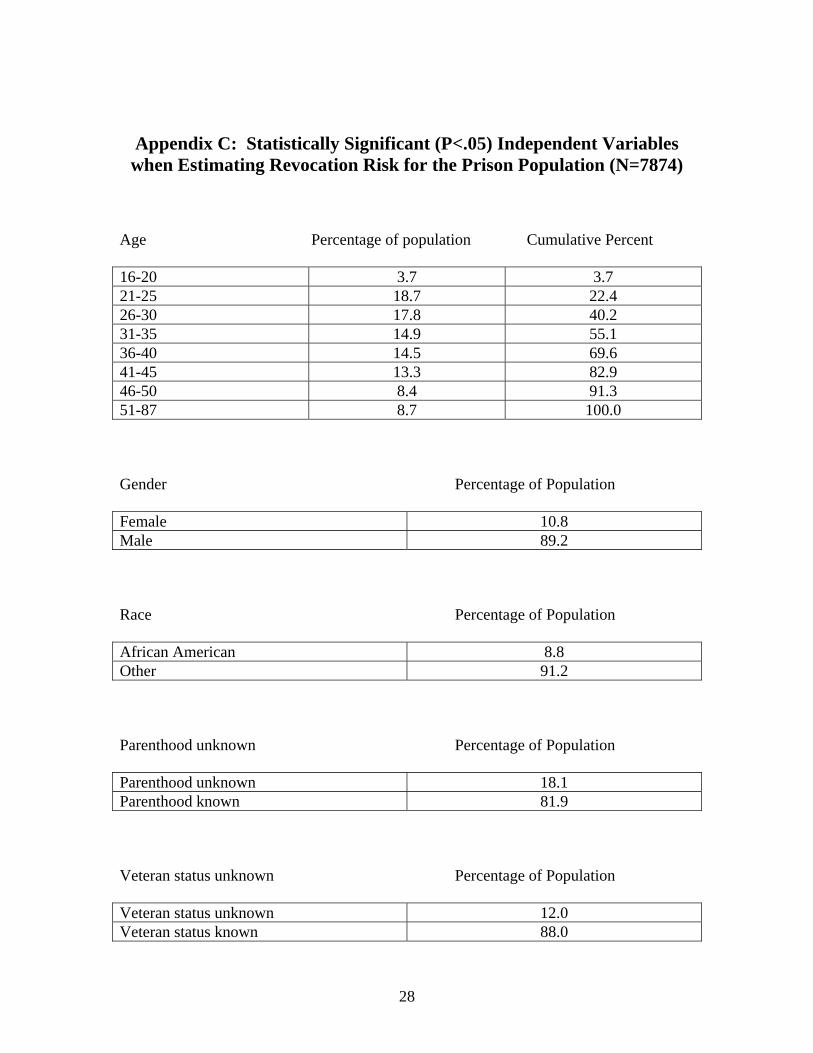
Appendix C: Statistically Significant (P<.05) Independent Variables when Estimating Revocation Risk for the Prison Population (N=7874)
Age Percentage of population Cumulative Percent 16-20 3.7 3.7 21-25 18.7 22.4 26-30 17.8 40.2 31-35 14.9 55.1 36-40 14.5 69.6 41-45 13.3 82.9 46-50 8.4 91.3 51-87 8.7 100.0 Gender Percentage of Population Female 10.8 Male 89.2 Race Percentage of Population African American 8.8 Other 91.2 Parenthood unknown Percentage of Population Parenthood unknown 18.1 Parenthood known 81.9 Veteran status unknown Percentage of Population Veteran status unknown 12.0 Veteran status known 88.0
28

Appendix C (cont.): Statistically Significant (P<.05) Independent Variables when Estimating Revocation Risk for the Prison Population
(N=7874) Number of Prior Felony Convictions Percentage of Population 0 33.0 1 14.9 2 11.9 3 9.2 4 6.7 5 9.4 More than 5 14.9 Incarcerated for a violent crime Percentage of Population No 76.7 Yes 23.3 Prior prison incarceration Percentage of Population No 73.0 Yes 27.0 Number arrests on parole/PPS Percentage of Population 0 56.1 1 21.9 2 10.4 3 5.3 4 2.8 5 3.6
29

Appendix C (cont.): Statistically Significant (P<.05) Independent
Variables when Estimating Revocation Risk for the Prison Population (N=7874)
Incarcerated for a property crime Percentage of Population No 71.7 Yes 28.3 Incarcerated for a public order crime Percentage of Population No 87.9 Yes 12.1 Deemed high risk at release Percentage of Population No 67.7 Yes 32.2 Average time incarcerated 30.3 months Median time incarcerated 16.8 months
30

Appendix D: Statistically Significant (P<.05) Independent Variables
when Estimating Revocation Risk for the Three Populations (N=16,262) Number arrests on parole/PPS Percentage of Population 0 53.2 1 23.3 2 11.4 3 5.6 4 3.0 5 3.5 Veteran status Percentage of Population Known 62.5 Unknown 37.5 Deemed high risk at release Percentage of Population No 63.7 Yes 36.2 Number of Prior Felony Convictions Percentage of Population 0 21.0 1 21.5 2 15.5 3 11.0 4 7.6 5 10.1 More than 5 13.3
31

Appendix D (cont.): Statistically Significant (P<.05) Independent
Variables when Estimating Revocation Risk for the Three Populations (N=16,262)
Age Percentage of Population Cumulative Percent 16-20 4.5 4.5 21-25 20.5 25.0 26-30 18.2 43.2 31-35 15.4 58.6 36-40 14.3 72.9 41-45 13.1 86.0 46-50 7.6 93.6 51-87 6.4 100.0 Gender Percentage of Population Female 15.5 Male 84.5 Race Percentage of Population African American 8.8 Other 91.2 Parental status Percentage of Population Known 58.7 Unknown 41.3 Incarcerated from a violent crime Percentage of Population No 77.7 Yes 22.3
32

33
Appendix D (cont.): Statistically Significant (P<.05) Independent Variables when Estimating Revocation Risk for the Three Populations
(N=16,262) Married Percentage of Population No 91.4 Yes 8.6 Prior jail incarceration Percentage of Population No 77.7 Yes 22.3