Department of Census and Statistics, Sri Lanka 2013 report.pdf · · 2015-07-20Department of...
92
Department of Census and Statistics, Sri Lanka
Transcript of Department of Census and Statistics, Sri Lanka 2013 report.pdf · · 2015-07-20Department of...
Department of Census and Statistics, Sri Lanka

Department of Census & Statistics Sri Lanka
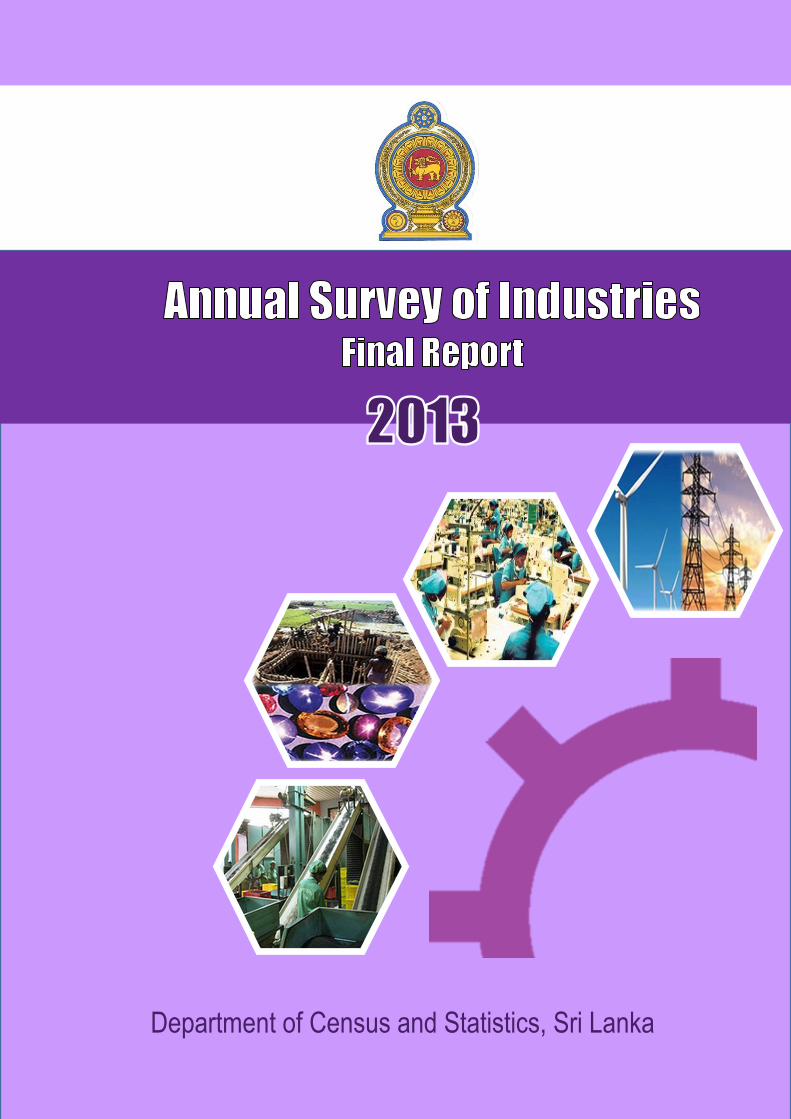
ANNUAL SURVEY OF INDUSTRIES
FINAL REPORT
2013
Department of Census and Statistics, Sri Lanka

ISBN
Published in 2015
Annual Survey of Industries - 2013
i
PREFACE
The Department of Census and Statistics (DCS) continues to conduct the Annual Survey of Industries
(ASI) which commenced in 1984, replacing the Annual Survey of Manufacturing Industries and covers all
activities categorized under the three industrial divisions, namely Mining and Quarrying, Manufacturing
and Generation and Distribution of Electricity, Gas and Water.
This report provides estimates for important industrial indicators in respect of all the industrial
establishments which had been included in the register of industrial establishments for the year 2012.
Information has been adjusted for non-responding establishments and the sample data have been
inflated.
User comments on this survey are greatly appreciated.
Dr. A.J. Satharasinghe,
Director General
Department of Census & Statistics.
No.306/71,
Polduwa Road,
Battaramulla.
26 /06/2015.
Annual Survey of Industries - 2013
ii
ACKNOWLEDGEMENT
The planning, data collection, data processing, tabulation and preparation of this report were done by
the staff of the Industry, Construction, Trade and Services Division under the overall guidance of Mr.
J.A.P. Balasooriya, Director of the division. Data collection and manual data processing were done under
the supervision of Mrs. U. Maheshwaran, Deputy Director and Mr. M.D.M. Fernando, Mr. D.M.N.
Bandara, Mrs. B.G. Kumari Premalatha, Senior Statisticians, and Mr. R.D.N. Premawansa, Mr. H.R.S.L.
Ranathunga, Mrs. G..K.D.H. Menike Statisticians.
The Computer assisted Data Processing using the software package SQL Server was done by Mr. R. M. P.
Dharmapriya, ICTA and the Statistical tables were obtained using the SPSS/ PC+.by Mr. R.D.N.
Premawansa, Statistician and Mrs. U.V.R.S. Gunawardane, Statistical Officer. Mrs U.V.R.S.
Gunawardana was totally responsible for correction of error printouts, preparing the statistical tables for
report and finalizing the report under the Supervision of Mr. G. Jinadasa, Statistician. Mr. Priyadarshana
Dharmawardena, Senior Statistician contributed by overall editing of the report.
Data collection at the follow up stage was done by the field staff attached to the Divisional Secretariat
Divisions and Districts under the supervision of District Heads. In addition, the Statistical Officers/
Statistical Assistants/Data Entry Operators/Coding Clerks of the Industry, Construction, Trade and
Service Division of the Department also engaged in data collection activities under the supervision of
Senior Statisticians/ Statisticians.
The corporation given by the responding establishments by way of providing their information to make
this survey success, is very much appreciated.

Annual Survey of Industries - 2013
iii

Annual Survey of Industries - 2013
iv
Content
Page No.
Preface ……………………………………………………………………………………………………………… i
Acknowledgement ……………………………………………………………………………………………. iii
List of Tables …………………………………………………………………………………………………….. vii
List of Figures ……………………………………………………………………………………………………. ix
1. Introduction 1
1.1 Background
1.2 Objectives
1
1
1.3 Scope and coverage 1
2. Methodology 2 - 4
2.1 The Questionnaire
2.2 Data Collection
2.3 Reference Period
2.4 Survey Design
2.5 Determination Of Weights
2
2
3
3
3
3. Concepts and Definitions 5 - 8
3.1 Statistical Unit
3.2 Output
3.3 Inputs
3.4 Value Added
3.5 Fixed Capital Assets
3.6 Employment and Earnings
5
5
6
7
7
8
4. Major Findings 9 - 14
5. Statistical Tables 15 - 70
Appendix 71 - 77

Annual Survey of Industries - 2013
v

Annual Survey of Industries - 2013
vi
List of Tables Table 4.1: Distribution of establishments by industry sector – 2012
Table 4.2: Number of persons engaged by industry sector – 2012
Table 4.3: Description for the ISIC 2 digit codes (Division)
Table 4.4: No. of establishments by industry division w.r.t. No. of establishments
Table 4.5: Description for the ISIC 2 digit codes (Division) w.r.t. person engaged
Table 4.6: No. of persons engaged by industry division
Table 4.7: Description for the ISIC 2 digit codes (Division) w.r.t. Input / Output value
Table 4.8: Input and output values by industry division-2012
Table 4.9: Value added by industry division-2012
Table 4.10: Distribution of establishments by province – 2012
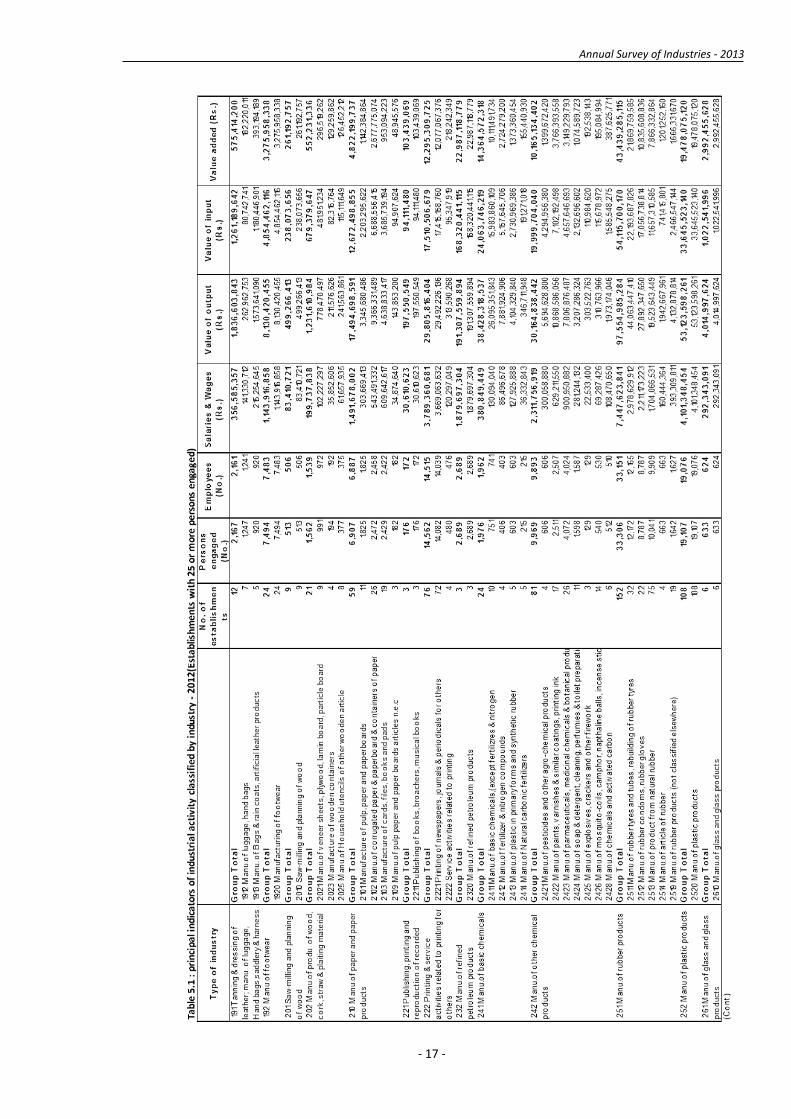
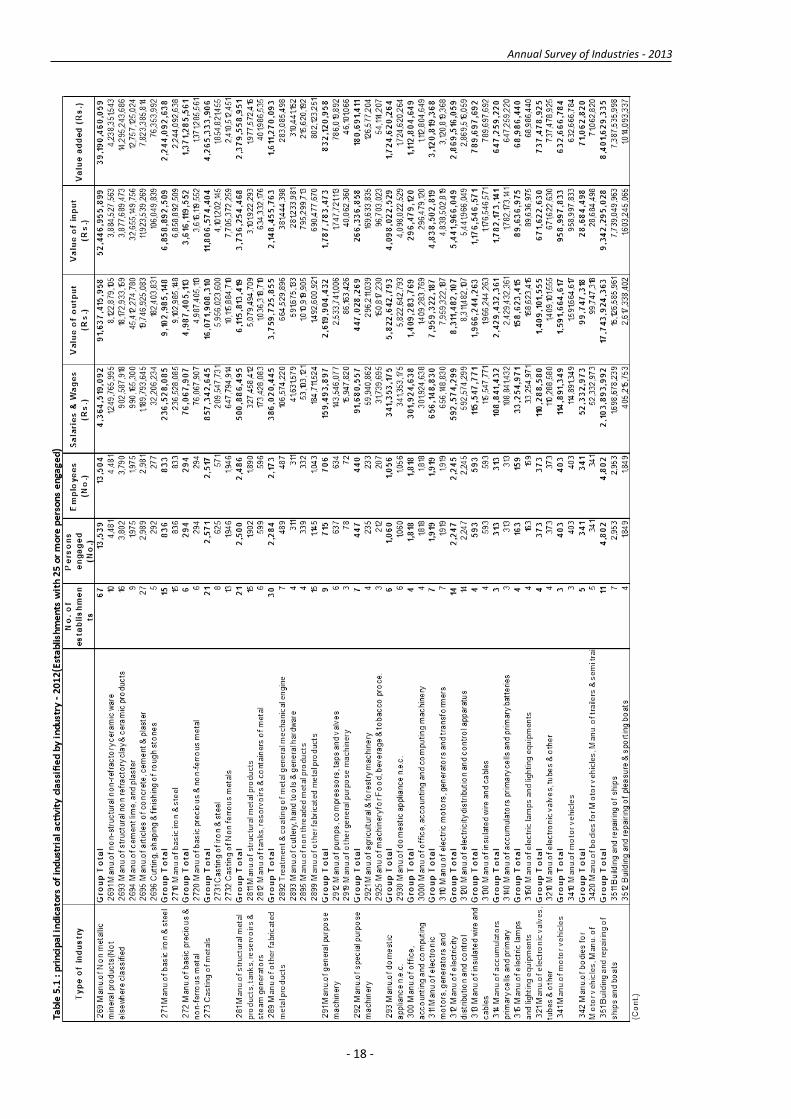
Table 5.1: principal indicators of industrial activity classified by industry - 2012 (Establishments with 25 or more persons engaged)
Table 5.2: Principal indicators of industrial activity classified by Industry sector & persons engaged size class – 2012 (Establishments with 25 or more persons engaged)
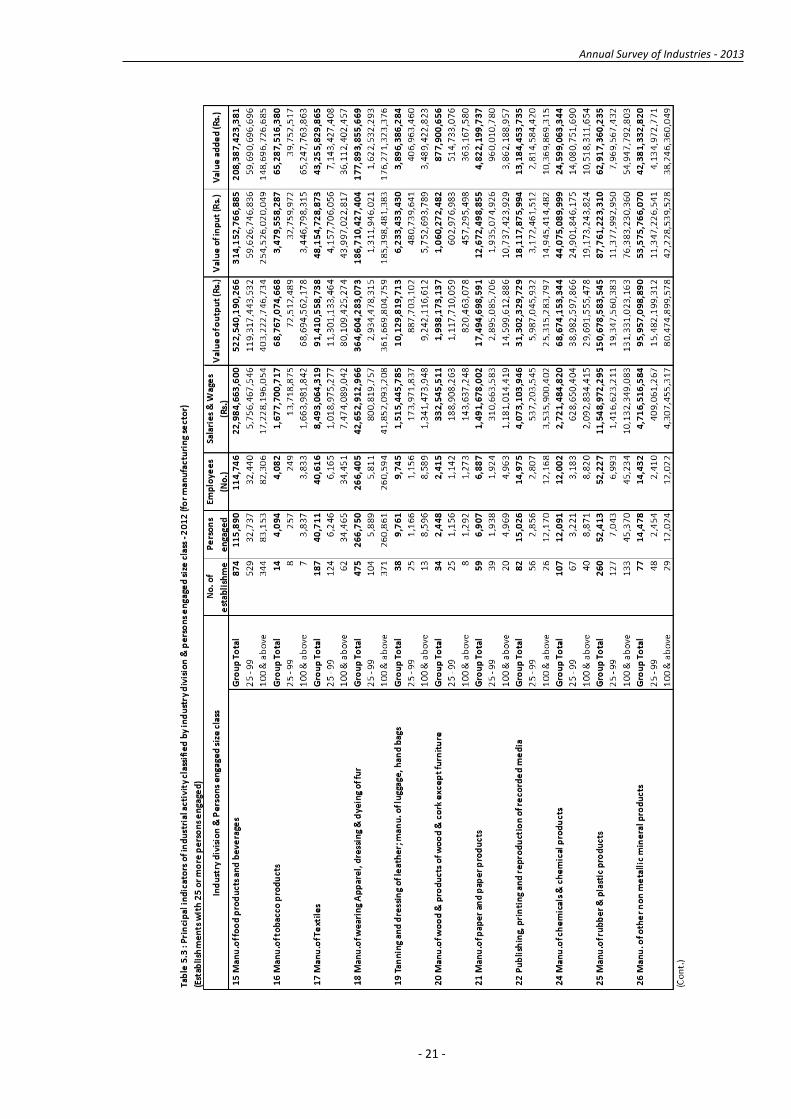
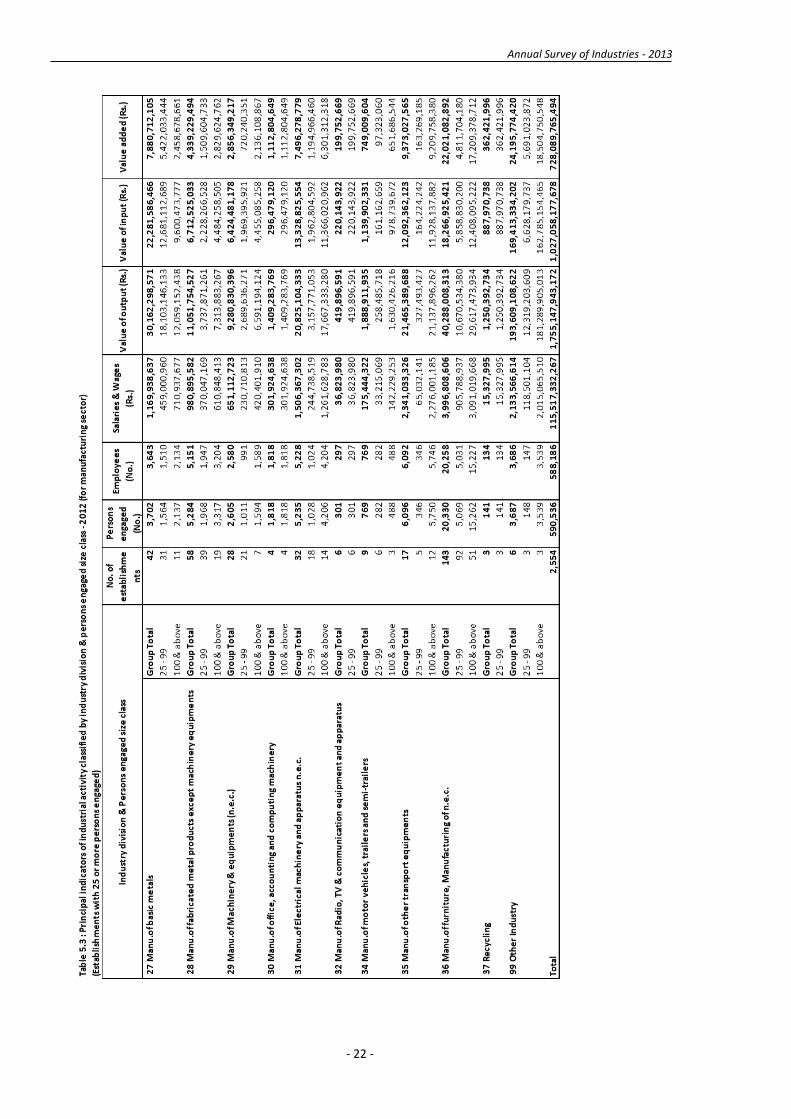
Table 5.3: Principal indicators of industrial activity classified by industry division & persons engaged size class - 2012 (for manufacturing sector) (Establishments with 25 or more persons engaged)
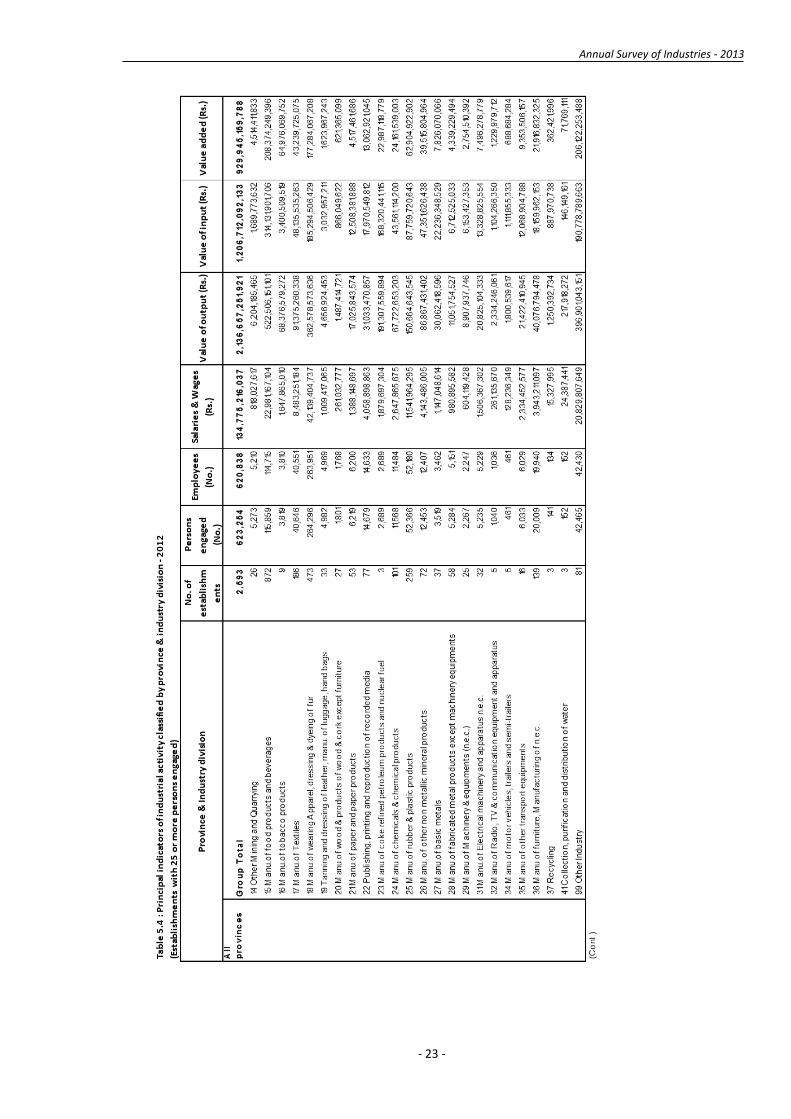
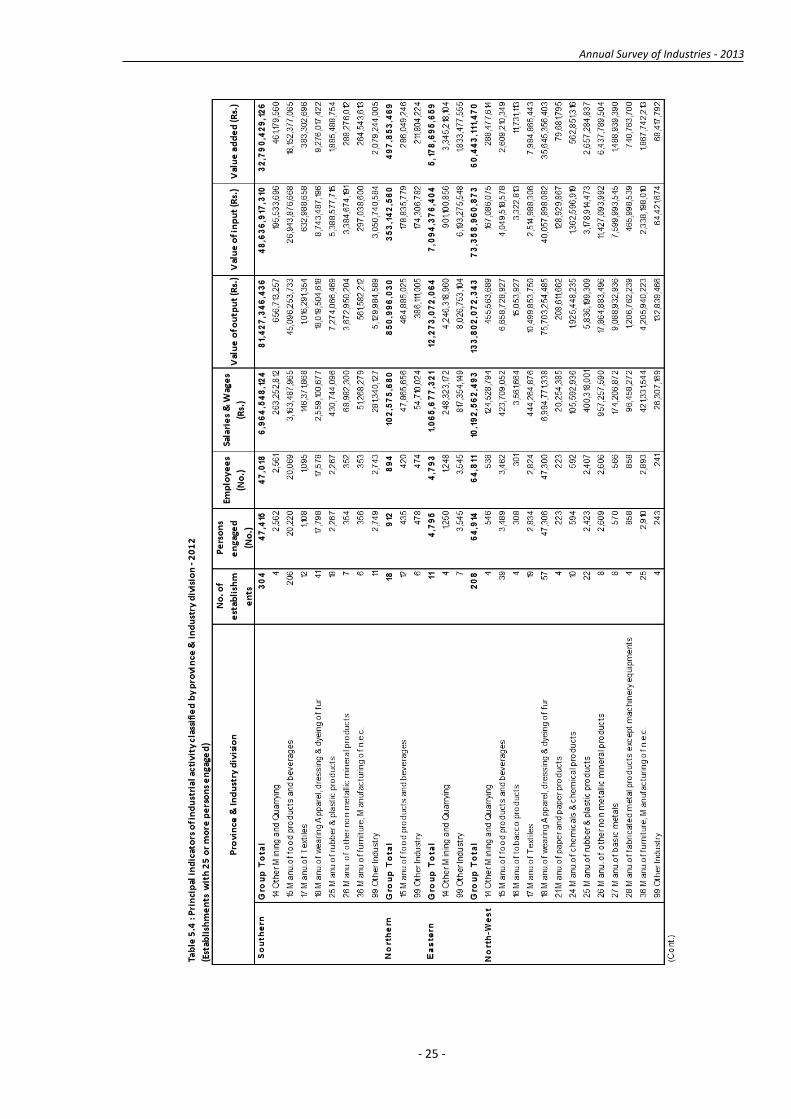
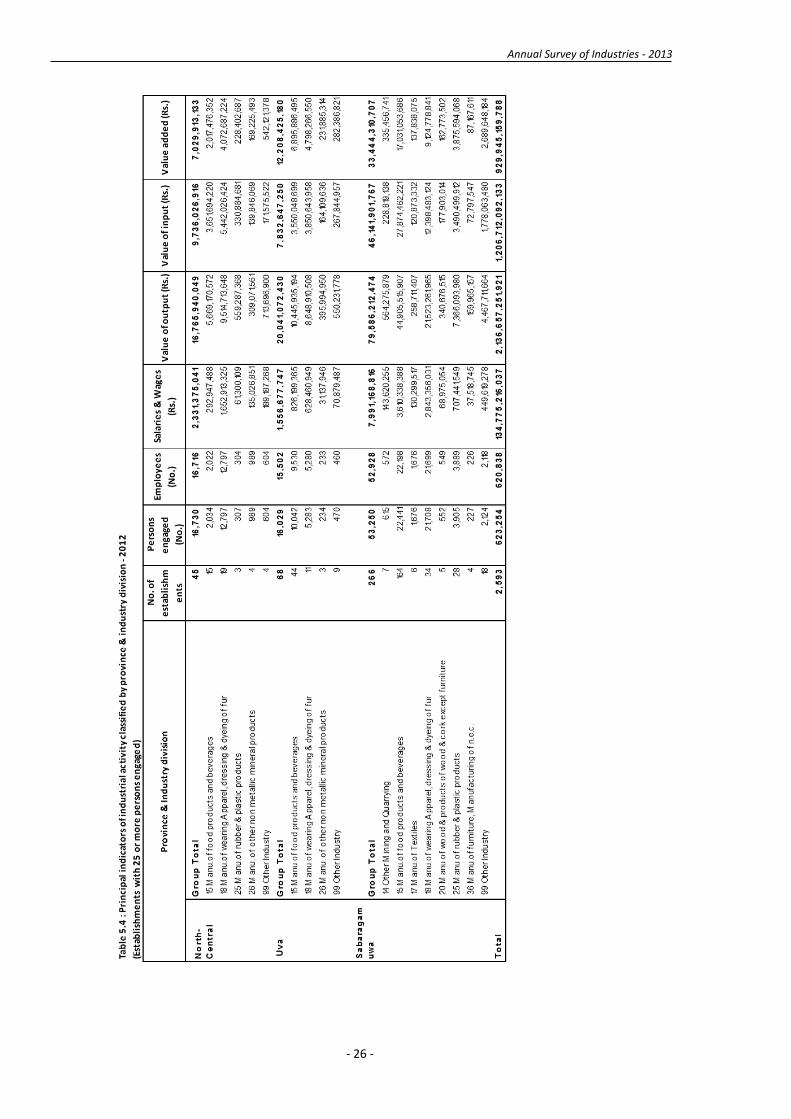
Table 5.4: Principal indicators of industrial activity classified by province & industry division - 2012 (Establishments with 25 or more persons engaged)
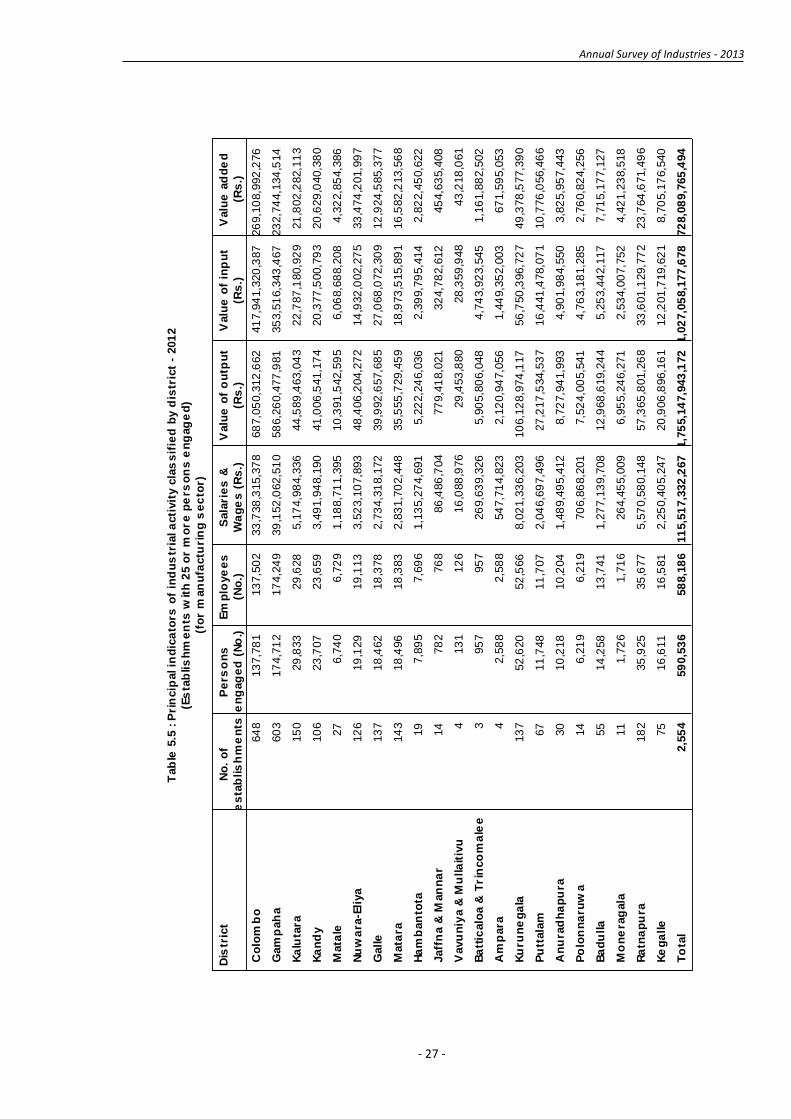
Table 5.5: Principal indicators of industrial activity classified by district - 2012 (Establishments with 25 or more persons engaged) (for manufacturing sector)
Table 5.6: Establishments classified by persons engaged size class & industry division - 2012 (Establishments with 25 or more persons engaged)
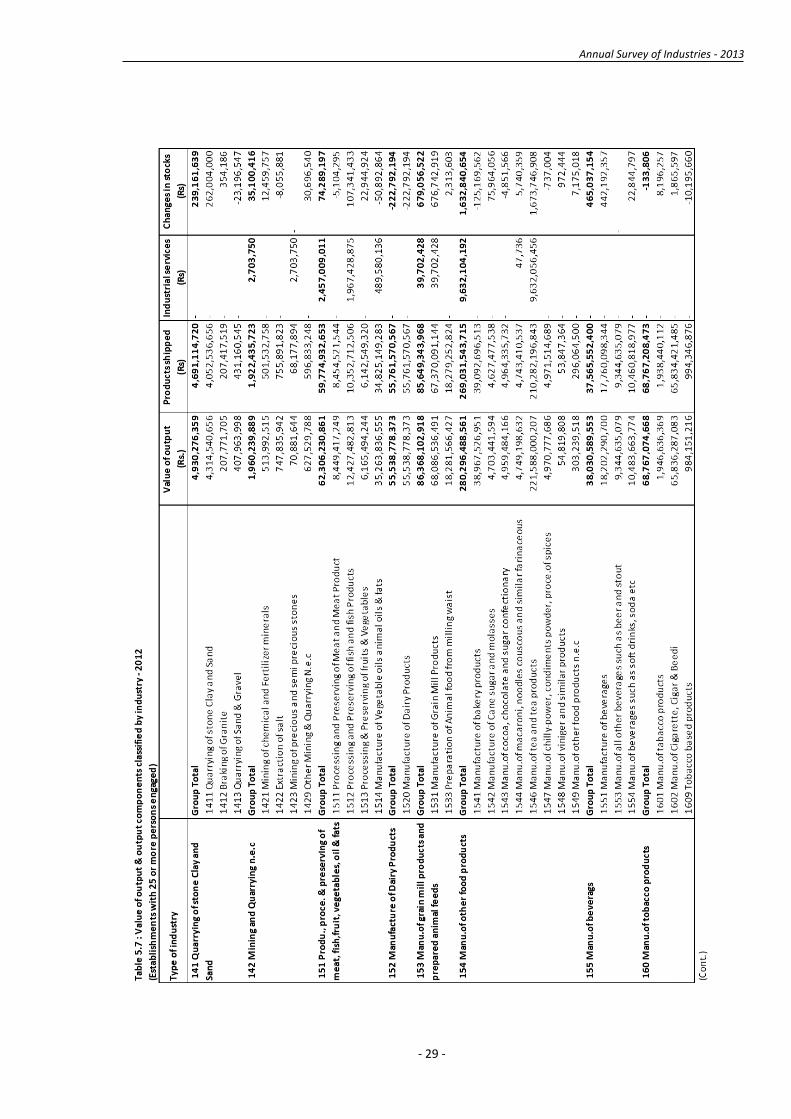
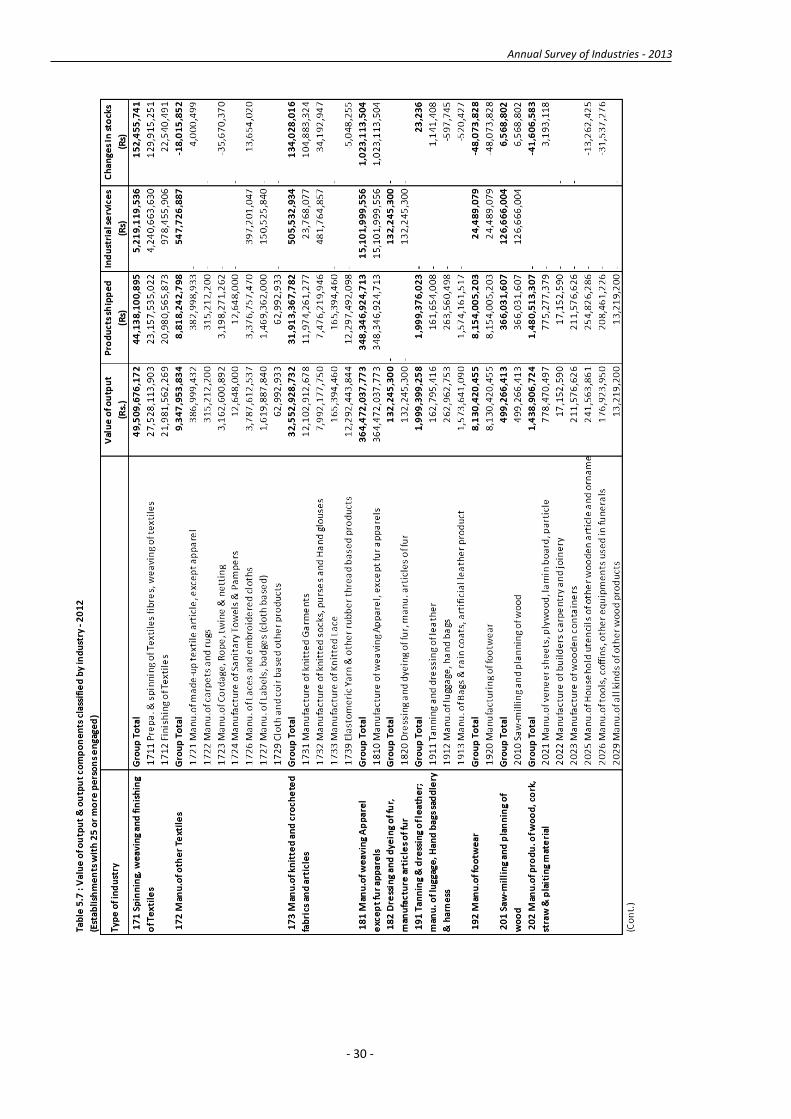
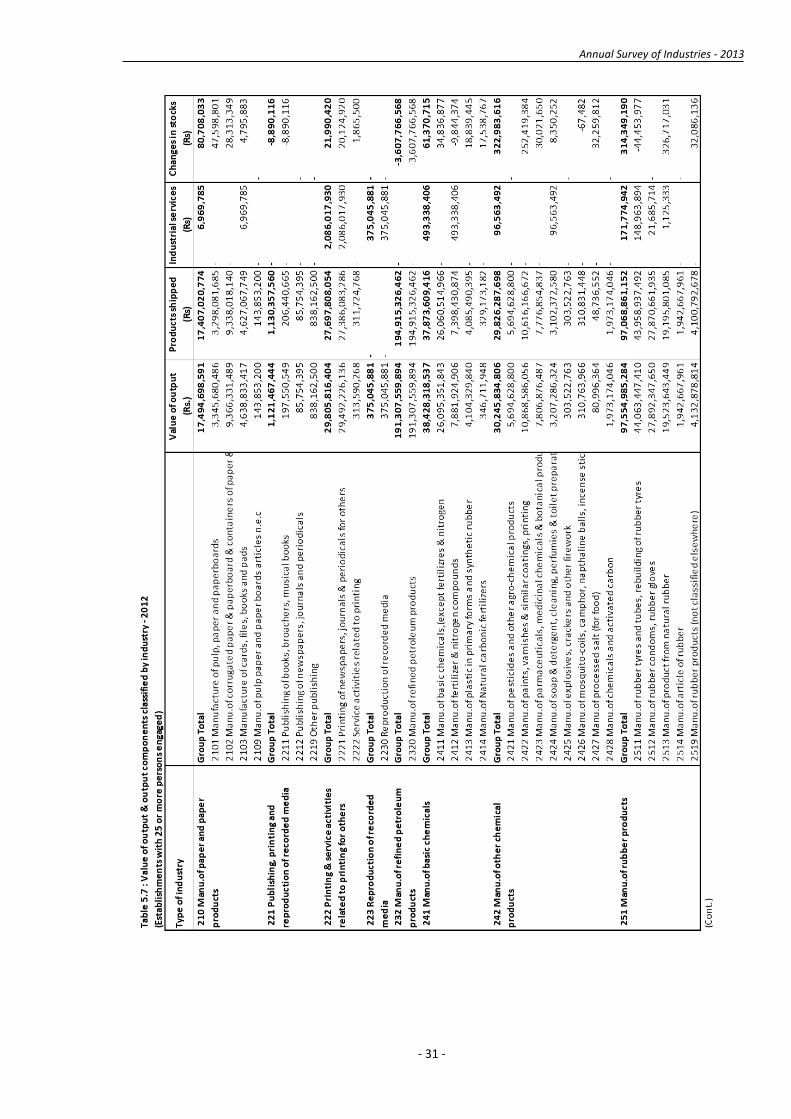
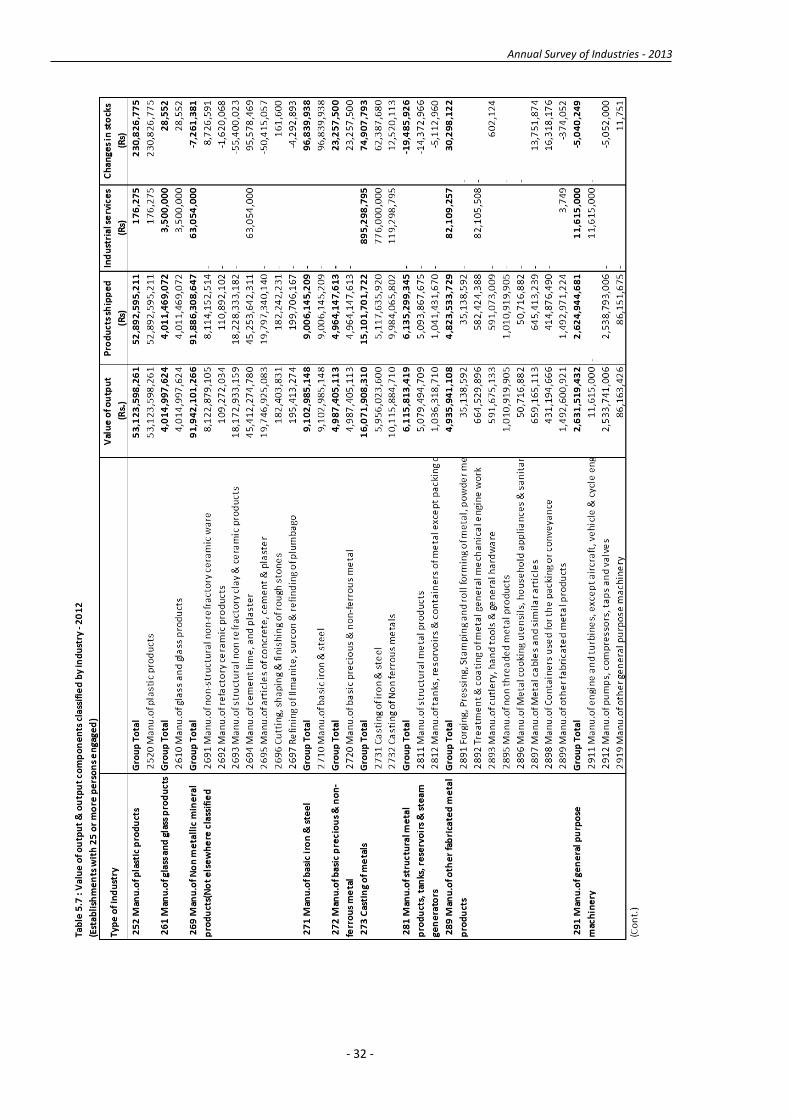
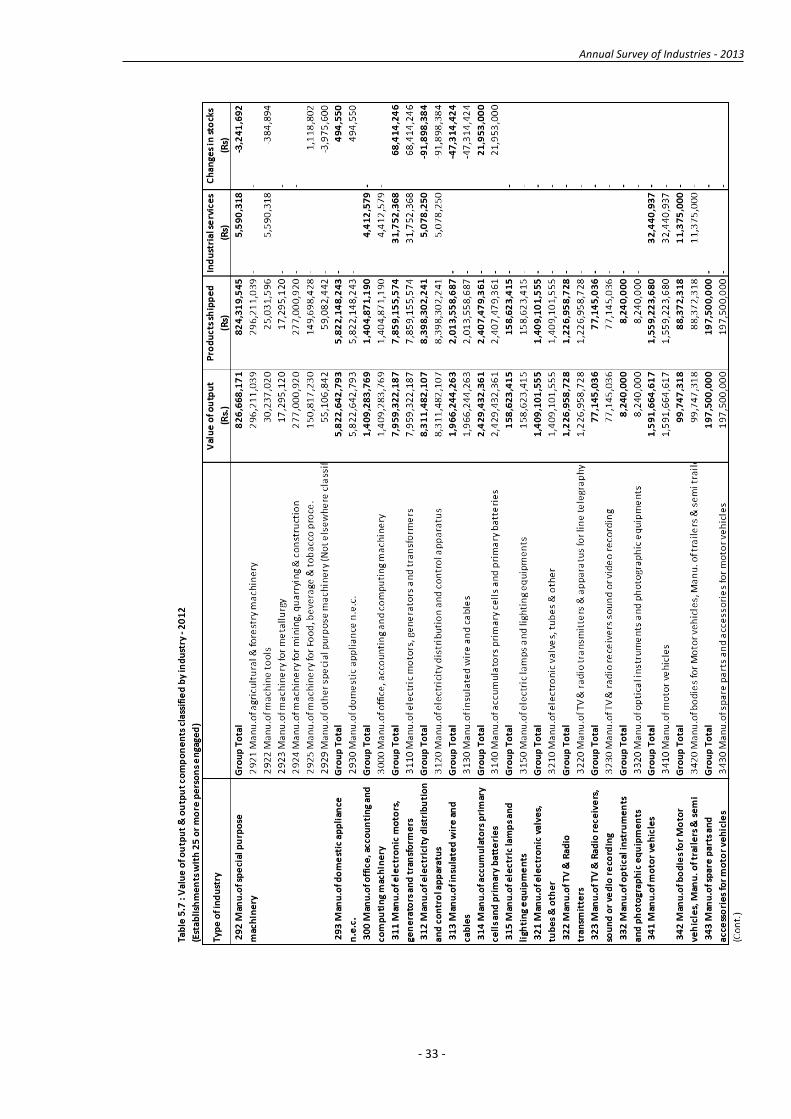
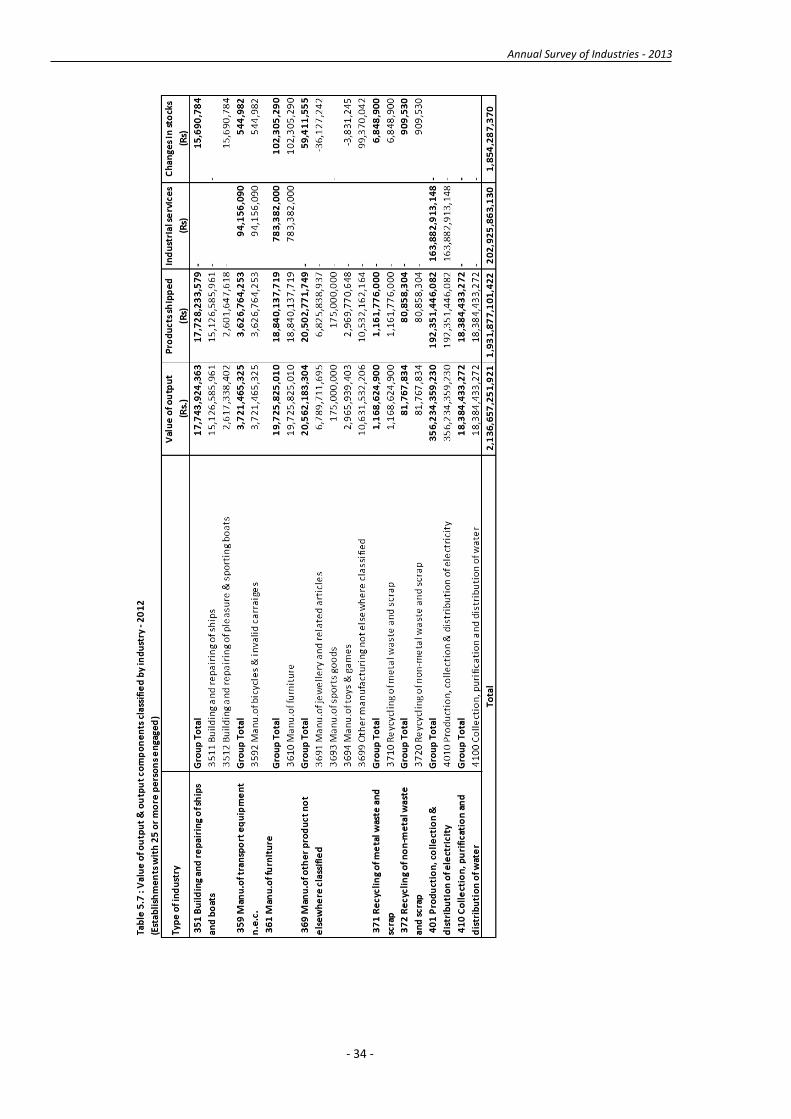
Table 5.7: Value of output & output components classified by industry - 2012 (Establishments with 25 or more persons engaged)
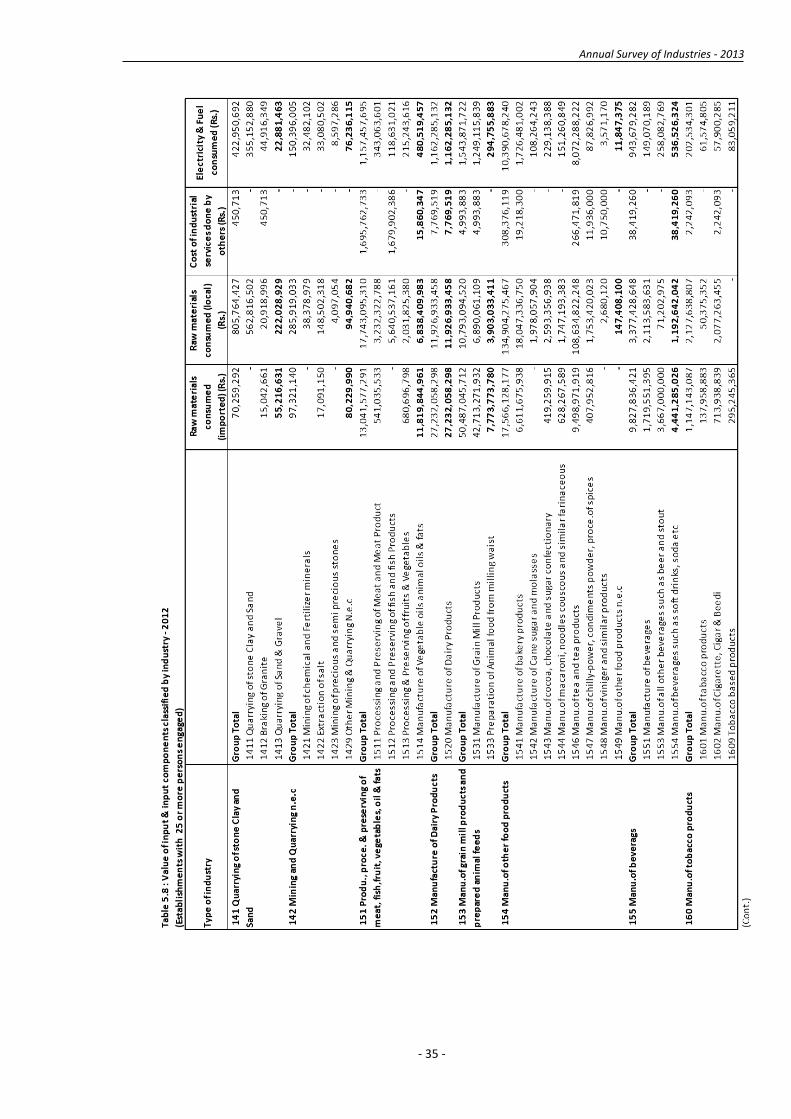
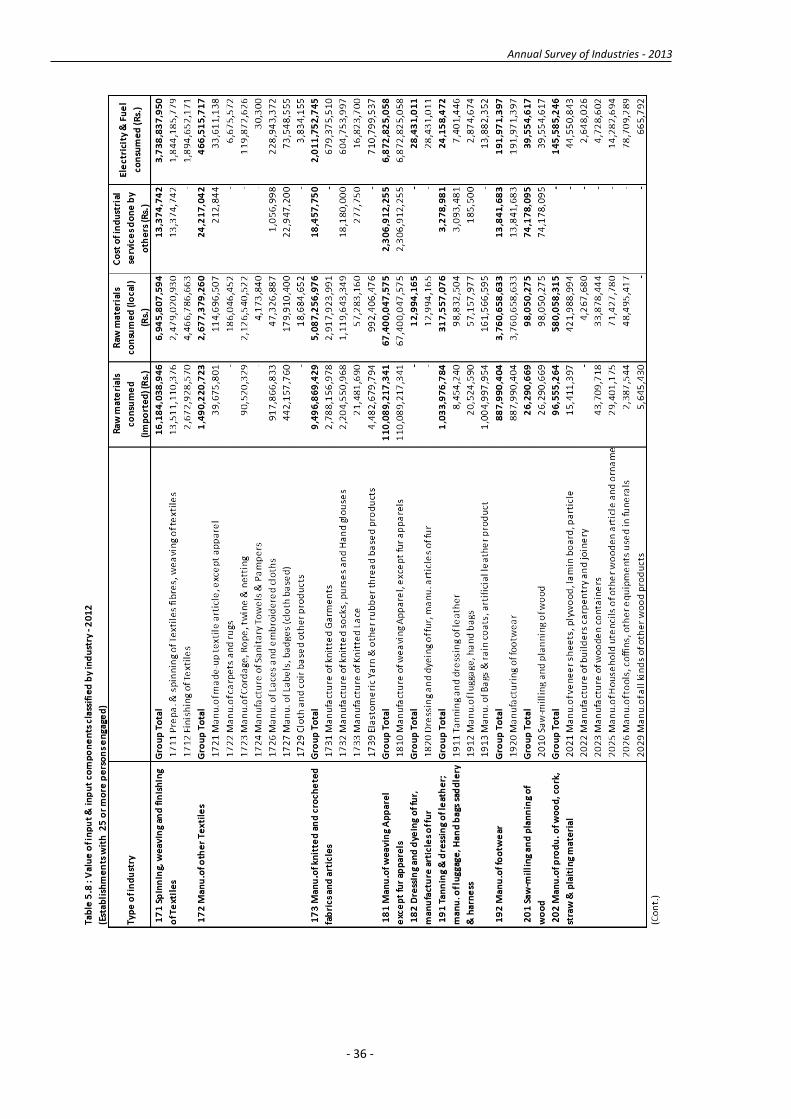
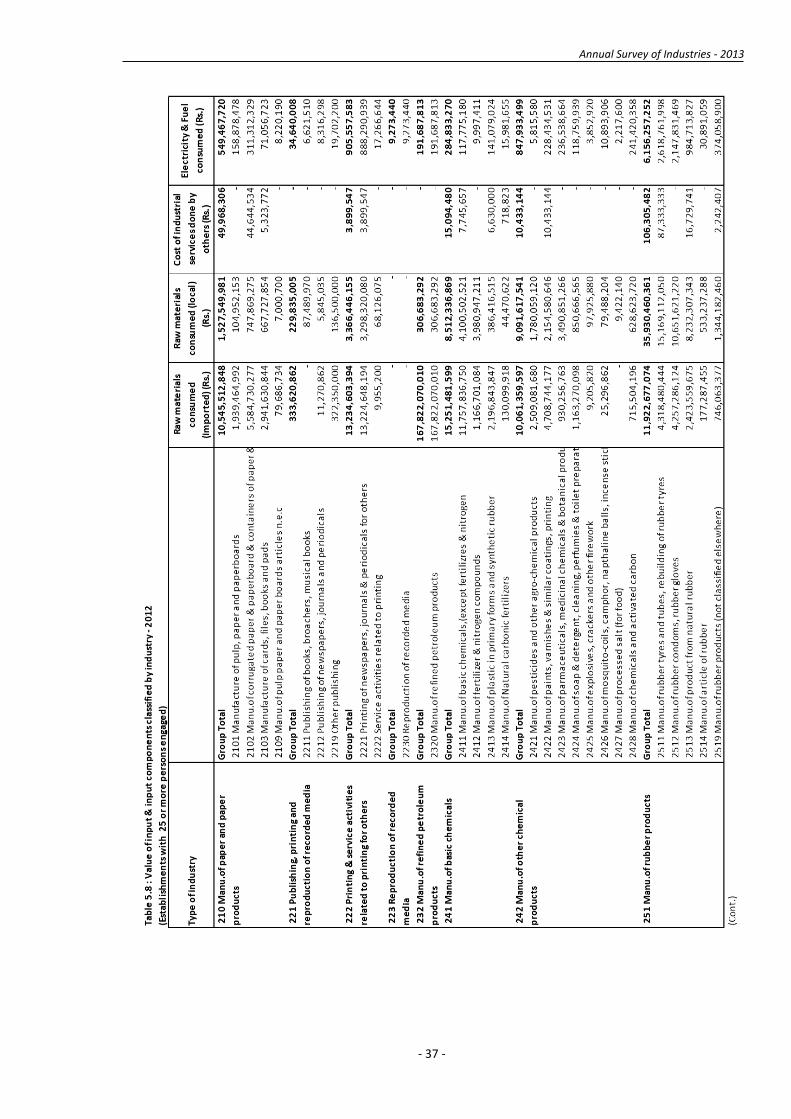
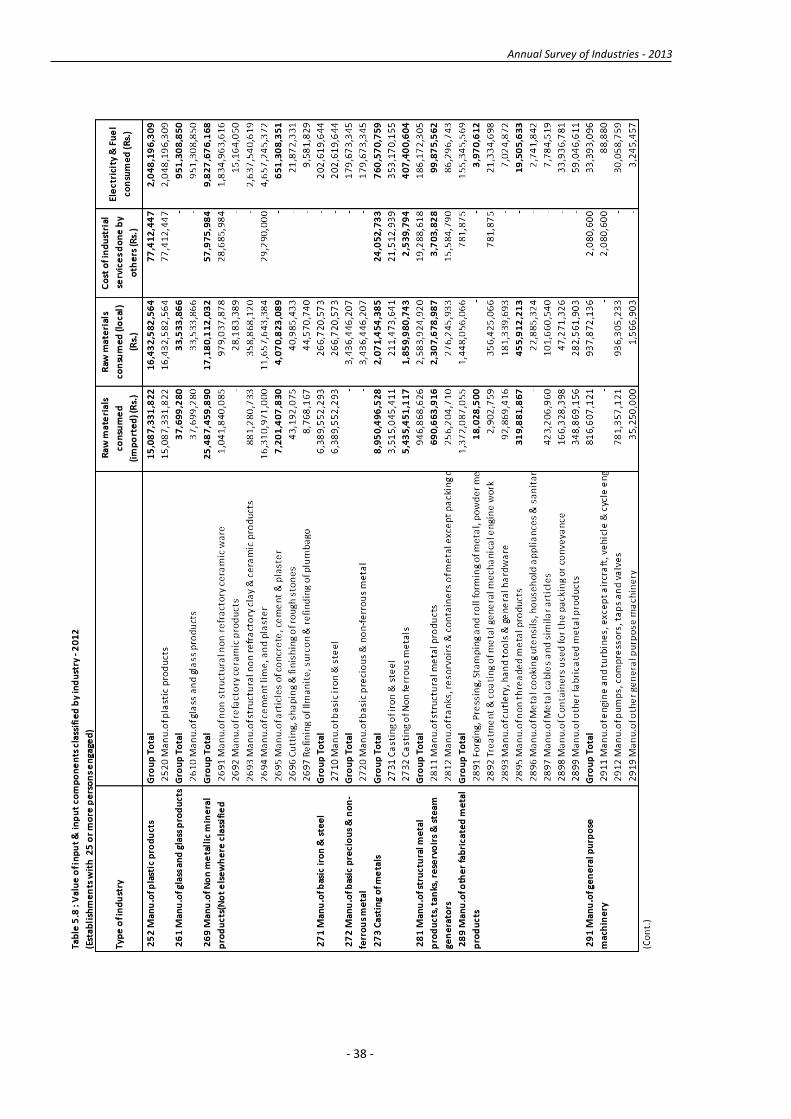
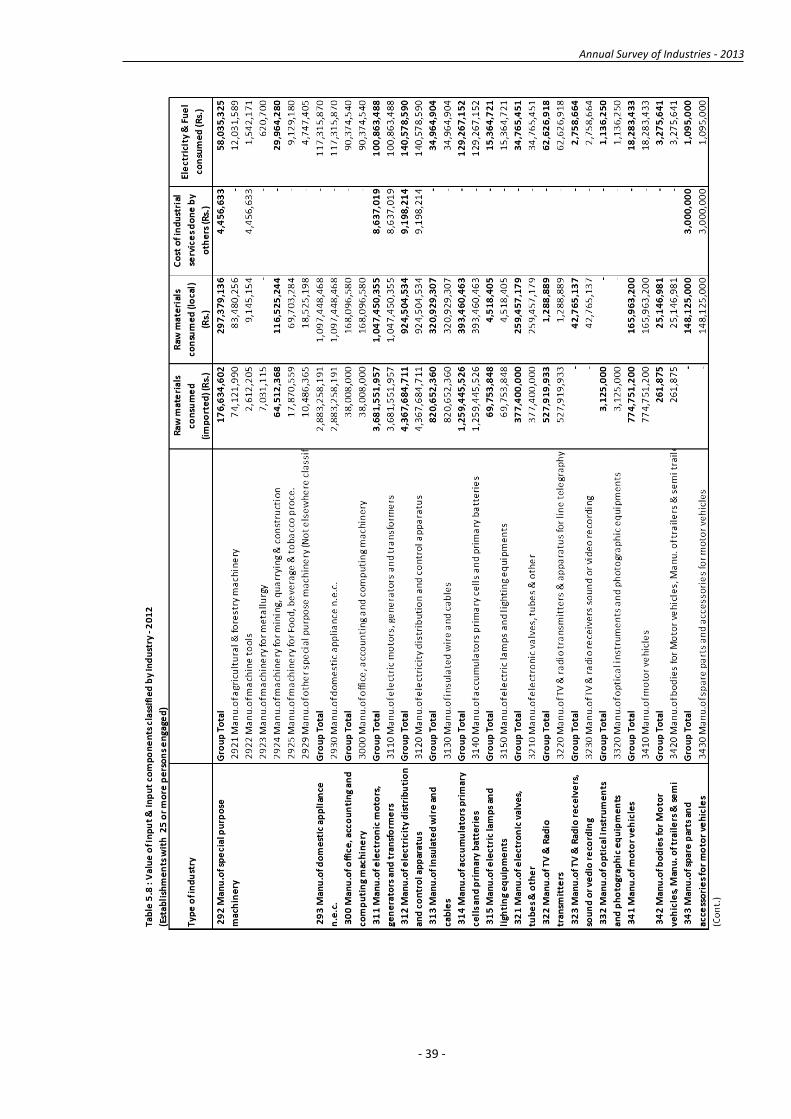
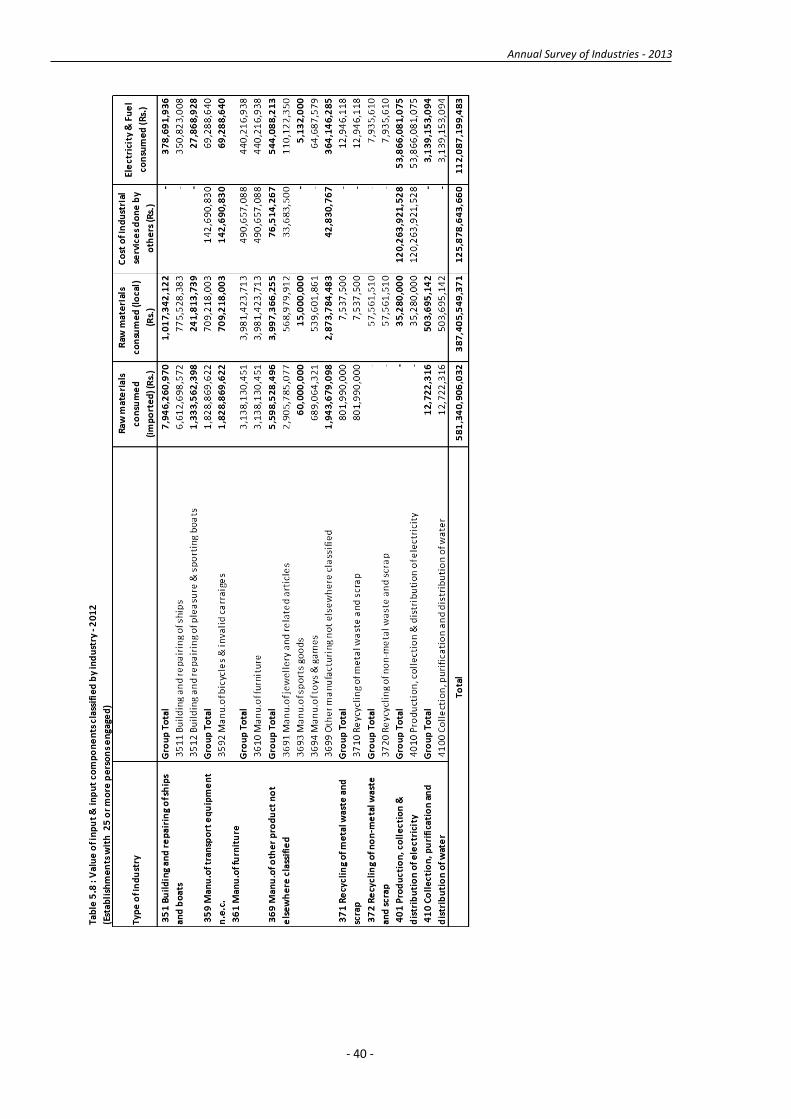
Table 5.8: Value of input & input components classified by industry - 2012 (Establishments with 25 or more persons engaged)
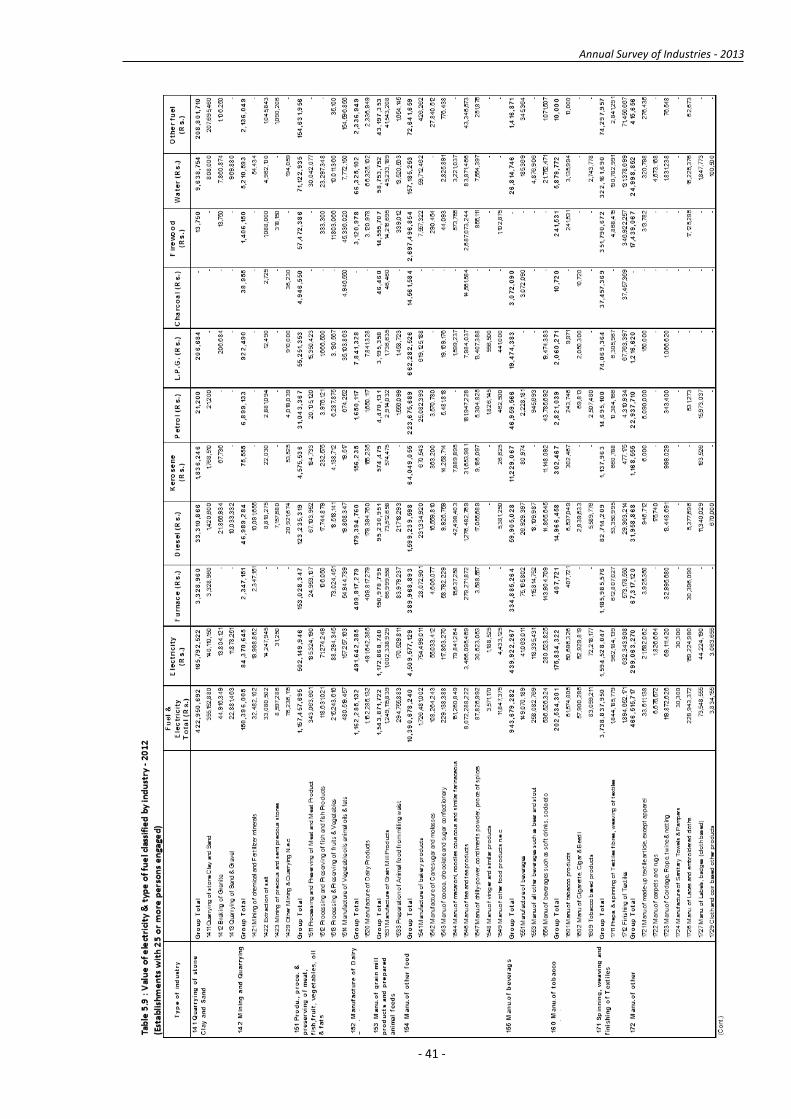
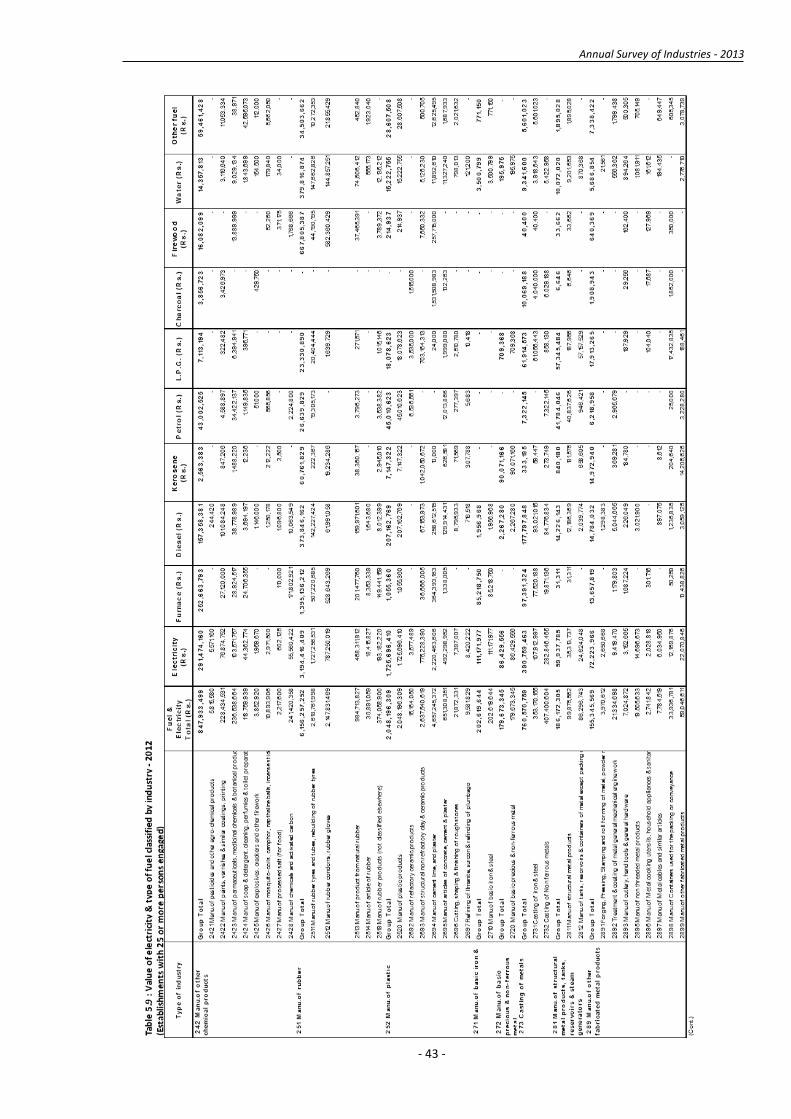
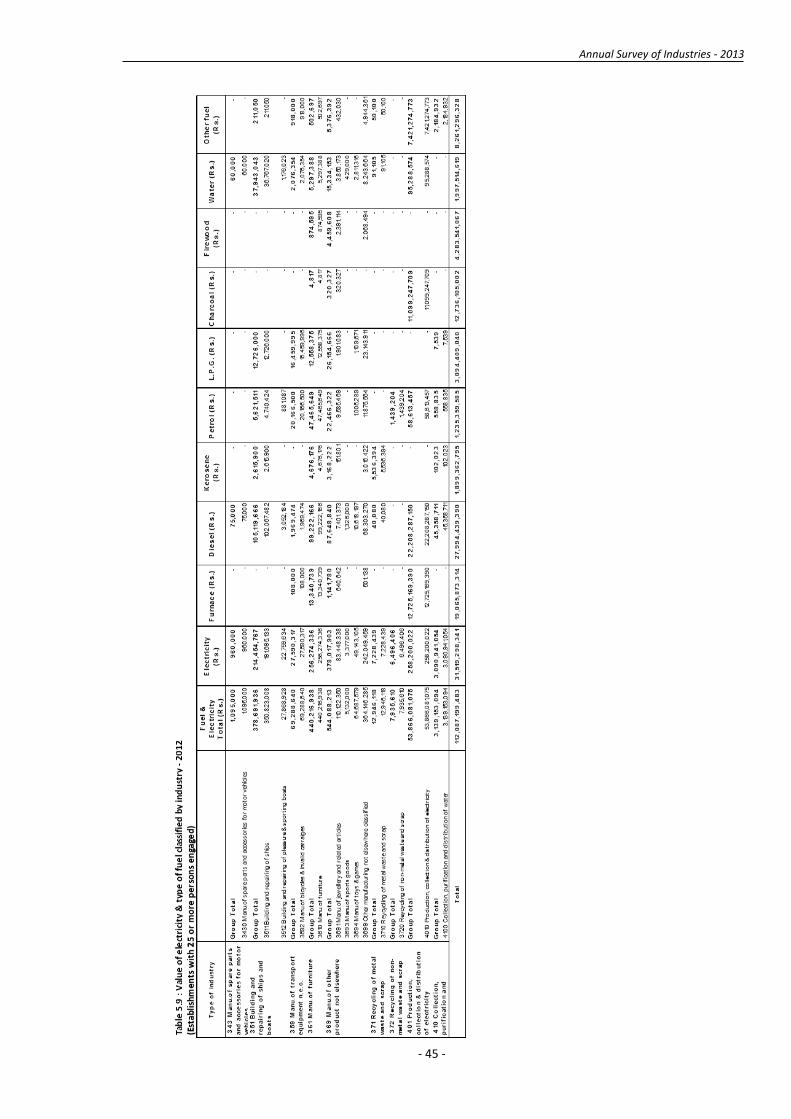
Table 5.9: Value of electricity & type of fuel classified by industry - 2012 (Establishments with 25 or more persons engaged)
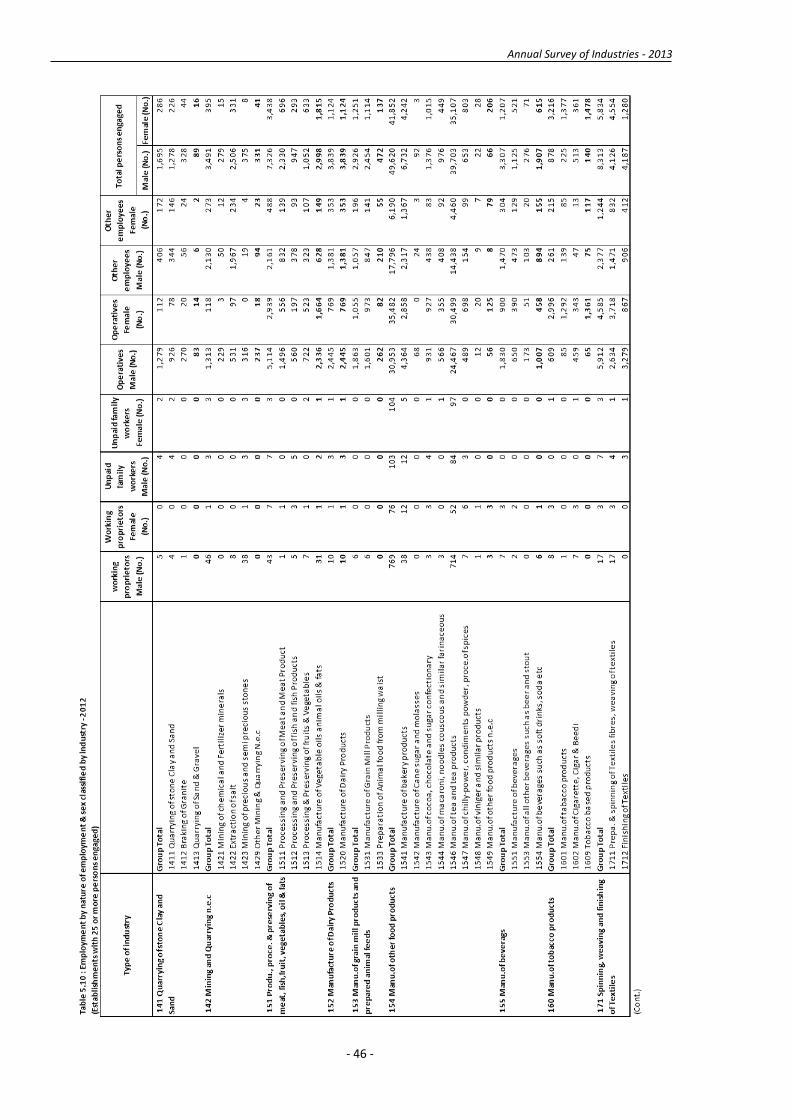
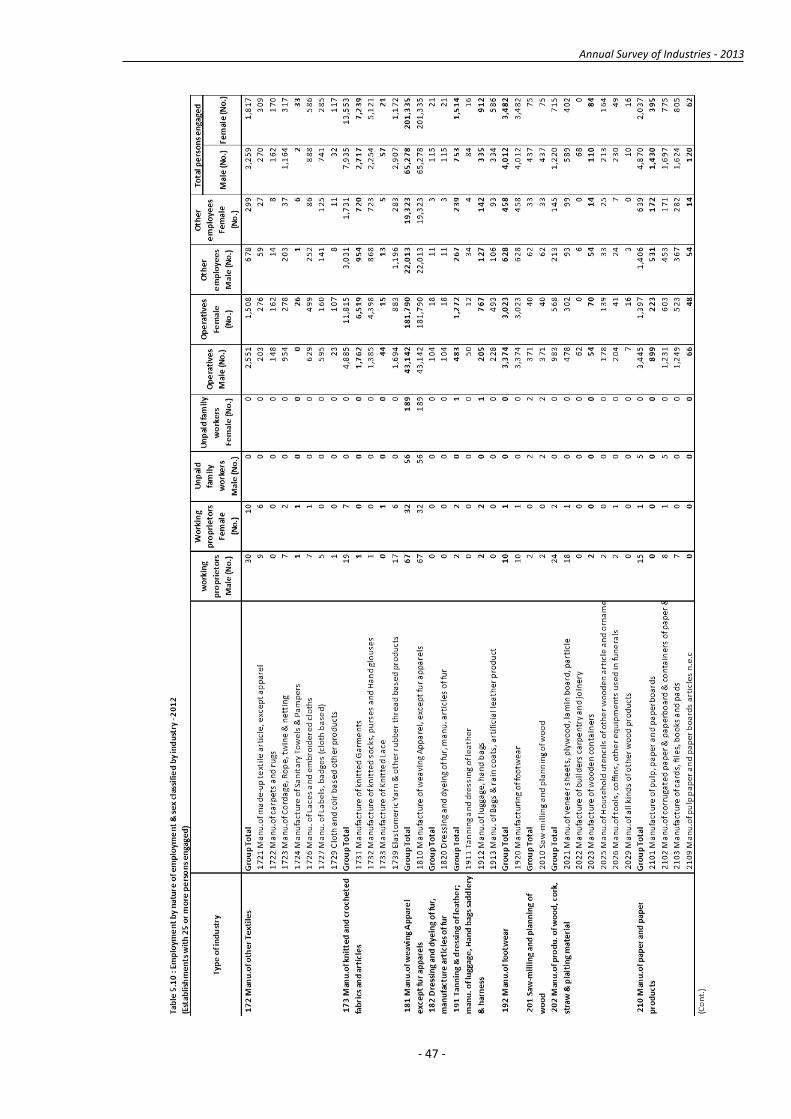
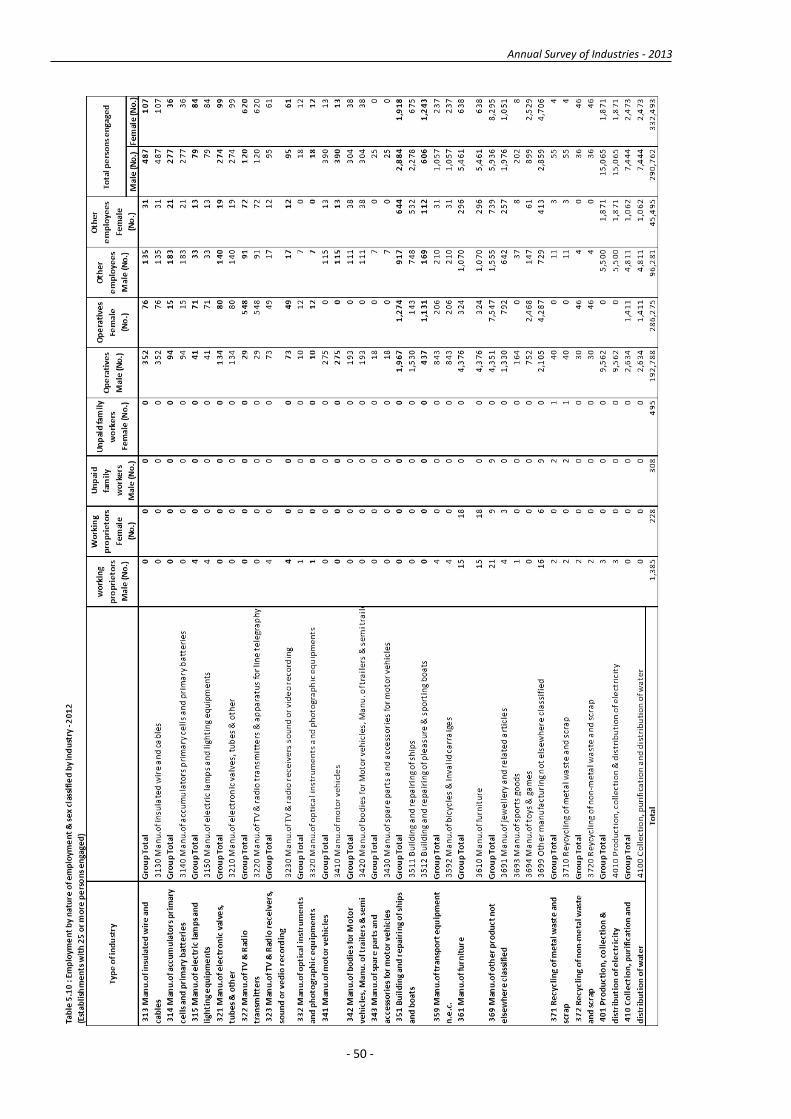
Table 5.10: Employment by nature of employment & sex classified by industry - 2012 (Establishments with 25 or more persons engaged)
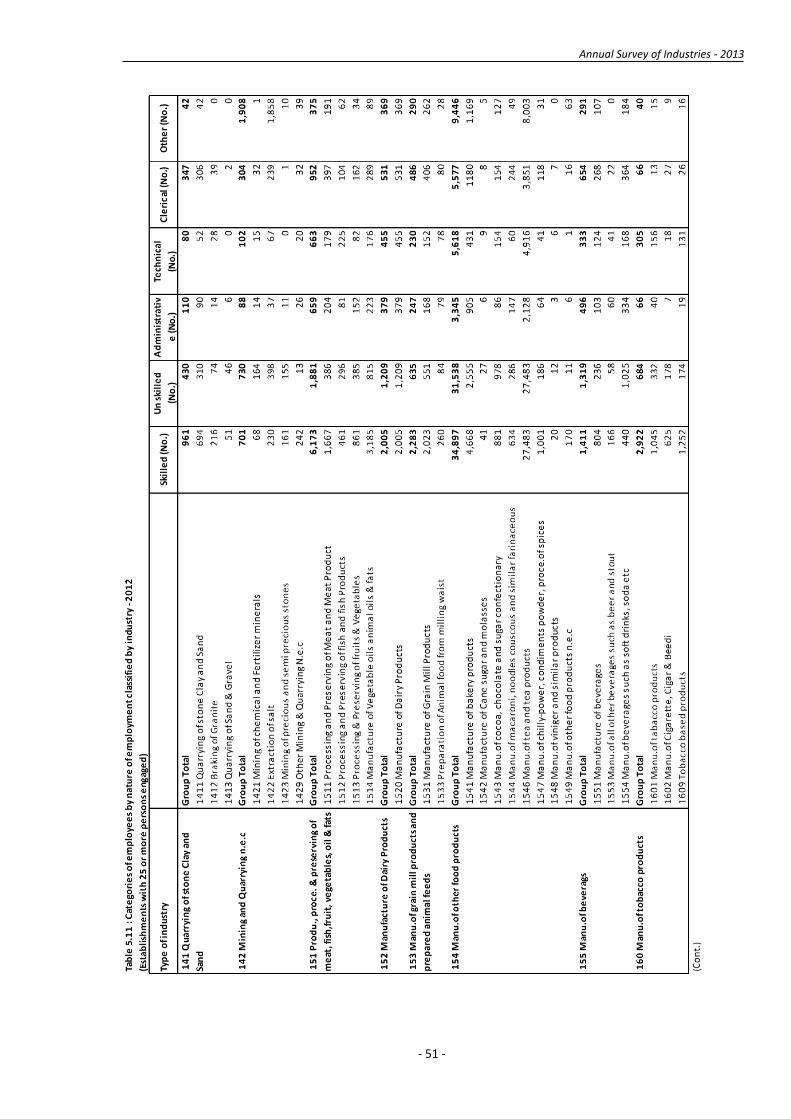
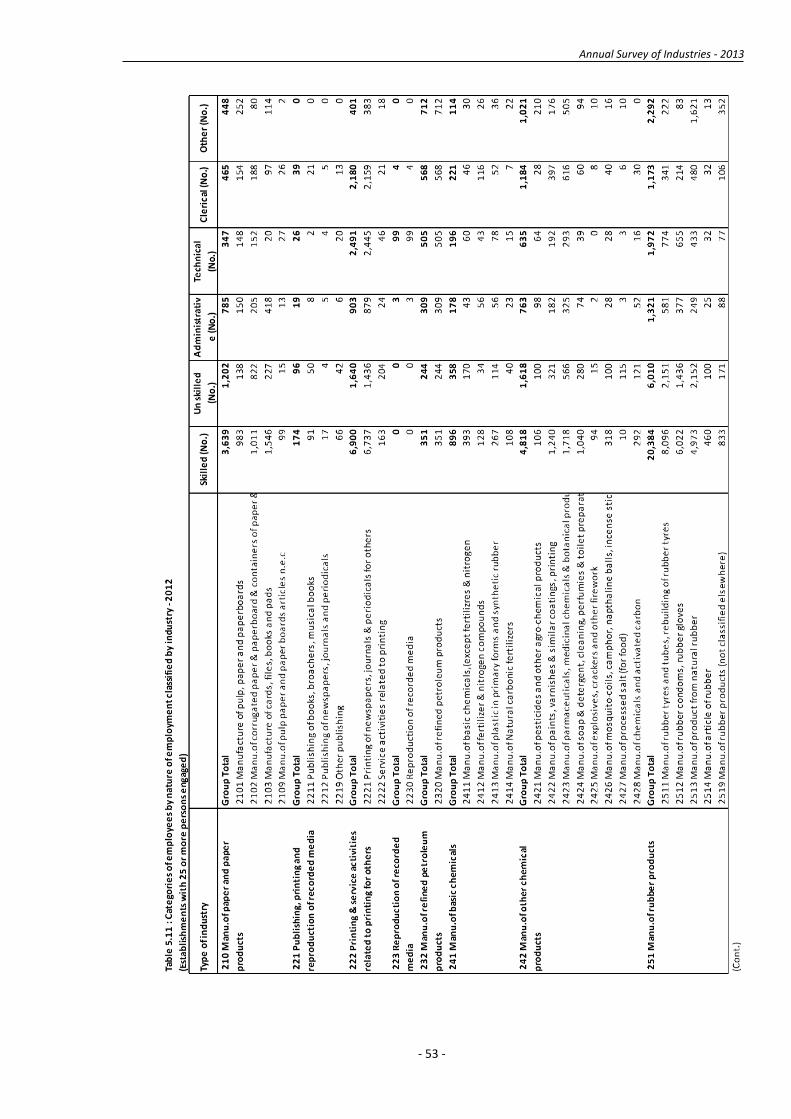
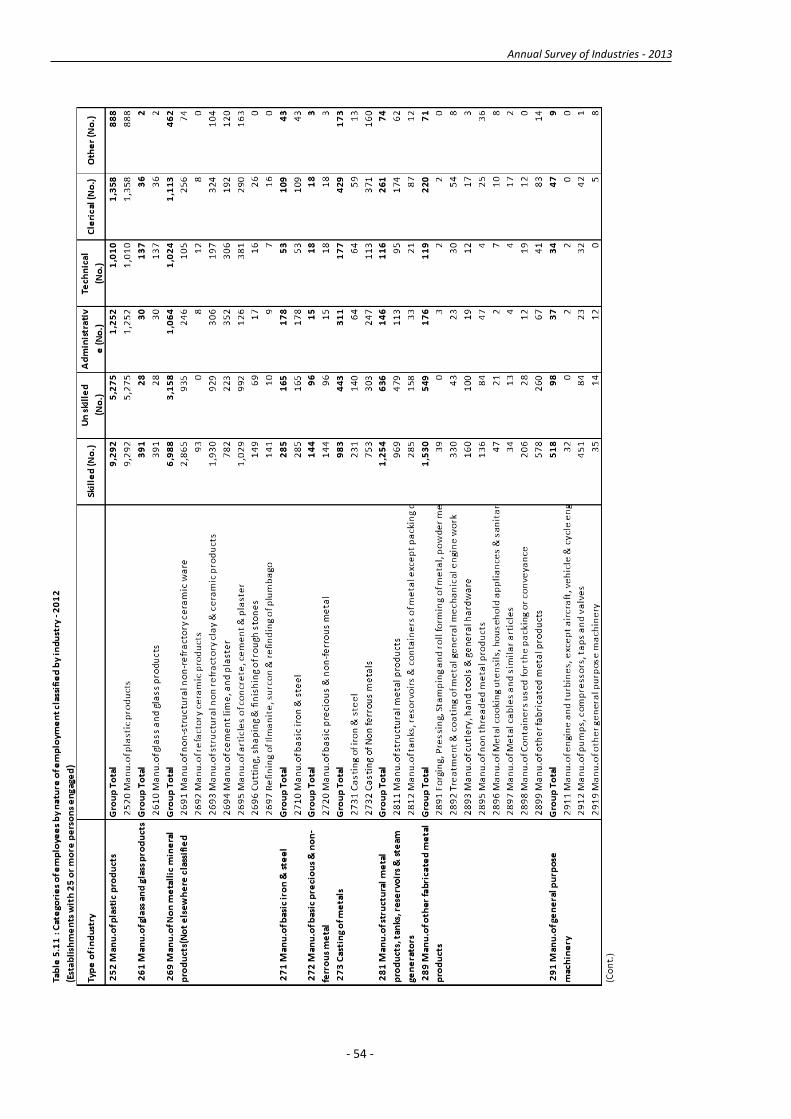
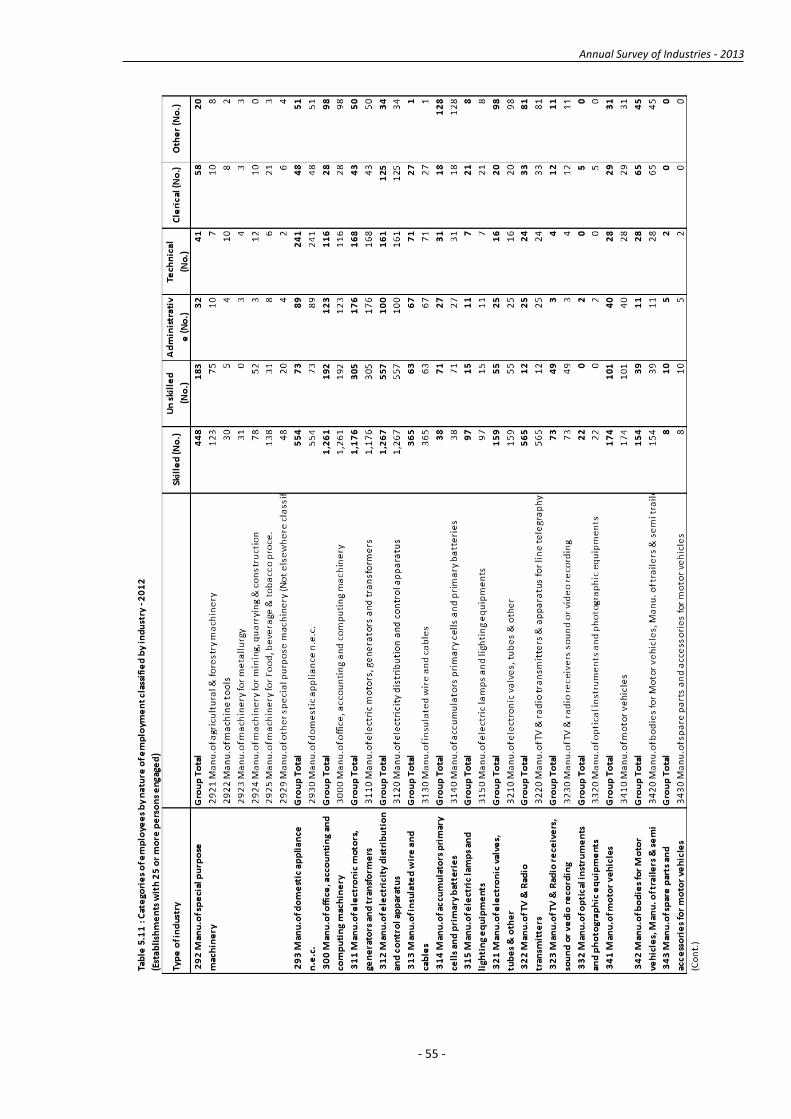
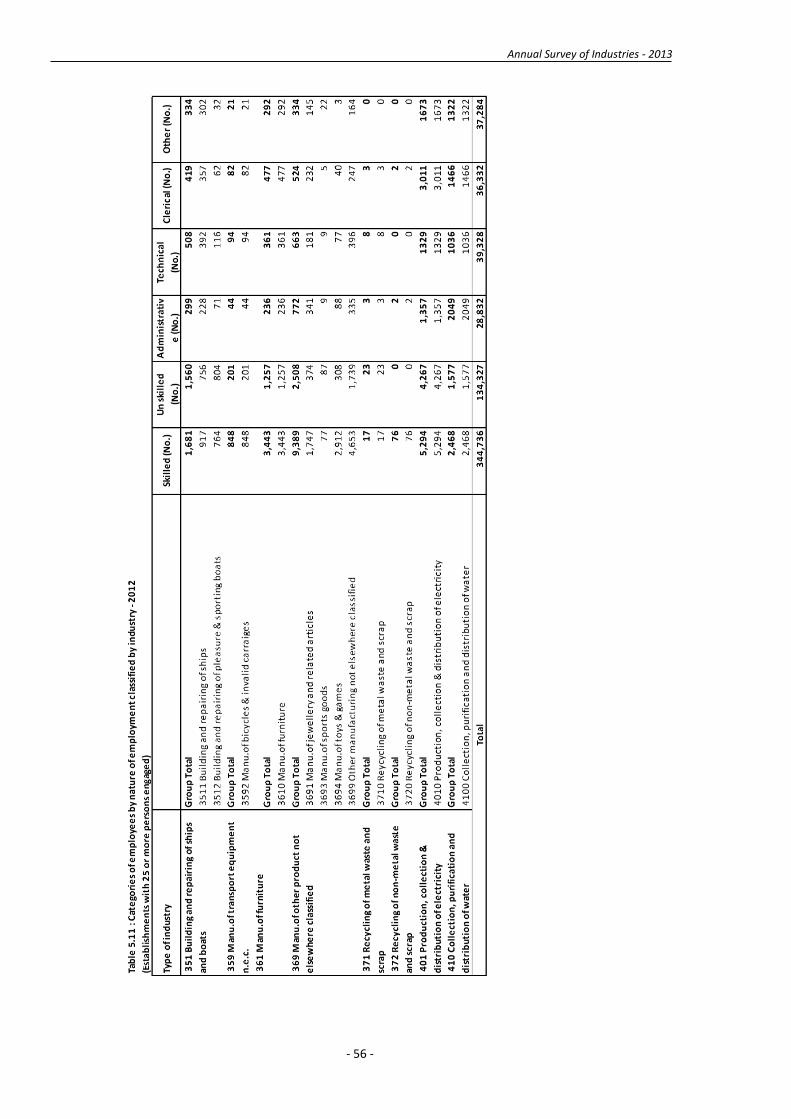
Table 5.11: Categories of employees by nature of employment classified by industry - 2012 (Establishments with 25 or more persons engaged)
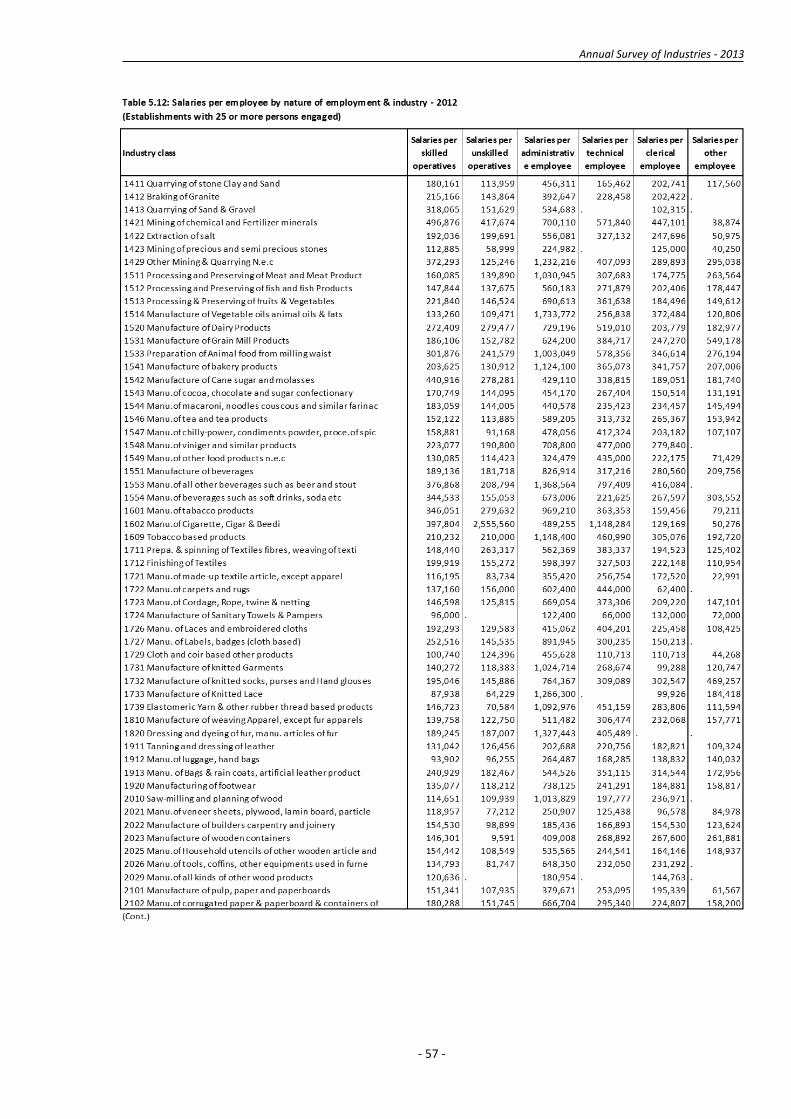
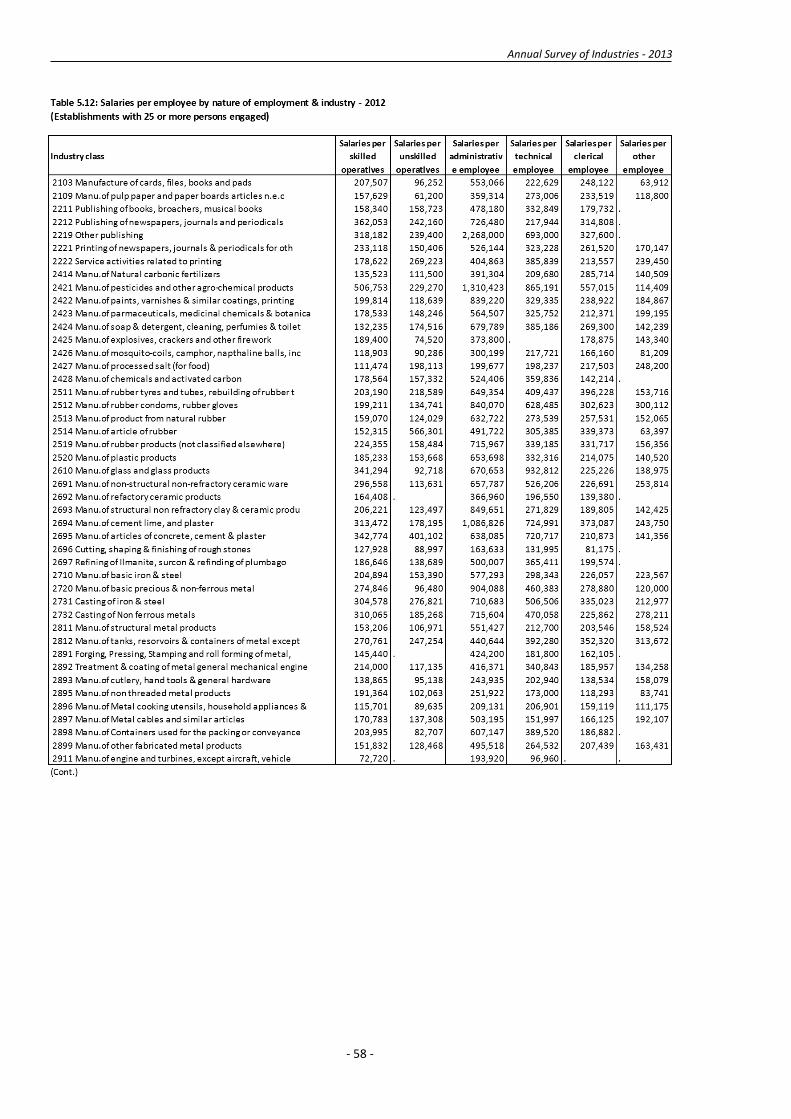
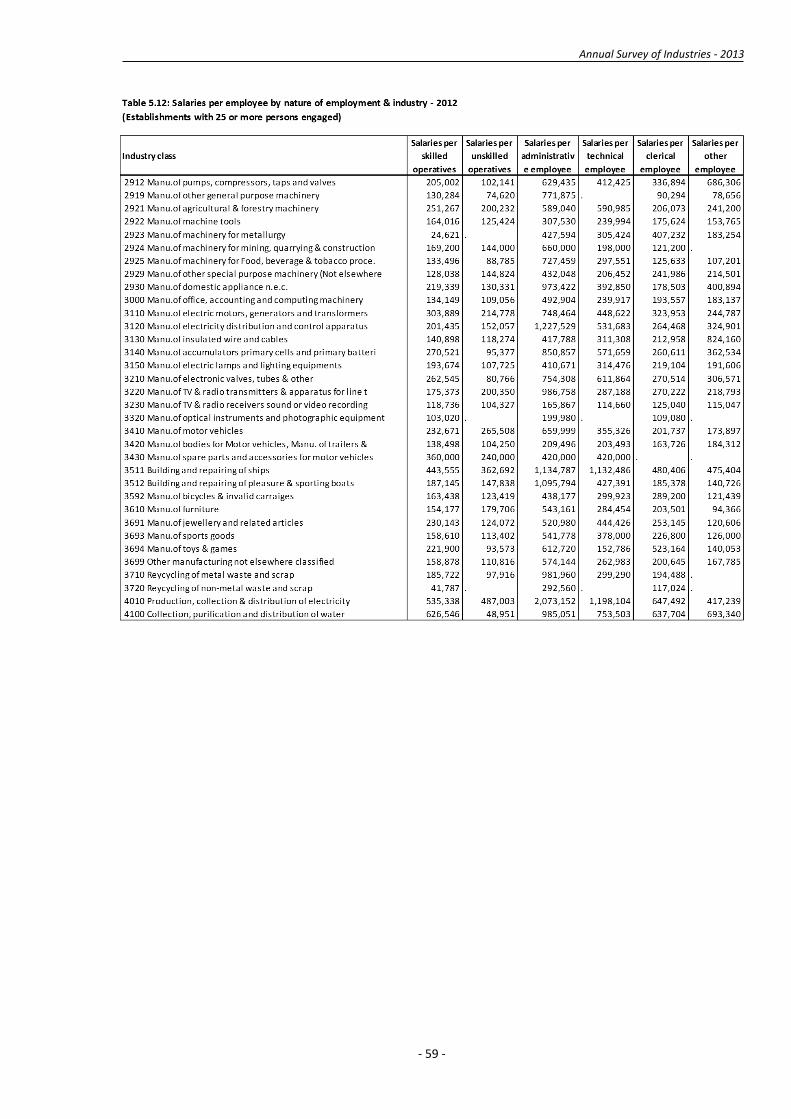
Table 5.12: Salaries per employee by nature of employment & industry - 2012 (Establishments with 25 or more persons engaged)
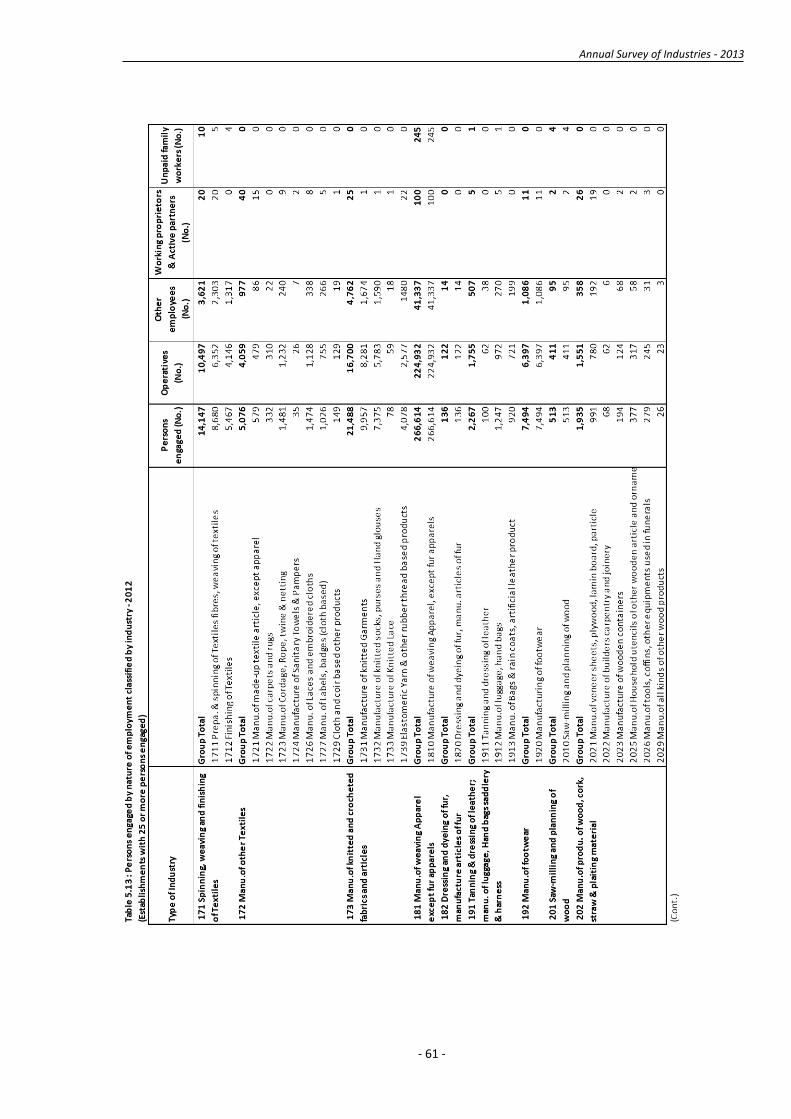
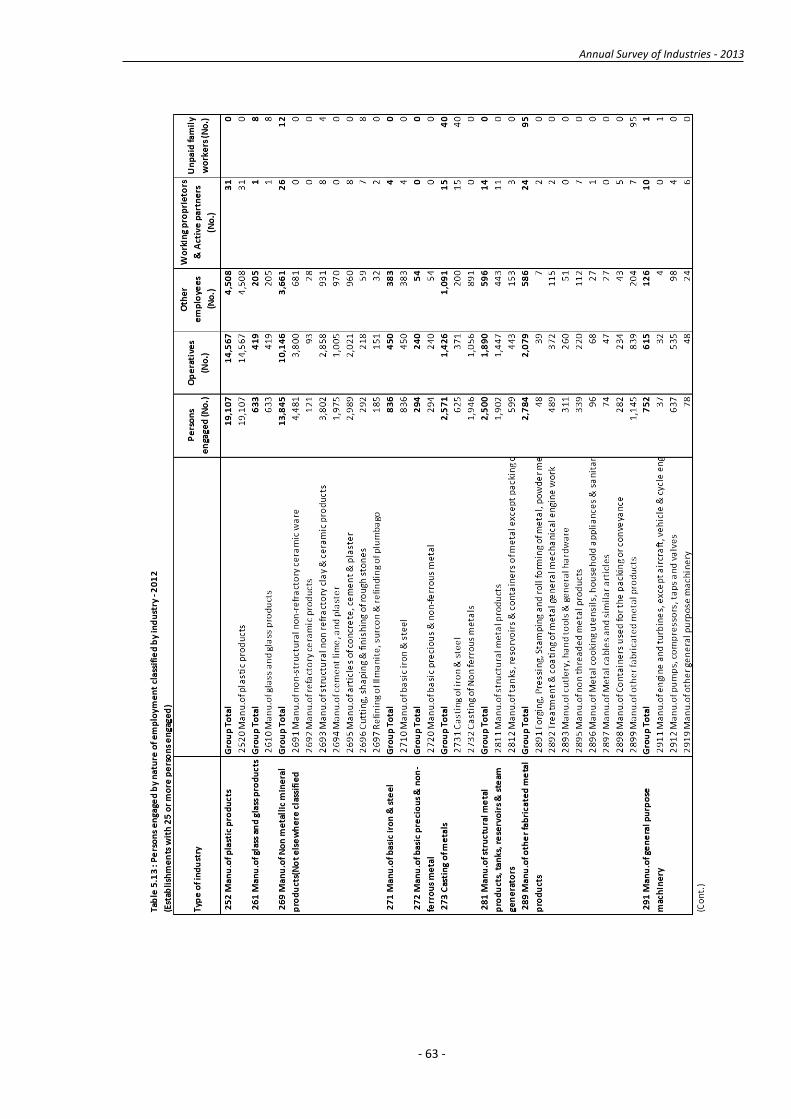
Table 5.13: Persons engaged by nature of employment classified by industry - 2012 (Establishments with 25 or more persons engaged)
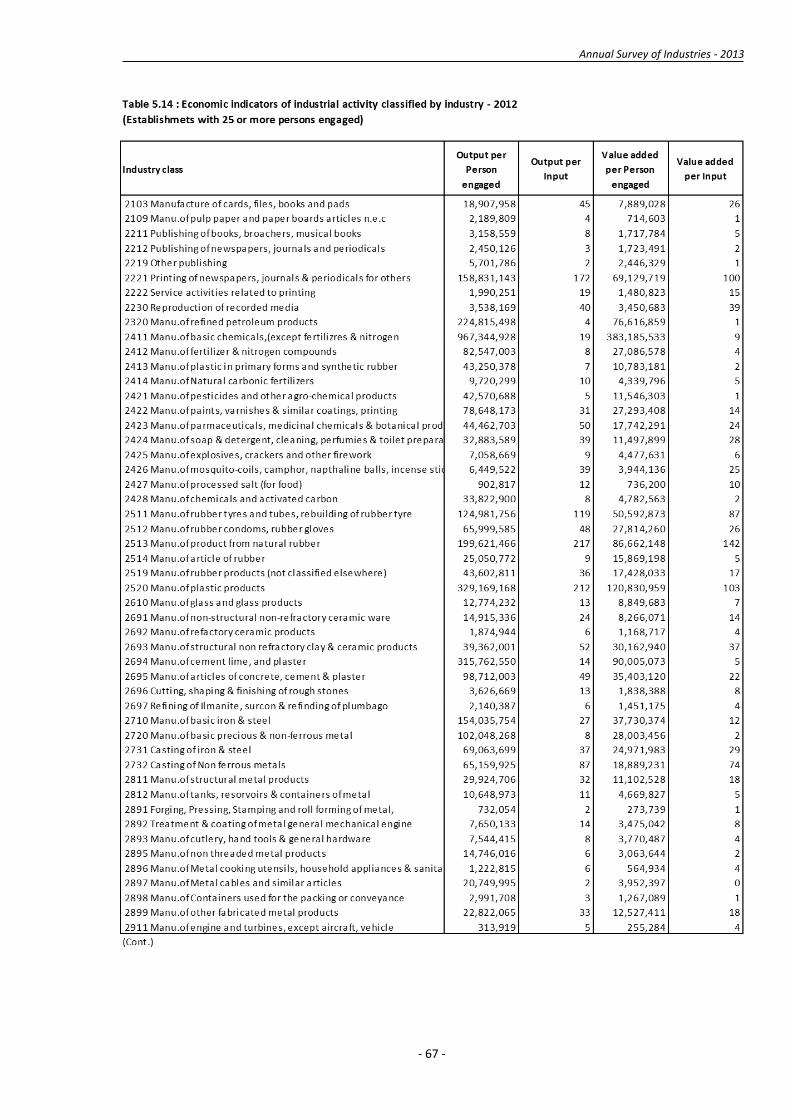
Table 5.14: Economic indicators of industrial activity classified by industry - 2012 (Establishments with 25 or more persons engaged)

Annual Survey of Industries - 2013
vii
Annual Survey of Industries - 2013
viii
List of Figures Figure 4.1: Distribution of establishments by industry sector – 2012
Figure 4.2: Number of persons engaged by industry sector – 2012
Figure 4.3: No. of establishments by industry division
Figure 4.4: No. of persons engaged by industry division
Figure 4.5: Input and output values by industry division-2012
Figure 4.6: Distribution of establishments by province – 2012

Annual Survey of Industries - 2013
ix

Annual Survey of Industries - 2013
Chapter 1
Introduction
1An industry consists of a group of
establishments engaged on the same, or similar,
kinds of production activity.
Anyway there is no harmonized definition for the
term 'Industry' in business statistics due to its
wide usage in different circumstances. 'Industry'
is often used as a synonym for 'activity', for the
'industrial sector' and for 'industrial activity'.
1.1 BACKGROUND
The Department of Census and Statistics (DCS)
started to conduct its series of Annual Survey of
Manufacturing Industries (ASMI) in 1979 with the
reference year as the previous year 1978. The
frame of this survey was restricted to
manufacturing establishments registered with the
Ministry of Industries and the State owned
industrial establishments. (i.e. Public
Corporations, Departmental undertakings, Govt.
owned Business undertakings).
The last survey of this series was carried out in
1982. After the Census of Industry conducted in
1983, the ASMI was replaced by the Annual
Survey of Industries (ASI) covering Mining and
Quarrying, Manufacturing, Generation and
Distribution of Electricity, Gas and Water. The
Industrial frame generated from the Census of
Industry 1983 was used to conduct the series of
Annual Survey of Industries from 1984 to 2003.
1 United Nations, "System of National Account (SNA).
The frame of the new series is the register of
industrial establishments which is a product of
Census of Industry 2003/2004. This survey is the
28th of the ASI series, conducted in 2012 and the
reference period is 2012. The report contains
important industrial indicators relevant to all
establishments with 5 or more persons engaged.
1.2 OBJECTIVES The objectives of the survey are
Providing indicators of the performance and
the structure of the industrial sector.
Updating the list of industrial
establishments already available.
1.3 SCOPE AND COVERAGE The scope of the ASI is all activities categorized
under three industry divisions namely, Mining and
Quarrying, Manufacturing, Generation and
Distribution of Electricity, Gas and Water of the
International Standard Industrial Classification
(ISIC) Revision 3 of the United Nations.
All private sector establishments, state owned
industries and industries coming within the
purview of Board of Investment with 5 or more
persons engaged have been covered in this
survey.
But for this survey, establishments with persons
engaged more than 25 were covered because of
the workload due to the Economic Census
2013/14 activities at the field.
Annual Survey of Industries - 2013
- 2 -
Chapter 2
Methodology
ASI is predominantly a postal survey. But
the field officers of the DCS were sent to the
non-responding establishments to get
higher percentage of responses
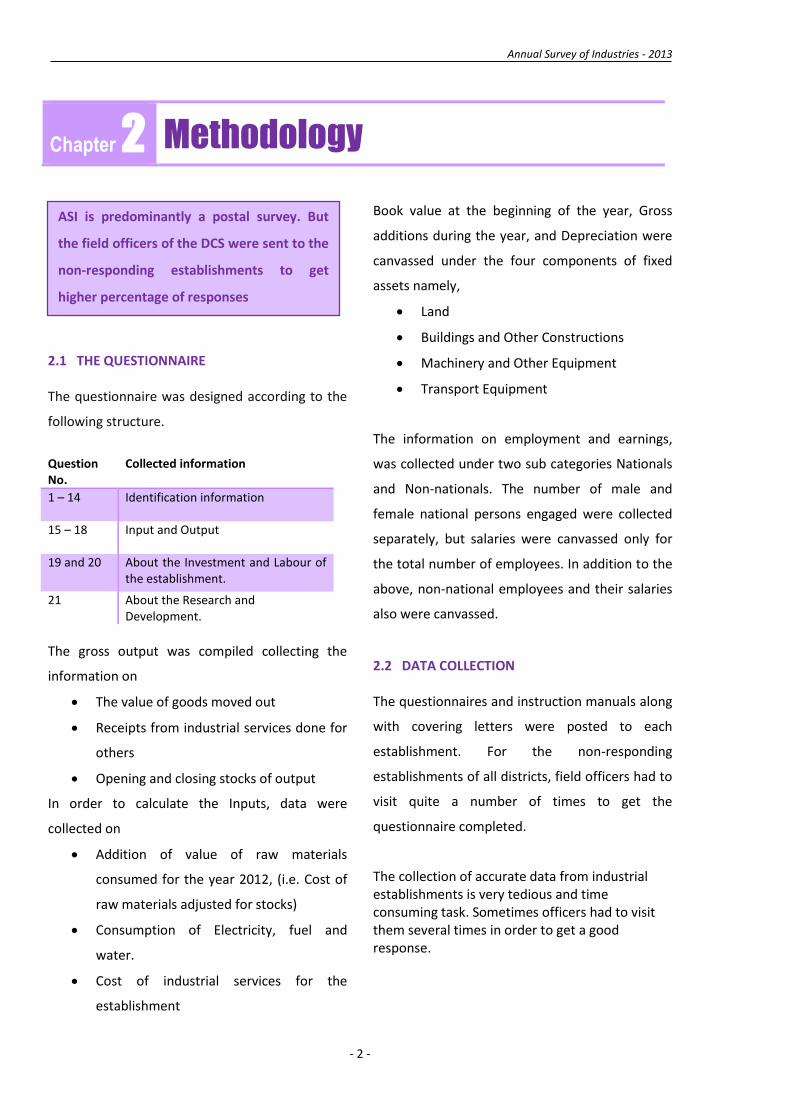
2.1 THE QUESTIONNAIRE The questionnaire was designed according to the
following structure.
Question No.
Collected information
1 – 14 Identification information
15 – 18 Input and Output
19 and 20 About the Investment and Labour of the establishment.
21 About the Research and Development.
The gross output was compiled collecting the
information on
The value of goods moved out
Receipts from industrial services done for
others
Opening and closing stocks of output
In order to calculate the Inputs, data were
collected on
Addition of value of raw materials
consumed for the year 2012, (i.e. Cost of
raw materials adjusted for stocks)
Consumption of Electricity, fuel and
water.
Cost of industrial services for the
establishment
Book value at the beginning of the year, Gross
additions during the year, and Depreciation were
canvassed under the four components of fixed
assets namely,
Land
Buildings and Other Constructions
Machinery and Other Equipment
Transport Equipment
The information on employment and earnings,
was collected under two sub categories Nationals
and Non-nationals. The number of male and
female national persons engaged were collected
separately, but salaries were canvassed only for
the total number of employees. In addition to the
above, non-national employees and their salaries
also were canvassed.
2.2 DATA COLLECTION The questionnaires and instruction manuals along
with covering letters were posted to each
establishment. For the non-responding
establishments of all districts, field officers had to
visit quite a number of times to get the
questionnaire completed.
The collection of accurate data from industrial establishments is very tedious and time consuming task. Sometimes officers had to visit them several times in order to get a good response.

Annual Survey of Industries - 2013
- 3 -
Therefore, considering the industries those
are significantly contributed to the total
output, DCS decided to conduct the survey
covering all the industries with 25 or more
persons engaged.
Since only the full enumeration section (all
the industries with number of persons
engaged were 25 or more) was conducted in
ASI 2013, Base weight; w1hk was assigned
one.
2.3 REFERENCE PERIOD
Reference period of the survey was the calendar
year 2012 (i.e. 1st of January to 31st of December).
But in some cases, establishments keep records
not for the calendar year but for the financial
year. (1st of April 2012 to 31st of March 2013) In
those situations, financial year data were
accepted when there was no significant
differences between two first quarters of both
years (2012 and 2013). Otherwise estimates for
the calendar year were accepted.
2.4 SURVEY DESIGN Usually ASI is conducted considering all industrial
establishments with 5 or more persons engaged.
The whole frame (Census of Industry 2003/2004)
is divided into two sections as establishments
with 25 or more persons engaged and
establishments with 5 - 24 persons engaged. All
establishments in the 25 or more sector (full
enumeration) and a probability sample of 5 to 24
sector (partial enumeration) are canvassed.
But 2013 survey covered only establishments with
25 or more person engaged considering the high
workload of the field staff of DCS due to the
listing activities of the first Economic Census
2013/14.
So, only full enumeration section was conducted
for ASL in 2013 whereas partial enumeration
section was not covered. Hence number of
establishments to be enumerated was reduced to
manage with the Field Officers’ time schedules.
There were 2,726 number of establishments with
number of person engaged 25 and above.
2.5 DETERMINATION OF WEIGHTS Theoretical Background
The final weight for kth respondent in the stratum
h, whk, is a composite of the base weight; w1hk ,
the non-response adjustment; w2hk and the factor
to compensate for coverage errors; w3hk such
that,
𝒘𝒉𝒌 = 𝒘𝟏𝒉𝒌 × 𝒘𝟐𝒉𝒌 × 𝒘𝟑𝒉𝒌
Base weight (𝑤1ℎ𝑘) The base weight is the reciprocal of the
probability of selection to the sample.
Non-response weight (𝑤2ℎ𝑘) The non-response weight is the ratio of the ratio
of the respondent units to the total respondents.
The establishments that were considered as non-
respondents are those who refused to participate
in the survey.
Sampling Frame Error weight (𝑤3ℎ𝑘) The followings are the influencing factors on
frame errors.
Establishments that cannot be located
Annual Survey of Industries - 2013
- 4 -
Establishments, which were closed (they
should not be included in the sampling
frame)
Establishments, which are out-of-scope
(the ISIC classification was not specified
correctly)
Establishments, which were duplicates
and mergers.
Therefore, requires an adjustment factor to be
incorporated in the weight. To illustrate, if Nh is
the population size for stratum h and nh is the
corresponding number of responded units.
Then the corresponding selection probability Ph is,
𝑷𝒉 =𝒏𝒉𝑵𝒉
If given the stratum h,
q1h - Proportion of establishments with frame
problems (proportion of those that should
not be included in the frame)
q2h - Proportion of establishments that were
missed in the frame (those that should be
listed but were not included)
Then the true population size of stratum h; N’h
should be,
𝑵′𝒉 = 𝑵𝒉 × (𝟏 − 𝒒𝟏𝒉 + 𝒒𝟐𝒉)
Hence the frame adjustment weight; w3hk is,
𝒘𝟑𝒉𝒌 = (𝟏 − 𝒒𝟏𝒉 + 𝒒𝟐𝒉)
(a) Estimation Estimates for each of the strata described above
could be derived separately.
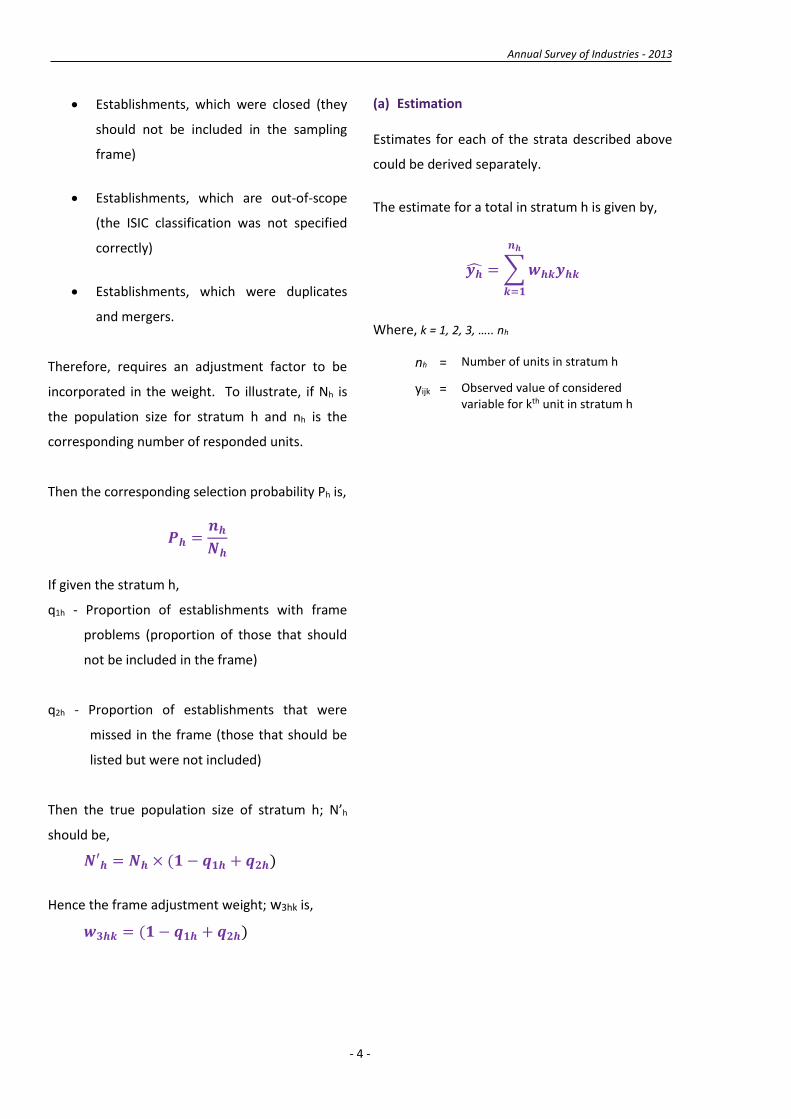
The estimate for a total in stratum h is given by,
𝒚�̂� =∑𝒘𝒉𝒌𝒚𝒉𝒌
𝒏𝒉
𝒌=𝟏
Where, k = 1, 2, 3, ….. nh
nh = Number of units in stratum h
yijk = Observed value of considered variable for kth unit in stratum h
Annual Survey of Industries - 2013
- 5 -
Chapter 3
Concepts and Definitions The concepts and definitions used in ASI 2013
were broadly in accordance with the United
Nations recommendations.
3.1 STATISTICAL UNIT Statistical unit of ASI is the establishment which is
defined as an unit engaged in single or related
activities of mining and quarrying, manufacturing,
generation and distribution of electricity, gas and
water in one location under a single ownership or
control.
However, industrial enterprises, which are
engaged in production of more than one related
activity in one location or one activity in several
locations, were treated as one unit of
enumeration whenever no separate records are
available.
In the analysis, the ideal definition of the
establishment was followed. The information
collected at enterprise level was disaggregated
into establishment level using the proportion of
output. Ancillary units such as warehouses,
garages, etc. were treated as part of the main
establishments.
3.2 OUTPUT Information on output has been collected on
shipment basis. The variables canvassed were the
value of products moved out from the
establishment, value of stocks of finished goods
and receipts from industrial services rendered to
others.
(a) Value of products moved out In order to calculate the product made by the
establishment, following two situations are
considered.
i. Value of products made by the
establishment using its own raw materials
ii. Products made by another establishment
using material inputs owned by the
establishment
Following three situations are considered as the
moving out.
i. Sending to another establishment or a
person
ii. Sending to another branch of the same
enterprise
iii. Sending abroad
These products were valued at the price at which
the producer disposes of his goods to the
customer (i.e. producer’s price). All duties and
taxes which fell on the products when they leave
the establishment are included and subsidies
recovered are excluded. Price rebates, discounts
and allowances on returned goods allowed to the
customer have been deducted and any
transport charges which may be invoiced to
the purchaser or user have been excluded.
Products released to other establishments of the
Annual Survey of Industries - 2013
- 6 -
same enterprise have been treated as though sold
and valued at producer’s prices.
(b) Stocks of finished goods The values of stocks of finished goods at the
beginning and at the end of the year 2012 have
been collected.
This consists of all finished goods made by the
establishment using their own raw materials and
manufactured by another establishment using
raw materials owned by this establishment and
ready for release. Finished goods held by the
establishment which were made from materials
owned by others have been excluded. Valuation is
in producer’s prices.
(c) Receipts from Industrial Services Following work are considered to calculate the
total value of receipts.
Contract and Commission work done for
others on materials owned by them
Repairs and installation work done for
others
Sales of scraps and refuses
Own account investment work
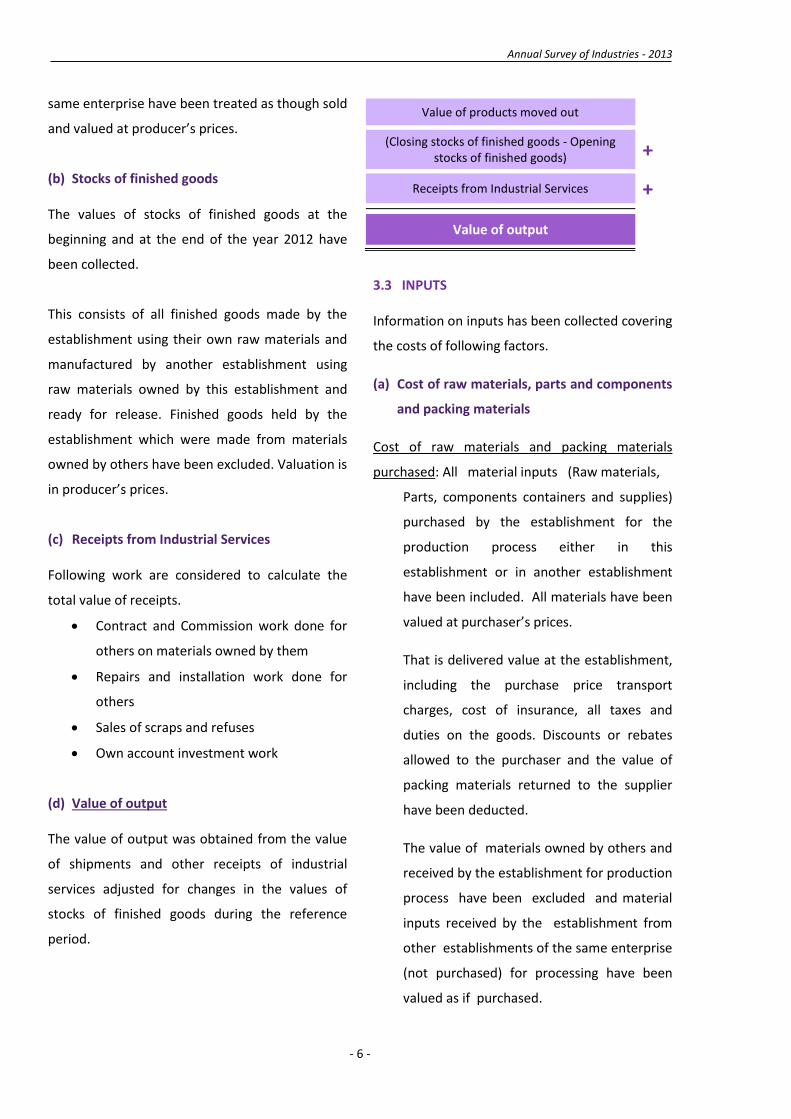
(d) Value of output The value of output was obtained from the value
of shipments and other receipts of industrial
services adjusted for changes in the values of
stocks of finished goods during the reference
period.
Value of products moved out
(Closing stocks of finished goods - Opening stocks of finished goods) +
Receipts from Industrial Services +
Value of output
3.3 INPUTS Information on inputs has been collected covering
the costs of following factors.
(a) Cost of raw materials, parts and components
and packing materials
Cost of raw materials and packing materials
purchased: All material inputs (Raw materials,
Parts, components containers and supplies)
purchased by the establishment for the
production process either in this
establishment or in another establishment
have been included. All materials have been
valued at purchaser’s prices.
That is delivered value at the establishment,
including the purchase price transport
charges, cost of insurance, all taxes and
duties on the goods. Discounts or rebates
allowed to the purchaser and the value of
packing materials returned to the supplier
have been deducted.
The value of materials owned by others and
received by the establishment for production
process have been excluded and material
inputs received by the establishment from
other establishments of the same enterprise
(not purchased) for processing have been
valued as if purchased.

Annual Survey of Industries - 2013
- 7 -
Values of stocks of raw materials and packing
materials etc. : The opening and closing stocks of
all input materials (imported and indigenous)
including packing materials which are
purchased (or treated as purchased) have
been included.
The valuation was at purchaser’s prices. The
stocks of raw material used for own account
work for producing own fixed assets have
been excluded.
(b) Cost of industrial services done by others:
Following work are considered to calculate the
Cost of industrial services done by others.
Contract and commission work done by
others on materials supplied by the
establishments
Repairs and maintenance services provided
by others are included.
(c) Fuel, electricity and water consumed
The total of the values of Fuel (LP Gas, Coal and
Charcoal, Petrol, Diesel Oil, Furnace Oil,
Kerosene Oil, Firewood and others) Electricity
and Water consumed has been included.
(d) Raw materials Consumed
Raw materials consumed (i.e. actually used) has
been computed by adjusting stocks of raw
materials to the total value of raw materials
(imported and indigenous) and packing materials
purchased.
Raw materials and packing materials purchased (Imported + Indigenous)
(Opening stock materials - Closing stock
materials) +
Raw materials and packing materials consumed
(e) Value of inputs The total value of raw materials consumed, cost
of industrial services done by others and Fuel,
Electricity and Water consumed have been
defined as the value of Inputs.
Value of raw materials consumed
cost of industrial services done by others +
Fuel, Electricity and Water consumed +
Value of inputs
3.4 VALUE ADDED Value added has been defined as the difference of
the value of output and value of inputs.
VALUE ADDED = OUTPUT - INPUT
3.5 FIXED CAPITAL ASSETS The book value at the beginning of the year, value
of gross additions during the year and
depreciation of all assets with productive life of
one year or more, owned by the establishment
(i.e. Land, Buildings, Other constructions and Land
improvements, Machinery and Other equipment,
Transport equipment) have been collected.
Leased or rented assets have not been included.
Annual Survey of Industries - 2013
- 8 -
(a) Book value at the beginning of the year
This refers to the original cost price of the item
less its depreciation, less assets retired and sold
upto the beginning of the year.
(b) Gross additions to fixed assets during the year
This is defined as the total of the costs of new and
second hand fixed assets acquired during the year
and alterations, renovations and improvements
purchased, cost of own account work less the
value of sales of used fixed assets.
Valuation of fixed assets acquired from others
was to be at the delivered price plus cost of
installation and any necessary fees and taxes.
Valuation of fixed assets produced own account
had to be valued with imputation for own labour
and materials used and an allocation for overhead
costs. Value of sales of used assets were to be at
actual amounts realise.
3.6 EMPLOYMENT AND EARNINGS The information obtained on employment related
to the number of persons engaged in the
establishment.
(a) Number of persons engaged This is defined as the total number of persons
who work in or for the establishment, including
working proprietors, active partners,
contributing family workers, operatives and all
other employees.
Working proprietors and active partners: All
individual proprietors and partners who are
actively engaged in the work of the
establishment have been included here.
Contributing family workers: All persons living in
the household of the owners and working in
the establishment, without a regular pay, for
at least one third of the normal working time
of the establishment and non-household
members who do work without pay were
included.
Operatives: All paid employees who were
directly engaged in the production or related
activities of the establishment including any
clerical or working supervisory personnel
whose function was to record or expedite
any step in the production process have been
considered as operatives.
Other Employees: All paid employees excluding
those covered as operatives are reported
here, eg. Managers, Directors, Laboratory and
Research workers, Clerks, Typists etc.
(b) Wages and Salaries All payments whether in cash or in kind
made by the employers during the year 2012 in
connection with the work done to all“
employees” had been included here.
Those are,
All regular and overtime cash payments
houses and cost of living allowances.
Wages and salaries paid during vacation
sick leaves
Taxes and social insurance contribution
Payments in kind
Annual Survey of Industries - 2013
- 9 -
Chapter 4
Major Findings
All the tabulations and graphs prepared for
establishments with 25 or more persons
engaged.
Chapter 4 consists of the major results obtained
after analyzing the data of ASI 2012.
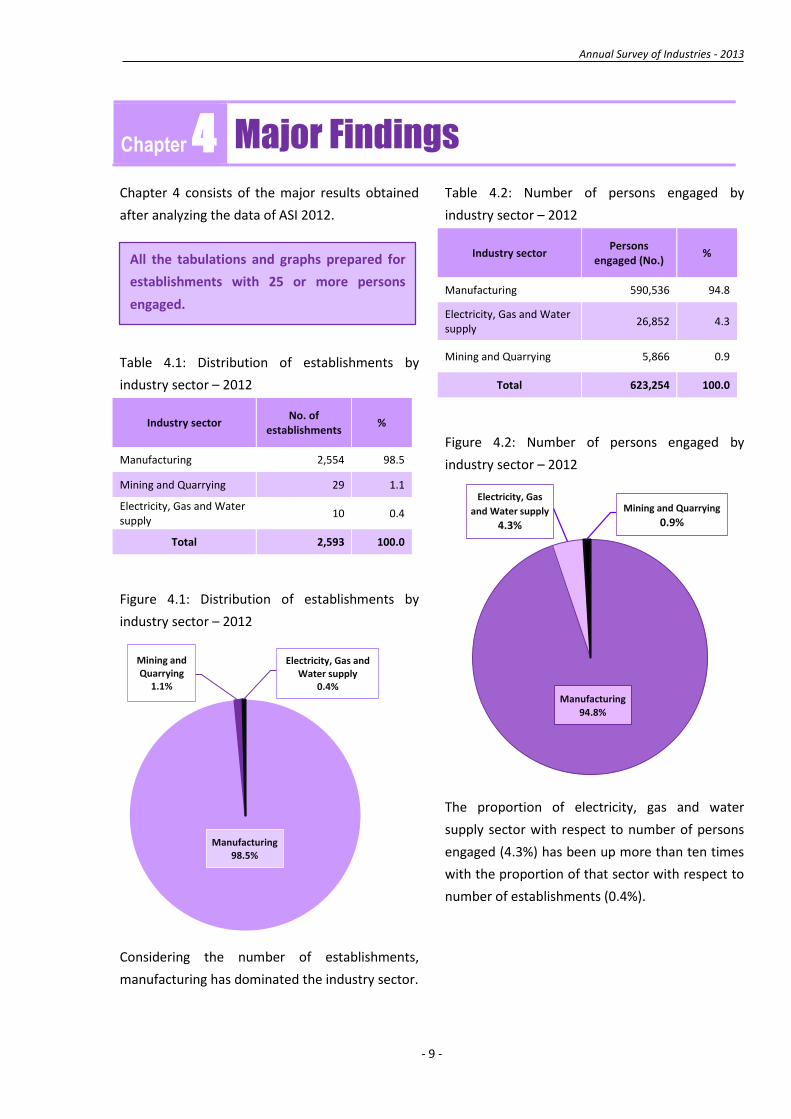
Table 4.1: Distribution of establishments by
industry sector – 2012
Industry sector No. of
establishments %
Manufacturing 2,554 98.5
Mining and Quarrying 29 1.1
Electricity, Gas and Water supply
10 0.4
Total 2,593 100.0
Figure 4.1: Distribution of establishments by
industry sector – 2012
Considering the number of establishments,
manufacturing has dominated the industry sector.
Table 4.2: Number of persons engaged by
industry sector – 2012
Industry sector Persons
engaged (No.) %
Manufacturing 590,536 94.8
Electricity, Gas and Water supply
26,852 4.3
Mining and Quarrying 5,866 0.9
Total 623,254 100.0
Figure 4.2: Number of persons engaged by
industry sector – 2012
The proportion of electricity, gas and water
supply sector with respect to number of persons
engaged (4.3%) has been up more than ten times
with the proportion of that sector with respect to
number of establishments (0.4%).
Manufacturing98.5%
Mining and Quarrying
1.1%
Electricity, Gas and Water supply
0.4%Manufacturing
94.8%
Electricity, Gas
and Water supply
4.3%
Mining and Quarrying
0.9%

Annual Survey of Industries - 2013
- 10 -
Table 4.3: Description for the ISIC 2 digit codes (Division)
ISIC 2D Code
(Division) Description
15 Manu. of food products and beverages
18 Manu. of wearing apparel, dressing & dyeing of fur
25 Manu. of rubber & plastic products
17 Manu. of Textiles
36 Manu. of furniture, Manufacturing of n.e.c.
24 Manu. of chemicals & chemical products
22 Publishing, printing and re-prod. of recorded media
26 Manu. of other non-metallic mineral products
21 Manu. of paper and paper products
28 Manu. of fabricated metal products except machinery equipments
27 Manu. of basic metals
19 Tanning and dressing of leather; Manu. of luggage, hand bags & footwear
20 Manu. of wood & products of wood & cork except furniture
31 Manu. of Electrical machinery and apparatus
14 Other Mining and Quarrying
29 Manu. of Machinery & equipments (n.e.c.)
35 Manu. of other transport equipments
16 Manu. of tobacco products
34 Manu. of motor vehicles, trailers & semi-trailers
32 Manu. of Radio, TV & communication equipment and apparatus
99 Other Industry
Table 4.4: No. of establishments by industry division w.r.t. No. of establishments
ISIC 2D Code (Division)
No. of establishments
%
15 874 33.7
18 475 18.3
25 260 10.0
17 187 7.2
36 143 5.5
24 107 4.1
22 82 3.2
26 77 3.0
21 59 2.3
28 58 2.2
27 42 1.6
19 38 1.5
20 34 1.3
31 32 1.2
14 29 1.1
29 28 1.1
35 17 0.7
16 14 0.6
34 9 0.3
32 8 0.3
99 21 0.8
Total 2,593 100.0
Figure 4.3: No. of establishments by industry division
According to the figure 4.3, manufacturing of food
products and beverages, manufacturing of
wearing apparel, dressing and dyeing of fur and
manufacturing of rubber & plastic products are
the three main industry divisions with respect to
number of establishments in industry sector.
Those divisions contribute 62 percent of total
establishments in industry sector in Sri Lanka.
0% 5% 10% 15% 20% 25% 30% 35%
99
32
34
16
35
29
14
31
20
19
27
28
21
26
22
24
36
17
25
18
15
Percentage of Establishments
ISIC
2 D
igit
Co
de
Annual Survey of Industries - 2013
- 11 -
Table 4.5: Description for the ISIC 2 digit codes (Division) w.r.t. person engaged
ISIC 2D Code
(Division) Description
18 Manu. of wearing Apparel, dressing & dyeing of fur
15 Manu. of food products and beverages
25 Manu. of rubber & plastic products
17 Manu. of Textiles
36 Manu. of furniture, Manufacturing of n.e.c.
40 Electricity, Gas, Steam and Hot water supply
22 Publishing, printing and reproduction of recorded
26 Manu. of other non-metallic mineral products
24 Manu. of chemicals & chemical products
41 Collection, purification and distribution of water
19 Tanning and dressing of leather; Manu. of luggage,
21 Manu. of paper and paper products
35 Manu. of other transport equipments
14 Other Mining and Quarrying
28 Manu. of fabricated metal products except machinery
31 Manu. of Electrical machinery and apparatus n.e.c.
16 Manu. of tobacco products
27 Manu. of basic metals
99 Other Industry
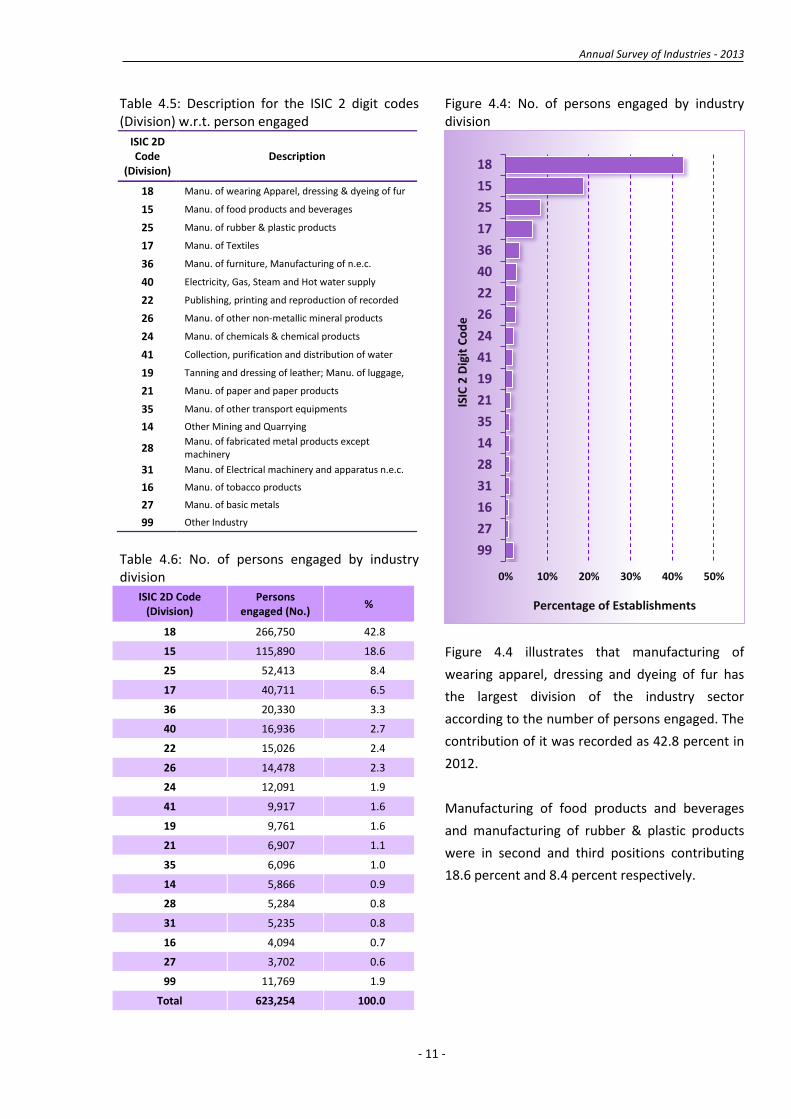
Table 4.6: No. of persons engaged by industry division
ISIC 2D Code (Division)
Persons engaged (No.)
%
18 266,750 42.8
15 115,890 18.6
25 52,413 8.4
17 40,711 6.5
36 20,330 3.3
40 16,936 2.7
22 15,026 2.4
26 14,478 2.3
24 12,091 1.9
41 9,917 1.6
19 9,761 1.6
21 6,907 1.1
35 6,096 1.0
14 5,866 0.9
28 5,284 0.8
31 5,235 0.8
16 4,094 0.7
27 3,702 0.6
99 11,769 1.9
Total 623,254 100.0
Figure 4.4: No. of persons engaged by industry division
Figure 4.4 illustrates that manufacturing of
wearing apparel, dressing and dyeing of fur has
the largest division of the industry sector
according to the number of persons engaged. The
contribution of it was recorded as 42.8 percent in
2012.
Manufacturing of food products and beverages
and manufacturing of rubber & plastic products
were in second and third positions contributing
18.6 percent and 8.4 percent respectively.
0% 10% 20% 30% 40% 50%
99
27
16
31
28
14
35
21
19
41
24
26
22
40
36
17
25
15
18
Percentage of Establishments
ISIC
2 D
igit
Co
de
Annual Survey of Industries - 2013
- 12 -
Table 4.7: Description for the ISIC 2 digit codes (Division) w.r.t. Input / Output value
ISIC 2D Code
(Division) Description
15 Manu. of food products and beverages
18 Manu. of wearing Apparel, dressing & dyeing of fur
99 Other Industry
25 Manu. of rubber & plastic products
26 Manu. of other non-metallic mineral products
17 Manu. of Textiles
16 Manu. of tobacco products
24 Manu. of chemicals & chemical products
36 Manu. of furniture, Manufacturing of n.e.c.
22 Publishing, printing and reproduction of recorded media
27 Manu. of basic metals
35 Manu. of other transport equipments
31 Manu. of Electrical machinery and apparatus n.e.c.
21 Manu. of paper and paper products
28 Manu. of fabricated metal products except machinery equipments
19 Tanning and dressing of leather; Manu. of luggage, handbags & footwear
29 Manu. of Machinery & equipments (n.e.c.)
14 Other Mining and Quarrying
32 Manu. of Radio, TV & communication equipment and apparatus
20 Manu. of wood & products of wood & cork except furniture
34 Manu. of motor vehicles, trailers and semi-trailers
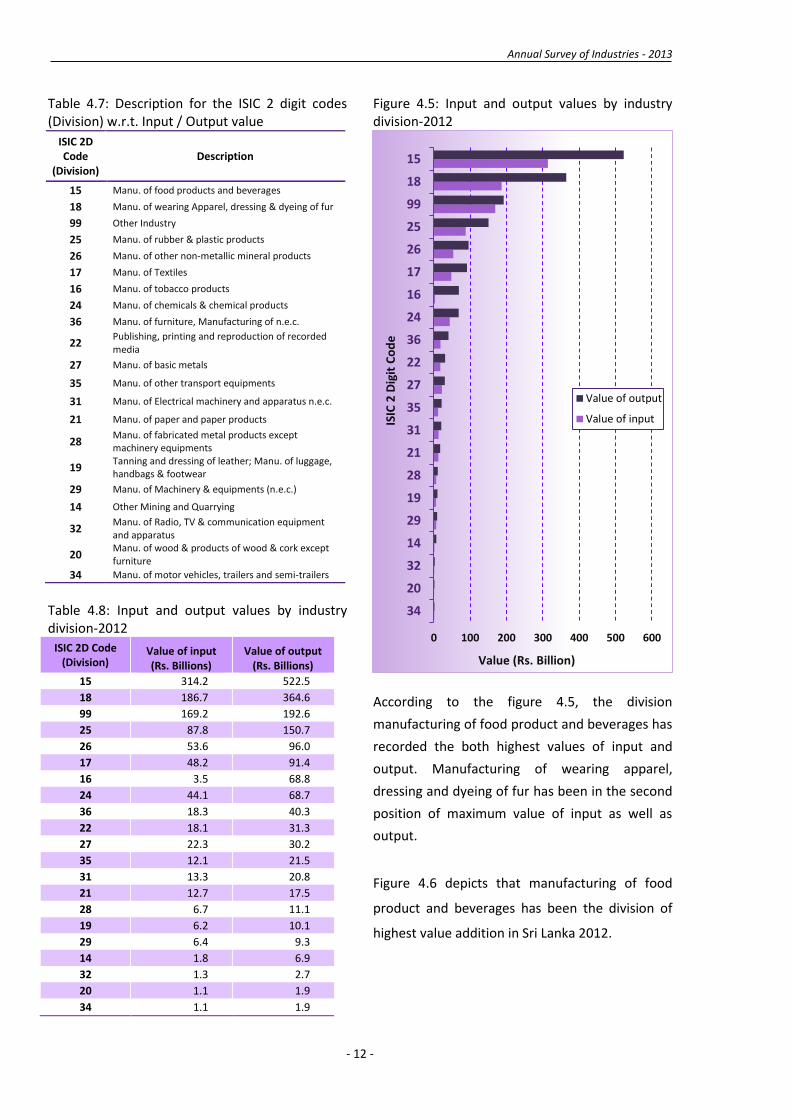
Table 4.8: Input and output values by industry division-2012
ISIC 2D Code (Division)
Value of input (Rs. Billions)
Value of output (Rs. Billions)
15 314.2 522.5
18 186.7 364.6
99 169.2 192.6
25 87.8 150.7
26 53.6 96.0
17 48.2 91.4
16 3.5 68.8
24 44.1 68.7
36 18.3 40.3
22 18.1 31.3
27 22.3 30.2
35 12.1 21.5
31 13.3 20.8
21 12.7 17.5
28 6.7 11.1
19 6.2 10.1
29 6.4 9.3
14 1.8 6.9
32 1.3 2.7
20 1.1 1.9
34 1.1 1.9
Figure 4.5: Input and output values by industry division-2012
According to the figure 4.5, the division
manufacturing of food product and beverages has
recorded the both highest values of input and
output. Manufacturing of wearing apparel,
dressing and dyeing of fur has been in the second
position of maximum value of input as well as
output.
Figure 4.6 depicts that manufacturing of food
product and beverages has been the division of
highest value addition in Sri Lanka 2012.
0 100 200 300 400 500 600
34
20
32
14
29
19
28
21
31
35
27
22
36
24
16
17
26
25
99
18
15
Value (Rs. Billion)
ISIC
2 D
igit
Co
de
Value of output
Value of input
Annual Survey of Industries - 2013
- 13 -
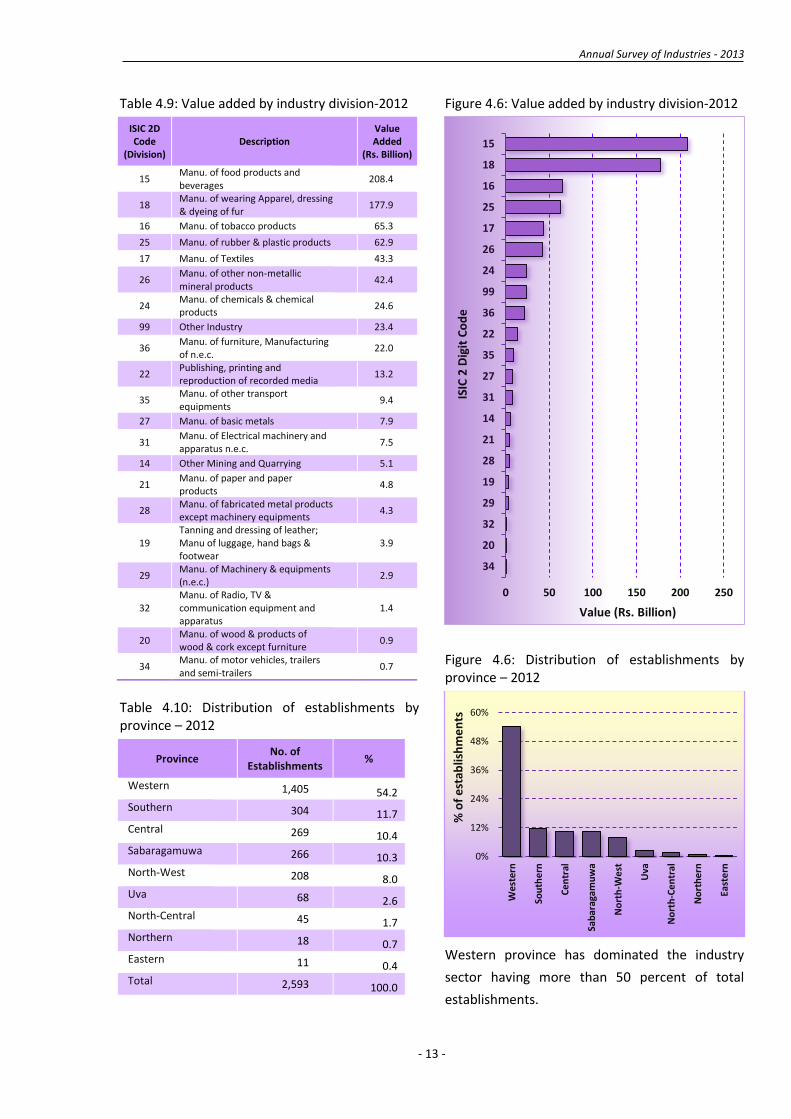
Table 4.9: Value added by industry division-2012
ISIC 2D Code
(Division) Description
Value Added
(Rs. Billion)
15 Manu. of food products and beverages
208.4
18 Manu. of wearing Apparel, dressing & dyeing of fur
177.9
16 Manu. of tobacco products 65.3
25 Manu. of rubber & plastic products 62.9
17 Manu. of Textiles 43.3
26 Manu. of other non-metallic mineral products
42.4
24 Manu. of chemicals & chemical products
24.6
99 Other Industry 23.4
36 Manu. of furniture, Manufacturing of n.e.c.
22.0
22 Publishing, printing and reproduction of recorded media
13.2
35 Manu. of other transport equipments
9.4
27 Manu. of basic metals 7.9
31 Manu. of Electrical machinery and apparatus n.e.c.
7.5
14 Other Mining and Quarrying 5.1
21 Manu. of paper and paper products
4.8
28 Manu. of fabricated metal products except machinery equipments
4.3
19 Tanning and dressing of leather; Manu of luggage, hand bags & footwear
3.9
29 Manu. of Machinery & equipments (n.e.c.)
2.9
32 Manu. of Radio, TV & communication equipment and apparatus
1.4
20 Manu. of wood & products of wood & cork except furniture
0.9
34 Manu. of motor vehicles, trailers and semi-trailers
0.7
Table 4.10: Distribution of establishments by province – 2012
Province No. of
Establishments %
Western 1,405 54.2 Southern 304 11.7 Central 269 10.4 Sabaragamuwa 266 10.3 North-West 208 8.0 Uva 68 2.6 North-Central 45 1.7 Northern 18 0.7 Eastern 11 0.4 Total 2,593 100.0
Figure 4.6: Value added by industry division-2012
Figure 4.6: Distribution of establishments by province – 2012
Western province has dominated the industry
sector having more than 50 percent of total
establishments.
0 50 100 150 200 250
34
20
32
29
19
28
21
14
31
27
35
22
36
99
24
26
17
25
16
18
15
Value (Rs. Billion)
ISIC
2 D
igit
Co
de
0%
12%
24%
36%
48%
60%
Wes
tern
So
uth
ern
Ce
ntr
al
Sab
arag
amu
wa
No
rth
-We
st
Uva
No
rth
-Ce
ntr
al
No
rth
ern
Eas
tern
% o
f e
stab
lish
me
nts

Annual Survey of Industries - 2013
- 14 -

Annual Survey of Industries - 2013
- 15 -
Chapter 5
Statistical Tables

Annual Survey of Industries - 2013
- 16 -
Annual Survey of Industries - 2013
- 17 -
Annual Survey of Industries - 2013
- 18 -

Annual Survey of Industries - 2013
- 19 -

Annual Survey of Industries - 2013
- 20 -
T
ab
le 5
.2 : P
rin
cip
al in
dic
ato
rs o
f in
du
str
ial
acti
vit
y c
las
sif
ied
by
In
du
str
y s
ecto
r &
pe
rso
ns
en
ga
ge
d s
ize
cla
ss
- 2
012
(Es
tab
lis
hm
en
ts w
ith
25 o
r m
ore
pe
rso
ns
en
gag
ed
)
29
5,8
66
5,8
03
1,0
18,5
94,1
33
6,8
90,5
16,2
48
1,8
33,0
61,3
02
5,0
57,4
54,9
46
12
35
730
239
,120
,419
13
1,8
87,9
25
35
,122
,938
96
,764
,987
839
239
262
,746
,862
52
9,0
52,3
81
35
2,8
60,9
74
17
6,1
91,4
08
10
5,1
17
5,1
09
91
6,7
26,8
52
6,2
29,5
75,9
42
1,4
45,0
77,3
90
4,7
84,4
98,5
52
2,5
54
59
0,5
36
58
8,1
86
11
5,5
17,3
32
,267
1,7
55,1
47,9
43
,172
1,0
27,0
58,1
77
,678
72
8,0
89,7
65
,494
40
212
,899
12
,590
2,0
39,1
46,2
98
53
,236
,730,8
01
29
,661
,012,2
97
23
,575
,718,5
04
97
563
,920
63
,398
11
,695
,103,9
55
21
8,0
23,1
70
,534
12
2,0
48,5
56
,545
95
,974
,613,9
88
1,1
77
51
3,7
17
51
2,1
99
10
1,7
83,0
82
,015
1,4
83,8
88,0
41
,836
87
5,3
48,6
08
,835
60
8,5
39,4
33
,001
10
26
,852
26
,849
18
,239
,289,6
38
37
4,6
18,7
92
,502
17
7,8
20,8
53
,154
19
6,7
97,9
39
,348
396
96
27
,670
,430
28
6,2
96,5
24
18
6,7
52,1
67
99
,544
,357
528
227
960
,453
,208
1,1
68,4
01,1
63
11
4,8
27,6
11
1,0
53,5
73,5
52
226
,474
26
,474
18
,151
,166,0
00
37
3,1
64,0
94
,815
17
7,5
19,2
73
,376
19
5,6
44,8
21
,439
2,5
93
62
3,2
54
62
0,8
38
13
4,7
75,2
16
,037
2,1
36,6
57,2
51
,921
1,2
06,7
12,0
92
,133
92
9,9
45,1
59
,788
Gro
up
To
tal
20
- 3
9
40
- 9
9
10
0 &
ab
ov
e
C M
inin
g a
nd
Qu
arr
yin
g
Gro
up
To
tal
20
- 3
9
40
- 9
9
10
0 &
ab
ov
e
D
Man
ufa
ctu
rin
g
Gro
up
To
tal
20
- 3
9
40
- 9
9
10
0 &
ab
ov
e
E E
lectr
icit
y, G
as
an
d W
ate
r s
up
ply
To
tal
Ind
us
try
se
cto
r &
Pe
rso
ns
en
gag
ed
siz
e
cla
ss
No
. o
f
es
tab
lis
hm
en
ts
Pe
rso
ns
en
gag
ed
(N
o.)
Em
plo
ye
es
(No
.)
Sala
rie
s &
Wa
ge
s (
Rs
.)
Valu
e o
f o
utp
ut
(Rs
.)
Valu
e o
f in
pu
t
(Rs
.)
Valu
e a
dd
ed
(Rs
.)
Annual Survey of Industries - 2013
- 21 -
Annual Survey of Industries - 2013
- 22 -
Annual Survey of Industries - 2013
- 23 -

Annual Survey of Industries - 2013
- 24 -
Annual Survey of Industries - 2013
- 25 -
Annual Survey of Industries - 2013
- 26 -
Annual Survey of Industries - 2013
- 27 -
Tab
le 5
.5 : P
rin
cip
al in
dic
ato
rs o
f in
du
str
ial a
cti
vit
y c
las
sif
ied
by
dis
tric
t -
201
2
(Es
tab
lis
hm
en
ts w
ith
25 o
r m
ore
pe
rso
ns
en
gag
ed
)
(fo
r m
an
ufa
ctu
rin
g s
ec
tor)
64
813
7,7
81
13
7,5
02
33
,738
,315,3
78
68
7,0
50,3
12
,662
41
7,9
41,3
20
,387
26
9,1
08,9
92
,276
60
317
4,7
12
17
4,2
49
39
,152
,062,5
10
58
6,2
60,4
77
,981
35
3,5
16,3
43
,467
23
2,7
44,1
34
,514
15
029
,833
29
,628
5,1
74,9
84,3
36
44
,589
,463,0
43
22
,787
,180,9
29
21
,802
,282,1
13
10
623
,707
23
,659
3,4
91,9
48,1
90
41
,006
,541,1
74
20
,377
,500,7
93
20
,629
,040,3
80
27
6,7
40
6,7
29
1,1
88,7
11,3
95
10
,391
,542,5
95
6,0
68,6
88,2
08
4,3
22,8
54,3
86
12
619
,129
19
,113
3,5
23,1
07,8
93
48
,406
,204,2
72
14
,932
,002,2
75
33
,474
,201,9
97
13
718
,462
18
,378
2,7
34,3
18,1
72
39
,992
,657,6
85
27
,068
,072,3
09
12
,924
,585,3
77
14
318
,496
18
,383
2,8
31,7
02,4
48
35
,555
,729,4
59
18
,973
,515,8
91
16
,582
,213,5
68
19
7,8
95
7,6
96
1,1
35,2
74,6
91
5,2
22,2
46,0
36
2,3
99,7
95,4
14
2,8
22,4
50,6
22
14
78
276
886
,486
,704
77
9,4
18,0
21
32
4,7
82,6
12
45
4,6
35,4
08
413
112
616
,088
,976
29
,453
,880
28
,359
,948
43
,218
,061
395
795
726
9,6
39,3
26
5,9
05,8
06,0
48
4,7
43,9
23,5
45
1,1
61,8
82,5
02
42,5
88
2,5
88
54
7,7
14,8
23
2,1
20,9
47,0
56
1,4
49,3
52,0
03
67
1,5
95,0
53
13
752
,620
52
,566
8,0
21,3
36,2
03
10
6,1
28,9
74
,117
56
,750
,396,7
27
49
,378
,577,3
90
67
11
,748
11
,707
2,0
46,6
97,4
96
27
,217
,534,5
37
16
,441
,478,0
71
10
,776
,056,4
66
30
10
,218
10
,204
1,4
89,4
95,4
12
8,7
27,9
41,9
93
4,9
01,9
84,5
50
3,8
25,9
57,4
43
14
6,2
19
6,2
19
70
6,8
68,2
01
7,5
24,0
05,5
41
4,7
63,1
81,2
85
2,7
60,8
24,2
56
55
14
,258
13
,741
1,2
77,1
39,7
08
12
,968
,619,2
44
5,2
53,4
42,1
17
7,7
15,1
77,1
27
11
1,7
26
1,7
16
26
4,4
55,0
09
6,9
55,2
46,2
71
2,5
34,0
07,7
52
4,4
21,2
38,5
18
18
235
,925
35
,677
5,5
70,5
80,1
48
57
,365
,801,2
68
33
,601
,129,7
72
23
,764
,671,4
96
75
16
,611
16
,581
2,2
50,4
05,2
47
20
,906
,896,1
61
12
,201
,719,6
21
8,7
05,1
76,5
40
2,5
54
59
0,5
36
58
8,1
86
11
5,5
17,3
32
,267
1,7
55,1
47,9
43
,172
1,0
27,0
58,1
77
,678
72
8,0
89,7
65
,494
Co
lom
bo
Gam
pah
a
Ka
luta
ra
Ka
nd
y
Mata
le
Nu
wa
ra-E
liya
Galle
Mata
ra
Ha
mb
an
tota
Jaff
na &
Man
na
r
Vavu
niy
a &
Mu
lla
itiv
u
Ba
ttic
alo
a &
Trin
co
ma
lee
Am
para
Ku
run
eg
ala
Pu
ttala
m
An
ura
dh
ap
ura
Po
lon
na
ruw
a
Ba
du
lla
Mo
ne
rag
ala
Ra
tna
pu
ra
Ke
ga
lle
To
tal
Dis
tric
tN
o.
of
es
tab
lis
hm
en
ts
Pe
rso
ns
en
gag
ed
(N
o.)
Em
plo
ye
es
(No
.)
Sala
rie
s &
Wa
ge
s (
Rs
.)
Valu
e o
f o
utp
ut
(Rs
.)
Valu
e o
f in
pu
t
(Rs
.)
Valu
e a
dd
ed
(Rs
.)

Annual Survey of Industries - 2013
- 28 -
Tab
le 5
.6 : E
sta
blis
hm
en
ts c
las
sif
ied
by p
ers
on
s e
ng
ag
ed
siz
e c
las
s &
in
du
str
y d
ivis
ion
- 2
01
2
(Es
tab
lis
hm
en
ts w
ith
25 o
r m
ore
pe
rso
ns
en
ga
ge
d)
14
510
29
17
035
934
487
4
80
714
66
59
62
18
7
47
57
37
147
5
15
10
13
38
18
78
34
25
15
20
59
33
23
26
82
11
13
42
25
40
10
7
56
71
13
326
0
23
25
29
77
14
17
11
42
23
16
19
58
11
10
728
00
44
711
14
32
51
28
10
01
24
39
05
12
17
46
46
51
14
3
21
03
23
16
22
14
63
277
31,1
89
2,5
93
14 O
the
r M
inin
g a
nd
Qu
arr
yin
g
15 M
an
u.o
f fo
od
pro
du
cts
an
d b
eve
rag
es
16 M
an
u.o
f to
bac
co
pro
du
cts
17 M
an
u.o
f T
ex
tile
s
18 M
an
u.o
f w
eari
ng
Ap
pare
l, d
res
sin
g &
dy
ein
g o
f fu
r
19 T
an
nin
g a
nd
dre
ss
ing
of
leath
er; m
an
u. o
f lu
gg
ag
e, h
an
d b
ag
s
20 M
an
u.o
f w
oo
d &
pro
du
cts
of
wo
od
& c
ork
exc
ep
t fu
rnit
ure
21 M
an
u.o
f p
ap
er
an
d p
ap
er p
rod
ucts
22 P
ub
lis
hin
g,
prin
tin
g a
nd
re
pro
du
cti
on
of
reco
rde
d m
ed
ia
23 M
an
u.o
f co
ke
re
fin
ed
pe
tro
leu
m p
rod
uc
ts a
nd
nu
cle
ar f
ue
l
24 M
an
u.o
f ch
em
icals
& c
he
mic
al p
rod
uc
ts
25 M
an
u.o
f ru
bb
er &
pla
sti
c p
ro
du
cts
26 M
an
u. o
f o
the
r n
on
me
tallic
min
era
l p
rod
uc
ts
27 M
an
u.o
f b
as
ic m
eta
ls
28 M
an
u.o
f fa
bri
cate
d m
eta
l p
rod
ucts
exc
ep
t m
ac
hin
ery
eq
uip
me
nts
29 M
an
u.o
f M
ach
ine
ry &
eq
uip
me
nts
(n
.e.c
.)
30 M
an
u.o
f o
ffic
e, a
cc
ou
nti
ng
an
d c
om
pu
tin
g m
ac
hin
ery
31 M
an
u.o
f Ele
ctr
ical
ma
ch
ine
ry a
nd
ap
para
tus
n.e
.c.
32 M
an
u.o
f R
ad
io, T
V &
co
mm
un
ica
tio
n e
qu
ipm
en
t a
nd
ap
pa
ratu
s
33 M
an
u.o
f m
ed
ical, p
recis
ion
& o
pti
cal in
str
um
en
ts, w
atc
he
s
34 M
an
u.o
f m
oto
r v
eh
icle
s, tr
aile
rs a
nd
se
mi-
trail
ers
35 M
an
u.o
f o
the
r tr
an
sp
ort
eq
uip
me
nt
36 M
an
u.o
f fu
rn
itu
re
, M
an
ufa
ctu
rin
g o
f n
.e.c
.
37 R
ec
ycli
ng
40 E
lectr
icit
y,
Gas
, S
team
an
d H
ot
wate
r s
up
ply
41 C
olle
cti
on
, p
uri
fica
tio
n a
nd
dis
trib
uti
on
of
wa
ter
To
tal
Ind
us
try
div
isio
n
les
s t
han
50
50
- 9
910
0 &
ab
ove
Pe
rso
ns
en
ga
ge
d s
ize
cla
ss
To
tal
Annual Survey of Industries - 2013
- 29 -
Annual Survey of Industries - 2013
- 30 -
Annual Survey of Industries - 2013
- 31 -
Annual Survey of Industries - 2013
- 32 -
Annual Survey of Industries - 2013
- 33 -
Annual Survey of Industries - 2013
- 34 -
Annual Survey of Industries - 2013
- 35 -
Annual Survey of Industries - 2013
- 36 -
Annual Survey of Industries - 2013
- 37 -
Annual Survey of Industries - 2013
- 38 -
Annual Survey of Industries - 2013
- 39 -
Annual Survey of Industries - 2013
- 40 -
Annual Survey of Industries - 2013
- 41 -

Annual Survey of Industries - 2013
- 42 -
Annual Survey of Industries - 2013
- 43 -

Annual Survey of Industries - 2013
- 44 -
Annual Survey of Industries - 2013
- 45 -
Annual Survey of Industries - 2013
- 46 -
Annual Survey of Industries - 2013
- 47 -

Annual Survey of Industries - 2013
- 48 -

Annual Survey of Industries - 2013
- 49 -
Annual Survey of Industries - 2013
- 50 -
Annual Survey of Industries - 2013
- 51 -

Annual Survey of Industries - 2013
- 52 -
Annual Survey of Industries - 2013
- 53 -
Annual Survey of Industries - 2013
- 54 -
Annual Survey of Industries - 2013
- 55 -
Annual Survey of Industries - 2013
- 56 -
Annual Survey of Industries - 2013
- 57 -
Annual Survey of Industries - 2013
- 58 -
Annual Survey of Industries - 2013
- 59 -

Annual Survey of Industries - 2013
- 60 -
Annual Survey of Industries - 2013
- 61 -

Annual Survey of Industries - 2013
- 62 -
Annual Survey of Industries - 2013
- 63 -

Annual Survey of Industries - 2013
- 64 -

Annual Survey of Industries - 2013
- 65 -

Annual Survey of Industries - 2013
- 66 -
Annual Survey of Industries - 2013
- 67 -

Annual Survey of Industries - 2013
- 68 -
Annual Survey of Industries - 2013
- 69 -
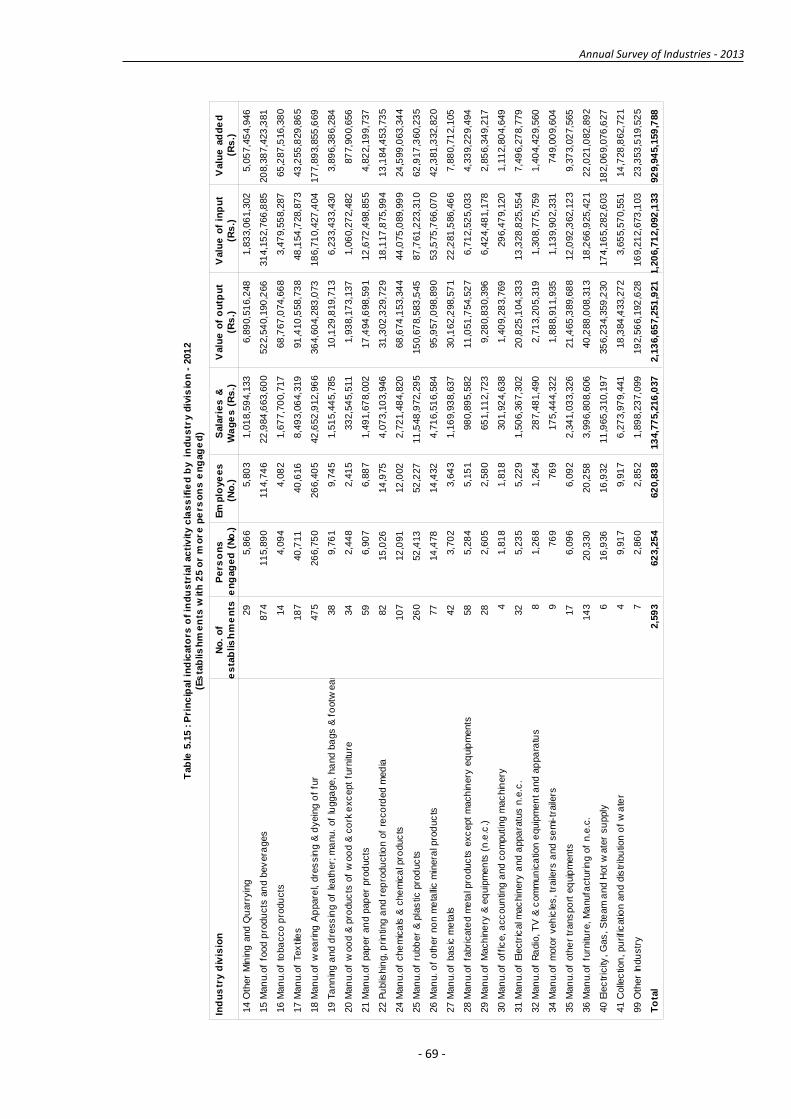
Tab
le 5
.15 :
Pri
nc
ipal
ind
icato
rs o
f in
du
str
ial
ac
tiv
ity
cla
ss
ifie
d b
y in
du
str
y d
ivis
ion
- 2
01
2
(Es
tab
lis
hm
en
ts w
ith
25 o
r m
ore
pe
rso
ns
en
gag
ed
)
29
5,8
66
5,8
03
1,0
18,5
94,1
33
6,8
90,5
16,2
48
1,8
33,0
61,3
02
5,0
57,4
54,9
46
87
411
5,8
90
11
4,7
46
22
,984
,663,6
00
52
2,5
40,1
90
,266
31
4,1
52,7
66
,885
20
8,3
87,4
23
,381
14
4,0
94
4,0
82
1,6
77,7
00,7
17
68
,767
,074,6
68
3,4
79,5
58,2
87
65
,287
,516,3
80
18
740
,711
40
,616
8,4
93,0
64,3
19
91
,410
,558,7
38
48
,154
,728,8
73
43
,255
,829,8
65
47
526
6,7
50
26
6,4
05
42
,652
,912,9
66
36
4,6
04,2
83
,073
18
6,7
10,4
27
,404
17
7,8
93,8
55
,669
38
9,7
61
9,7
45
1,5
15,4
45,7
85
10
,129
,819,7
13
6,2
33,4
33,4
30
3,8
96,3
86,2
84
34
2,4
48
2,4
15
33
2,5
45,5
11
1,9
38,1
73,1
37
1,0
60,2
72,4
82
87
7,9
00,6
56
59
6,9
07
6,8
87
1,4
91,6
78,0
02
17
,494
,698,5
91
12
,672
,498,8
55
4,8
22,1
99,7
37
82
15
,026
14
,975
4,0
73,1
03,9
46
31
,302
,329,7
29
18
,117
,875,9
94
13
,184
,453,7
35
10
712
,091
12
,002
2,7
21,4
84,8
20
68
,674
,153,3
44
44
,075
,089,9
99
24
,599
,063,3
44
26
052
,413
52
,227
11
,548
,972,2
95
15
0,6
78,5
83
,545
87
,761
,223,3
10
62
,917
,360,2
35
77
14
,478
14
,432
4,7
16,5
16,5
84
95
,957
,098,8
90
53
,575
,766,0
70
42
,381
,332,8
20
42
3,7
02
3,6
43
1,1
69,9
38,6
37
30
,162
,298,5
71
22
,281
,586,4
66
7,8
80,7
12,1
05
58
5,2
84
5,1
51
98
0,8
95,5
82
11
,051
,754,5
27
6,7
12,5
25,0
33
4,3
39,2
29,4
94
28
2,6
05
2,5
80
65
1,1
12,7
23
9,2
80,8
30,3
96
6,4
24,4
81,1
78
2,8
56,3
49,2
17
41,8
18
1,8
18
30
1,9
24,6
38
1,4
09,2
83,7
69
29
6,4
79,1
20
1,1
12,8
04,6
49
32
5,2
35
5,2
29
1,5
06,3
67,3
02
20
,825
,104,3
33
13
,328
,825,5
54
7,4
96,2
78,7
79
81,2
68
1,2
64
28
7,4
81,4
90
2,7
13,2
05,3
19
1,3
08,7
75,7
59
1,4
04,4
29,5
60
976
976
917
5,4
44,3
22
1,8
88,9
11,9
35
1,1
39,9
02,3
31
74
9,0
09,6
04
17
6,0
96
6,0
92
2,3
41,0
33,3
26
21
,465
,389,6
88
12
,092
,362,1
23
9,3
73,0
27,5
65
14
320
,330
20
,258
3,9
96,8
08,6
06
40
,288
,008,3
13
18
,266
,925,4
21
22
,021
,082,8
92
616
,936
16
,932
11
,965
,310,1
97
35
6,2
34,3
59
,230
17
4,1
65,2
82
,603
18
2,0
69,0
76
,627
49,9
17
9,9
17
6,2
73,9
79,4
41
18
,384
,433,2
72
3,6
55,5
70,5
51
14
,728
,862,7
21
72,8
60
2,8
52
1,8
98,2
37,0
99
19
2,5
66,1
92
,628
16
9,2
12,6
73
,103
23
,353
,519,5
25
2,5
93
62
3,2
54
62
0,8
38
13
4,7
75,2
16
,037
2,1
36,6
57,2
51
,921
1,2
06,7
12,0
92
,133
92
9,9
45,1
59
,788
14 O
ther
Min
ing
and
Qu
arr
yin
g
15 M
an
u.o
f fo
od
pro
du
cts
an
d b
ev
era
ges
16 M
an
u.o
f to
ba
cco
pro
du
cts
17 M
an
u.o
f Tex
tile
s
18 M
an
u.o
f w
ea
ring
Ap
pare
l, dre
ssin
g &
dyein
g o
f fu
r
19 T
ann
ing
and
dre
ss
ing o
f le
ath
er;
ma
nu.
of
lugga
ge,
ha
nd b
ags &
fo
otw
ea
r
20 M
an
u.o
f w
oo
d &
pro
duc
ts o
f w
oo
d &
co
rk e
xc
ept
furn
iture
21 M
an
u.o
f pap
er
an
d p
ap
er
pro
ducts
22 P
ublis
hin
g, p
rin
ting a
nd r
ep
rodu
ctio
n o
f re
co
rded
med
ia
24 M
an
u.o
f che
mic
als
& c
he
mic
al p
roduc
ts
25 M
an
u.o
f ru
bb
er
& p
las
tic p
rod
uc
ts
26 M
an
u. o
f o
ther
no
n m
eta
llic
min
era
l pro
duc
ts
27 M
an
u.o
f bas
ic m
eta
ls
28 M
an
u.o
f fa
bri
cate
d m
eta
l pro
duc
ts e
xc
ept
mach
inery
eq
uip
ments
29 M
an
u.o
f M
ach
ine
ry &
eq
uip
men
ts (
n.e
.c.)
30 M
an
u.o
f off
ice, a
cc
oun
ting
and c
om
puting m
ac
hin
ery
31 M
an
u.o
f Ele
ctr
ical m
ac
hin
ery
and a
ppa
ratu
s n
.e.c
.
32 M
an
u.o
f R
adio
, T
V &
com
mun
ica
tion
equip
men
t a
nd a
ppa
ratu
s
34 M
an
u.o
f m
oto
r veh
icle
s, tr
aile
rs a
nd s
em
i-tr
aile
rs
35 M
an
u.o
f oth
er
trans
po
rt e
quip
ments
36 M
an
u.o
f fu
rnitu
re, M
anufa
ctu
rin
g o
f n.e
.c.
40 E
lec
tric
ity, G
as
, S
team
and
Hot
wate
r su
pply
41 C
olle
ctio
n, pu
rific
atio
n a
nd d
istr
ibu
tion o
f w
ate
r
99 O
ther
Indu
str
y
To
tal
Ind
us
try
div
isio
nN
o.
of
es
tab
lis
hm
en
ts
Pe
rso
ns
en
gag
ed
(N
o.)
Em
plo
ye
es
(No
.)
Sala
rie
s &
Wa
ge
s (
Rs
.)
Valu
e o
f o
utp
ut
(Rs
.)
Valu
e o
f in
pu
t
(Rs
.)
Valu
e a
dd
ed
(Rs
.)
Annual Survey of Industries - 2013
- 70 -
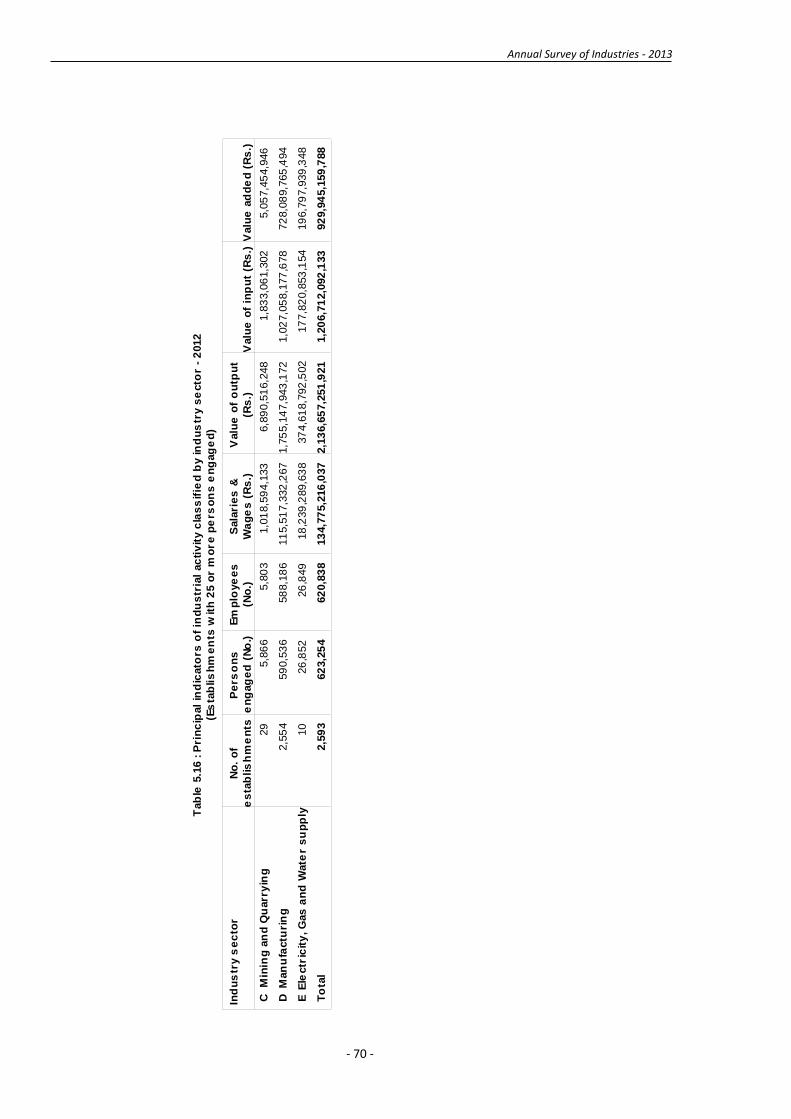
Tab
le 5
.16 :
Pri
nc
ipal
ind
icato
rs o
f in
du
str
ial
ac
tiv
ity c
las
sif
ied
by in
du
str
y s
ecto
r -
2012
(Es
tab
lis
hm
en
ts w
ith
25 o
r m
ore
pe
rso
ns
en
gag
ed
)
29
5,8
66
5,8
03
1,0
18,5
94,1
33
6,8
90,5
16,2
48
1,8
33,0
61,3
02
5,0
57,4
54,9
46
2,5
54
59
0,5
36
58
8,1
86
11
5,5
17,3
32
,267
1,7
55,1
47,9
43
,172
1,0
27,0
58,1
77
,678
72
8,0
89,7
65
,494
10
26
,852
26
,849
18
,239
,289,6
38
37
4,6
18,7
92
,502
17
7,8
20,8
53
,154
19
6,7
97,9
39
,348
2,5
93
62
3,2
54
62
0,8
38
13
4,7
75,2
16
,037
2,1
36,6
57,2
51
,921
1,2
06,7
12,0
92
,133
92
9,9
45,1
59
,788
C M
inin
g a
nd
Qu
arr
yin
g
D
Man
ufa
ctu
rin
g
E E
lectr
icit
y, G
as
an
d W
ate
r s
up
ply
To
tal
Ind
us
try
se
cto
rN
o.
of
es
tab
lis
hm
en
ts
Pe
rso
ns
en
gag
ed
(N
o.)
Em
plo
ye
es
(No
.)
Sala
rie
s &
Wa
ge
s (
Rs
.)
Valu
e o
f o
utp
ut
(Rs
.)V
alu
e o
f in
pu
t (R
s.)
Valu
e a
dd
ed
(R
s.)
Annual Survey of Industries - 2013
- 71 -
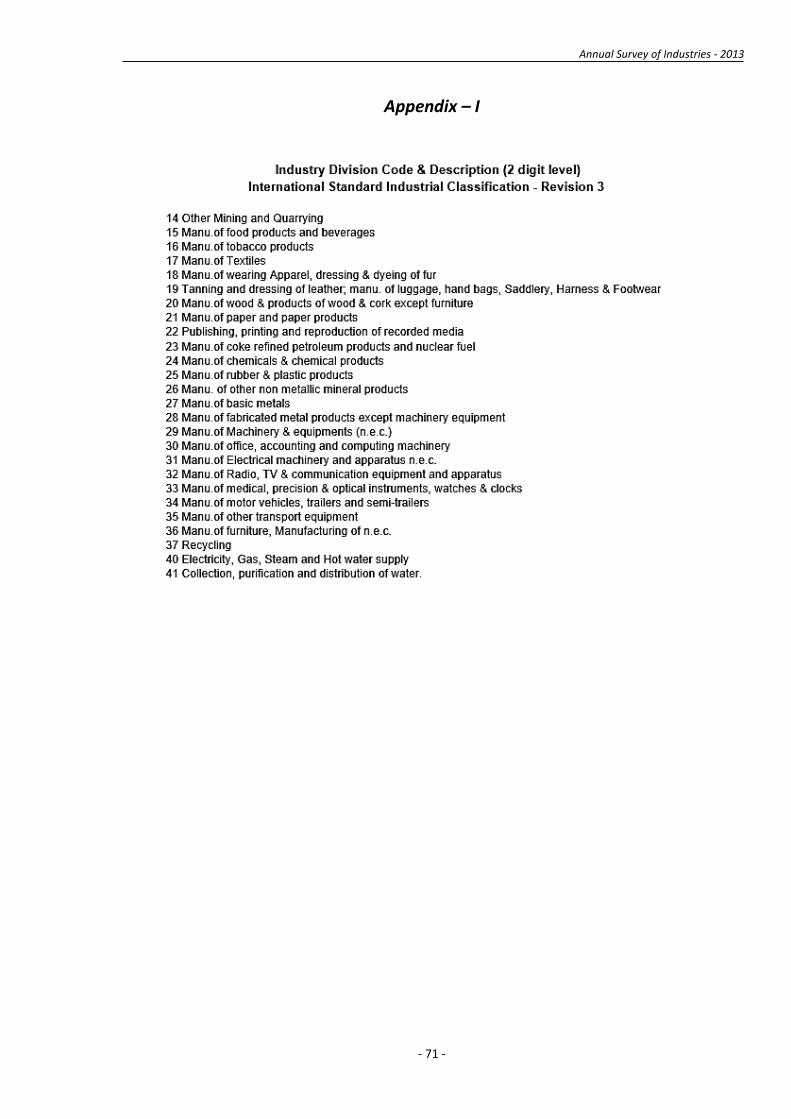
Appendix – I
Annual Survey of Industries - 2013
- 72 -
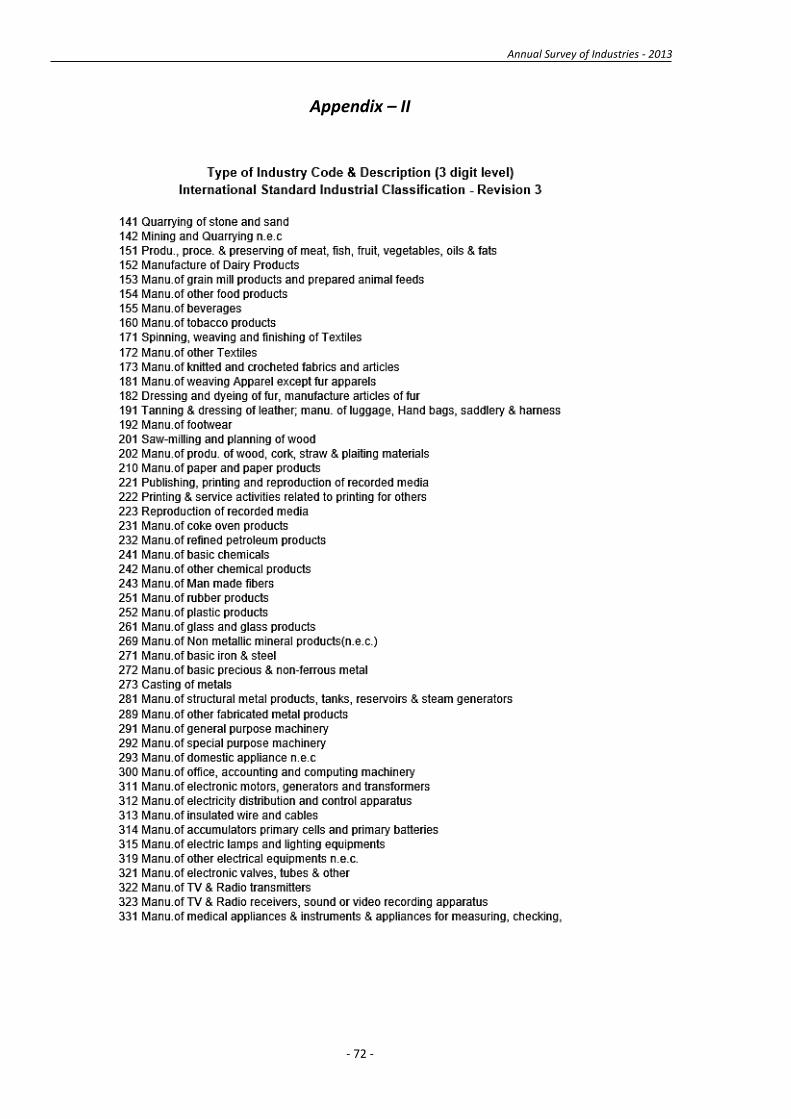
Appendix – II
Annual Survey of Industries - 2013
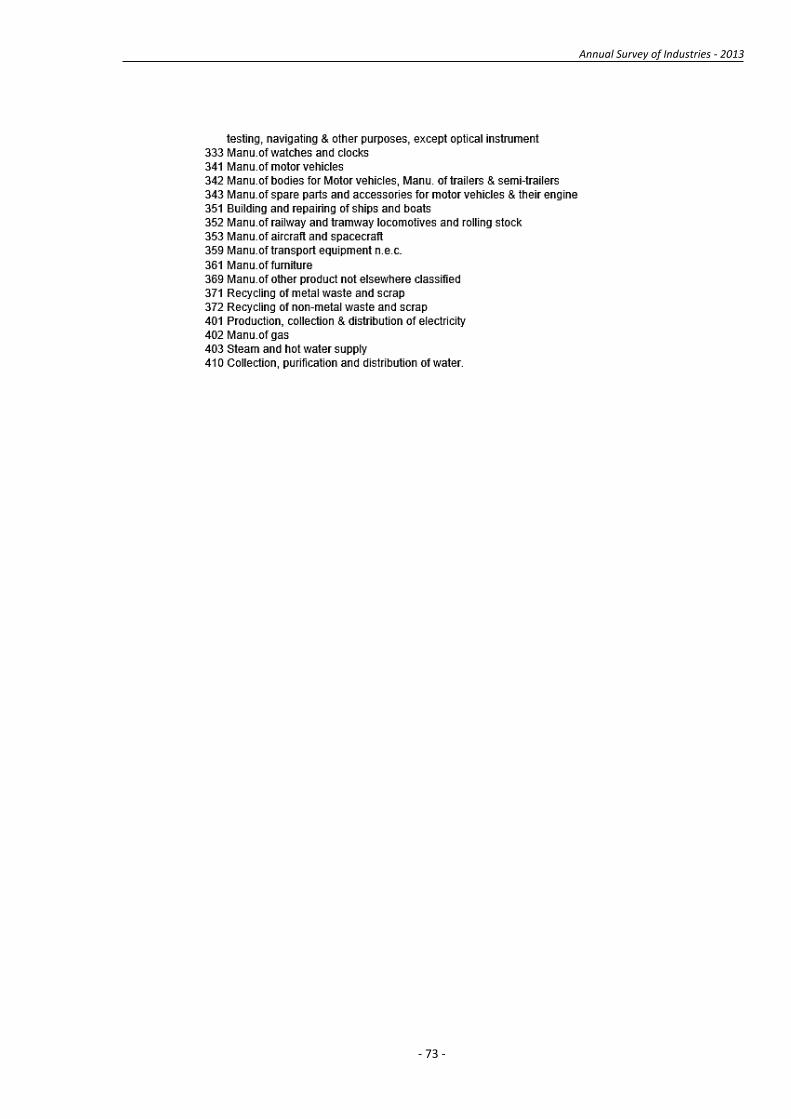
- 73 -

Annual Survey of Industries - 2013
- 74 -
Appendix – III
Annual Survey of Industries - 2013
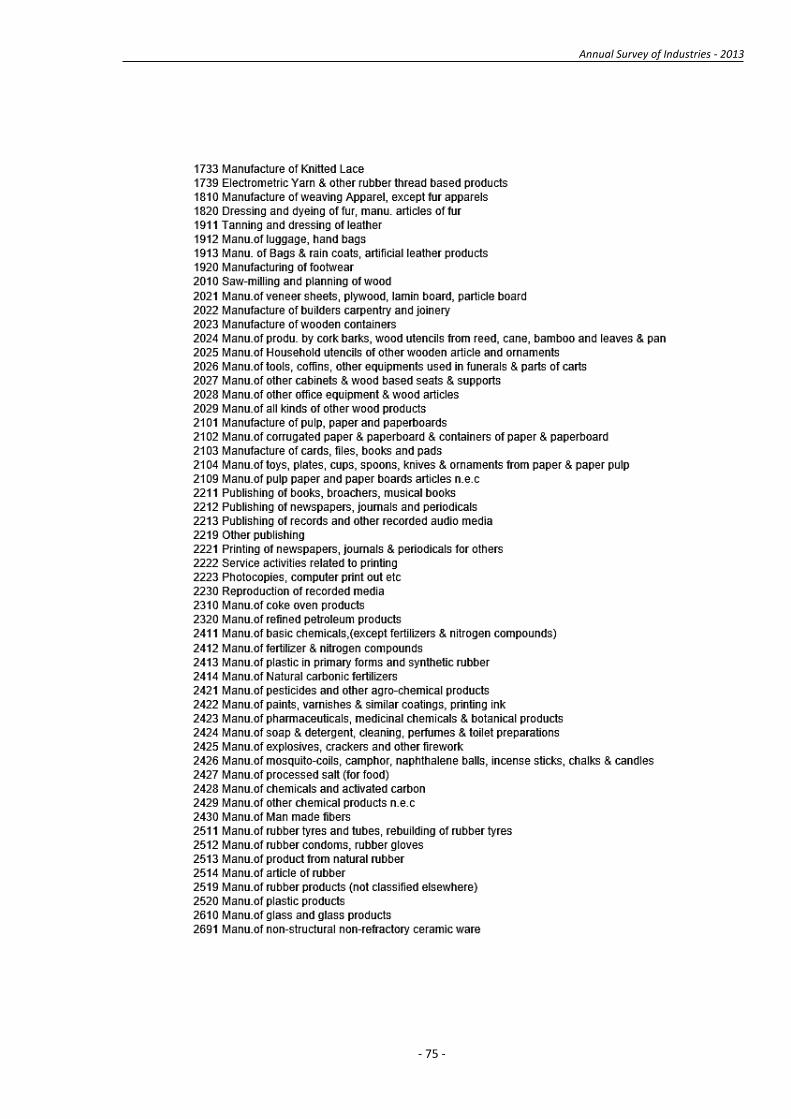
- 75 -

Annual Survey of Industries - 2013
- 76 -
Annual Survey of Industries - 2013
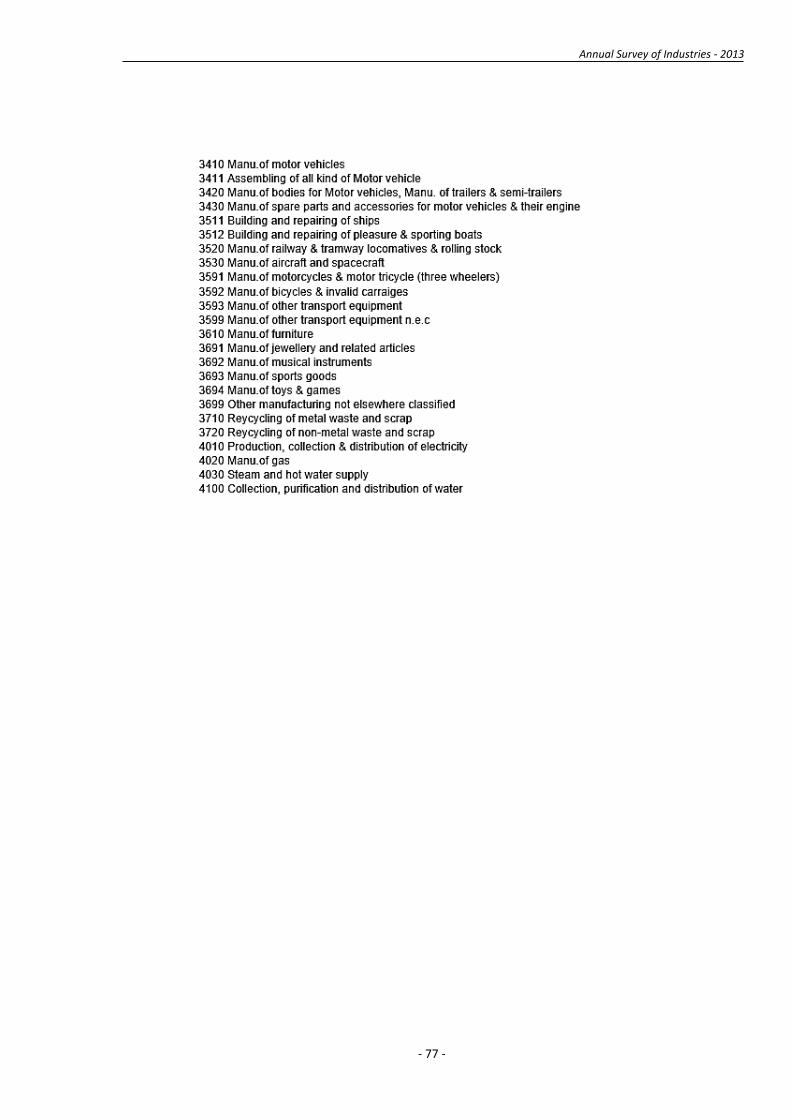
- 77 -

Annual Survey of Industries - 2013
- 78 -

Annual Survey of Industries - 2013
- 79 -
Printed by: Printing Division
Department of Census and Statistics