Department of Agriculture, Food and the Marine ...
15
Department of Agriculture, Food and the Marine Laboratories Quarterly Surveillance Report Quarter 2 of 2019
Transcript of Department of Agriculture, Food and the Marine ...
Department of Agriculture,
Food and the Marine
Laboratories Quarterly Surveillance Report
Quarter 2 of 2019
https://www.agriculture.gov.ie/animalhealthwelfare/laboratoryservices/regionalveterinarylaboratoryreports/
Introduction The veterinary laboratories operated by the Department of Agriculture, Food and Marine (DAFM)
provide data on the patterns and frequency of occurrence of non-regulated diseases in farmed
animal populations in Ireland. This disease surveillance role is fulfilled through routine diagnostic,
post-mortem and targeted surveillance activities. Data from these activities are published
collectively on a monthly, quarterly and annual basis. This quarterly report and other surveillance
reports can be accessed at: Regional Veterinary Laboratory Reports.
The surveillance role of the laboratories complements the broader remit of DAFM in surveillance and
control of diseases of animals. In addition to annual reports, periodical reports are published to
ensure the timely feedback of accurate data to the relevant industry stakeholders to inform
husbandry practices and disease control measures.
The quarterly surveillance reports are designed to provide a brief overview of disease trends in a
given quarter. Further, and more detailed, commentary on individual cases or individual outbreaks
can be accessed through monthly reports published in the Veterinary Ireland Journal and also
available at: Regional Veterinary Laboratory Reports.
This Quarter The data presented in this report refer to the second quarter of 2019 (April to June). The number of
submissions recorded in this period was lower compared to the corresponding period in each of the
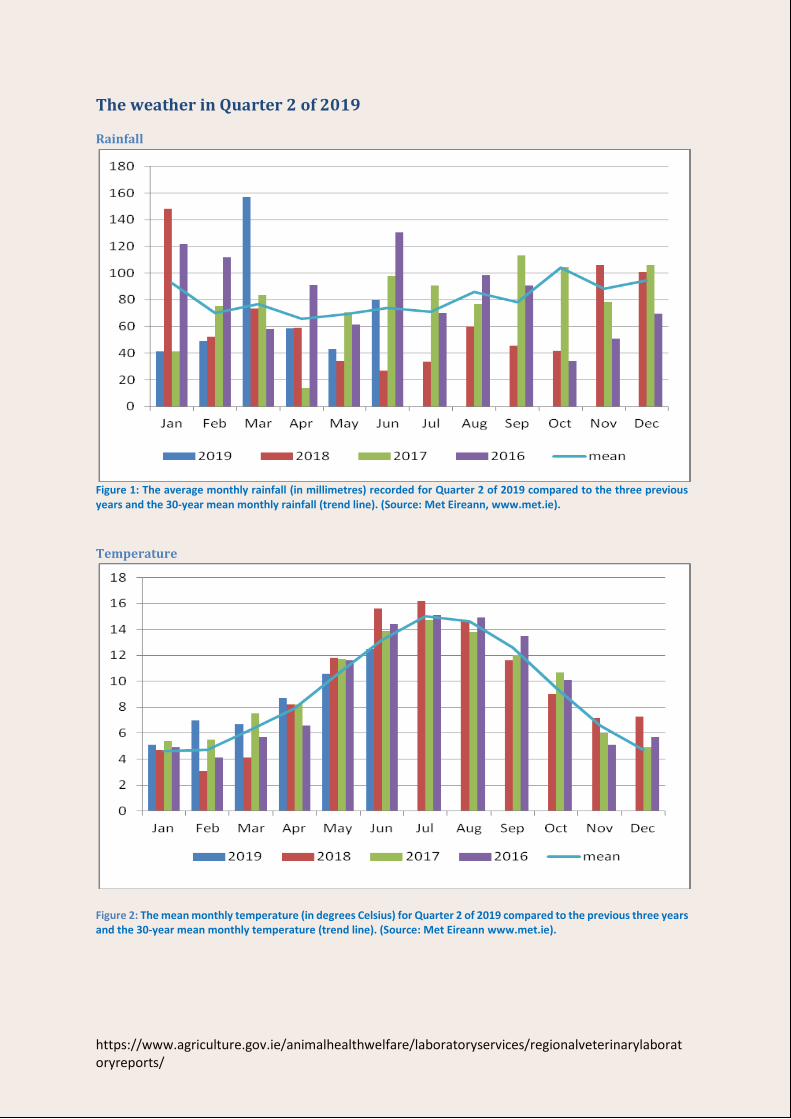
three previous years, with a marked decrease from Q2 2018 to Q2 of 2019. Met Éireann data show
that April and May of 2019 were warmer and drier than average. This would have allowed earlier
turnout of livestock, with a consequent reduction in disease incidence. Higher than usual mortality
in spring 2018, associated with a fodder shortage, may also be linked to the reduced number of
carcases submitted in Q2 of 2019. In both human and animal epidemiology, a period of increased
mortality (e.g. due to a heatwave or epidemic) is often succeeded by a period of reduced mortality.
The phenomenon has been explained by the idea that the old or those in poor health, who were
“likely to die in the short term anyway”, are most affected by the underlying event, with resulting
lower mortality after that event. This phenomenon is also known as a “forward shift in mortality” or
as “the harvesting effect”. A similar pattern of reduced laboratory submissions was seen in spring
2014 following the period of increased mortality during the spring 2013 fodder crisis.
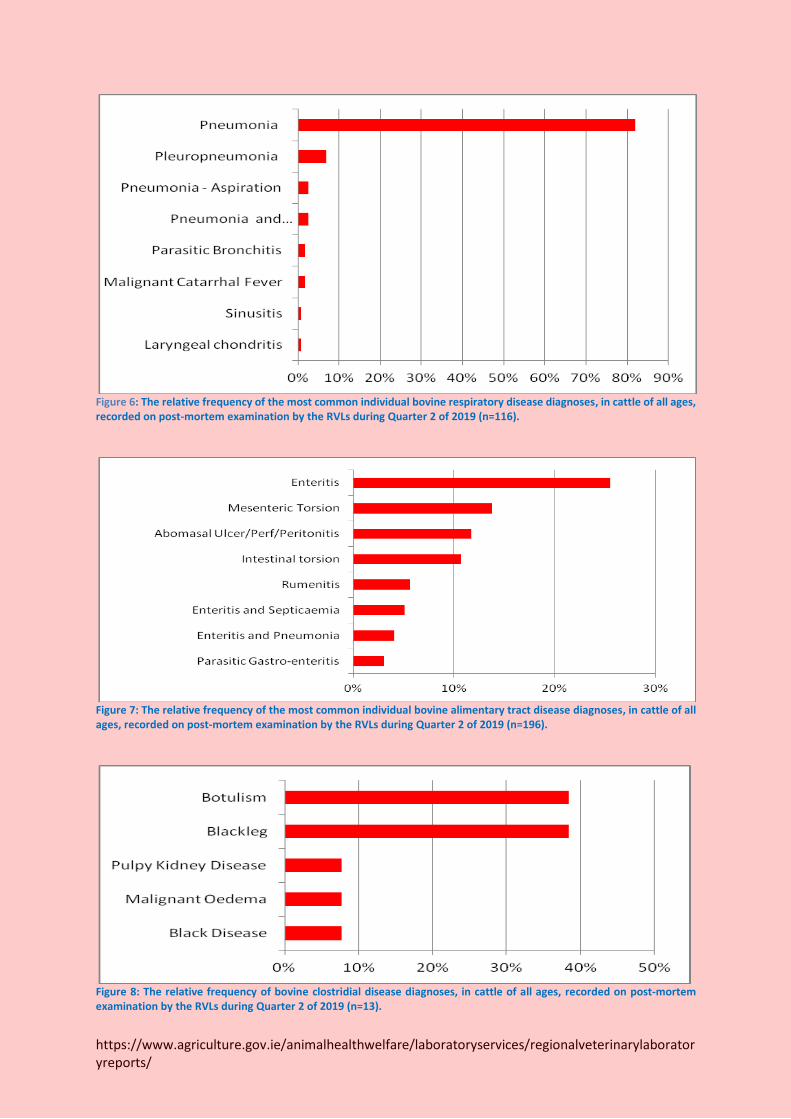
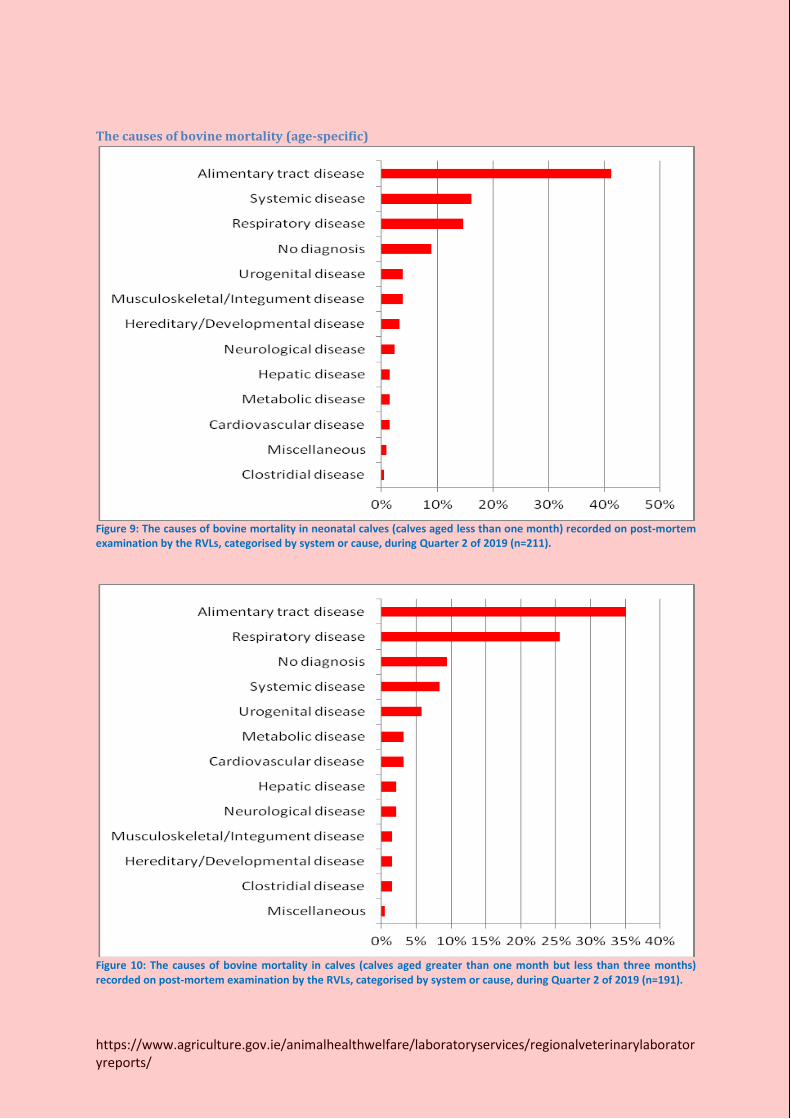
In cattle, the pattern of diagnoses for conditions affecting the alimentary tract is striking. Mesenteric
torsion was recorded in a higher proportion of cases of alimentary tract disease compared to
previous years. This was also true for rumenitis, a condition which often affects dairy calves. The Zinc
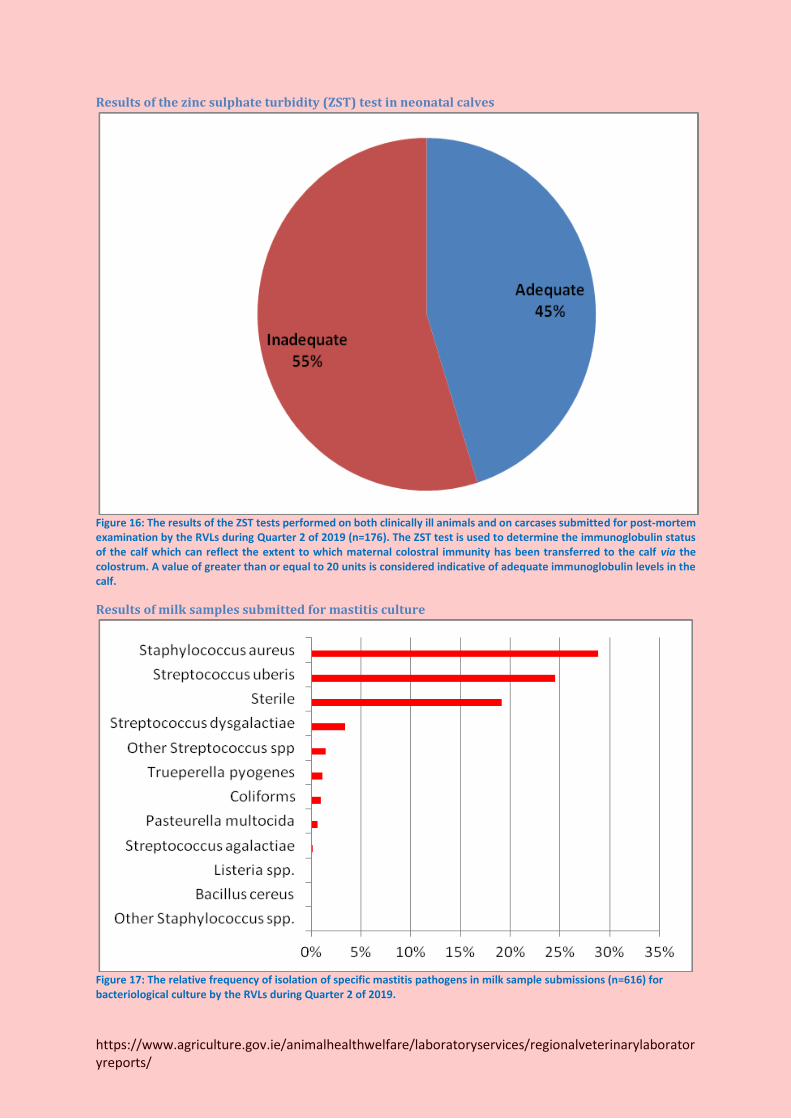
Sulphate Turbidity (ZST) test results suggested that only 45% of calves (submitted dead) had
adequate colostrum intake within the critical neonatal window for absorption. These results
underline the need for DAFM, private veterinary practitioners, Teagasc, AHI and others to continue
to raise awareness of the importance of proper colostrum management among cattle farmers. In
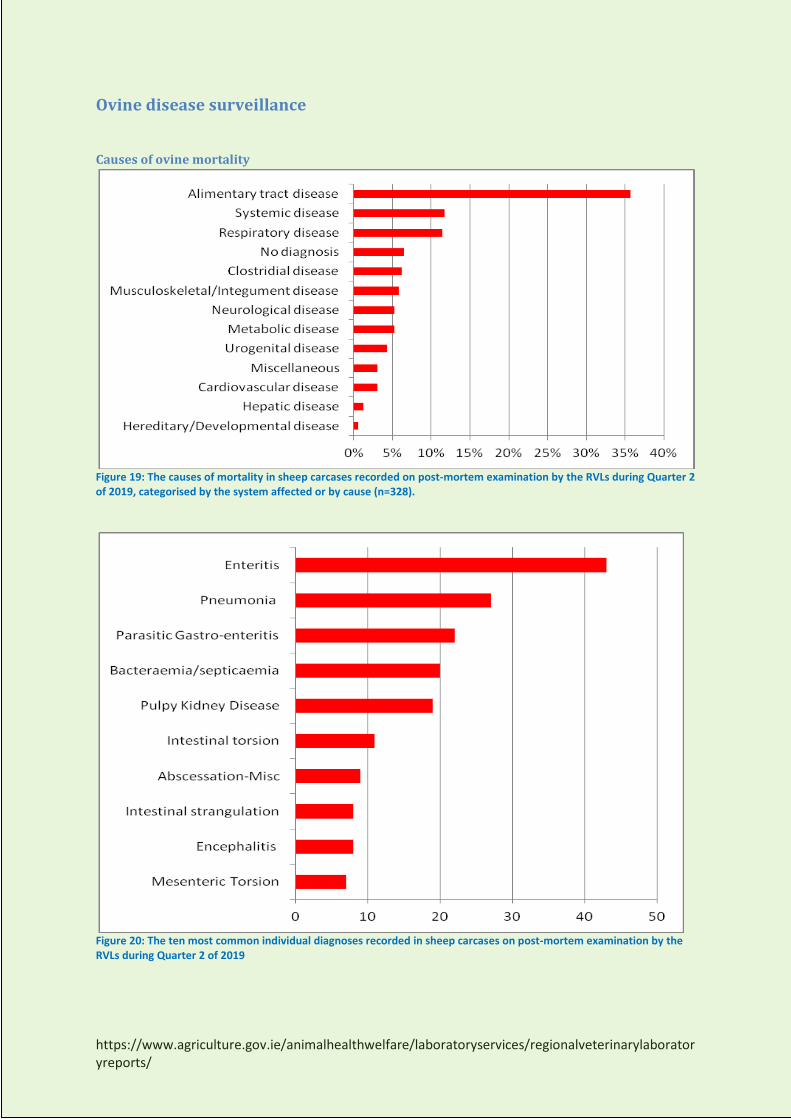
sheep, pulpy kidney disease was by far the most commonly recorded clostridial disease, being
responsible for the deaths of nineteen sheep examined in RVLs during the period. The ovine data
also show that Chlamydophila abortus was the most commonly recorded cause of abortions in sheep,
accounting for more than three times as many cases as the next most commonly recorded pathogen
(Toxoplasma gondii), and continuing the pattern observed in the first quarter of the year.
https://www.agriculture.gov.ie/animalhealthwelfare/laboratoryservices/regionalveterinarylaboratoryreports/
The weather in Quarter 2 of 2019
Rainfall
Figure 1: The average monthly rainfall (in millimetres) recorded for Quarter 2 of 2019 compared to the three previous years and the 30-year mean monthly rainfall (trend line). (Source: Met Eireann, www.met.ie).
Temperature
Figure 2: The mean monthly temperature (in degrees Celsius) for Quarter 2 of 2019 compared to the previous three years and the 30-year mean monthly temperature (trend line). (Source: Met Eireann www.met.ie).

https://www.agriculture.gov.ie/animalhealthwelfare/laboratoryservices/regionalveterinarylaboratoryreports/
Soil temperature
Figure 3: The mean monthly soil temperature (in degrees Celsius) for Quarter 2 of 2019 compared to the previous three years. (Source: Met Eireann www.met.ie).
Submission numbers to the RVLs in Quarter 2 of 2019 SPECIES Carcass Diagnostic Foetus Grand Total
Avian 111 135 246
Bovine 755 5644 109 6508
Cervine 16
16
Equine 8 44 2 54
Ovine 363 533 42 938
Porcine 104 22 2 128
Badger 73 3
76
Caprine 6 21
27
Exotic 6 10 1 17
Lagomorph 3 4
7
Porpoise 1
1
Dolphin 6
6
Grand Total 1452 6416 156 8024
Table 1: The submission numbers of carcases, diagnostic samples and foetuses to the RVLs during Quarter 2 of 2019. Note that figures refer to sample numbers – one carcase or foetus counts as one sample under the carcase or foetus headings, one blood sample or faecal sample counts as one sample under the diagnostic heading.

https://www.agriculture.gov.ie/animalhealthwelfare/laboratoryservices/regionalveterinarylaboratoryreports/
Bovine disease surveillance
The causes of bovine mortality (all ages)
Figure 4: The causes of bovine mortality recorded on post-mortem examination in cattle of all ages by the RVLs, categorised by system or cause, during Quarter 2 of 2019 (n=627).
Figure 5: The ten most common individual diagnosed causes of death in cattle of all ages, recorded on post-mortem examination by the RVLs during Quarter 2 of 2019 (n=627).
https://www.agriculture.gov.ie/animalhealthwelfare/laboratoryservices/regionalveterinarylaboratoryreports/
Figure 6: The relative frequency of the most common individual bovine respiratory disease diagnoses, in cattle of all ages, recorded on post-mortem examination by the RVLs during Quarter 2 of 2019 (n=116).
Figure 7: The relative frequency of the most common individual bovine alimentary tract disease diagnoses, in cattle of all ages, recorded on post-mortem examination by the RVLs during Quarter 2 of 2019 (n=196).
Figure 8: The relative frequency of bovine clostridial disease diagnoses, in cattle of all ages, recorded on post-mortem examination by the RVLs during Quarter 2 of 2019 (n=13).
https://www.agriculture.gov.ie/animalhealthwelfare/laboratoryservices/regionalveterinarylaboratoryreports/
The causes of bovine mortality (age-specific)
Figure 9: The causes of bovine mortality in neonatal calves (calves aged less than one month) recorded on post-mortem examination by the RVLs, categorised by system or cause, during Quarter 2 of 2019 (n=211).
Figure 10: The causes of bovine mortality in calves (calves aged greater than one month but less than three months) recorded on post-mortem examination by the RVLs, categorised by system or cause, during Quarter 2 of 2019 (n=191).
https://www.agriculture.gov.ie/animalhealthwelfare/laboratoryservices/regionalveterinarylaboratoryreports/
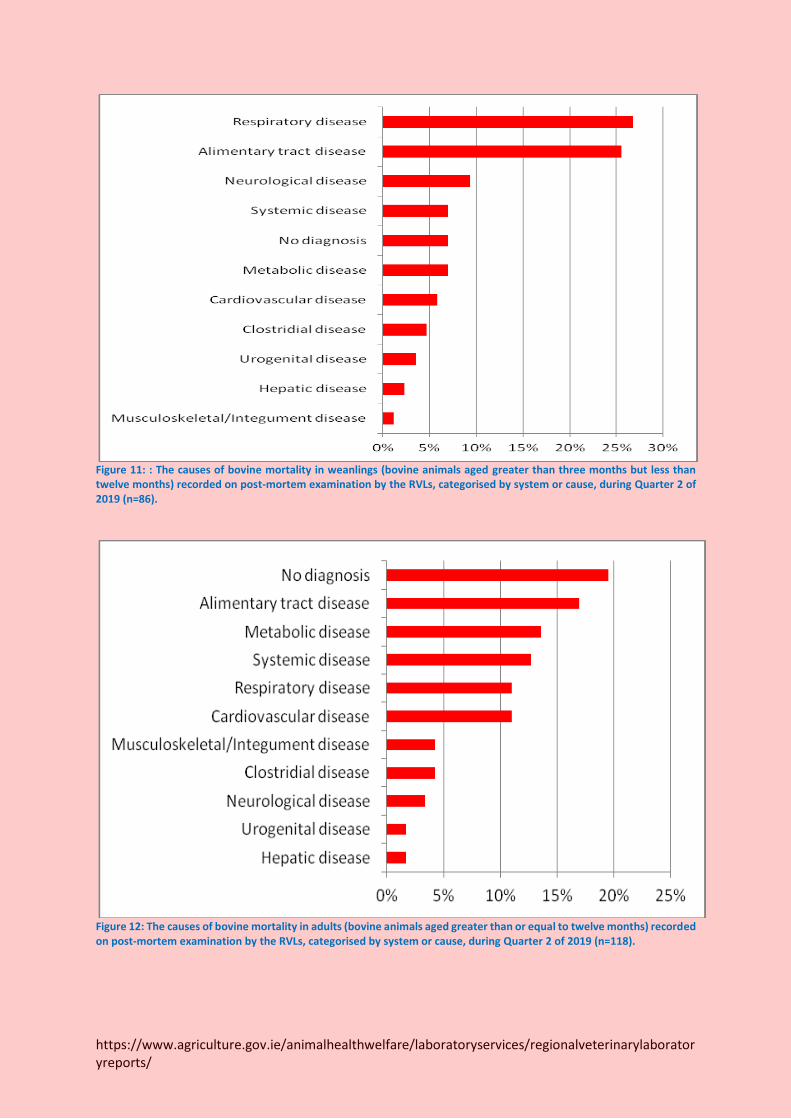
Figure 11: : The causes of bovine mortality in weanlings (bovine animals aged greater than three months but less than twelve months) recorded on post-mortem examination by the RVLs, categorised by system or cause, during Quarter 2 of 2019 (n=86).
Figure 12: The causes of bovine mortality in adults (bovine animals aged greater than or equal to twelve months) recorded on post-mortem examination by the RVLs, categorised by system or cause, during Quarter 2 of 2019 (n=118).

https://www.agriculture.gov.ie/animalhealthwelfare/laboratoryservices/regionalveterinarylaboratoryreports/
The relative frequency of pathogens identified in specific post-mortem examination diagnostic
categories
Figure 13: The relative frequency of specific respiratory pathogens identified in bovine carcases examined on post-mortem examination by the RVLs, in which a diagnosis of respiratory disease was made during Quarter 2 of 2019 (n=123).
Figure 14: The relative frequency of specific alimentary tract disease pathogens identified in bovine carcases examined on post-mortem examination by the RVLs, in which a diagnosis of ‘enteritis’ or ‘gastro-enteritis’ was made during Quarter 2 of 2019 (n=84).

https://www.agriculture.gov.ie/animalhealthwelfare/laboratoryservices/regionalveterinarylaboratoryreports/
Figure 15: The frequency of identification of Clostridium species on post-mortem examination of bovine animal carcases of all ages by the RVLs during Quarter 2 of 2019.
The frequency of detection of enteric pathogens in neonatal bovine enteritis cases
Enteric pathogen Negative Positive %Positive
E.coli K99 314 2 0.6%
Coronavirus 418 2 0.5%
Salmonella culture 414 5 1.2%
Cryptosporidium parvum 352 70 16.6%
Rotavirus 307 112 26.7%
Table 2: The relative frequency of detection of enteric pathogens in the faecal samples of neonatal calves (aged less than one month of age) harvested during Quarter 2 of 2019 from both clinically ill animals by veterinary practitioners in the field and from bovine carcases during post-mortem examination by the RVLs.
https://www.agriculture.gov.ie/animalhealthwelfare/laboratoryservices/regionalveterinarylaboratoryreports/
Results of the zinc sulphate turbidity (ZST) test in neonatal calves
Figure 16: The results of the ZST tests performed on both clinically ill animals and on carcases submitted for post-mortem examination by the RVLs during Quarter 2 of 2019 (n=176). The ZST test is used to determine the immunoglobulin status of the calf which can reflect the extent to which maternal colostral immunity has been transferred to the calf via the colostrum. A value of greater than or equal to 20 units is considered indicative of adequate immunoglobulin levels in the calf.
Results of milk samples submitted for mastitis culture
Figure 17: The relative frequency of isolation of specific mastitis pathogens in milk sample submissions (n=616) for bacteriological culture by the RVLs during Quarter 2 of 2019.
https://www.agriculture.gov.ie/animalhealthwelfare/laboratoryservices/regionalveterinarylaboratoryreports/
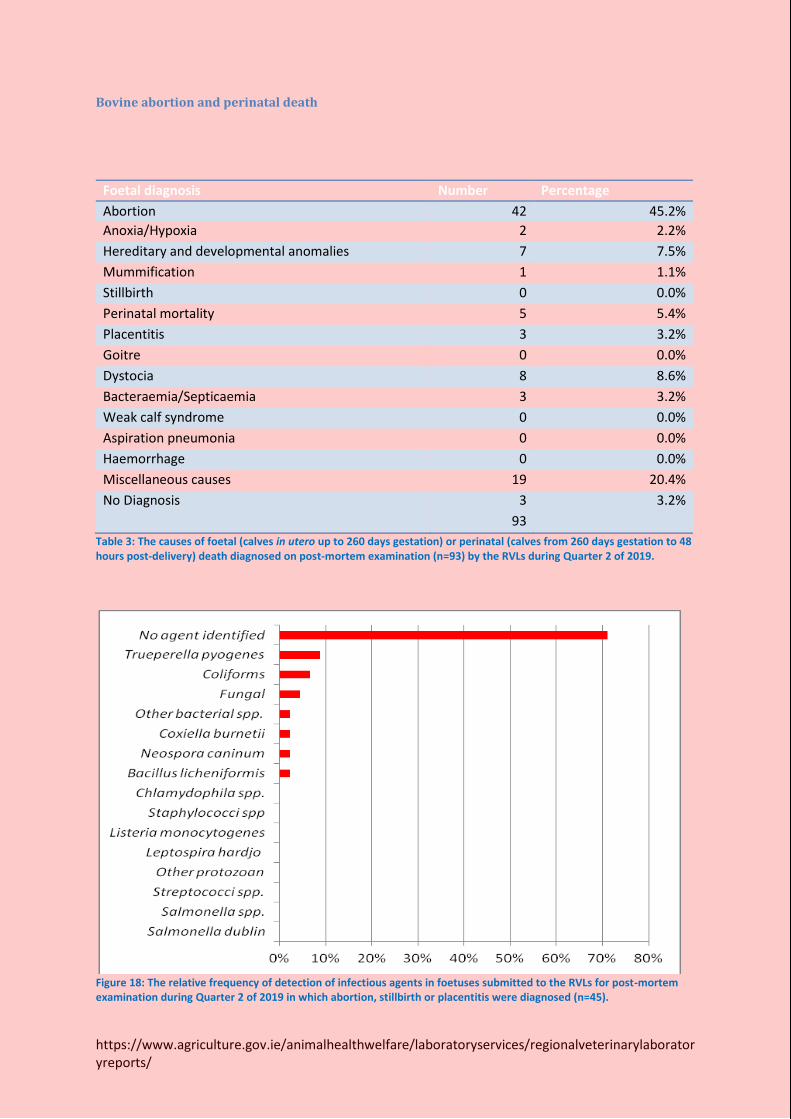
Bovine abortion and perinatal death
Foetal diagnosis Number Percentage
Abortion 42 45.2%
Anoxia/Hypoxia 2 2.2%
Hereditary and developmental anomalies 7 7.5%
Mummification 1 1.1%
Stillbirth 0 0.0%
Perinatal mortality 5 5.4%
Placentitis 3 3.2%
Goitre 0 0.0%
Dystocia 8 8.6%
Bacteraemia/Septicaemia 3 3.2%
Weak calf syndrome 0 0.0%
Aspiration pneumonia 0 0.0%
Haemorrhage 0 0.0%
Miscellaneous causes 19 20.4%
No Diagnosis 3 3.2%
93 Table 3: The causes of foetal (calves in utero up to 260 days gestation) or perinatal (calves from 260 days gestation to 48 hours post-delivery) death diagnosed on post-mortem examination (n=93) by the RVLs during Quarter 2 of 2019.
Figure 18: The relative frequency of detection of infectious agents in foetuses submitted to the RVLs for post-mortem examination during Quarter 2 of 2019 in which abortion, stillbirth or placentitis were diagnosed (n=45).
https://www.agriculture.gov.ie/animalhealthwelfare/laboratoryservices/regionalveterinarylaboratoryreports/
Ovine disease surveillance
Causes of ovine mortality
Figure 19: The causes of mortality in sheep carcases recorded on post-mortem examination by the RVLs during Quarter 2 of 2019, categorised by the system affected or by cause (n=328).
Figure 20: The ten most common individual diagnoses recorded in sheep carcases on post-mortem examination by the RVLs during Quarter 2 of 2019
https://www.agriculture.gov.ie/animalhealthwelfare/laboratoryservices/regionalveterinarylaboratoryreports/
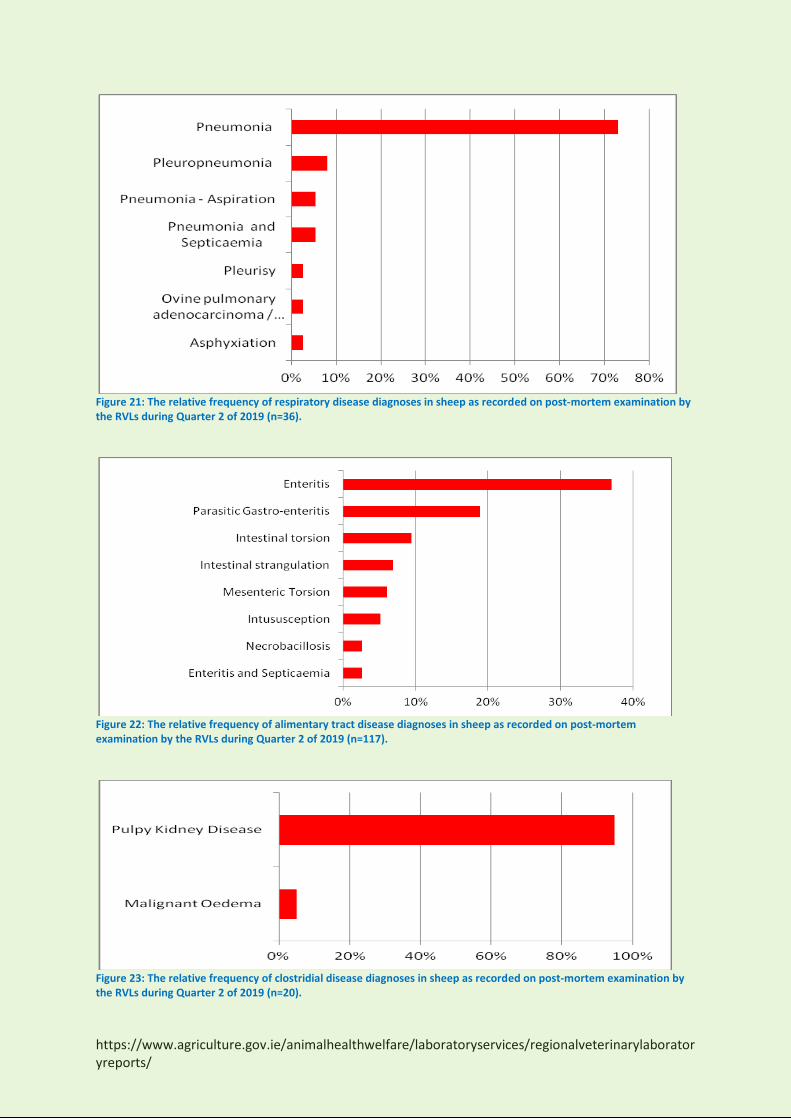
Figure 21: The relative frequency of respiratory disease diagnoses in sheep as recorded on post-mortem examination by the RVLs during Quarter 2 of 2019 (n=36).
Figure 22: The relative frequency of alimentary tract disease diagnoses in sheep as recorded on post-mortem examination by the RVLs during Quarter 2 of 2019 (n=117).
Figure 23: The relative frequency of clostridial disease diagnoses in sheep as recorded on post-mortem examination by the RVLs during Quarter 2 of 2019 (n=20).

https://www.agriculture.gov.ie/animalhealthwelfare/laboratoryservices/regionalveterinarylaboratoryreports/
Ovine abortion
Diagnosed cause of foetal death Number Percentage
Abortion 28 75.7%
Miscellaneous causes 6 16.2%
No Diagnosis 2 5.4%
Hereditary and developmental anomalies 1 2.7%
Bacteraemia/Septicaemia 0 0.0%
Dystocia 0 0.0%
Goitre 0 0.0%
Placentitis 0 0.0%
Perinatal mortality 0 0.0%
Mummification 0 0.0%
Anoxia/Hypoxia 0 0.0%
37
Table 4: The relative frequency of the diagnosed causes of death in ovine foetuses recorded on post-mortem examination by the RVLs during Quarter 2 of 2019 (n=37).
Figure 24: The relative frequency of abortion agents identified in ovine abortion diagnoses (n=28) recorded on post-mortem examination by the RVLs during Quarter 2 of 2019.